low cost spectrum measurements 14 - wireless
TRANSCRIPT

14LOW COST SPECTRUMMEASUREMENTS
Marco Zennaro andAndrés Arcia-Moret�e Abdus SalamInternational Centre for�eoretical [email protected][email protected]
Recently a lot of attention has been given to the use of TV WhiteSpaces for rural communications. Several monitoring campaigns havebeen carried out tomeasure spectrumoccupancyworldwide, concludingthat most of the spectrum is underutilized. In this chapter we presentthe design and implementation of two low cost systems to measurespectrum occupancy and to geo-tag the measurements to allow mobilemeasurement campaigns. �e �rst system is based on the RaspberryPi system on chip and on an a�ordable spectrum analyser. A�er cali-brating the system against a professional spectrum analyser, we usedit to measure the spectrum occupancy in urban and rural Venezuela,showing that there is plenty of vacant UHF TV spectrum. �e secondsystem is based on the popular Arduino board and has been used tomeasure spectrum occupancy in Malawi and Zambia. �en, we presenta couple of representative results obtained from both devices duringmeasurement campaigns. Finally, we conclude the chapter with someremarks about our experience on mobile spectrum measurements.
�� .� ��� ���� ��� ��������������������
Spectrum occupancy has become topical as the quest for e�cient accessto the spectrum continues. �is is evidenced by empirical measurementsof the radio environment in a bid to ascertain the spectrum usage bydi�erent wireless services.
Occupancy measurement campaigns e�orts where initially carriedout in USA using discone antennas, spectrum analyzers and a laptop�
�. D. Juyong, D.M. Akos and P.K.Enge, L and S bands spectrum sur-vey in the San Francisco bay area,Position Location and NavigationSymposium, ����, Pages ���-���
.
���
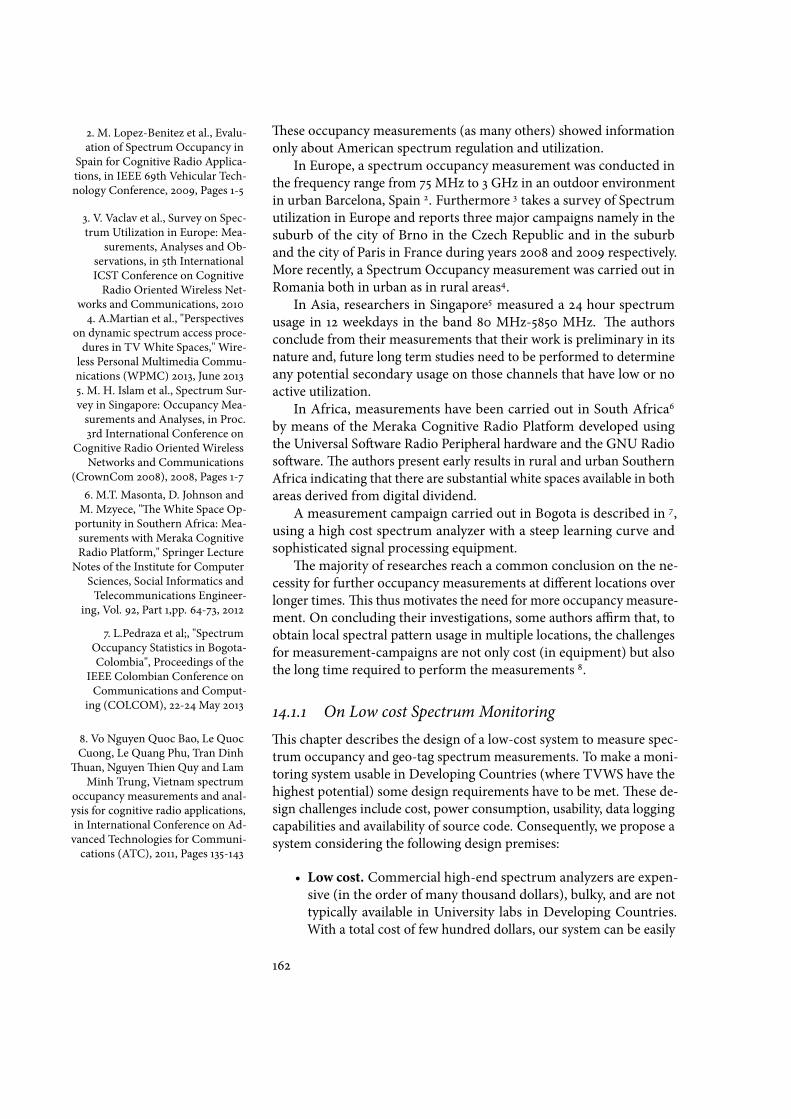
�ese occupancy measurements (as many others) showed informationonly about American spectrum regulation and utilization.
In Europe, a spectrum occupancy measurement was conducted inthe frequency range from ��MHz to � GHz in an outdoor environmentin urban Barcelona, Spain �
�. M. Lopez-Benitez et al., Evalu-ation of Spectrum Occupancy in
Spain for Cognitive Radio Applica-tions, in IEEE ��th Vehicular Tech-nology Conference, ����, Pages �-�
. Furthermore �
�. V. Vaclav et al., Survey on Spec-trum Utilization in Europe: Mea-
surements, Analyses and Ob-servations, in �th InternationalICST Conference on CognitiveRadio Oriented Wireless Net-
works and Communications, ����
takes a survey of Spectrumutilization in Europe and reports three major campaigns namely in thesuburb of the city of Brno in the Czech Republic and in the suburband the city of Paris in France during years ���� and ���� respectively.More recently, a Spectrum Occupancy measurement was carried out inRomania both in urban as in rural areas�
�. A.Martian et al., "Perspectiveson dynamic spectrum access proce-dures in TVWhite Spaces," Wire-less Personal Multimedia Commu-nications (WPMC) ����, June ����
.In Asia, researchers in Singapore�
�. M. H. Islam et al., Spectrum Sur-vey in Singapore: Occupancy Mea-surements and Analyses, in Proc.�rd International Conference on
Cognitive Radio Oriented WirelessNetworks and Communications
(CrownCom ����), ����, Pages �-�
measured a �� hour spectrumusage in �� weekdays in the band �� MHz-���� MHz. �e authorsconclude from their measurements that their work is preliminary in itsnature and, future long term studies need to be performed to determineany potential secondary usage on those channels that have low or noactive utilization.
In Africa, measurements have been carried out in South Africa�
�. M.T. Masonta, D. Johnson andM. Mzyece, "�e White Space Op-portunity in Southern Africa: Mea-surements with Meraka CognitiveRadio Platform," Springer LectureNotes of the Institute for Computer
Sciences, Social Informatics andTelecommunications Engineer-
ing, Vol. ��, Part �,pp. ��-��, ����
by means of the Meraka Cognitive Radio Platform developed usingthe Universal So�ware Radio Peripheral hardware and the GNU Radioso�ware. �e authors present early results in rural and urban SouthernAfrica indicating that there are substantial white spaces available in bothareas derived from digital dividend.
A measurement campaign carried out in Bogota is described in �
�. L.Pedraza et al;, "SpectrumOccupancy Statistics in Bogota-Colombia", Proceedings of the
IEEE Colombian Conference onCommunications and Comput-
ing (COLCOM), ��-��May ����
,using a high cost spectrum analyzer with a steep learning curve andsophisticated signal processing equipment.
�e majority of researches reach a common conclusion on the ne-cessity for further occupancy measurements at di�erent locations overlonger times. �is thus motivates the need for more occupancy measure-ment. On concluding their investigations, some authors a�rm that, toobtain local spectral pattern usage in multiple locations, the challengesfor measurement-campaigns are not only cost (in equipment) but alsothe long time required to perform the measurements �
�. Vo Nguyen Quoc Bao, Le QuocCuong, Le Quang Phu, Tran Dinh
�uan, Nguyen�ien Quy and LamMinh Trung, Vietnam spectrum
occupancy measurements and anal-ysis for cognitive radio applications,in International Conference on Ad-vanced Technologies for Communi-cations (ATC), ����, Pages ���-���
.
��.�.� On Low cost Spectrum Monitoring�is chapter describes the design of a low-cost system to measure spec-trum occupancy and geo-tag spectrum measurements. To make a moni-toring system usable in Developing Countries (where TVWS have thehighest potential) some design requirements have to be met. �ese de-sign challenges include cost, power consumption, usability, data loggingcapabilities and availability of source code. Consequently, we propose asystem considering the following design premises:
• Low cost. Commercial high-end spectrum analyzers are expen-sive (in the order of many thousand dollars), bulky, and are nottypically available in University labs in Developing Countries.With a total cost of few hundred dollars, our system can be easily
���
acquired by Universities and civil society organizations worldwide.Similar systems cost one or two orders of magnitude more. Weused the following low-cost parts to build up our systems:
– A Raspberry Pi� �. http://www.raspberrypi.org/single-board computer. �is credit-card-sized device was developed in the UK to promote the teach-ing of basic computer science in schools. It has a Broad-com BCM���� system on a chip (SoC), which includes anARM����JZF-S ���MHz processor, VideoCore IVGPU and���megabytes of RAM. It does not include a built-in harddisk or solid-state drive, using instead an SD card for bootingand long-term storage. �e B model with two USB socketsand an Ethernet connection sells for ���. �e A model, withonly one USB socket, sells for ���. �e Raspberry Pi runsa Debian ARM distribution so it can use any Linux basedso�ware.
– A hand-held spectrum analyzer. Recently an a�ordable andeasy to use device to make spectrum measurements has be-come available, the RF Explorer�� ��. http://www.rfexplorer.com/. �ere are �ve RF Explorermodels, covering themost-used bands below �.�GHz. In oursystem we use the Sub � GHz model, employing the SiliconLabs Si���� receiver chip (covering ���MHz to ���MHz).�e price of this model is ��� � (as of November ����).
– An embeddable computer. �e Arduino�� ��. http://arduino.ccboard is a low-cost micro controller platform, also considered as a smallcomputer, capable of coordinating di�erent sensors and actu-ators. �e capabilities of this small computers are intendedto solve lightweight problems while reducing the operationalcosts and space. �e price of the model used is about �� �.
• Low power consumption. Based on low power devices, the sys-temmust run for an entire working day with a small battery. In ourcase, both the Raspberry Pi and the Arduino board, power is pro-vided via a micro USB connector, compatible with mobile phonechargers or any other � V supply (such as batteries, solar panels,etc). �e Raspberry Pi Bmodel requires about �Wof power, whilethe Amodel requires �W�� ��. Richard Heeks and Andrew
Robinson. ����. Ultra-low-costcomputing and developing coun-tries. Commun. ACM ��, � (August����), ��-��
. For typical Arduino board, the energyrequirements goes around the hundreds of milliwatts.
• Ease of use. Once switched on, the system has to run automati-cally without any human intervention. Non technical personnelcan carry the system around and collect measurements. On theother hand, technical personnel can easily select the frequenciesof interest with only a basic knowledge.
• Data logging. Weeks of measurements can be stored in the de-vice’s SD card with no need to download them on a PC. Collected
���

measurements are stored in comma separated values (CSV) �lesfor later processing.
• Calibration.
To assess our set of measurements, we compared both systemsagainst a professional Agilent N����C recently calibrated spec-trum analyser. A calibrated Agilent ����C signal generator pro-vided signals at �� di�erent power levels, i.e., from -�� dBm to -��dBm, for the set of measured frequencies. From the calibrationprocesses we can say that there are many characteristics to complywith a low-cost solution and it is quite challenging to balance thetrade-o�s. �e calibration measurement show a systematic errorlower than �.� dB over the range of interest. �e measurementsunderestimate the true value of the signal, and the error is greaterat higher frequencies, which in this case correspond to the cellularservice.
• Open Source. �e components of the system should be based onthe open source concept. �e system should be easily modi�edthanks to the availability of the source code.
Furthermore, the proposed systems, WhispPi and ASCII-��, areparticularly suited to perform measurements while moving, either onfoot or in a vehicle, thus facilitating the gathering of spectrum occupancyin relation with geographical position.
�� .� ��� ������� ������WhispPi ����. Arcia-Moret, A., Pietrosemoli, E.,
and Zennaro, M. Whisppi: Whitespace monitoring with raspberrypi. In IEEE Global InformationInfrastructure and Networking
Symposium (GIIS ����) (Oc-tober ��-��. Trento, Italy ����).
was designed on the principle that data from the spectrumanalyzer have to be stored in a device with a battery backup for mobilemeasurements. In addition to spectrum, the position and the time ofmeasurements are saved on the same device. Moreover, the RaspberryPi allows �ne tuning of the di�erent components of the system throughregular UNIX scripting.
�e system is made out of four components:
�. A Raspberry Pi, used to control the data acquisition and geo-tagging of the data.
�. An RF Explorer, that has already proved its usefulness for spec-trum e�ciency advocacy in a previous measurement campaign����. M.Zennaro et al, "On the Rele-
vance of Using A�ordable Tools forWhite Spaces Identi�cation", Pro-ceedings of the IEEE CNBuB����,
Barcelona-Spain, �-��October ����
.
�. A USB GPS, to collect the exact position and time of the measure-ment.
�. A small battery with micro USB output to power the RaspberryPi which then powers the spectrum analyzer.
���
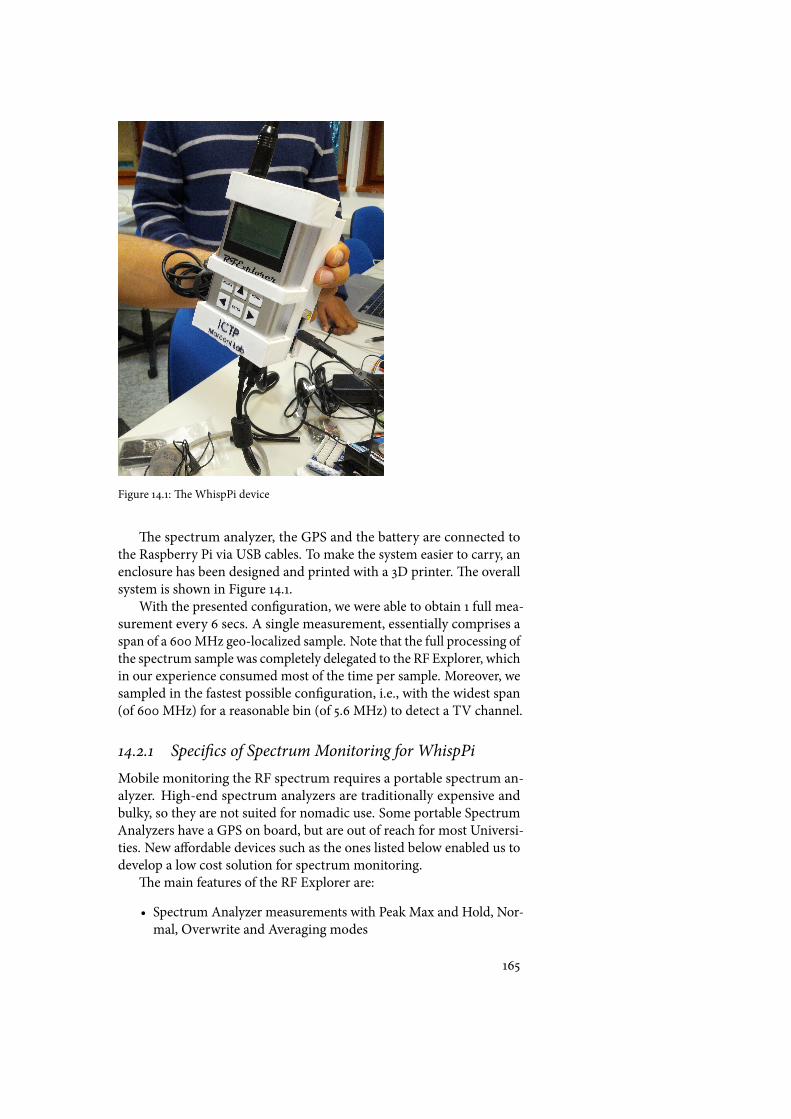
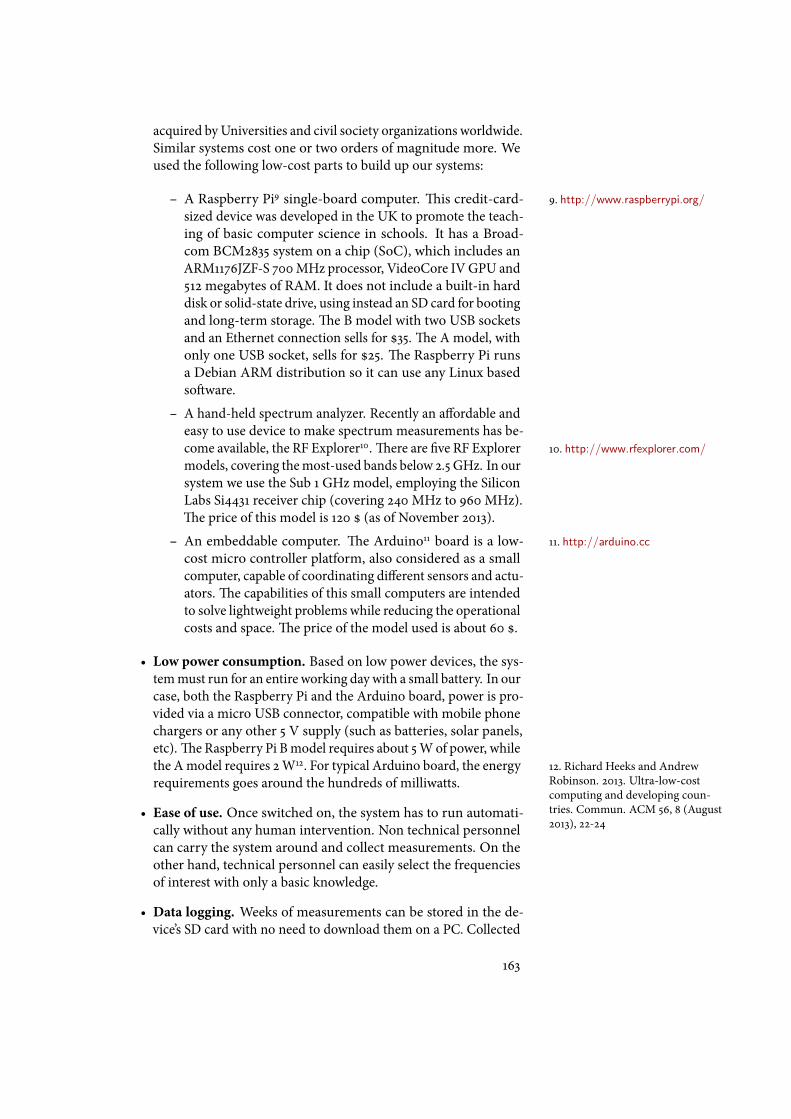
Figure ��.�: �e WhispPi device
�e spectrum analyzer, the GPS and the battery are connected tothe Raspberry Pi via USB cables. To make the system easier to carry, anenclosure has been designed and printed with a �D printer. �e overallsystem is shown in Figure ��.�.
With the presented con�guration, we were able to obtain � full mea-surement every � secs. A single measurement, essentially comprises aspan of a ���MHz geo-localized sample. Note that the full processing ofthe spectrum sample was completely delegated to the RF Explorer, whichin our experience consumed most of the time per sample. Moreover, wesampled in the fastest possible con�guration, i.e., with the widest span(of ���MHz) for a reasonable bin (of �.�MHz) to detect a TV channel.
��.�.� Speci�cs of Spectrum Monitoring for WhispPiMobile monitoring the RF spectrum requires a portable spectrum an-alyzer. High-end spectrum analyzers are traditionally expensive andbulky, so they are not suited for nomadic use. Some portable SpectrumAnalyzers have a GPS on board, but are out of reach for most Universi-ties. New a�ordable devices such as the ones listed below enabled us todevelop a low cost solution for spectrum monitoring.
�e main features of the RF Explorer are:
• Spectrum Analyzer measurements with Peak Max and Hold, Nor-mal, Overwrite and Averaging modes
���

Figure ��.�: Calibration of the RF Explorer.
• High capacity Lipo battery for ��hours of continuous run, recharge-able through USB port
• SMA antenna connector (�� ohms)
• Dynamic range: -��� dBm to � dBm
• Absolute Max input power: +� dBm
• Can be �tted with internal ExpansionModules for additional bandand functionality (signal generator)
It has an LCD display (���x�� pixels) that o�ers great visibility out-doors. While it is fully functional as an independent unit, optionally canbe connected to a PC via USB for additional features.
��.�.� Calibration of WhispPiA calibrated signal generator provided signals at �� di�erent power levels,i.e., from -�� dBm to -�� dBm in � dB steps, for each of the ���measuredfrequencies. From the results displayed in Fig. ��.�, we can infer thatin the frequency range from ��� MHz to ��� MHz, the RF Explorerdisplayed value is consistently slightly less than the power applied to itsinput, with a maximum discrepancy of �.� dB. In the UHF TV spectrumrange that extends up to ���MHz the under estimation is bounded to�.� dB.
�� .� ��� �����-�� ������ASCII-��, shown in Figure ��.�, is a low-cost device to identify and geo-tag RF spectrum in the sub �-GHz band. �e name ASCII-�� is derived
���

Figure ��.�: Low-cost ASCII-�� device
from the ASCII character set, where the number �� corresponds to awhite space. Selling for � ���, ASCII-�� is a�ordable for universities andcivil society organizations in Developing Countries.
�e main component of the design is the SI���� low cost widebandreceiver IC. It covers a frequency range from ��� to ��� MHz whichadequately spans the spectrum of TVWS. Although this IC has thecircuitry to decode multiple wireless signalling protocols, in this appli-cation the main function used is the energy detection. A�er tuning to acertain frequency, one function of the IC is to sense the amount of en-ergy, recording the value in dBm on the RSSI (Received Signal StrengthIndicator) register. �is is the same function as a standard spectrumanalyzer, however at a vastly di�erent cost scale.
�e essential part of the design is to use a micro-controller to tunethe IC to each frequency in pre-determined bandwidth intervals andmeasure the amount of energy at each frequency. By doing this quicklyenough, it’s possible to build up a plot of the occupied spectrum withinthe ��� to ���MHz frequency range. �is implements the spectrumanalyzer functionality of the device.
Besides the spectrum analyzer functions, there are other require-ments speci�c to white space identi�cation. Two of those are GPS loca-tion and local storage. By adding a GPS to the device, it is possible totag the occupied spectrum for a speci�c location. Bulk local storage, inthe form of inexpensive micro SD cards, allows vast amounts of datato be stored for later processing and visualization. �is combinationallows the geographic variance of spectrum occupation to be measured,recorded, and visualized and automates the task of doing wide area sitesurveys for white space identi�cation.
Finally, themanufacturer �� ��. http://www.freaklabs.orgadded small details on to the design in theformof battery and powermanagement and a ruggedized enclosure.�isimproves the portability of the device and allows it to be taken around
���
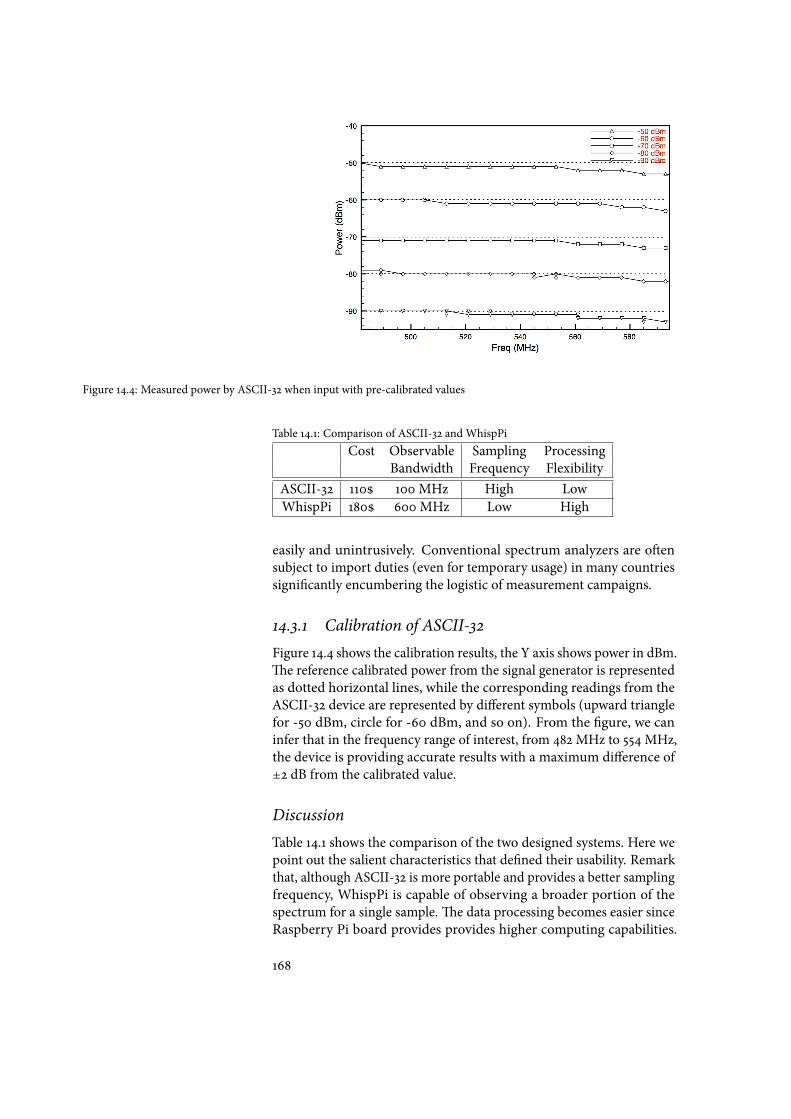
Figure ��.�: Measured power by ASCII-�� when input with pre-calibrated values
Table ��.�: Comparison of ASCII-�� and WhispPiCost Observable Sampling Processing
Bandwidth Frequency FlexibilityASCII-�� ���� ���MHz High LowWhispPi ���� ���MHz Low High
easily and unintrusively. Conventional spectrum analyzers are o�ensubject to import duties (even for temporary usage) in many countriessigni�cantly encumbering the logistic of measurement campaigns.
��.�.� Calibration of ASCII-��Figure ��.� shows the calibration results, the Y axis shows power in dBm.�e reference calibrated power from the signal generator is representedas dotted horizontal lines, while the corresponding readings from theASCII-�� device are represented by di�erent symbols (upward trianglefor -�� dBm, circle for -�� dBm, and so on). From the �gure, we caninfer that in the frequency range of interest, from ���MHz to ���MHz,the device is providing accurate results with a maximum di�erence of±� dB from the calibrated value.
DiscussionTable ��.� shows the comparison of the two designed systems. Here wepoint out the salient characteristics that de�ned their usability. Remarkthat, although ASCII-�� is more portable and provides a better samplingfrequency, WhispPi is capable of observing a broader portion of thespectrum for a single sample. �e data processing becomes easier sinceRaspberry Pi board provides provides higher computing capabilities.
���
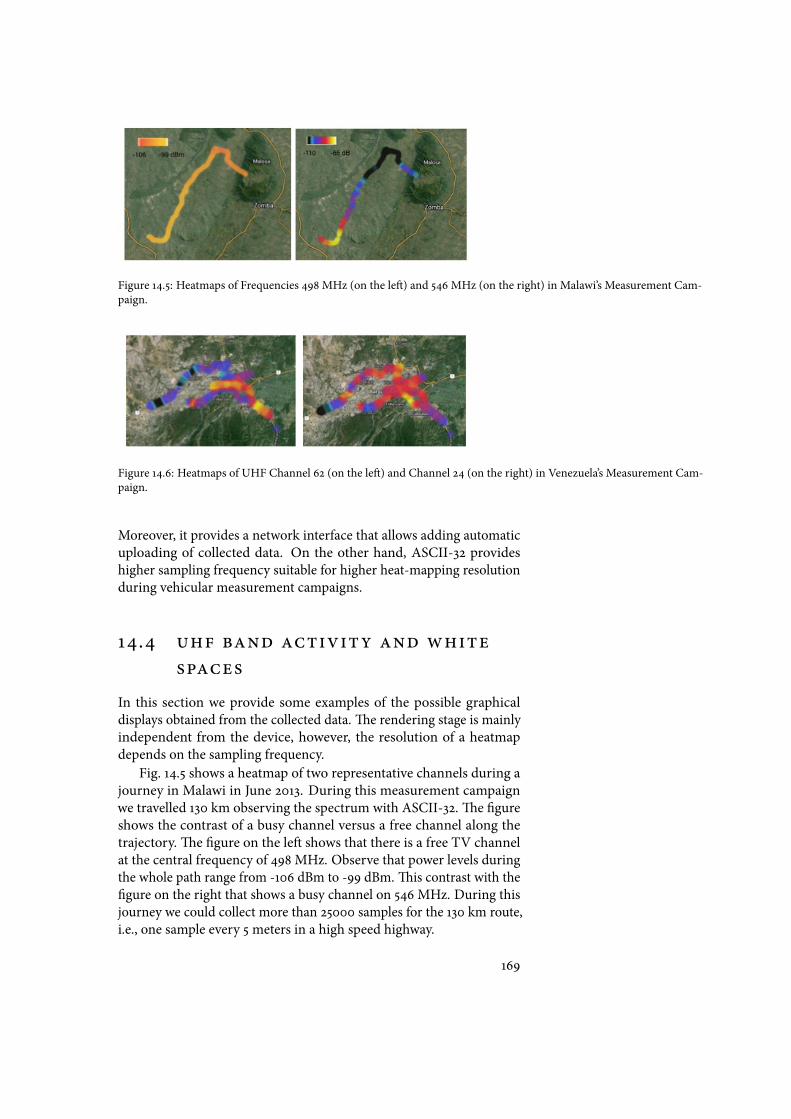
Figure ��.�: Heatmaps of Frequencies ���MHz (on the le�) and ���MHz (on the right) in Malawi’s Measurement Cam-paign.
Figure ��.�: Heatmaps of UHF Channel �� (on the le�) and Channel �� (on the right) in Venezuela’s Measurement Cam-paign.
Moreover, it provides a network interface that allows adding automaticuploading of collected data. On the other hand, ASCII-�� provideshigher sampling frequency suitable for higher heat-mapping resolutionduring vehicular measurement campaigns.
�� .� ��� ���� �������� ��� �����������
In this section we provide some examples of the possible graphicaldisplays obtained from the collected data. �e rendering stage is mainlyindependent from the device, however, the resolution of a heatmapdepends on the sampling frequency.
Fig. ��.� shows a heatmap of two representative channels during ajourney in Malawi in June ����. During this measurement campaignwe travelled ��� km observing the spectrum with ASCII-��. �e �gureshows the contrast of a busy channel versus a free channel along thetrajectory. �e �gure on the le� shows that there is a free TV channelat the central frequency of ���MHz. Observe that power levels duringthe whole path range from -��� dBm to -�� dBm. �is contrast with the�gure on the right that shows a busy channel on ���MHz. During thisjourney we could collect more than ����� samples for the ��� km route,i.e., one sample every �meters in a high speed highway.
���

Site Leg Length (km) White Spaces (�)Mérida city �� ��
Ejido �� ��Lagunillas �� ��El Vigia �� ��
Santa Cruz de Mora � ��Mucuchies �� ��Barinitas �� ��Barinas �� ��Guanare �� ��Acarigua �� ��
Barquisimeto �� ��
Table ��.�: Summary of White Spaces in Venezuela Western Region as of June ����.
Fig. ��.� shows part of the result of a measurement campaign car-ried out in Venezuela in June ���� recorded with WhispPi. �is �gureshows a heatmap for two types of busy channels. �e �gure on thele� shows spectrum activity corresponding to channel �� (���MHz to���MHz), on one of the biggest cities of Venezuela, Barquisimeto, ofabout �.���.��� inhabitants. �e �gure on the right shows the activityin Channel �� in urban and suburban areas of Barquisimeto.
In Table ��.� we summarize the white spaces �ndings during themeasurement campaign carried out in western Venezuela. We observedthat in urban and suburban areas the amount of white spaces (expressedas number of available channels) goes from ��� to ��� and in suburbanand rural areas the amount of white spaces goes from ��� to ���. Itis worth noting that this quantity of White Spaces corresponds to aregion in which the TV service is still analogue, and so we can expectan increase of spectrum availability a�er the transition to digital TVbroadcasting.
�� .� ������� �������In this chapter we have presented the construction and use of a�ordabletools and techniques to assess the amount of white spaces in developingregions. �e designed systems are easy to set up and well suited to longterm mobile spectrum measurements. With these tools we were able toaccount for white spaces on the UHF TV band.
�ere is a trade o� to consider when performing measurementswith low cost equipments, namely the sampling frequency versus theobservable bandwidth. So far, we have noticed that higher samplingfrequency implies less observable bandwidth. Moreover, by exploringdi�erent trade-o�s of these parameters, one can obtain valuable infor-mation about not only current activity in the channel but also what-ifscenarios for future deployments.
���