low-cost ultrasonic probe to assess wood defects and parameters · 2013-04-30 · low-cost...
TRANSCRIPT

Low-cost Ultrasonic Probe to AssessWood Defects and Parameters
P. Mestre, Member, IAENG, A. Calcada, N. Carvalho, C. Serodio, Member, IAENG,P. Couto, J. Matias, Member, IAENG, P. Melo-Pinto, J. Morais
Abstract—Wood is a natural material that due to its prop-erties has been used for years in many applications such asconstruction and furniture industries. Being a natural materialit is prone to defects which must be detected, preferably duringthe early stage of product production. Testing of wood pieces,to detect defects or to determine some of its properties, canbe made using two types of techniques: destructive and non-destructive. For obvious reasons Non-Destructive Testing (NDT)is more desirable because pieces subject to testing do not sufferany change of its structure. One of the techniques that has beenused in such tests is based on ultrasonic waves. In this paperit is presented a low cost ultrasonic probe that can be used todetect some defects on wood pieces. It is based on an FPGAwhich allows the development of a system with the performanceof hardware based systems and flexibility of software basedsystems. The prototype was then tested successfully to detectsome defects and to determine the dynamic module of elasticity(Ed) of wood samples. The obtained Ed values were comparedwith values obtained using mechanical testing.
Index Terms—Wood, Ultrasounds, Modulus of Elasticity,FPGA
I. INTRODUCTION
Wood is a material with excellent qualities for use asbuilding material, which has been used for many years, forexample, in the construction and furniture industries, due toits competitive price and its ease of handling[1].
Due to the fact that wood has its origin in living organisms,trees, it has some peculiar features on its structure, e.g.,nodes, which can induce some changes on wood properties.
Manuscript received March 05, 2013.P. Mestre is with CITAB/UTAD - Centre for the Research and Technology
of Agro-Environment and Biological Sciences, Vila Real, Portugal, andAlgoritmi Research Centre, Guimaraes, Portugal, email: [email protected]
A. Calcada is with UTAD - University of Tras-os-Montes and Alto Douro,Vila Real, Portugal, email: ademar [email protected]
N. Carvalho is with UTAD University of Tras-os-Montes and Alto Douro,Vila Real, Portugal, email: [email protected]
C. Serodio is with CITAB/UTAD - Centre for the Research andTechnology of Agro-Environment and Biological Sciences, Vila Real,Portugal, and Algoritmi Research Centre, Guimaraes, Portugal, email:[email protected]
J. Matias is with CM-UTAD - Centre for the Mathematics, Uni-versity of Tras-os-Montes and Alto Douro, Vila Real, Portugal,email:j [email protected]
P. Couto is with CITAB/UTAD - Centre for the Research and Technologyof Agro-Environment and Biological Sciences, Vila Real, Portugal, andAlgoritmi Research Centre, Guimaraes, Portugal, email: [email protected]
P. Melo-Pinto is with CITAB/UTAD - Centre for the Research andTechnology of Agro-Environment and Biological Sciences, Vila Real,Portugal, and Algoritmi Research Centre, Guimaraes, Portugal, email:[email protected]
J. Morais is with CITAB - Centre for the Research and Technology ofAgro-Environment and Biological Sciences, University of Tras-os-Montesand Alto Douro, Vila Real, Portugal, email: [email protected]
Another characteristic of wood is that two wood samplesmay have different characteristics, even if they have origin ontrees from the same species. Among the factors that influencethese differences we can include the age of the tree, the soilor the climatic conditions [2], [3], [4]. This means that woodmight have some defects and features that may compromiseits use [1].
Detection of wood defects and assessment of its propertiescan be made using either destructive or non-destructivemethods. The first are based on mechanical testing and thesecond uses methods that do not compromise the woodstructure, allowing its utilization afterwards. It becomesevident why these last methods have an increasing interest.
Non Destructive Testing (NDT) are a result of the im-provements on the techniques used to characterize materials,both from the mechanical and the quality points of view. It ispossible to use such processes during the product production(specially at the start). According to [5], 80% of the defectsof a product are corrected during the quality control andutilization phases.
One of the techniques used in NDT, that is becoming muchused, is based on ultrasonic waves. This type of testing allowsto determine mechanical and physical properties of wood,using easy to use and relatively low cost equipments.
In this paper it is presented a low-cost ultrasonic probe,based on FPGA, to assess the Modulus of Elasticity anddetect some defects on wood pieces. It has been testedsuccessfully in laboratory and the results were compared tothose obtained using mechanical testing.
II. ASSESSING WOOD PARAMETERS USING
ULTRASOUNDS
Using ultrasonic waves in Non-Destructive Testing startedat the beginning of the 20th century when, in 1929, S.Sokoloff [6] published some tests. Nowadays this is one ofthe most used techniques in wood testing and it was firstused by Sanyal and Gulati [7].
Some of the advantages of using ultrasounds include:tests can be made from the surface, because of the highpenetration capability that is has in most of the materials;high accuracy in the detection and measurement of defects,even when they are very small in size such as smallfissures. Furthermore it is very simple to use, it does notneed any additional security measures and its use canbe easily automated using, for example, microprocessors,microcontrollers and/or computers [8].
Proceedings of the World Congress on Engineering 2013 Vol II, WCE 2013, July 3 - 5, 2013, London, U.K.
ISBN: 978-988-19252-8-2 ISSN: 2078-0958 (Print); ISSN: 2078-0966 (Online)
WCE 2013
It was Voichita Bucur, one of the main researchers inthe area of ultrasonic waves applied to wood testing, in thebook ”Acoustics of wood” [9] that presented the fundamentalequations of ultrasound propagation in wood.
The propagation speed of longitudinal and transversalwaves can be calculated by:
SL =
√E (1− µ)
ρ (1 + µ) (1− 2µ)(1)
ST =
√G
ρ=√
E2ρ(1+µ) (2)
where:
• SL - Speed of the longitudinal wave [m/s];• ST - Speed of the transversal wave [m/s];• E - Modulus of elasticity [Kg/ms2];• µ - Poisson Coeficient• G - Shear module [Kg/ms2];• ρ - Density [Kg/m3].
A. Inspection techniques
1) Reflection: The reflection technique, or, pulse-echo, isone of the most used in the industry. In this technique a burstof pulses is sent and then the returning echoes are detected.Some of its advantages include the fact that only one of thesides the a piece needs to be available and the capability ofdetecting the exact depth of possible defects on the woodpiece. Usually it is used only one transducer, that transmitsthe pulse burst and the captures the echo signal [5].
Ultrasonic pulses are transmitted by the transducer, then,the ultrasonic wave propagates through the sample and asit crosses boundaries or discontinuities inside the materialunder test, with different acoustic impedances, it might bepartially reflected [5]. All those reflections are then picked-up by the transducer and sent for processing.
It is possible to calculate the depth at which each reflectionwas generated, by measuring the time of propagation of thewave, Eq. 3:
d =S
2T(3)
• d - Depth [m];• S - Speed of sound [m/s];• T - Propagation time [s].
2) Direct Transmission: Unlike the above presented tech-nique, in direct transmission the wave that is captured bythe receiveir is the transmitted wave and to the echoes. Thismeans that two transceivers are needed, a transmitter and areceiver, and that they need to be placed opposite to eachother. Two opposite sides of the piece under test must beavailable for this type of test.
The captured signal will therefore be different from theone obtained with the reflection technique because thetransducer receives continuous waves and not echoes. Onedisadvantage of this technique is that, unlike the reflectionmethod, the depth of possible defects or discontinuities
cannot be determined. However it is still possible to detectthem and their position and dimension [5].
Feature detection is made by analysing any changes on theamplitude of the received signal as well as by the propagationtime of the ultrasonic wave travelling along the sample. Anychange on the amplitude of the received signal is due toreflection, attenuation and dispersion of the wave caused bymaterial features (including deffects) [5].
The propagation speed of the ultrasonic wave in thematerial under test is given by Eq. 4:
S =L
T(4)
Onde:• L - Path length [m];• S - Speed of sound [m/s];• T - Propagation time [s].
III. PROPOSED SYSTEM
It is proposed in this paper a system (hardware andsoftware) to obtain the time of travel and the wave formfor ultrasonic waves in wood, using the direct transmissiontechnique. Results are presented in A-scan mode so that theeffects suffered by the wave while travelling through thewood pieces can be registered.
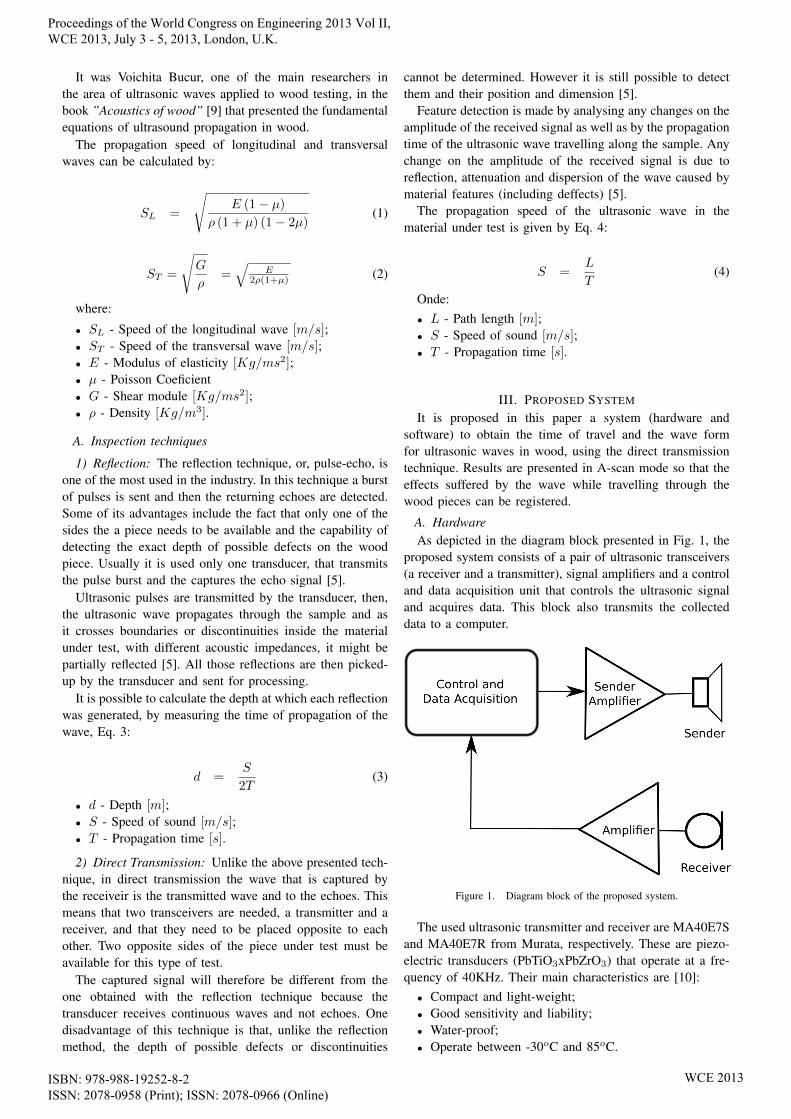
A. HardwareAs depicted in the diagram block presented in Fig. 1, the
proposed system consists of a pair of ultrasonic transceivers(a receiver and a transmitter), signal amplifiers and a controland data acquisition unit that controls the ultrasonic signaland acquires data. This block also transmits the collecteddata to a computer.
Figure 1. Diagram block of the proposed system.
The used ultrasonic transmitter and receiver are MA40E7Sand MA40E7R from Murata, respectively. These are piezo-electric transducers (PbTiO3xPbZrO3) that operate at a fre-quency of 40KHz. Their main characteristics are [10]:
• Compact and light-weight;• Good sensitivity and liability;• Water-proof;• Operate between -30oC and 85oC.
Proceedings of the World Congress on Engineering 2013 Vol II, WCE 2013, July 3 - 5, 2013, London, U.K.
ISBN: 978-988-19252-8-2 ISSN: 2078-0958 (Print); ISSN: 2078-0966 (Online)
WCE 2013

Pulses from the control unit to the ultrasonic transmitterare amplified using a simple Darlington pair and the analogsignal from the receiver is amplified using a precisioninstrumentation amplifier, an AD624 from Analog Devices.The output of this amplifier is fed to the data acquisitionblock where it is recorded and pre-processed.
Two types of information are recorded by the data acquisi-tion block: the ToF (Time of Flight) and the waveform. Thefirst is calculated by detecting the arrival of the first wave ofthe ultrasonic signal. The received signal must be convertedinto a pulse, which can be done using a envelope detector anda voltage comparator, as in [11]. To record the waveform, theoutput of the amplifier is also fed into an Analog-to-Digital(ADC) converter.
To implement the control and data acquisition block twomain options can the taken: use a microcontroller or developa digital circuit. The first option might appear more flexible,because in a microntroller we can develop and modify itsfirmware according to the needs. However it might havesome performance issues due to (unpredictable) time delaysthat firmware may impose. If the system is developed inhardware there will be no time delays due to processing timehowever it seems to be a less flexible option.
These issues can be overcome if this block is implementedusing an FGPA (Field Programmable Gate Array). We havethen the flexibility of firmware and the performance ofhardware. For this project a Nexys2 FPGA board fromDigilent, with a Xilinx Spartan-3E, was used to implementthe prototype. Despite the fact that this specific FPGA wasused, any FPGA with the enough number of gates can beused.
Because an FPGA was used it must be used an externalADC. For this project a 10-bit, 80Msps ADC (MAX1448)from Maxim was used. This ADC was selected because ithas parallel interface (making the interface with the FPGAeasier) and it has the enough speed to acquire the ultrasonicwaveform.
For the prototype used in this paper, the sampling fre-quency is 1MHz which is enough for the used ultrasonicfrequency (40KHz) and 4096 samples of the signal arerecorded. These values are limited by the clock speed ofthe FPGA and the number of available gates.
A more detailed diagram block of the final prototype ispresented in Fig. 2.
Figure 2. Diagram block of the proposed system.
In the FPGA are implemented four modules:• Control logic - which upon request of the host computer
starts the data acquisition cycle. It starts the pulsegenerator, starts the ToF acquisition, and acquires thedata from the external ADC. At the end of the dataacquisition cyle it sends data to the host computerthorough the data communications module;
• Counter - used to measure the ToF. It is reseted at thestart of the pulse burst and stopped when the first pulsearrives;
• Pulse generator - generates the pulse burst that is sentto the transmitter;
• Data communications - which receives commands fromthe host computer and sends the acquired data to it.
The data communications module interfaces a CypressCY7C68013A USB controller which makes part of theNexys2 board.
B. SoftwareTo interface the implemented data acquisition system it
was developed a Java application (Fig. 3). This applicationallows the user to start the data acquisition cycle, downloaddata and display it. The user can visualize the waveformsof both the pulse burst and the received ultrasonic wave, aswell as the estimated value for the modulus of elasticity.
It is also possible to save data for later visualizationand there is also an option to visualise the Fast FourrierTransform of the received signal.
Interface between this application and the FPGA was madeusing Java Native Interface (JNI) and the Digilent’s AdeptSDK (Software Development Kit) libraries. These librariesare used both to send commands to the FPGA board to startthe acquisition cycle and to collect data of the Time of Flightand the waveform.
IV. NUMERICAL RESULTS
In this section are presented some results obtained withthe above presented system.
A. Sample Preparation and Used MethodologyTests were made using Pinus pinaster samples divided into
three groups:• Laminated wood samples with transversal section of
2cm by 3cm and a length of 66, 5cm;• Solid wood samples with transversal section of 2cm by
2cm and a length of 50cm.• Solid wood samples with transversal section of 2cm by
2cm and a length of 48cm.All samples were exposed to the air and were used only
after reaching the moisture equilibrium.To assess if the ultrasonic probe can be used to detect
defects in wood pieces, the propagation speed was measuredboth in defect free samples and samples with visible defects.In some samples were also introduced some defects with adrill.
To acquire data the ultrasonic transmitter and receiver wereplaced in opposite ends of the sample under test. The datawas recorded by the PC application and the ToF results wereconfirmed using a digital scope.
Proceedings of the World Congress on Engineering 2013 Vol II, WCE 2013, July 3 - 5, 2013, London, U.K.
ISBN: 978-988-19252-8-2 ISSN: 2078-0958 (Print); ISSN: 2078-0966 (Online)
WCE 2013
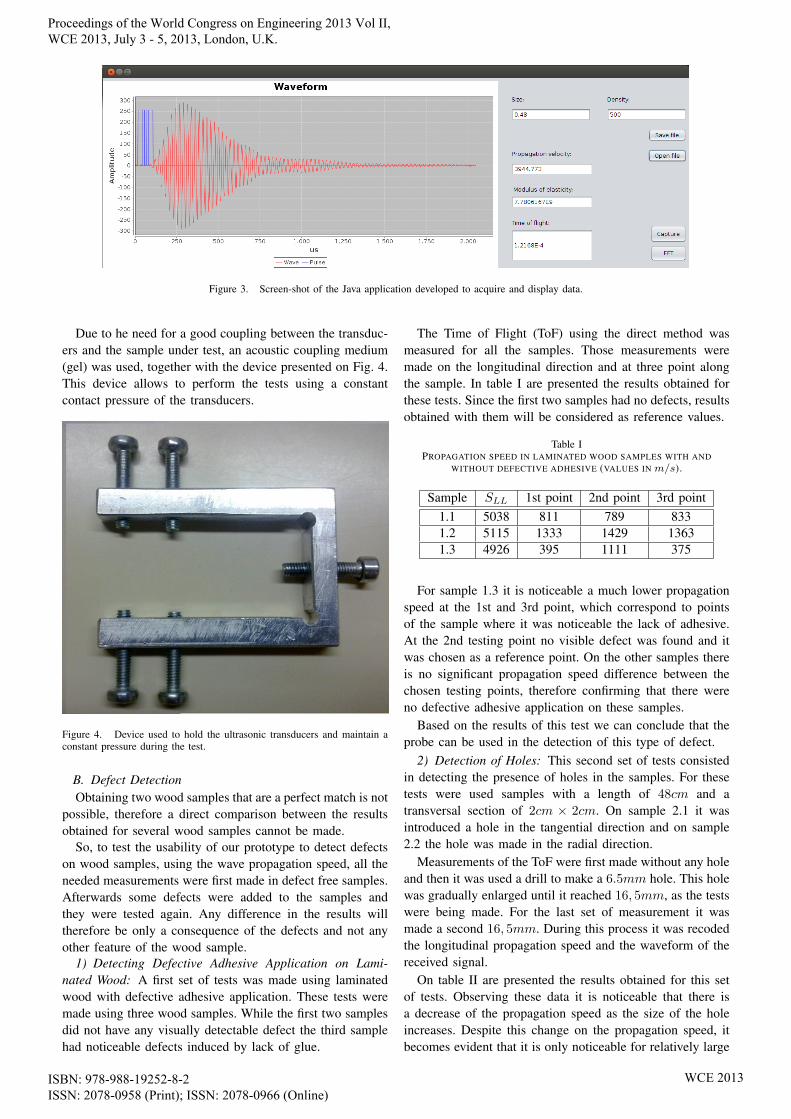
Figure 3. Screen-shot of the Java application developed to acquire and display data.
Due to he need for a good coupling between the transduc-ers and the sample under test, an acoustic coupling medium(gel) was used, together with the device presented on Fig. 4.This device allows to perform the tests using a constantcontact pressure of the transducers.
Figure 4. Device used to hold the ultrasonic transducers and maintain aconstant pressure during the test.
B. Defect DetectionObtaining two wood samples that are a perfect match is not
possible, therefore a direct comparison between the resultsobtained for several wood samples cannot be made.
So, to test the usability of our prototype to detect defectson wood samples, using the wave propagation speed, all theneeded measurements were first made in defect free samples.Afterwards some defects were added to the samples andthey were tested again. Any difference in the results willtherefore be only a consequence of the defects and not anyother feature of the wood sample.
1) Detecting Defective Adhesive Application on Lami-nated Wood: A first set of tests was made using laminatedwood with defective adhesive application. These tests weremade using three wood samples. While the first two samplesdid not have any visually detectable defect the third samplehad noticeable defects induced by lack of glue.
The Time of Flight (ToF) using the direct method wasmeasured for all the samples. Those measurements weremade on the longitudinal direction and at three point alongthe sample. In table I are presented the results obtained forthese tests. Since the first two samples had no defects, resultsobtained with them will be considered as reference values.
Table IPROPAGATION SPEED IN LAMINATED WOOD SAMPLES WITH AND
WITHOUT DEFECTIVE ADHESIVE (VALUES IN m/s).
Sample SLL 1st point 2nd point 3rd point1.1 5038 811 789 8331.2 5115 1333 1429 13631.3 4926 395 1111 375
For sample 1.3 it is noticeable a much lower propagationspeed at the 1st and 3rd point, which correspond to pointsof the sample where it was noticeable the lack of adhesive.At the 2nd testing point no visible defect was found and itwas chosen as a reference point. On the other samples thereis no significant propagation speed difference between thechosen testing points, therefore confirming that there wereno defective adhesive application on these samples.
Based on the results of this test we can conclude that theprobe can be used in the detection of this type of defect.
2) Detection of Holes: This second set of tests consistedin detecting the presence of holes in the samples. For thesetests were used samples with a length of 48cm and atransversal section of 2cm × 2cm. On sample 2.1 it wasintroduced a hole in the tangential direction and on sample2.2 the hole was made in the radial direction.
Measurements of the ToF were first made without any holeand then it was used a drill to make a 6.5mm hole. This holewas gradually enlarged until it reached 16, 5mm, as the testswere being made. For the last set of measurement it wasmade a second 16, 5mm. During this process it was recodedthe longitudinal propagation speed and the waveform of thereceived signal.
On table II are presented the results obtained for this setof tests. Observing these data it is noticeable that there isa decrease of the propagation speed as the size of the holeincreases. Despite this change on the propagation speed, itbecomes evident that it is only noticeable for relatively large
Proceedings of the World Congress on Engineering 2013 Vol II, WCE 2013, July 3 - 5, 2013, London, U.K.
ISBN: 978-988-19252-8-2 ISSN: 2078-0958 (Print); ISSN: 2078-0966 (Online)
WCE 2013

Table IIPROPAGATION SPEED ON THE SAMPLE FOR THE DIFFERENT HOLE DIAMETER (VALUES IN m/s).
Diametro do furoSample no hole 6,5mm 9mm 12mm 14mm 16,5mm 2x16,5mm
2.1 4897,96 4897,96 4897,96 4848,49 4800 4800 4705,882.2 4848,49 4848,49 4848,49 4848,49 4848,49 4800 4615,39
defects. In the samples under test for holes greater or equalthan 14mm (sample 2.1) and 16, 5mm for sample 2.2.
This apparent lack of sensibility is related with thewavelength, which for the presented tests is approximately122.5mm. To decrease minimum defect dimension that canbe correctly detected by the system the frequency of theultrasonic wave must be increased.
3) Detection of Galleries: In this test galleries made byxylophagous insects were simulated on the samples. Thesamples used in this test that 2cm by 2cm of transversalsection and length of 48cm. To simulate the presence of thegalleries several holes were made with a 4mm drill.
As for the previous test, the samples were first testedwithout any hole on it and then the number of holes wasincreased progressively. Data of the propagation speed andthe waveform was recorded for every step. For every step 8holes were added to the sample, 4 in the radial direction and4 in the tangential direction, until a total of 40 holes wasobtained.
Table III presented the results obtained for this test. Asexpected it is noticeable a decrease on the propagationspeed as the number of holes increases. This techniquecan therefore be used in wood testing to detect detect thepresence of this type of defect. Obviously that this detectioncan only be made if the sample was already analysed andthere are previous values that can be used as a reference. Thismight not be applicable during the manufacturing process butcan be used for example to periodically verify the integrityof wood beams.
C. Modulus of ElasticityFor this test were used solid Pinus pinaster samples
(2cm×2cm×50cm) that had never been subject no any kindof mechanical testing. For comparison purposes a bendingforce test was also made, using a universal testing instrument,a Instron model 1125 (Fig. 5).
With the sample placed on the testing machine, thepropagation time was measured. Based on this value thelongitudinal propagation speed of the sample was thencalculated. Afterwards a bending force was applied to thesample at crosshead speed of 5mm per second.
With the collected data MOE was calculated using Eq. 5:
EaL =1
4b
(L
h
)3F
f(5)
Onde:• h e b - Dimensions of the transversal section;• L - Distance between supports;• F/f - Initial slope of the bending.Using data collected with the ultrasonic probe, the dy-
namic modulus of elasticity was calculated using Eq. 6:
Figure 5. Sample being tested using the developed probe and a universaltesting instrument.
S =
√Ed
ρ(6)
Onde:• S - Propagation speed [m/s];• Ed - Dynamic modulus of elasticity [N/m2];• ρ - Density [Kg/m3].In table IV are presented the numerical results obtained
for this test. This table presentes the calculated values forthe sample density, the static modulus of elasticity and thedynamic modulus of elasticity.
For a better comparison between the MOE and Ed it isalso presented, Fig. 6, the comparative plot of the obtainedresults for these parameters.
Figure 6. Comparison between the obtainedMOE and Ed values.
Proceedings of the World Congress on Engineering 2013 Vol II, WCE 2013, July 3 - 5, 2013, London, U.K.
ISBN: 978-988-19252-8-2 ISSN: 2078-0958 (Print); ISSN: 2078-0966 (Online)
WCE 2013

Table IIIPROPAGATION SPEED OBTAINED FOR THE SIMULATION OF THE GALLERIES (VALUES IN m/s)
Number of holesSample no hiles 8 holes 16 holes 24 holes 32 holes 40 holes
3.1 4979,17 4927,84 4843,94 4747,72 4619,25 4514,553.2 5106,38 5000 4948,45 4848,49 4687,5 4597,70
Table IVVALUES OF DENSITY, MOE AND Ed FOR THE SAMPLES USED IN THE
TEST.
Sample Dens.(Kg/m3) MOE (Mpa) Ed (Mpa)4.1 572,95 10296,37 12510,924.2 469,19 9259,88 10844,814.3 618,94 10970,17 13023,844.4 522,52 12063,58 13883,524.5 486,95 9975,5 11933,764.6 559,31 8466,74 9710,164.7 559,19 11704,36 13979,634.8 482,15 10200,76 11585,694.9 529,05 9341,94 11339,38
4.10 556,11 9736,75 10887,894.11 580,5 9161,95 11166,94.12 531,08 12129,72 14406,474.13 552,93 12622,51 14691,394.14 478,24 10729,11 12198,764.15 611,3 15539,37 16582,574.16 604,49 10963,85 12719,574.17 496,64 10749,65 11703,274.18 473,04 10825,9 11366,664.19 522,99 8937,91 10611,864.20 601,33 15858,77 17013,64
As it was already concluded by Divos et. al. [12], thevalues for Ed are higher than those for MOE. ObservingFig. 6 it can be concluded that although not equal in value,the plot for both terms are very similar (with an almostconstant offset between them). In fact the correlation betweenthese values is 0, 9372.
Based on the above presented results it can be concludedthat the prototype presented in this paper can be used tocalculate wood parameters, such as MOE, without the needto submit the samples to deformation tests. One of theadvantages of it is the fact that the wood will not sufferany change on its structure. Therefore the samples used onthe tests can be used in any other application.
V. CONCLUSION
In this paper it was presented a prototype for a low-costultrasonic probe, using 40KHz ultrasonic transducers and anFPGA. The objective of this probe is to assess some woodparameters, such as the Ed, and to detect some types defectsthat can occur in wood samples.
There were made three sets of tests to detect defectson wood pieces and one set of tests to assess the Edparameter value. It was possible to detect defects on theglueing process of laminated wood, by detecting a decreaseon the propagation speed of the ultrasonic wave on defective
areas of the sample under test. This speed decrease was alsoobserved when the prototype was used to detect holes in thesamples.
Regarding the determination of Ed, the used wood sampleswere also subjected to mechanical testing, and the obtaineddata corroborate that it is possible to use the proposed low-cost system to assess this parameter.
Using this technique, wood samples are not subject toany mechanical stress. They can therefore be used in furthertesting, during research, or be used in final products, in thecase of industrial applications. Furthermore it has also theadvantage of being a fast technique, when compared forexample with the set-up time needed to make a test withan universal testing instrument.
ACKNOWLEDGEMENT
This work is supported by European Union Funds(FEDER/COMPETE - Operational CompetitivenessProgramme) and by national funds (FCT - PortugueseFoundation for Science and Technology) under the projectFCOMP-01-0124-FEDER-022696.
REFERENCES
[1] K. A. McDonald, R. H. Falk, and M. P. Mallory, “Nondestructivetesting of wood products and structures: state of the art and researchneeds.” Madison, WI: U.S. Department of Agriculture, Forest Service,Forest Products Laboratory, pp. 137–147, 1990.
[2] B. Voichita and R. Patrick N.J., “Dynamic elastic anisotropy andnonlinear in wood and rock,” Elsevier ScienceB. V., Utrasonics,vol. 36, pp. 813–824, 1998.
[3] J. G. Haygreen and J. L. Bowyer, Forest Products and wood science:Na Introduction. 2ed. Iowa State University Press, Ames, Iowa, 1989.
[4] F. K. Bechtel and J. R. Allen, “Methods of implementing grainangle measurements in the machine stress rating process,” vol. SixthNondestructive Testing of Wood Symposium. Washington StateUniversity, Pullman, WA, 1987.
[5] R. Stoßel, “Air-coupled ultrasound inspection as a new non-destructivetesting tool for quality assurance,” Ph.D. dissertation, UniversitatStuttgart, Holzgartenstr. 16, 70174 Stuttgart, 2004. [Online]. Available:http://elib.uni-stuttgart.de/opus/volltexte/2004/1622
[6] S. Sokoloff, “Zur frage der fortpflanzung ultraakustuscher schwingun-gen in verschiedenen koerpern,” pp. 454–461, 1929.
[7] A. S. Sanyal, S. N.and Gulati, “Compressive strength of timber byultrasonic pulse technique,” Indian Forester, Dehra Dun, India, vol.105, no. 2, pp. 180–185, 1979.
[8] J. Blitz and G. Simpson, Ultrasonic methods ofnon-destructive testing, ser. Non-destructive evaluationseries. Chapman & Hall, 1996. [Online]. Available:http://books.google.com/books?id=d3WWect9zQEC
[9] V. Bucur, Acoustics of Wood, 2nd ed. Springer, 2006.[10] “Ultrasonic sensor, aplication manual,” Murata Manufacturing Co.
Ltd., Tech. Rep., (2008).[11] P. Mestre, C. Serodio, A. Azevedo, H. Correia, I. Bentes,
and C. Couto, “Filling rate assessment of recyclingcontainers using ultrasonic transducers,” Measurement, vol. 44,no. 6, pp. 1084 – 1095, 2011. [Online]. Available:http://www.sciencedirect.com/science/article/pii/S0263224111000923
[12] F. Divos and T. Tanaka, “Acta silvatica et lignaria hungarica,”Construction and Building Materials, vol. 1, pp. 105–110, 2005.
Proceedings of the World Congress on Engineering 2013 Vol II, WCE 2013, July 3 - 5, 2013, London, U.K.
ISBN: 978-988-19252-8-2 ISSN: 2078-0958 (Print); ISSN: 2078-0966 (Online)
WCE 2013