low-â€frequency volcanic seismicity - vhub
TRANSCRIPT

Low-‐Frequency Volcanic SeismicitySource processes and implica0ons of
tremor, LP and VLP earthquakes at open-‐vent volcanoes

TREMOR, LP, AND VLP CHARACTERISTICS
• Primarily defined on the basis of the frequency content
• These all can be considered “low-‐frequency” seismicity

TREMOR, LP, AND VLP CHARACTERISTICS
Short-period seismometers
Broad-band seismometers

TREMOR, LP, AND VLP CHARACTERISTICS
• Primarily defined on the basis of the frequency content
• These all can be considered “low-‐frequency” seismicity
Low-‐Frequency(LF) Seismicity

GENERAL VOLCANIC EARTHQUAKE CLASSIFICATION• HF (high frequency) or VT (volcano tectonic)
– tectonic earthquakes (slip on a fault)
– Clear P and S wave arrivals
• LF (low frequency)– Typically no clear S wave
– Low frequencies due to source and/or path
– Includes long-‐period earthquakes, which occur at all depths within the crust
– Tremor -‐ Semi-‐con0nuous signal with harmonic or irregular signals
• Hybrid– Characteris0cs of both HF and LF
– Usually have high-‐frequency onset, low-‐frequency coda
– Could represent a small VT that triggers an LP
– Some0mes dis0nguished from LP on the basis of mixed first-‐mo-on polari-es
– suggests the event involves slip on a fault

GENERAL CHARACTERISTICS OF LF SEISMICITY
• May have harmonic/narrow band signal
• Typically aYributed to fluid interac0ng with solid volcanic conduit walls
‣ gas, liquid or more likely mul0phase
• Nonlinear processes that vary with 0me
‣ physical proper0es of the system evolve
• Transient or long-‐lived
• Path and site affects can cause events to look like LF events

LP (LONG-‐PERIOD) EARTHQUAKES
• Known by many names
‣ LP, B-‐type, tornillo, ...
• Broadband onset
‣ frequencies from .2 to 15 Hz
‣ trigger
• Decaying, harmonic coda
‣ frequencies .5 -‐ 2 Hz
‣ resonance
• Typically shallow, but can be very deep (upper mantle)
From Kumagai and Chouet, GJI, 1999

PATH-‐EFFECTED LPS?• Path can filter some frequencies and enhance others
• Shallow low-‐velocity layers can trap waves
‣ prolongs the dura0on of the signal and may mimic LP coda characteris0cs
• Topography focusses and defocusses waves
Anderson et al.,submitted to G3, 2011
‣ Waves can be trapped beneath steep topographic features (hills and volcanic edifices)
‣ If underlain by strong reflec0ve layer, the signal can ring for 10s of seconds

SYNTHETIC MODELING OF STRUCTURE• Shallow low-‐velocity layers can trap waves
‣ prolongs the dura0on of the signal and may mimic LP coda characteris0cs
• Topography focusses and defocusses waves
‣ Waves can be trapped beneath steep topographic features (hills and volcanic edifices)
‣ If underlain by strong reflec0ve layer, the signal can ring for 10s of seconds
Anderson et al.,submitted to G3, 2011

PATH-‐EFFECTED LPS?• Shallow low-‐velocity layers can trap waves
‣ prolongs the dura0on of the signal and may mimic LP coda characteris0cs
• Topography focusses and defocusses waves
‣ Waves can be trapped beneath steep topographic features (hills and volcanic edifices)
‣ If underlain by strong reflec0ve layer, the signal can ring for 10s of seconds
Anderson et al.,submitted to G3, 2011

SOURCE VS. PATH AFFECTS
‣ Topographic features greatly distort even a simple signal.
Incr
easi
ng e
pice
ntra
l dis
tanc
e
Fuego, Guatemala

SOURCE VS. PATH AFFECTS
• Site affects are unlikely to be iden0cal at all sta0ons
‣ Examine spectra of the coda for one event at all sta0ons for similarity
‣ Common spectral peaks at all azimuths are unlikely to be cause by site affects
Incr
easi
ng e
pice
ntra
l dis
tanc
e
Mount St. Helens

SOURCE VS. PATH AFFECTS
• Site affects are unlikely to be iden0cal at all sta0ons
‣ Examine spectra of the coda for one event at all sta0ons for similarity
‣ Common spectral peaks at all azimuths are unlikely to be cause by site affects
• Caveat: crack model predicts varia0ons in frequency content with azimuth
Incr
easi
ng e
pice
ntra
l dis
tanc
e
Mount St. Helens

Difficult to iden0fy for shallow events– One way to determine if LF signal is due to path or source is to examine different events (a VT and LP) that occur at about the same loca0on
– Share the same path for most, so any differences aYributed to source
– Mammoth Mountain example
• Stacked spectra from 7 sta0ons
• Two events closely-‐spaced
• Differences unlikely to be path-‐only
SOURCE VS. PATH AFFECTS
Pitt & Hill, GRL, 1994
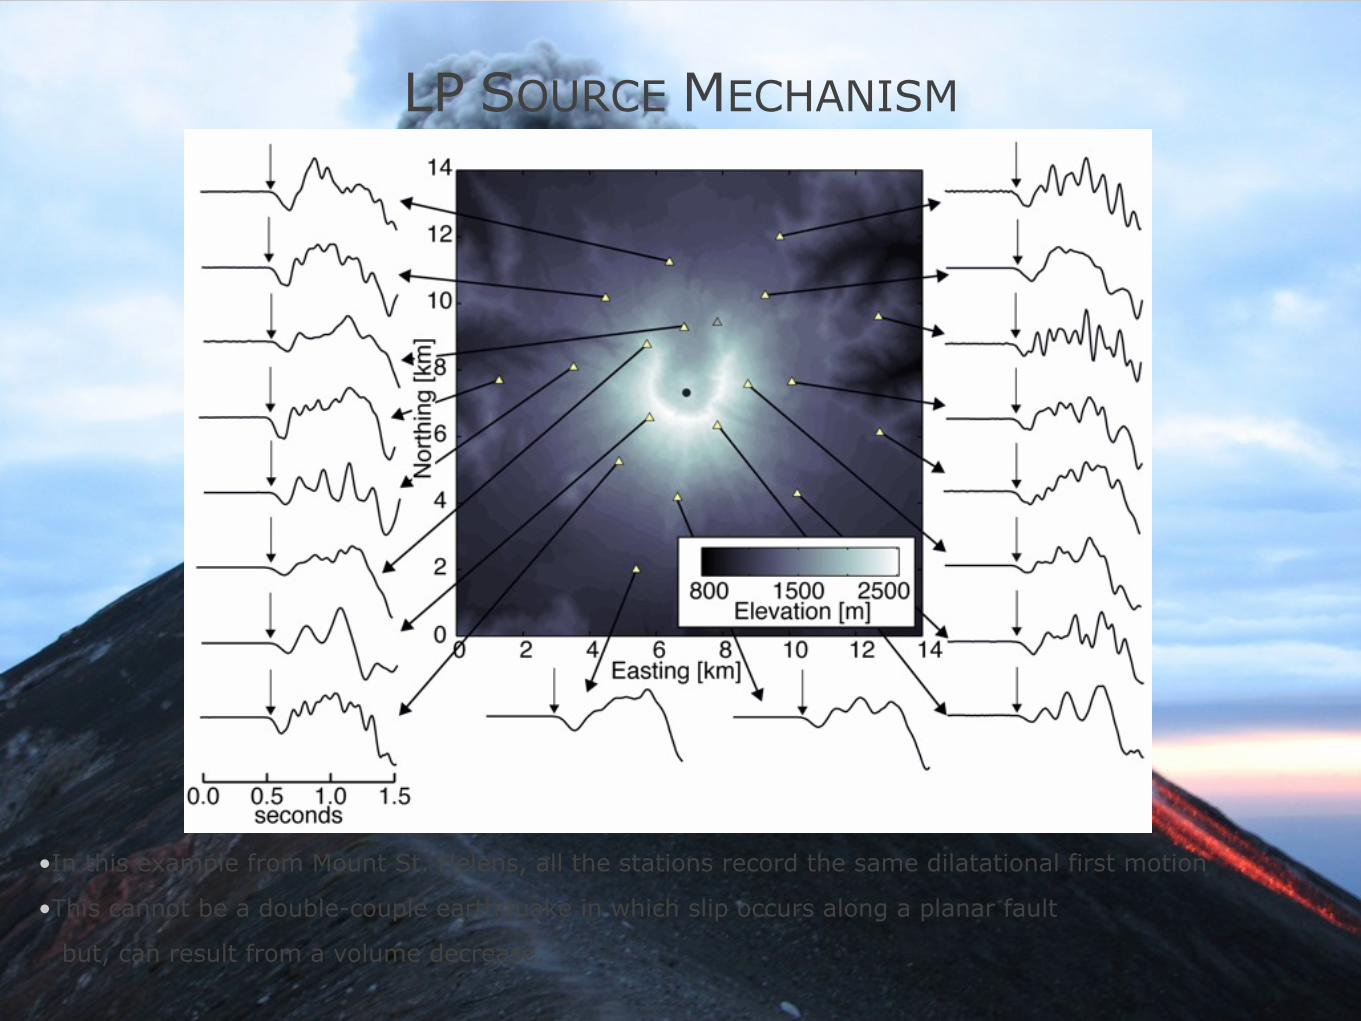
LP SOURCE MECHANISM
•In this example from Mount St. Helens, all the stations record the same dilatational first motion
•This cannot be a double-couple earthquake in which slip occurs along a planar fault
but, can result from a volume decrease.

CRACK MODEL
‣ fluid velocity (a)
‣ fluid density (ρf)
‣ rock velocity (α)
‣ rock density (ρs)
‣ Z = a ρf / α ρs
• Large aspect ra0o crack filled with magma0c or aqueous mul0phase fluid
Kumagai & Chouet, JGR, 2000
championed by Bernard Chouet

CRACK MODEL• Large aspect ra0o crack filled with magma0c or aqueous mul0phase fluid
‣ crack width and length on the order of 100s of m for crack width of 100s of cm
• Resonator due to large impedance contrast (Z) between solid crack walls and fluid
‣ Z = fluid velocity X fluid density / rock velocity X rock density
‣ Traps energy in the crack
‣ Large impedance contrast -‐> long dura-on coda

CRACK MODEL• Candidate fluids are:
‣ bubbly magma
‣ steam
‣ steam with fine par0cles (dusty gas)
‣ crystal-‐rich magma
• Predic0ons about the rate of decay of the harmonic coda can be made for specific fluid types

SOMPI METHOD
From Kumagai and Chouet, GJI, 1999

CRACK MODEL
‣ Low Qr means the coda decays rapidly
‣ High Qr predicts long-‐dura0on codas
α/a
Kumagai & Chouet, JGR, 2000
Qr describes the signal attenuation due to radiation from the crack

• High Qr is best explained by a dusty gas‣ Dust ~1 µm
‣ Only tested fluid that can produce long-‐lived coda with Q significantly greater than 100
• Low Qr results can be explained by a variety of fluid mixtures‣ Frothy basalt
‣ H2O gas-‐ CO2 gas
‣ Bubbly water
• Dominant frequencies are different!‣ Crack dimensions are the same
‣ Only the fluid content has changed

•Qr varies from 10 at Redoubt to 1000 at Kusatsu-‐Shirane and Galeras
Kumagai and Chouet, GJI, 1999
CRACK MODEL

CRACK MODEL: INTERFACE WAVE• cri0cal component of this model is the interface wave
‣ slow wave or crack wave (similar to Biot wave or tube wave)
‣ travels along the crack wall-‐fluid interface
‣ propagates with speed slower than the fluid velocity
• velocity decreases with
‣ increasing wavelength
‣ increasing fluid bulk modulus
‣ decreasing shear modulus
‣ decreasing crack aperture
• because of the slow wave speed, LP resonant frequencies are possible for rela0vely small cracks

CRACK MODEL: IMPLICATIONS
• Repe00ve LP events imply a non-‐destruc0ve source process
‣ crack can be excited into resonance hundreds or thousands of 0mes without being significantly altered
• Increasing LP ac0vity may imply
‣ higher pressure in the magma0c or hydrothermal system
‣ increase flow rates

CONDUIT MARGIN FRACTURE RESONANCE• At silicic volcanoes, a model involving resonance of fluid-‐filled cracks along the conduit margin may explain LP earthquakes
• Large strains at margin cause briYle failure in hot rock
• Pressure changes can trigger resonance in system of interconnected cracks
• LP events may increase in frequency and merge into tremor
‣ suggests a common source mechanism for LP and tremor ac0vity
Neuberg et al., JVGR, 2000

CONDUIT MARGIN FRACTURE RESONANCE• Increased ac0vity may indicate an increase in effusion rate
Neuberg et al., JVGR, 2000

VOLCANIC TREMOR• Long-‐dura0on signal with emergent onset
• No clear P or S arrivals
• May be dominantly surface waves or body waves
• Two types
‣ Harmonic
-‐ spectral characteris0cs similar to the coda of an LP
-‐ may have mul0ple overtones indica0ve of a resonant source process
‣ Non-‐harmonic
-‐ typically low-‐frequency and narrow band, but without harmonics

HARMONIC TREMOR• Narrow-‐band, long-‐dura0on signal
• 1 or more (>10) harmonic overtones of the fundamental frequency, f0
12 January 2009, Fuego, Guatemala

HARMONIC TREMOR
• A simple harmonic resonator (organ pipe) model:
‣ f0 = v/2L (Hagerty, 2000)-‐ where v is the speed of the interface wave
-‐ L is the length of the resonator
• nonlinear change in density at gas exsolu0on front acts as lower boundary

HARMONIC TREMOR GLIDE, FUEGO GUATEMALA
• Harmonic tremor with up to 10 harmonics
• Tremor typically glided upward just prior to an explosion over 1-‐2 minutes
• Fundamental frequency from 2 -‐ 4 Hz
• Amplitude decayed as frequency increased
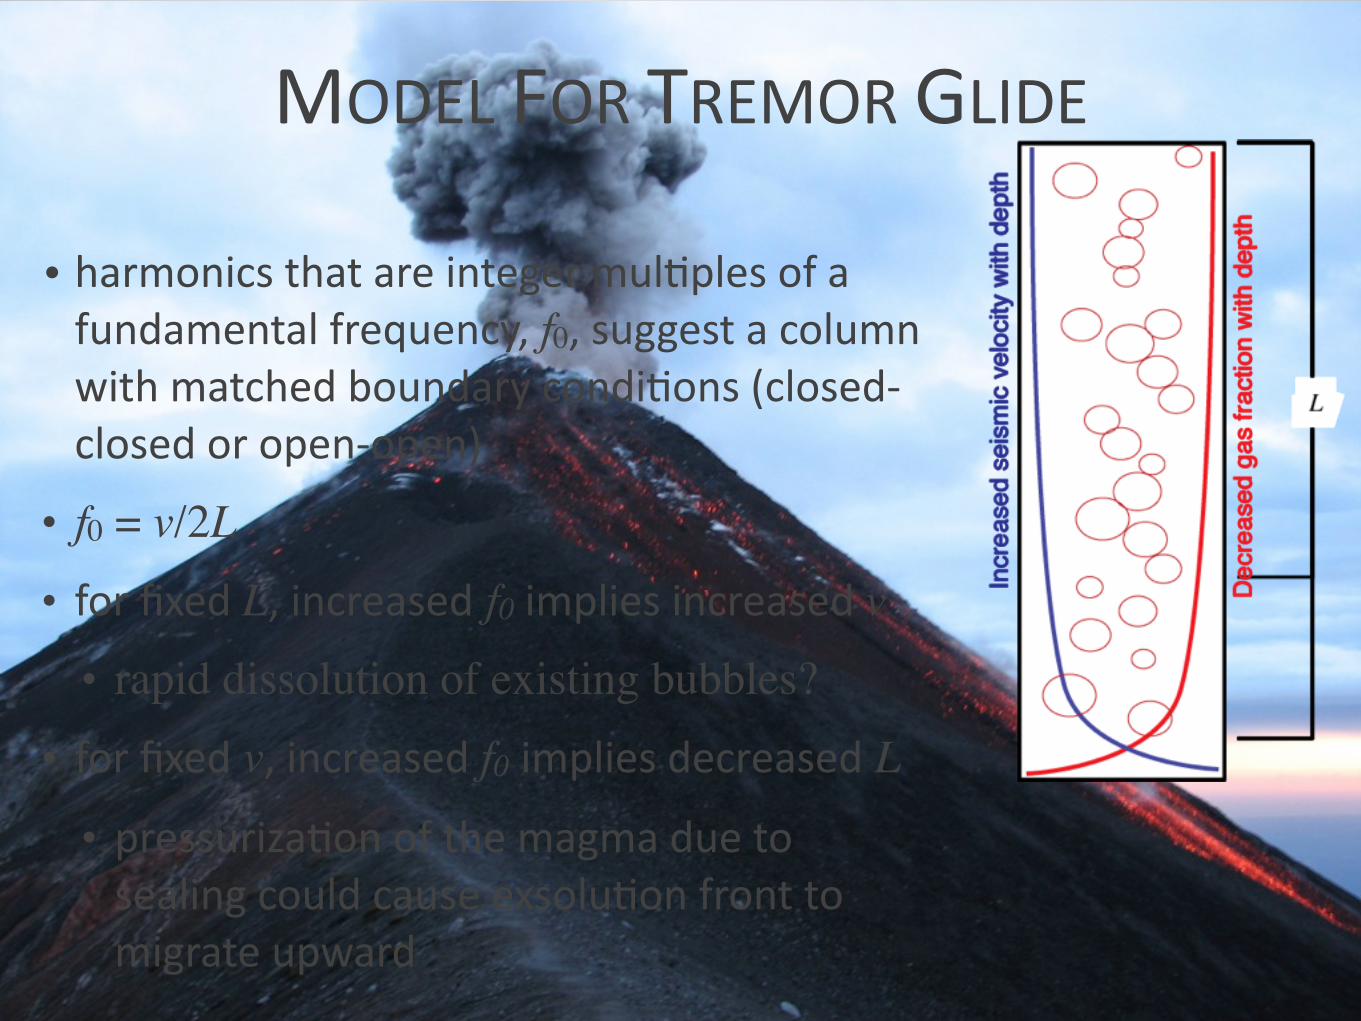
MODEL FOR TREMOR GLIDE
• harmonics that are integer mul0ples of a fundamental frequency, f0, suggest a column with matched boundary condi0ons (closed-‐closed or open-‐open)
• f0 = v/2L• for fixed L, increased f0 implies increased v
• rapid dissolution of existing bubbles? • for fixed v, increased f0 implies decreased L
• pressuriza0on of the magma due to sealing could cause exsolu0on front to migrate upward

A MODEL FOR HARMONIC TREMOR GLIDE
• Gliding could be due to shortening effec0ve length of the conduit
• For v=400 m/s and f0=2, L=100 m => f0=4, L=50 m
• Implies mobile boundary migrates about 0.4 m/s
• If conduit is sealing, increased pressure could reduce L and increase v

A MODEL FOR HARMONIC TREMOR GLIDE

TREMOR DUE TO UNSTABLE FLOW
• Rapid fluid flow through a constric0on in the conduit can excite harmonic tremor
‣ Consider the sound made by the slow release of air from a balloon
‣ May work for liquid or gas
• Modeled for an incompressible, Newtonian fluid and elas0c crack
Julian, JGR, 1994

TREMOR DUE TO UNSTABLE FLOW
• Modeled for an incompressible, Newtonian fluid and elas0c crack (Julian, JGR, 1994)
‣ Pressure difference (p1>p2) drives fluid through the constric0on
‣ walls close due to reduced pressure (Bernoulli effect)
‣ narrower constric0on reduces flow rate
‣ walls open back up due to decreased flow velocity
Julian, JGR, 1994

SOME BUBBLE-‐RELATED TREMOR MODELS• Single bubble oscilla0on
‣ frequency of oscilla0on depends on radius, r, and fluid pressure, P, and density, ρ:
• Bubble cloud oscilla0on
‣ depends on gas frac0on, β, dimension of bubble cloud, L:
• Increased numbers of bubbles, N, lowers the frequency:
• Example,
‣ for r = 1 mm, ~ 10,000 Hz
‣ If N =1012, ~ 2 Hz
€
fosingle =
12π
3Pρr2
€
focloud ≈
12L
Pρβ
(van Wijngaarden, 1972)
€
fosingle
focloud ≈ β
1/ 6N 1/ 3
€
fosingle =
12π
3Pρr2
€
focloud ≈
12L
Pρβ
(van Wijngaarden, 1972; Chouet, 1996)

NON-‐HARMONIC TREMOR MODELS
• Nearly all of the mechanisms described for harmonic tremor can also produce non-‐harmonic tremor under different condi0ons
‣ system of cracks with different dimensions
‣ heterogeneous magma0c fluid
‣ fluid flow
‣ oscilla0ons of bubbles with many different sizes
• May be natural for some systems to oscillate between harmonic and non-‐harmonic tremor as condi0on change

NON-‐HARMONIC TREMOR MODELS
• Gas is involved with the tremor source in some cases
Nadeau et al., GRL, 2011

VERY-‐LONG-‐PERIOD EARTHQUAKES• Observed at most ac0ve volcanoes having sufficient instrumenta0on
‣ basal0c to daci0c
‣ explosive and effusive
‣ single pulse or oscillatory
• Likely involve fluid flow on much longer 0me scale than tremor or LPs
‣ Mass advec0on and accelera0on at places where conduit changes geometry
• Provide insight into conduit geometry and erup0on dynamics

VERY-‐LONG-‐PERIOD EARTHQUAKES• Easy to iden0fy
‣ Use a low-‐pass or band-‐pass filter to remove the frequencies above the VLP range
‣ If VLP signal is real, it will be largely frequency independent

VERY-‐LONG-‐PERIOD EARTHQUAKES• Easy to iden0fy
‣ Use a low-‐pass or band-‐pass filter to remove the frequencies above the VLP range
‣ If VLP signal is real, it will be largely frequency independent
• Piualls
‣ step-‐response will look like VLP when filtered
‣ 0lt can look like VLP signal

• Broadband signals associated with strombolian explosions at Stromboli
• Two types associated with two different vents
• Clearly have a VLP component
VLPS AT STROMBOLI
Chouet et al., JGR, 2003

VLPS AT STROMBOLI
Chouet et al., JGR, 2003

VLPS AT MOUNT ST. HELENS
Waite et al., JGR, 2003

DETERMINING THE SOURCE PROCESS• Invert the VLP seismic data for a representa0ve set of forces
‣ Seismic records convolu0ons of source mechanism, m, and Green func0ons, G
Nm‣ un(t) = ∑ mi(t)*Gni(t), n = 1, …, number of seismic traces
i=1
‣ Nm is the number of mechanism components: 6 independent moment components + 3 single forces
‣ least-‐squares inversion based on this equa0on yields a best-‐fit loca0on and mechanism for each event
• Interpret the forces in terms of realis0c physical models
‣ deforma0on of cracks, pipes, spheres
‣ each of these has a mathema0cal representa0on
• Also consider forces associated with mass accelera0on
‣ the recoil force associated with ver0cal mass ejec0on
‣ descent of magma around a large bubble
• Provides constraint on the geometry and dynamics

VERY-‐LONG-‐PERIOD EARTHQUAKE ANALOG• Bubble accelerates through the flair in the tube
• Liquid annulus falling around the bubble also must accelerate
• Net result is a force (F=ma) that can be translated to the surrounding rock
James et al,JGR, 2006

VLP SOURCE-TIME FUNCTIONMount St. Helens 2 July 2005 at 13:29 UTC

PERSPECTIVE VIEW OF TWO CRACKS
1980-86Dome
New Dome
Mount St. Helens

PERSPECTIVE VIEW OF TWO CRACKS
1980-86Dome
New Dome
Mount St. Helens

VLPS AT FUEGO
• Suggests the same process is ocurring repeatedly
• Source is not changing, so the process is non

VLPS AT FUEGO
Photo by Gustavo Chigna, INSIVUMEH, March 2008

VLPS AT FUEGO
• Suggests the same process is ocurring repeatedly
• Source is not changing, so the process is non

SUMMARY
• Low-‐frequency seismicity is typically indica0ve of fluid processes
• Through careful analysis, models of the dynamics of the magma0c system can be derived
• Models are non-‐unique, but by interpre0ng jointly, with e.g., gas-‐emission data, infrasound data, 0lt, GPS, we beYer constrain the model

ACKNOWLEDGEMENTSJohn Lyons, Patricia Nadeau, José Luis Palma, Josh Richardson, Bill Rose, MTU; Bernard Chouet,
Phil Dawson, Seth Moran, Haruhisu Nakamchi, Joel Robinson, USGS; Gustavo Chigna, INSIVUMEH; Jeff Johnson, NMT; Jonathan Lees, Jake Anderson, UNC
PASSCAL Instrument CenterFunding from Na0onal Science Founda0on, USGS