low income cip evaluation study
TRANSCRIPT
Low Income CIP Evaluation Study
Summary Report 12/31/2017
Contract # 87859
Conservation Applied Research and Development (CARD) FINAL Report
Prepared for: Minnesota Department of Commerce, Division of Energy Resources Prepared by: APPRISE Incorporated
Prepared by: David Carroll
APPRISE Incorporated 32 Nassau Street, Suite 200 Princeton, NJ 08542 Phone: 609-252-8008 website: www.appriseinc.org Project Contact: David Carroll
© 2017 APPRISE Incorporated. All rights reserved.
Contract Number: 87859
Prepared for Minnesota Department of Commerce, Division of Energy Resources: Jessica Looman, Commissioner, Department of Commerce Bill Grant, Deputy Commissioner, Department of Commerce, Division of Energy Resources
Laura Silver, Project Manager Phone: 651-539-1873 Email: [email protected]
ACKNOWLEGEMENTS
This project was supported by a grant from the Minnesota Department of Commerce, Division of Energy Resources, through the Conservation Applied Research and Development (CARD) program, which is funded by Minnesota ratepayers.
We want to thank the individuals who helped to make this evaluation possible by taking the time out of their busy schedules to explain to us how CIP low-income programs work and sharing their ideas about how those programs could be improved to better serve low-income households in Minnesota. Department of Commerce managers and staff, IOU low-income program managers, staff from generation and transmission cooperatives and municipal power agencies, COU CIP program managers, and low-income program service providers spent time responding to our questions and reviewing our findings to ensure that we had accurate information on low-income policies and procedures and that we understood how their low-income programs were designed and implemented.
We also want to thank the CARD project manager, Laura Silver, for her assistance and guidance. Her comprehensive understanding of the CIP and LI CIP programs and her commitment to this project were essential to ensuring that the project reports furnish accurate information about the low-income programs and address important issues for improving the efficiency and effectiveness of low-income programs in the future.
DISCLAIMER
This report does not necessarily represent the view(s), opinion(s), or position(s) of the Minnesota Department of Commerce (Commerce), its employees or the State of Minnesota (State). When applicable, the State will evaluate the results of this research for inclusion in Conservation Improvement Program (CIP) portfolios and communicate its recommendations in separate document(s).
Commerce, the State, its employees, contractors, subcontractors, project participants, the organizations listed herein, or any person on behalf of any of the organizations mentioned herein make no warranty, express or implied, with respect to the use of any information, apparatus, method, or process disclosed in this document. Furthermore, the aforementioned parties assume no liability for the information in this report with respect to the use of, or damages resulting from the use of, any information, apparatus, method, or process disclosed in this document; nor does any party represent that the use of this information will not infringe upon privately owned rights.
Low Income CIP Evaluation Study: Summary Report APPRISE Incorporated 1
Table of Contents
Table of Contents ...............................................................................................................................1
List of Tables ......................................................................................................................................3
Acronyms ..........................................................................................................................................4
Executive Summary (or Policy Brief) ...................................................................................................5
Low-Income Program Context................................................................................................................... 5
CIP Low-Income Spending Requirements ................................................................................................. 5
Natural Gas IOU LI CIP Programs ............................................................................................................... 6
Electric IOU LI CIP Programs ...................................................................................................................... 7
Community Owned Utility (COU) LI CIP Programs .................................................................................... 7
Recommendations .................................................................................................................................... 9
1.0 Introduction ............................................................................................................................... 10
1.1 Methodology ..................................................................................................................................... 10
1.2 Reports .............................................................................................................................................. 11
1.3 Limitations ......................................................................................................................................... 12
2.0 Low-Income Program Context ..................................................................................................... 13
3.0 CIP Low-Income Spending Requirements .................................................................................... 14
3.1 Policies and Procedures for Spending Requirements ....................................................................... 14
3.2 Issues with Current Policies and Procedures .................................................................................... 14
3.3 Low-Income Program Best Practices ................................................................................................. 16
4.0 Natural Gas IOU LI CIP Programs ................................................................................................. 18
4.1 Spending Compared to Requirements .............................................................................................. 18
4.2 Spending by Type of Service Delivered ............................................................................................. 19
4.3 Spending in Collaboration with WAP and EAP .................................................................................. 21
4.4 Spending on Low-Income Renters ..................................................................................................... 22
4.5 Innovative Programs ......................................................................................................................... 23
4.6 Summary of Findings ......................................................................................................................... 24
5.0 Electric IOU Programs ................................................................................................................. 25

Low Income CIP Evaluation Study: Summary Report APPRISE Incorporated 2
5.1 Spending Compared to Requirements .............................................................................................. 25
5.2 Spending by Type of Service Delivered ............................................................................................. 25
5.3 Spending in Collaboration with WAP and EAP .................................................................................. 27
5.4 Spending on Low-Income Renters ..................................................................................................... 28
5.5 Innovative Programs ......................................................................................................................... 28
5.6 Summary of Findings ......................................................................................................................... 29
6.0 Community Owned Utility (COU) Programs ................................................................................. 30
6.1 Organizational Structure for Electric COUs ....................................................................................... 30
6.2 Spending Compared to Requirements .............................................................................................. 31
6.2 Spending by Type of Service Delivered ............................................................................................. 33
6.3 Spending in Collaboration with WAP and EAP .................................................................................. 36
6.4 Spending on Low-Income Renters ..................................................................................................... 36
6.5 Innovative Programs ......................................................................................................................... 37
6.6 Summary of Findings ......................................................................................................................... 38
7.0 Recommendations ..................................................................................................................... 39
7.1 Communications ................................................................................................................................ 39
7.2 Explicit Program Requirements ......................................................................................................... 40
7.3 Implicit Program Objectives .............................................................................................................. 41
7.4 Low-Income Program Best Practices ................................................................................................. 42
7.5 Summary of Recommendations ........................................................................................................ 43
Low Income CIP Evaluation Study: Summary Report APPRISE Incorporated 3
List of Tables
Table 1. 2014 Natural Gas IOU LI CIP Planned and Actual Spending .......................................................... 18
Table 2. 2014 Natural Gas LI CIP Program Summary .................................................................................. 19
Table 3. Comprehensive Natural Gas Single Family LI CIP Programs.......................................................... 20
Table 4. Other Natural Gas LI CIP Programs ............................................................................................... 21
Table 5. CPE Planned Low-Income Spending and Renter Participation for 2017 ....................................... 22
Table 6. 2014 Electric IOU LI CIP Planned and Reported Spending ............................................................ 25
Table 7. 2014 Electric LI CIP Program Summary ......................................................................................... 26
Table 8. Comprehensive Electric LI CIP Programs ....................................................................................... 26
Table 9. Specialty Electric LI CIP Programs ................................................................................................. 27
Table 10. Xcel Planned Electric Low-Income Spending and Renter Participation for 2017 ........................ 28
Table 11. Structure of Minnesota Electric Community-Owned Utilities in 2014 ....................................... 30
Table 12. 2014 Electric COU Dedicated LI CIP Spending Compared to Requirements ............................... 31
Table 13. 2014 Electric COU Total LI CIP Spending Compared to Requirements ....................................... 32
Table 14. 2014 Natural Gas COU Dedicated LI CIP Spending Compared to Requirements ........................ 33
Table 15. 2014 Natural Gas COU Total LI CIP Spending Compared to Requirements ................................ 33
Table 16. 2014 Electric COU LI CIP Program Summary – Dedicated Low-Income Programs ...................... 34
Table 17. 2014 Electric COU Residential Program Summary – Low-Income Spending .............................. 34
Table 18. 2014 Natural Gas COU Program Summary – Dedicated Low-Income Programs ........................ 35
Table 19. 2014 Natural Gas COU Residential Program Summary – Low-Income Spending ....................... 35
Low Income CIP Evaluation Study: Summary Report APPRISE Incorporated 4
Acronyms
C&I – Commercial and Industrial
CAP – Community Action Partnership
CIP – Conservation Improvement Program
COU – Community-Owned Utility
CPE – CenterPoint Energy
Department – the Minnesota Department of Commerce
EAP – Energy Assistance Program
EM&V – Evaluation, Measurement and Verification
ERR – Energy Related Repair
ESP – Energy Savings Platform
FFY – Federal Fiscal Year
GPNG – Great Plains Natural Gas
GMG – Greater Minnesota Gas
HES – Home Energy Squad
HESP – Home Energy Savings program
HHS – United States Department of Health and Human Services
LI – Low Income
LI-CIP – Low-Income Conservation Improvement Program
LI-HES – Low Income Home Energy Squad
LIHEAP – Low income Home Energy Assistance program
LIRC – Low Income Rental Certification
MERC – Minnesota Energy Resources Corporation
MESP – Multi-Family Energy Savings program
MNP – Minnesota Power
NEAT – National Energy Audit Tool
OTP – Otter Tail Power
WAP – Weatherization Assistance Program

Low Income CIP Evaluation Study: Summary Report APPRISE Incorporated 5
Executive Summary (or Policy Brief)
The purpose of this study is to help the Minnesota Department of Commerce (Department), utilities, implementation contractors, and other interested parties to develop a better understanding of how the Low Income (LI) Conservation Improvement Programs (CIP) operate with the goal of identifying ways to increase the efficiency and effectiveness of those programs. The findings and recommendations from this study are covered in four CARD reports that are listed in Section 1 and available online. The purpose of this report is to furnish an overview of the findings and recommendations.
Low-Income Program Context
The study developed information on the number and characteristics of low-income households, and furnished information on the guidelines, spending levels, and participants for the Weatherization Assistance Program (WAP) and Energy Assistance Program (EAP). Important findings include:
• Low-Income Households – There were about 508,000 low-income households in Minnesota in 2015. The study furnishes statistics on owner/renter status, housing unit type, and main heating fuel for low-income households.
• Low-Income Programs – The EAP program used about $124 million in program funds to deliver heating assistance and other energy services to more than 134,000 low-income households in 2016. WAP used about $20 million in program funds to deliver energy efficiency services to 1,782 low-income households in 2016.
The utilities spent over $10 million on LI CIP programs in 2014. Many of those program services were delivered to EAP program recipients in conjunction with the delivery of WAP energy efficiency services.
CIP Low-Income Spending Requirements
The components of the regulatory framework for the CIP low-income spending requirements are Statutes, Rules, Regulatory Decisions and Orders, and communications, instructions, and guidance documents published by the Department. This framework furnishes clear guidance to the utilities on how much they are required to spend on LI CIP programs and what reports they need to file. They also give Department staff systematic procedures for reviewing utility filings.
The study found that there are some areas of ambiguity with respect to program details. For example, the Department has not established a clear and consistent policy on what types of program spending are eligible to be counted as LI CIP program spending. During in-depth interviews, utility program managers and service providers stated that they wanted clearer guidelines for program planning purposes. It seems that documents like the 2012 Multifamily Building Guidance meet the needs of those program managers and service providers.
Low Income CIP Evaluation Study: Summary Report APPRISE Incorporated 6
The LI CIP policies and procedures do not cover some important program guidelines that we find in the guidelines for programs in other jurisdictions. Some examples of important procedures specified by those jurisdictions include: health and safety protocols, quality control procedures, measurement and verification of energy savings, and program evaluation requirements.
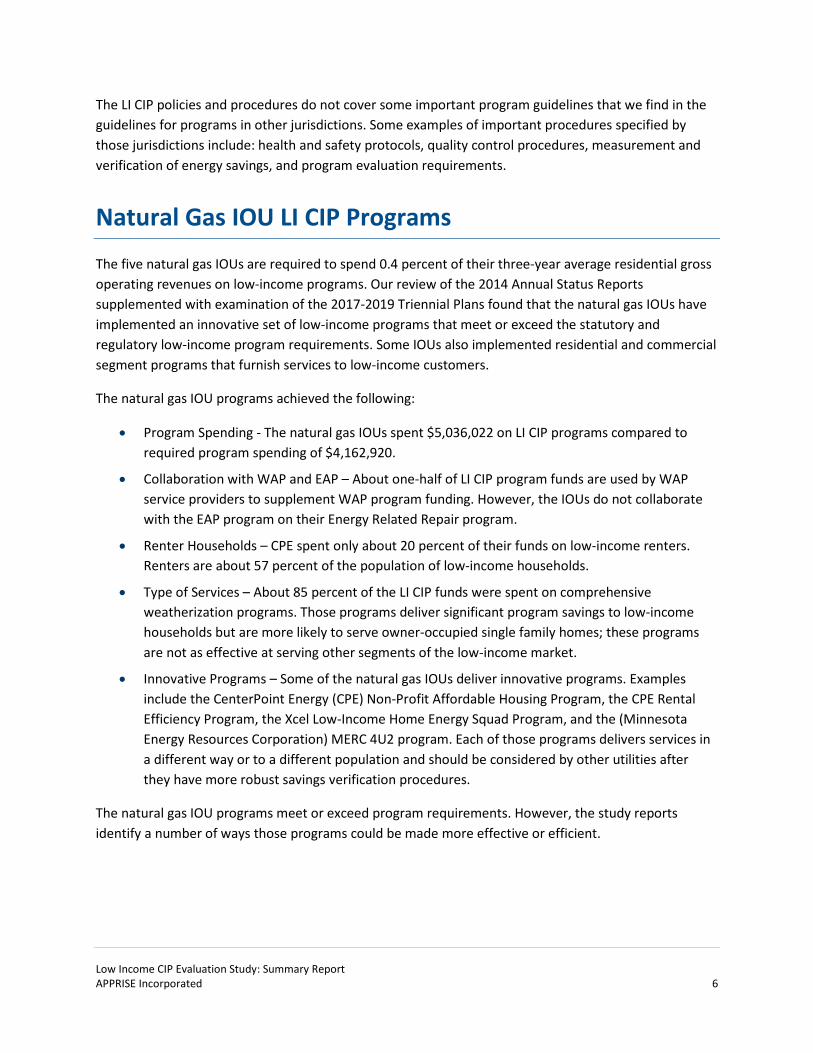
Natural Gas IOU LI CIP Programs
The five natural gas IOUs are required to spend 0.4 percent of their three-year average residential gross operating revenues on low-income programs. Our review of the 2014 Annual Status Reports supplemented with examination of the 2017-2019 Triennial Plans found that the natural gas IOUs have implemented an innovative set of low-income programs that meet or exceed the statutory and regulatory low-income program requirements. Some IOUs also implemented residential and commercial segment programs that furnish services to low-income customers.
The natural gas IOU programs achieved the following:
• Program Spending - The natural gas IOUs spent $5,036,022 on LI CIP programs compared to required program spending of $4,162,920.
• Collaboration with WAP and EAP – About one-half of LI CIP program funds are used by WAP service providers to supplement WAP program funding. However, the IOUs do not collaborate with the EAP program on their Energy Related Repair program.
• Renter Households – CPE spent only about 20 percent of their funds on low-income renters. Renters are about 57 percent of the population of low-income households.
• Type of Services – About 85 percent of the LI CIP funds were spent on comprehensive weatherization programs. Those programs deliver significant program savings to low-income households but are more likely to serve owner-occupied single family homes; these programs are not as effective at serving other segments of the low-income market.
• Innovative Programs – Some of the natural gas IOUs deliver innovative programs. Examples include the CenterPoint Energy (CPE) Non-Profit Affordable Housing Program, the CPE Rental Efficiency Program, the Xcel Low-Income Home Energy Squad Program, and the (Minnesota Energy Resources Corporation) MERC 4U2 program. Each of those programs delivers services in a different way or to a different population and should be considered by other utilities after they have more robust savings verification procedures.
The natural gas IOU programs meet or exceed program requirements. However, the study reports identify a number of ways those programs could be made more effective or efficient.
Low Income CIP Evaluation Study: Summary Report APPRISE Incorporated 7
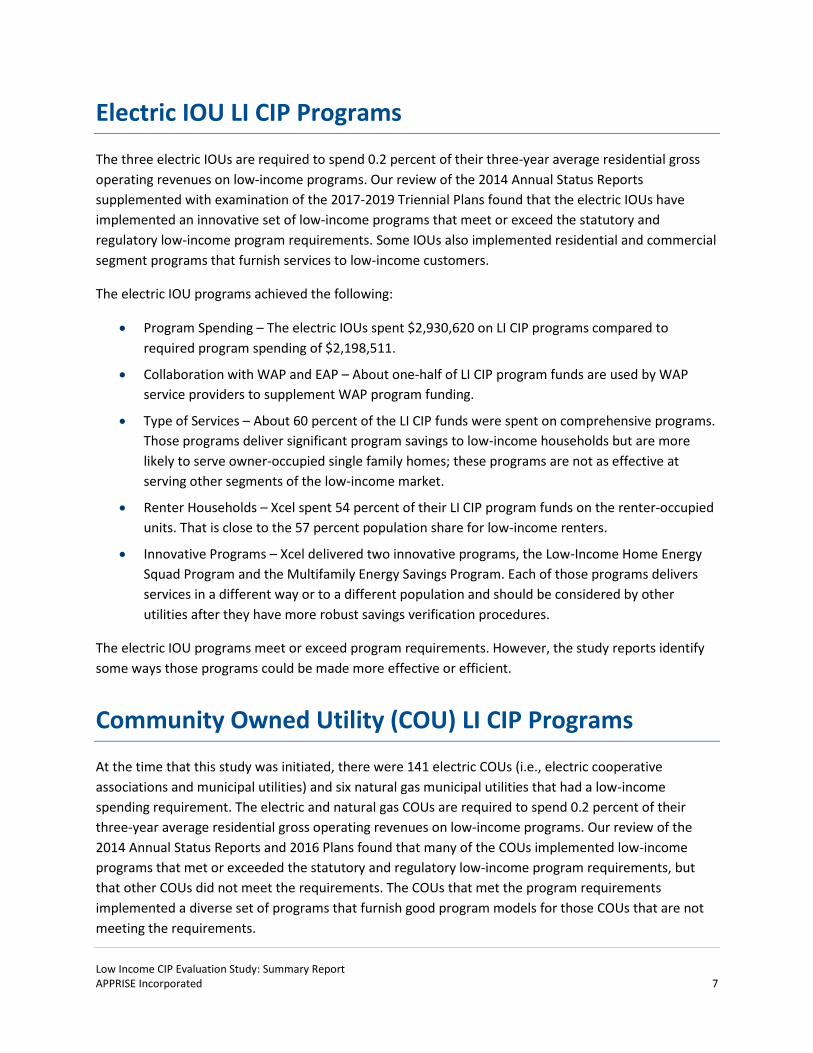
Electric IOU LI CIP Programs
The three electric IOUs are required to spend 0.2 percent of their three-year average residential gross operating revenues on low-income programs. Our review of the 2014 Annual Status Reports supplemented with examination of the 2017-2019 Triennial Plans found that the electric IOUs have implemented an innovative set of low-income programs that meet or exceed the statutory and regulatory low-income program requirements. Some IOUs also implemented residential and commercial segment programs that furnish services to low-income customers.
The electric IOU programs achieved the following:
• Program Spending – The electric IOUs spent $2,930,620 on LI CIP programs compared to required program spending of $2,198,511.
• Collaboration with WAP and EAP – About one-half of LI CIP program funds are used by WAP service providers to supplement WAP program funding.
• Type of Services – About 60 percent of the LI CIP funds were spent on comprehensive programs. Those programs deliver significant program savings to low-income households but are more likely to serve owner-occupied single family homes; these programs are not as effective at serving other segments of the low-income market.
• Renter Households – Xcel spent 54 percent of their LI CIP program funds on the renter-occupied units. That is close to the 57 percent population share for low-income renters.
• Innovative Programs – Xcel delivered two innovative programs, the Low-Income Home Energy Squad Program and the Multifamily Energy Savings Program. Each of those programs delivers services in a different way or to a different population and should be considered by other utilities after they have more robust savings verification procedures.
The electric IOU programs meet or exceed program requirements. However, the study reports identify some ways those programs could be made more effective or efficient.
Community Owned Utility (COU) LI CIP Programs
At the time that this study was initiated, there were 141 electric COUs (i.e., electric cooperative associations and municipal utilities) and six natural gas municipal utilities that had a low-income spending requirement. The electric and natural gas COUs are required to spend 0.2 percent of their three-year average residential gross operating revenues on low-income programs. Our review of the 2014 Annual Status Reports and 2016 Plans found that many of the COUs implemented low-income programs that met or exceeded the statutory and regulatory low-income program requirements, but that other COUs did not meet the requirements. The COUs that met the program requirements implemented a diverse set of programs that furnish good program models for those COUs that are not meeting the requirements.
Low Income CIP Evaluation Study: Summary Report APPRISE Incorporated 8
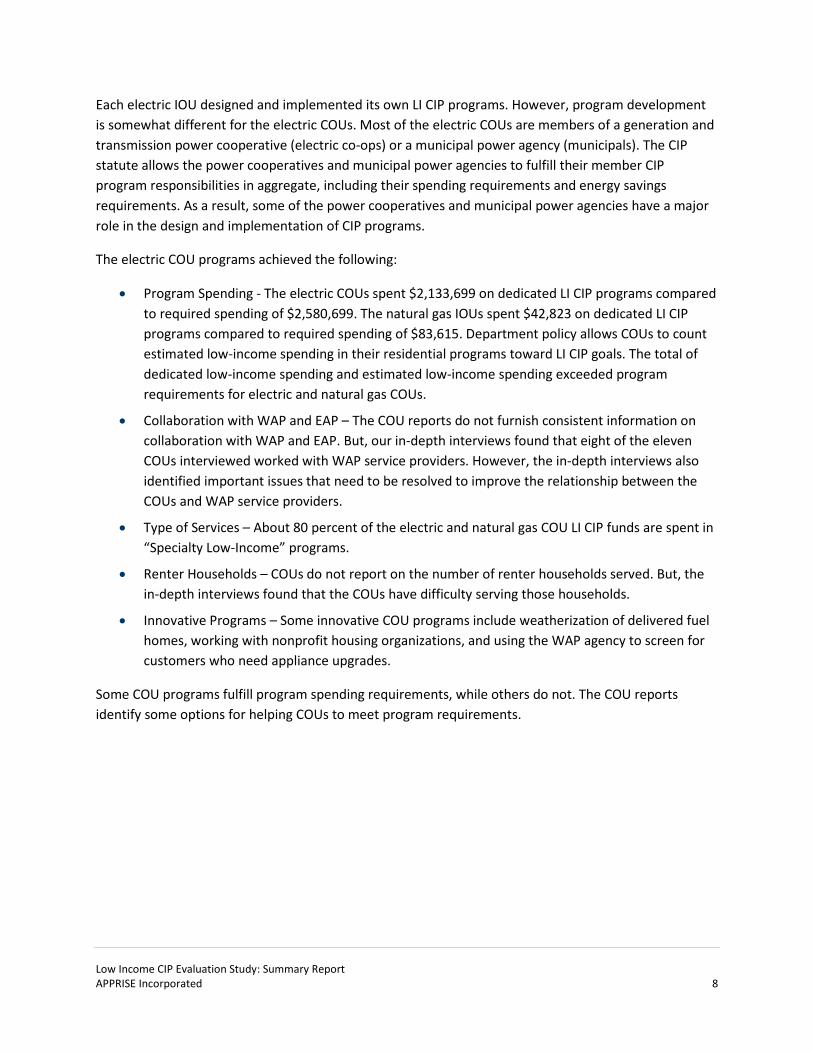
Each electric IOU designed and implemented its own LI CIP programs. However, program development is somewhat different for the electric COUs. Most of the electric COUs are members of a generation and transmission power cooperative (electric co-ops) or a municipal power agency (municipals). The CIP statute allows the power cooperatives and municipal power agencies to fulfill their member CIP program responsibilities in aggregate, including their spending requirements and energy savings requirements. As a result, some of the power cooperatives and municipal power agencies have a major role in the design and implementation of CIP programs.
The electric COU programs achieved the following:
• Program Spending - The electric COUs spent $2,133,699 on dedicated LI CIP programs compared to required spending of $2,580,699. The natural gas IOUs spent $42,823 on dedicated LI CIP programs compared to required spending of $83,615. Department policy allows COUs to count estimated low-income spending in their residential programs toward LI CIP goals. The total of dedicated low-income spending and estimated low-income spending exceeded program requirements for electric and natural gas COUs.
• Collaboration with WAP and EAP – The COU reports do not furnish consistent information on collaboration with WAP and EAP. But, our in-depth interviews found that eight of the eleven COUs interviewed worked with WAP service providers. However, the in-depth interviews also identified important issues that need to be resolved to improve the relationship between the COUs and WAP service providers.
• Type of Services – About 80 percent of the electric and natural gas COU LI CIP funds are spent in “Specialty Low-Income” programs.
• Renter Households – COUs do not report on the number of renter households served. But, the in-depth interviews found that the COUs have difficulty serving those households.
• Innovative Programs – Some innovative COU programs include weatherization of delivered fuel homes, working with nonprofit housing organizations, and using the WAP agency to screen for customers who need appliance upgrades.
Some COU programs fulfill program spending requirements, while others do not. The COU reports identify some options for helping COUs to meet program requirements.
Low Income CIP Evaluation Study: Summary Report APPRISE Incorporated 9
Recommendations
The study recommendations in this report are categorized in terms of four objectives.
• Communications – How can information about LI CIP program requirements and opportunities be communicated most effectively to the utilities, services providers, and other parties that are engaged in the program?
• Explicit Program Requirements – What changes in policies and procedures would increase the effectiveness of and compliance with the explicit program requirements?
• Implicit Program Objectives – How can the program partners work together to develop consensus on the implicit program objectives and undertake initiatives that would move the program toward achievement of those objectives?
• Low-Income Program Best Practices – What are some of the best practices for low-income programs that should be adopted by the Department and implemented by the utilities?
Detailed information about the rationale for each recommendation and the process by which the recommendations would be implemented are furnished in the study reports listed in Section 1.
Low Income CIP Evaluation Study: Summary Report APPRISE Incorporated 10
1.0 Introduction
The purpose of this study is to help the Department of Commerce (Department), utilities, implementation contractors, and other interested parties to develop a better understanding of the how the Low Income (LI) Conservation Improvement Programs (CIP) operate with the goal of identifying ways to increase the efficiency and effectiveness of those programs.
1.1 Methodology
The primary research and analysis tasks conducted for this study included the following.
• CIP Documents and Interviews – Review of the CIP statute, Minnesota Rules, regulatory filings, and LI CIP guidance documents. In-depth interviews with Department CIP unit staff on how these are applied in the context of the low-income spending requirement.
• WAP/EAP Documents and Interviews – Review and analysis of WAP and EAP plans and statistics. In-depth interviews with managers and staff about existing and potential collaboration of WAP and EAP with utility low-income programs.
• Investor Owned Utility (IOU) Low-Income Program Characterization – Review and analysis of 2013-2015 Plans, 2013 and 2014 Status Reports, and 2017-2019 Plans to develop in-depth information on each IOU’s low-income program portfolios. In-depth interviews with all IOU program managers to obtain supplemental information about the design, implementation, and performance of IOU low-income programs.
• Community Owned Utility (COU) Low-Income Program Characterization - Review and analysis of 2014 Status Reports and 2016 Plan as reported in the Energy Savings Platform (ESP). In-depth interviews with a sample of CIP COU aggregators and COU low-income program managers to obtain supplemental information about the design, implementation, and performance of their low-income programs.
• Service Provider Interviews – In-depth interviews with all IOU low-income program service providers and a sample of COU low-income program service providers to understand program barriers and opportunities from their perspective.
These activities gave us a comprehensive understanding of how the low-income programs have been implemented and helped to identify program barriers and opportunities.
Low Income CIP Evaluation Study: Summary Report APPRISE Incorporated 11
1.2 Reports
The findings and recommendations from this study are presented in a set of four reports.
• CIP Low-Income Spending Requirements: Regulatory and Policy Analysis for IOUs – This report documents the regulatory framework for IOUs and identifies changes to policies and procedures that could increase the efficiency and effectiveness of IOU programs.
• CIP Low-Income Spending Requirements: Regulatory and Policy Analysis for COUs – This report documents the regulatory framework for COUs and identifies changes to policies and procedures that could increase the efficiency and effectiveness of COU programs.
• Low-Income CIP Program Assessment: Process Evaluation of IOU Programs – This report characterizes the low-income programs implemented by each IOU, identifies innovative program models, and examines whether these programs meet the explicit program requirements, fulfill implicit statutory objectives, and make use of low-income program best practices. It identifies opportunities for IOUs and the Department to work together to enhance the portfolio of services these programs deliver to low-income customers.
• Low-Income CIP Program Assessment: Process Evaluation of COU Programs – This report furnishes information on how the aggregators and COUs work together to design and implement low-income programs, presents detailed examples of how some COUs implement their low-income programs with an emphasis on identifying innovative programs, and presents summary statistics on the set of COU low-income programs. It identifies opportunities for the aggregators and COUs to collaborate with the Department on initiatives that would help COUs to implement more effective low-income programs.
The Regulatory and Policy Analysis reports focus on ways that the Department can work with utilities to develop program guidance documents to establish much needed standards for health and safety and quality control, while also alerting utilities to opportunities for implementation of innovative approaches to serving low-income customers. There are separate reports because the IOUs are subjected to a different level of regulatory oversight than are the COUs.
The Program Assessment reports identify ways for the Department, utilities, services providers, and other parties to engage in collaborative processes to increase the quality of program performance data with the intent of helping utilities to accurately assess the relative performance of programs and improve their program portfolios. There are separate reports because the IOU program design and implementation procedures are quite different from those for COUs.
Low Income CIP Evaluation Study: Summary Report APPRISE Incorporated 12
1.3 Limitations
The most important limitation of this study is that it did not include measurement and verification activities. Our analysis was able to identify which LI CIP programs were serving important low-income market segments and which programs were using innovative program delivery procedures. Those are identified in the Program Assessment reports. However, because each utility and each program used different energy savings estimation procedures, there was no way to assess the relative performance of the different programs. The current evaluation, measurement, and verification procedures are very limited and do not allow either the Department or the utilities to accurately assess the relative performance of different programs or different program implementation contractors.
Low Income CIP Evaluation Study: Summary Report APPRISE Incorporated 13
2.0 Low-Income Program Context
The Department encourages utilities to work with WAP service delivery agencies on the design and implementation of their low-income programs. Most of the IOUs and many of the COUs contract with WAP service providers to deliver one or more of their programs. Often, those utilities use EAP or WAP income guidelines and have adopted WAP program protocols. Because of this close relationship of these programs, it is important to document EAP and WAP program guidelines and it is useful to have statistics on those programs to understand more about the ways that the publicly funded and ratepayer-funded programs can collaborate.
The Program Assessment reports include information on:
• Income-Eligible Households – The reports furnish estimates of the number of low-income households as well as statistics on low-income housing unit types and main heating fuels.
• EAP and WAP Programs – The reports furnish information on the program guidelines, program spending, and program participants for each of the programs.
Some important statistics include:
• Low-Income Households – About 508,000 households were income-eligible for the WAP and EAP programs in 2015. That was about 24 percent of Minnesota households.
• Low-Income Housing– About 64 percent of low-income households live in single family homes (including 1-4 family units and mobile homes) while 36 percent live in large multifamily buildings; 57 percent of low-income households are renters; and, 55 percent of low-income households report using natural gas for heating, 27 percent report using electricity, and 18 percent report using a delivered fuel.
• EAP Program – In FFY 2016, the EAP heating assistance program served over 134,000 low-income households. That was about 26 percent of all income-eligible households. EAP also funded an energy-related repair program and a program that delivers energy education and budget counseling to clients. EAP also transfers funds to WAP.
• WAP Program – In a recent program year, the state WAP program used $20.2 million to deliver services to 1,782 low-income households. The Department’s WAP unit has developed detailed information on eligible housing units, service delivery quality control procedures, and client health and safety measures to guide the use of program funds.
The utilities can take advantage of these resources as they design and implement their low-income programs. However, collaboration is most effective when there are proactive partnerships at both the state and local levels. The Department needs to make sure that both the utilities and the local agencies understand the opportunities and limitations for use of leveraged funds in the context of the delivery of the WAP and EAP programs. Our in-depth interviews with Department staff, utilities, and local WAP service providers suggest that there are some missed opportunities for collaboration because of misunderstandings about program requirements.
Low Income CIP Evaluation Study: Summary Report APPRISE Incorporated 14
3.0 CIP Low-Income Spending Requirements
The components of the regulatory framework for the CIP low-income spending requirements are Statutes, Rules, Regulatory Decisions and Orders, and communications, instructions, and guidance documents published by the Department. The utilities use this set of information to develop Plans and file Status Reports that they perceive are consistent with policies and procedures. The Department uses this set of information to review the Plans and Status Reports and assess whether a utility's programs fulfill the low-income spending requirements.
3.1 Policies and Procedures for Spending Requirements
The different elements of the regulatory framework come together to define the policies and procedures established to ensure that utilities fulfill the statutory requirements with respect to the low-income spending requirement. Those policies and procedures include:
• Low-Income Spending Requirement Amount - Electric and gas utilities and associations are required to spend a specified percentage of their three-year average residential gross operating revenue (GOR) on low-income programs that "directly address the needs of low-income persons, including low-income renters."
• Planning and Reporting Requirements - IOUs are required to file a prospective Triennial Plan and Annual Status Reports that include information on their low-income programs and their compliance with the low-income spending requirements. COUs are required to submit data to the ESP that show their actual spending for the prior year and their planned spending for the upcoming year.
• Compliance - Department staff review Plans and Status Reports for compliance with low-income program guidelines and the low-income spending requirement, and publish Decisions summarizing the Commissioner's findings.
To ensure that the utilities meet the CIP low-income spending requirement, the Department defines required spending amounts, furnishes guidelines on programs that can be counted toward the spending requirement, reviews Plans and Status Reports for compliance, and issues findings related to compliance.
3.2 Issues with Current Policies and Procedures
There are some ambiguities in the current policies and procedures that lead to some uncertainty for Department staff and utility program managers. The outstanding issues include:
• Spending Requirements – The Department does not have a clear and consistent policy for how to address shortfalls with respect to utility compliance with spending requirements. There have
Low Income CIP Evaluation Study: Summary Report APPRISE Incorporated 15
only been a few instances in which IOUs did not meet the spending requirements, and each of those was resolved in a different way. For COUs, the Department identifies those utilities that fail to meet the spending requirement but does not specify any procedure for remediating the shortfall.
• Qualified Spending – The Department has not established a clear and consistent policy for what types of program spending qualify as low-income spending. Many of the utility in-depth interview respondents said that they want clearer guidelines from the Department. Some respondents said that they felt that Department decisions on eligible spending for certain types of buildings was “arbitrary.”
• Building Owner Contributions – There is no standard policy for the amount that an owner of a low-income building is expected to contribute to program costs. Currently, similar programs have different guidelines for owner contributions.
• Reporting on Low-Income Customers and Renters – Prior to the submission of the 2017-2019 Triennial Plans, IOUs were not required to report participation of low-income customers and renters in residential and commercial segment programs. The ESP system does not have a data field that would allow a COU to report the number of renters served.
Resolving these ambiguities should make it easier for utilities to comply with requirements and for Department staff to complete their reviews of utility filings.
Two examples of guidance issued by the Department help to illustrate the importance of developing and communicating guidance.
• Multifamily Building Guidance – In 2012, the Department issued guidance that furnished utilities with clear and concise information on which multifamily buildings were low-income. It appears that an important outcome of issuing this guidance was that, as utilities developed multifamily building programs, they were able to identify low-income multifamily buildings and offer them special incentives for participation.
• Energy Savings form Delivered Fuels – In 2012, the Department issued guidance that allows electric utilities to use CIP funds to deliver weatherization services to low-income households that heat with a delivered fuel. This guidance has the potential to increase the efficiency and effectiveness of low-income electric programs, particularly for COUs that serve rural service territories with many delivered fuel customers. However, our research found that some COUs are not aware of this guidance and that the COUs that were making use of the guidance were not reporting the information properly in the ESP and not getting credit for the energy savings specified by the guidance document.
These examples show that guidance documents can ensure that low-income customers participate in program innovations, but only if the utilities understand how to use the guidance.
Low Income CIP Evaluation Study: Summary Report APPRISE Incorporated 16
3.3 Low-Income Program Best Practices
One of the strengths of the Department’s approach to developing policies and procedures for the low-income spending requirements is that it has given utilities the responsibility of meeting the requirement within broad regulatory guidelines. Some jurisdictions require utilities to transfer all low-income funds to a publicly funded program or require utilities to work together on a single comprehensive low-income program with the intent of increasing program efficiency by leveraging existing program infrastructure. However, a potential drawback of this approach is that it can result in a program portfolio that is narrowly focused on only one segment of the low-income market. With greater freedom to design an array of programs, the utilities have invested some of their LI CIP funds in innovative programs that serve low-income customers in a different way or serve low-income market segments differently from those in some other jurisdictions.
However, our review of current low-income policies and procedures finds that in giving the utilities primary responsibility for program design and implementation, the Department has not ensured that the utilities have adopted best practices with respect to important program controls.
• Health and Safety Guidance – The Department has not made it clear whether the utility programs should adopt a specific set of assessment procedures to ensure the health and safety of low-income program participants, and has not given clear guidance on whether CIP funds should be used to pay for health and safety measures. The utilities are aware of the need to address these issues and, in the absence of guidance from the Department, each utility adopted a unique set of policies and procedures. Some utility in-depth interview respondents indicated that guidance from the Department is needed.
• Quality Control Procedures – The Department has not specified program quality control procedures. All utilities reported that their contractors are responsible for implementing quality control procedures. However, among the utilities, only Xcel had systematic procedures for verifying that contractors fulfilled those responsibilities. In most jurisdictions, the regulatory body takes responsibility for specifying those procedures.
• Measurement and Verification of Energy Savings – There are many benefits associated with conducting measurement and verification of energy savings for low-income programs. Key among those is getting better data on the relative performance of different types of low-income programs to ensure that an optimal set of programs has been implemented to address the needs of the low-income market. Currently, the Department requires M&V only for large custom projects. Most jurisdictions have systematic evaluation, measurement, and verification protocols for all programs.
• Evaluation of Program Process and Impacts – Most jurisdictions require that utilities conduct periodic evaluations to assess the extent to which the low-income programs are consistent with the needs of the low-income market. The CARD program has funded this study to assess the overall performance of the CIP low-income initiative. But, individual utilities have not been asked to conduct a systematic evaluation of their programs.
Low Income CIP Evaluation Study: Summary Report APPRISE Incorporated 17
The Department and the utilities already have good resources that could form the foundation for improved guidance. For example, WAP and many of the low-income program service providers already have good quality control procedures. The primary role of the Department would be to identify those existing protocols, work in collaboration with the utilities and the service providers to develop consistent guidance, and communicate that guidance to all utilities
Low Income CIP Evaluation Study: Summary Report APPRISE Incorporated 18
4.0 Natural Gas IOU LI CIP Programs
The five natural gas IOUs are required to spend 0.4 percent of their three-year average residential gross operating revenues on low-income programs. Our review of the 2014 Annual Status Reports supplemented with examination of the 2017-2019 Triennial Plans found that the natural gas IOUs have implemented an innovative set of low-income programs that meet or exceed the statutory and regulatory low-income program requirements. Some IOUs also implemented residential and commercial segment programs that furnish services to low-income customers.
4.1 Spending Compared to Requirements
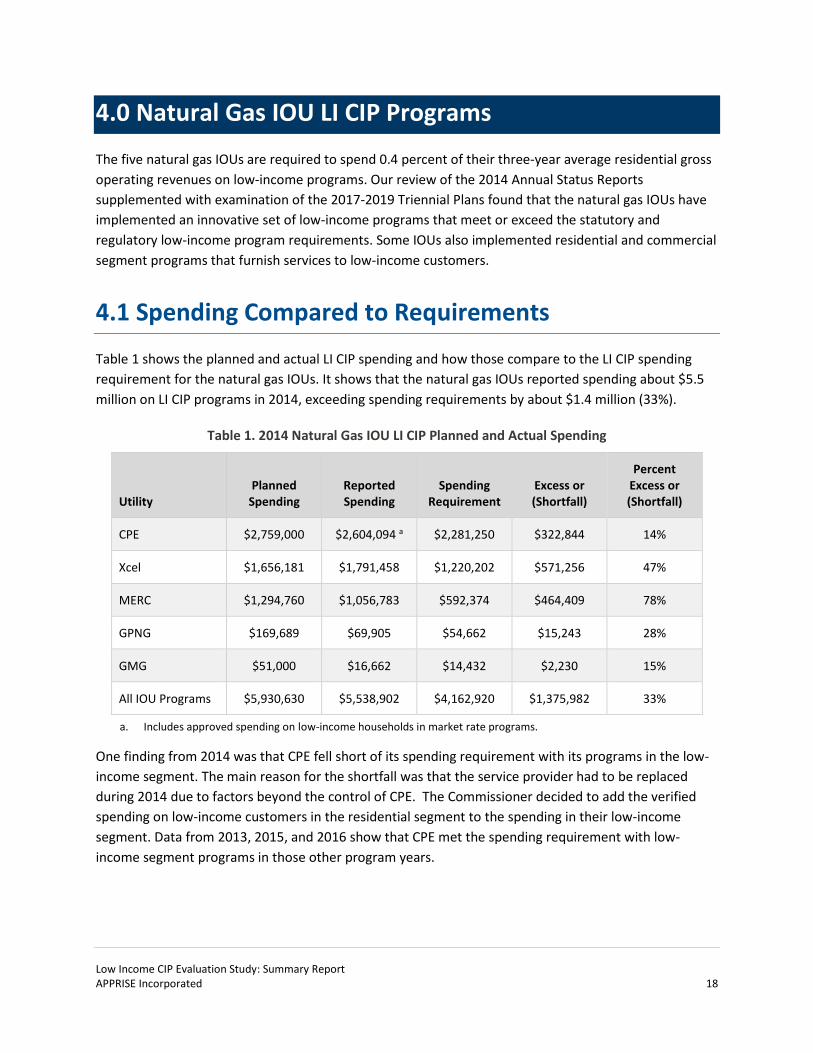
Table 1 shows the planned and actual LI CIP spending and how those compare to the LI CIP spending requirement for the natural gas IOUs. It shows that the natural gas IOUs reported spending about $5.5 million on LI CIP programs in 2014, exceeding spending requirements by about $1.4 million (33%).
Table 1. 2014 Natural Gas IOU LI CIP Planned and Actual Spending
Utility Planned
Spending Reported Spending
Spending Requirement
Excess or (Shortfall)
Percent Excess or (Shortfall)
CPE $2,759,000 $2,604,094 a $2,281,250 $322,844 14%
Xcel $1,656,181 $1,791,458 $1,220,202 $571,256 47%
MERC $1,294,760 $1,056,783 $592,374 $464,409 78%
GPNG $169,689 $69,905 $54,662 $15,243 28%
GMG $51,000 $16,662 $14,432 $2,230 15%
All IOU Programs $5,930,630 $5,538,902 $4,162,920 $1,375,982 33%
a. Includes approved spending on low-income households in market rate programs.
One finding from 2014 was that CPE fell short of its spending requirement with its programs in the low-income segment. The main reason for the shortfall was that the service provider had to be replaced during 2014 due to factors beyond the control of CPE. The Commissioner decided to add the verified spending on low-income customers in the residential segment to the spending in their low-income segment. Data from 2013, 2015, and 2016 show that CPE met the spending requirement with low-income segment programs in those other program years.
Low Income CIP Evaluation Study: Summary Report APPRISE Incorporated 19
4.2 Spending by Type of Service Delivered
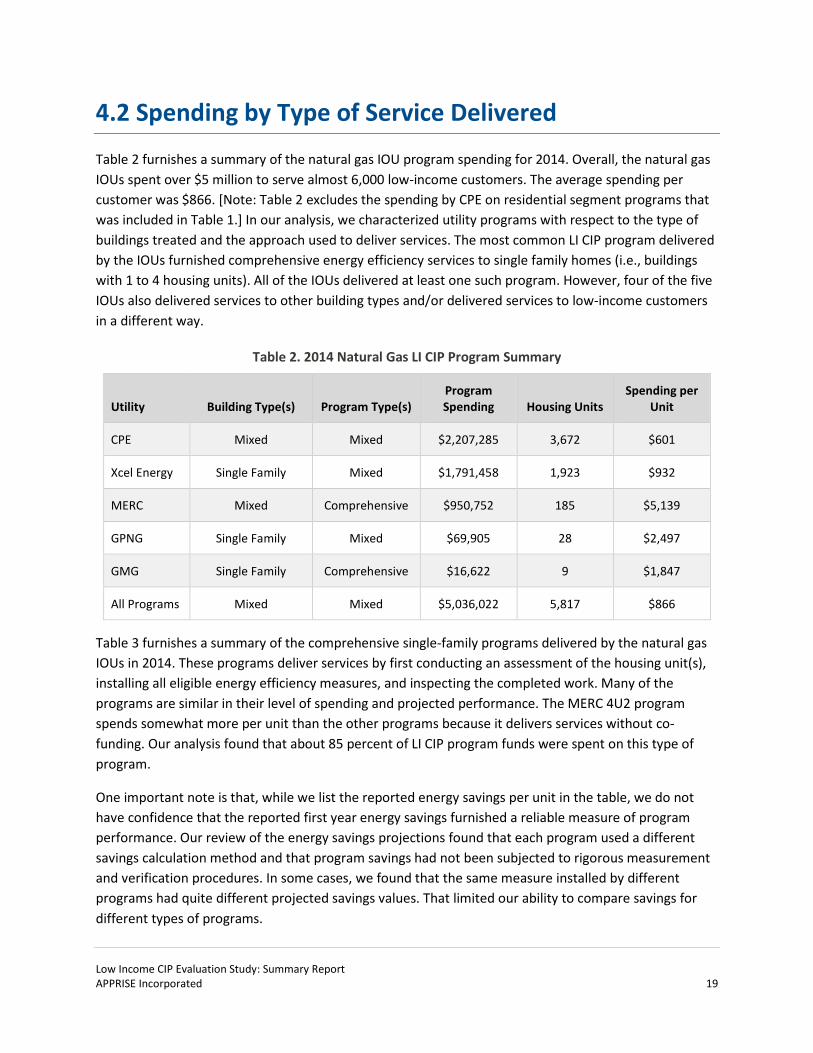
Table 2 furnishes a summary of the natural gas IOU program spending for 2014. Overall, the natural gas IOUs spent over $5 million to serve almost 6,000 low-income customers. The average spending per customer was $866. [Note: Table 2 excludes the spending by CPE on residential segment programs that was included in Table 1.] In our analysis, we characterized utility programs with respect to the type of buildings treated and the approach used to deliver services. The most common LI CIP program delivered by the IOUs furnished comprehensive energy efficiency services to single family homes (i.e., buildings with 1 to 4 housing units). All of the IOUs delivered at least one such program. However, four of the five IOUs also delivered services to other building types and/or delivered services to low-income customers in a different way.
Table 2. 2014 Natural Gas LI CIP Program Summary
Utility Building Type(s) Program Type(s) Program Spending Housing Units
Spending per Unit
CPE Mixed Mixed $2,207,285 3,672 $601
Xcel Energy Single Family Mixed $1,791,458 1,923 $932
MERC Mixed Comprehensive $950,752 185 $5,139
GPNG Single Family Mixed $69,905 28 $2,497
GMG Single Family Comprehensive $16,622 9 $1,847
All Programs Mixed Mixed $5,036,022 5,817 $866
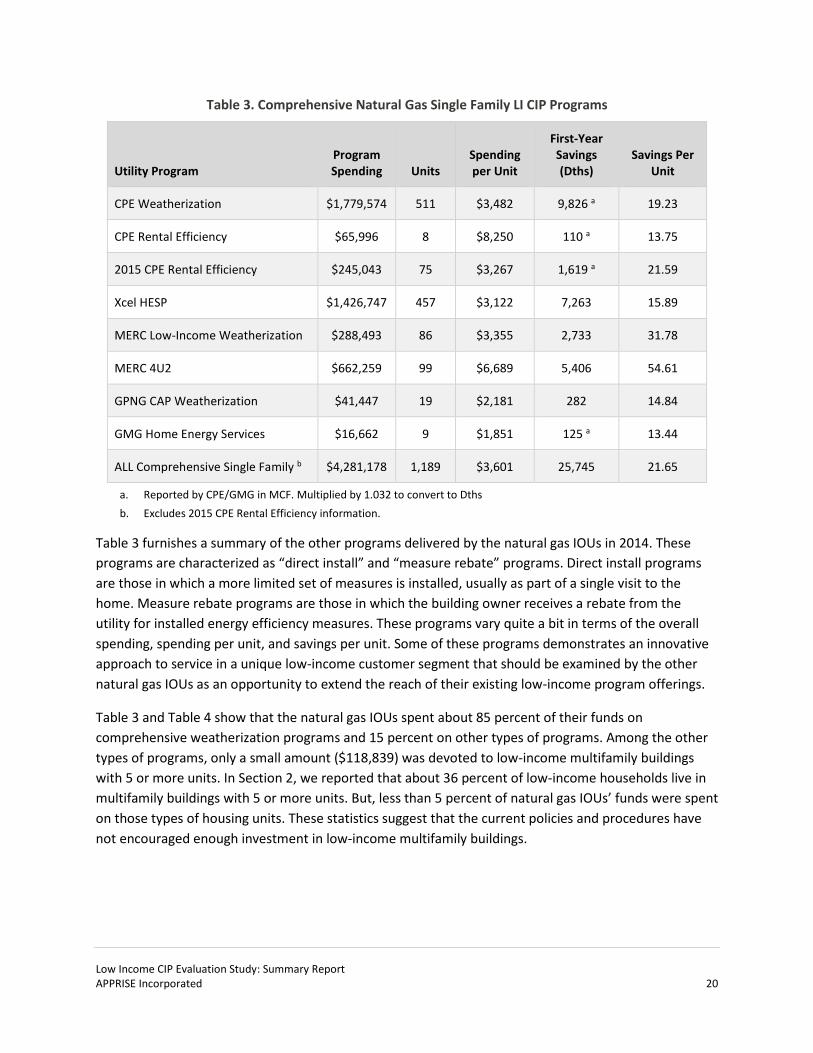
Table 3 furnishes a summary of the comprehensive single-family programs delivered by the natural gas IOUs in 2014. These programs deliver services by first conducting an assessment of the housing unit(s), installing all eligible energy efficiency measures, and inspecting the completed work. Many of the programs are similar in their level of spending and projected performance. The MERC 4U2 program spends somewhat more per unit than the other programs because it delivers services without co-funding. Our analysis found that about 85 percent of LI CIP program funds were spent on this type of program.
One important note is that, while we list the reported energy savings per unit in the table, we do not have confidence that the reported first year energy savings furnished a reliable measure of program performance. Our review of the energy savings projections found that each program used a different savings calculation method and that program savings had not been subjected to rigorous measurement and verification procedures. In some cases, we found that the same measure installed by different programs had quite different projected savings values. That limited our ability to compare savings for different types of programs.
Low Income CIP Evaluation Study: Summary Report APPRISE Incorporated 20
Table 3. Comprehensive Natural Gas Single Family LI CIP Programs
Utility Program Program Spending Units
Spending per Unit
First-Year Savings (Dths)
Savings Per Unit
CPE Weatherization $1,779,574 511 $3,482 9,826 a 19.23
CPE Rental Efficiency $65,996 8 $8,250 110 a 13.75
2015 CPE Rental Efficiency $245,043 75 $3,267 1,619 a 21.59
Xcel HESP $1,426,747 457 $3,122 7,263 15.89
MERC Low-Income Weatherization $288,493 86 $3,355 2,733 31.78
MERC 4U2 $662,259 99 $6,689 5,406 54.61
GPNG CAP Weatherization $41,447 19 $2,181 282 14.84
GMG Home Energy Services $16,662 9 $1,851 125 a 13.44
ALL Comprehensive Single Family b $4,281,178 1,189 $3,601 25,745 21.65
a. Reported by CPE/GMG in MCF. Multiplied by 1.032 to convert to Dths b. Excludes 2015 CPE Rental Efficiency information.
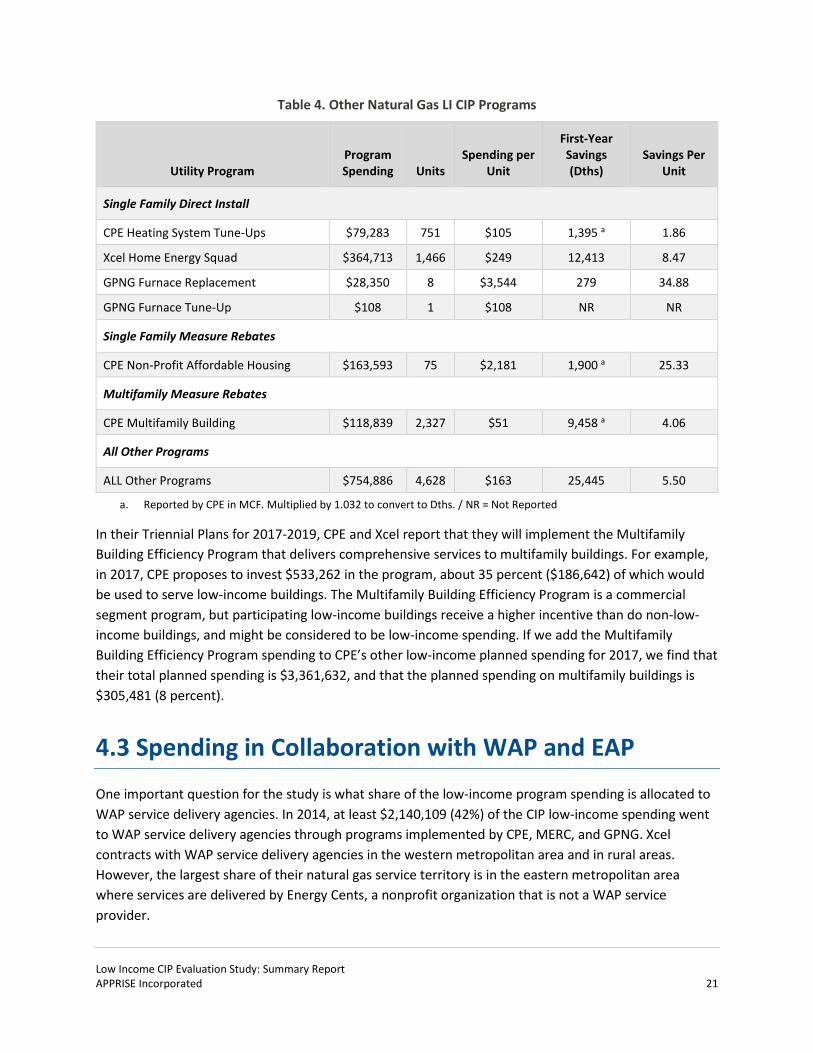
Table 3 furnishes a summary of the other programs delivered by the natural gas IOUs in 2014. These programs are characterized as “direct install” and “measure rebate” programs. Direct install programs are those in which a more limited set of measures is installed, usually as part of a single visit to the home. Measure rebate programs are those in which the building owner receives a rebate from the utility for installed energy efficiency measures. These programs vary quite a bit in terms of the overall spending, spending per unit, and savings per unit. Some of these programs demonstrates an innovative approach to service in a unique low-income customer segment that should be examined by the other natural gas IOUs as an opportunity to extend the reach of their existing low-income program offerings.
Table 3 and Table 4 show that the natural gas IOUs spent about 85 percent of their funds on comprehensive weatherization programs and 15 percent on other types of programs. Among the other types of programs, only a small amount ($118,839) was devoted to low-income multifamily buildings with 5 or more units. In Section 2, we reported that about 36 percent of low-income households live in multifamily buildings with 5 or more units. But, less than 5 percent of natural gas IOUs’ funds were spent on those types of housing units. These statistics suggest that the current policies and procedures have not encouraged enough investment in low-income multifamily buildings.
Low Income CIP Evaluation Study: Summary Report APPRISE Incorporated 21
Table 4. Other Natural Gas LI CIP Programs
Utility Program Program Spending Units
Spending per Unit
First-Year Savings (Dths)
Savings Per Unit
Single Family Direct Install
CPE Heating System Tune-Ups $79,283 751 $105 1,395 a 1.86
Xcel Home Energy Squad $364,713 1,466 $249 12,413 8.47
GPNG Furnace Replacement $28,350 8 $3,544 279 34.88
GPNG Furnace Tune-Up $108 1 $108 NR NR
Single Family Measure Rebates
CPE Non-Profit Affordable Housing $163,593 75 $2,181 1,900 a 25.33
Multifamily Measure Rebates
CPE Multifamily Building $118,839 2,327 $51 9,458 a 4.06
All Other Programs
ALL Other Programs $754,886 4,628 $163 25,445 5.50
a. Reported by CPE in MCF. Multiplied by 1.032 to convert to Dths. / NR = Not Reported
In their Triennial Plans for 2017-2019, CPE and Xcel report that they will implement the Multifamily Building Efficiency Program that delivers comprehensive services to multifamily buildings. For example, in 2017, CPE proposes to invest $533,262 in the program, about 35 percent ($186,642) of which would be used to serve low-income buildings. The Multifamily Building Efficiency Program is a commercial segment program, but participating low-income buildings receive a higher incentive than do non-low-income buildings, and might be considered to be low-income spending. If we add the Multifamily Building Efficiency Program spending to CPE’s other low-income planned spending for 2017, we find that their total planned spending is $3,361,632, and that the planned spending on multifamily buildings is $305,481 (8 percent).
4.3 Spending in Collaboration with WAP and EAP
One important question for the study is what share of the low-income program spending is allocated to WAP service delivery agencies. In 2014, at least $2,140,109 (42%) of the CIP low-income spending went to WAP service delivery agencies through programs implemented by CPE, MERC, and GPNG. Xcel contracts with WAP service delivery agencies in the western metropolitan area and in rural areas. However, the largest share of their natural gas service territory is in the eastern metropolitan area where services are delivered by Energy Cents, a nonprofit organization that is not a WAP service provider.
Low Income CIP Evaluation Study: Summary Report APPRISE Incorporated 22
EAP funds an Energy Related Repair (ERR) program that repairs or replaces malfunctioning heating equipment for more than 5,000 low-income households. The EAP program furnishes guidance to service delivery agencies on how to apply for utility rebates when high efficiency equipment is installed in the home of a low-income household. However, there is no direct coordination between the EAP program and the utilities. Our in-depth interviews found that utility low-income program managers often are not aware of the EAP program.
4.4 Spending on Low-Income Renters
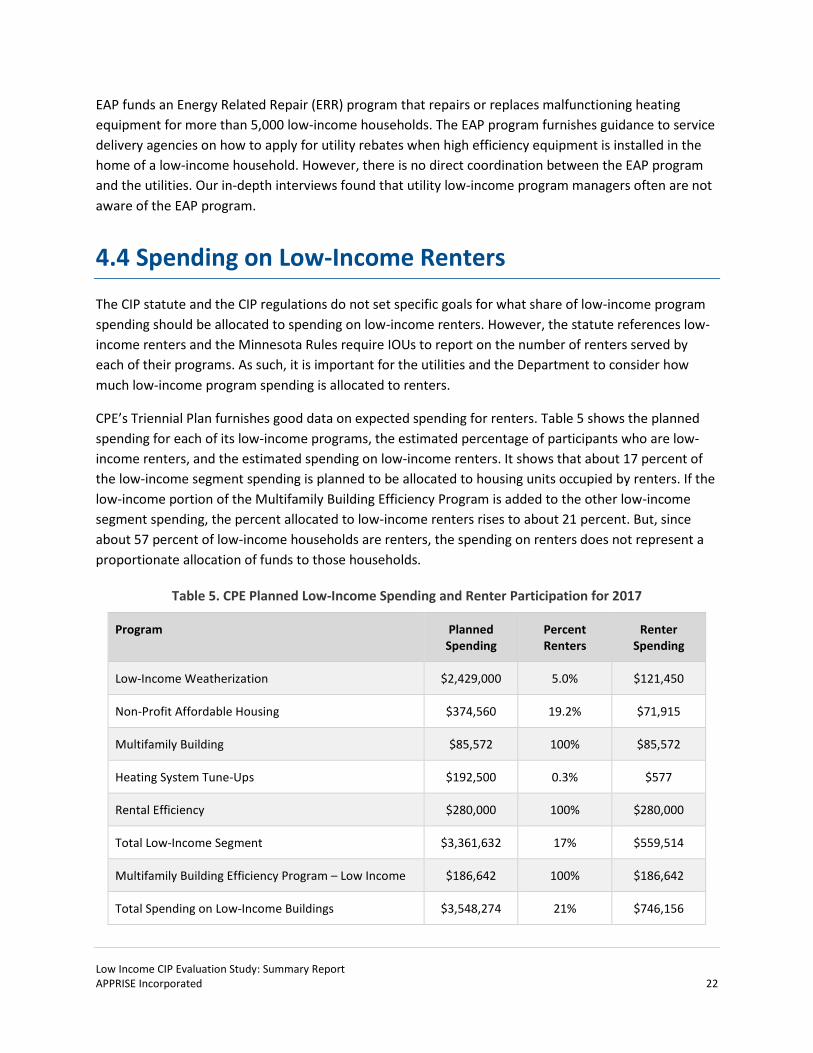
The CIP statute and the CIP regulations do not set specific goals for what share of low-income program spending should be allocated to spending on low-income renters. However, the statute references low-income renters and the Minnesota Rules require IOUs to report on the number of renters served by each of their programs. As such, it is important for the utilities and the Department to consider how much low-income program spending is allocated to renters.
CPE’s Triennial Plan furnishes good data on expected spending for renters. Table 5 shows the planned spending for each of its low-income programs, the estimated percentage of participants who are low-income renters, and the estimated spending on low-income renters. It shows that about 17 percent of the low-income segment spending is planned to be allocated to housing units occupied by renters. If the low-income portion of the Multifamily Building Efficiency Program is added to the other low-income segment spending, the percent allocated to low-income renters rises to about 21 percent. But, since about 57 percent of low-income households are renters, the spending on renters does not represent a proportionate allocation of funds to those households.
Table 5. CPE Planned Low-Income Spending and Renter Participation for 2017
Program Planned Spending
Percent Renters
Renter Spending
Low-Income Weatherization $2,429,000 5.0% $121,450
Non-Profit Affordable Housing $374,560 19.2% $71,915
Multifamily Building $85,572 100% $85,572
Heating System Tune-Ups $192,500 0.3% $577
Rental Efficiency $280,000 100% $280,000
Total Low-Income Segment $3,361,632 17% $559,514
Multifamily Building Efficiency Program – Low Income $186,642 100% $186,642
Total Spending on Low-Income Buildings $3,548,274 21% $746,156
Low Income CIP Evaluation Study: Summary Report APPRISE Incorporated 23
4.5 Innovative Programs
The comprehensive single family weatherization programs account about for 85 percent of the natural gas IOUs low-income program spending and deliver important services to low-income customers. They deliver substantial energy savings over the long-term, as well as non-energy benefits to low-income households. These programs represent a good investment in energy sustainability for the low-income households served by the program.
However, as indicated in Table 5, the CPE single-family weatherization program serves mostly owner-occupied single family homes. Population statistics show that those households represent about 42 percent of all low-income households. Several of the IOUs have designed and implemented smaller scale programs that treat different market segments and approach the delivery of energy efficiency services in a different way. It is important to identify those innovative program models for consideration by other utilities. These programs include:
• CPE Nonprofit Affordable Housing Project – CPE worked with Affordable Housing Organizations to help them install high-efficiency equipment and building shell measures in housing units being constructed or rehabilitated.
• CPE Multifamily Building Project – CPE worked directly with owners of low-income buildings to furnish rebates for building-level heating and water heating equipment that would help to make those buildings more energy efficient.
• CPE Rental Efficiency Project – CPE contracted with Energy Cents to work with owners of low-income renter-occupied buildings to install building-level and unit-level measures.
• CPE Heating System Tune-Ups – CPE delivered heating system tune-ups to a large number of low-income households prior to the heating season.
• Xcel Low-Income Home Energy Squad - This is a low-cost direct install program in which a limited set of program services are delivered at no cost to households in a single visit. The LI-HES program has high projected first year energy savings for a comparatively low cost. In addition, the LI-HES program offers IOUs an effective way to screen low-income households for the delivery of more comprehensive program services.
• MERC 4U2 Program - The 4U2 program was designed to serve households that are not served by the EAP and WAP programs; it serves moderate-income customers with incomes up to 300 percent of the poverty guidelines. MERC reports that over 50 percent of the customers that participate have incomes at or below the WAP and EAP guidelines, but have not previously participated in those programs.
Each of these programs offers a different way to deliver program services. Some are estimated to have societal cost-effectiveness ratios greater than 1.0. However, one limitation of the analysis is that none have been subjected to rigorous measurement and verification procedures that would give the other utilities confidence that the program operates as effectively as is projected.
Low Income CIP Evaluation Study: Summary Report APPRISE Incorporated 24
4.6 Summary of Findings
The natural gas IOUs have implemented an innovative set of low-income programs that meet or exceed the low-income program spending requirements. The IOUs collaborate with WAP service delivery agencies that take advantage of the existing program infrastructure. They also have implemented a number of programs that demonstrate effective ways of serving other low-income market segments.
The natural gas IOUs’ programs are most successful at delivering comprehensive services to owner-occupied single family (1-4 unit) homes. Some utilities have developed programs that are effective at serving renters and multifamily buildings. The population of low-income households could be better served if those programs were expanded.
It is challenging for natural gas IOUs to use the experiences of other utilities to decide whether an innovative program model would benefit its customers. Since each utility uses its own procedure for estimating first-year savings and none of the utilities have implemented rigorous measurement as verification procedures, it is difficult for an IOU to know how the addition of a new program model would affect the performance of its LI CIP program portfolio. Implementation of more standardized measurement and verification procedures, along with the establishment of some type of forum for IOUs to share their program experiences might help to resolve that issue and stimulate additional innovation in IOU low-income programs.
Low Income CIP Evaluation Study: Summary Report APPRISE Incorporated 25
5.0 Electric IOU Programs
The three electric IOUs are required to spend 0.2 percent of their three-year average residential gross operating revenues on low-income programs. Our review of the 2014 Annual Status Reports supplemented with examination of the 2017-2019 Triennial Plans found that the electric IOUs have implemented an innovative set of low-income programs that meet or exceed the statutory and regulatory low-income program requirements. Xcel also implemented a program in their commercial segment portfolios that furnishes services to low-income customers.
5.1 Spending Compared to Requirements
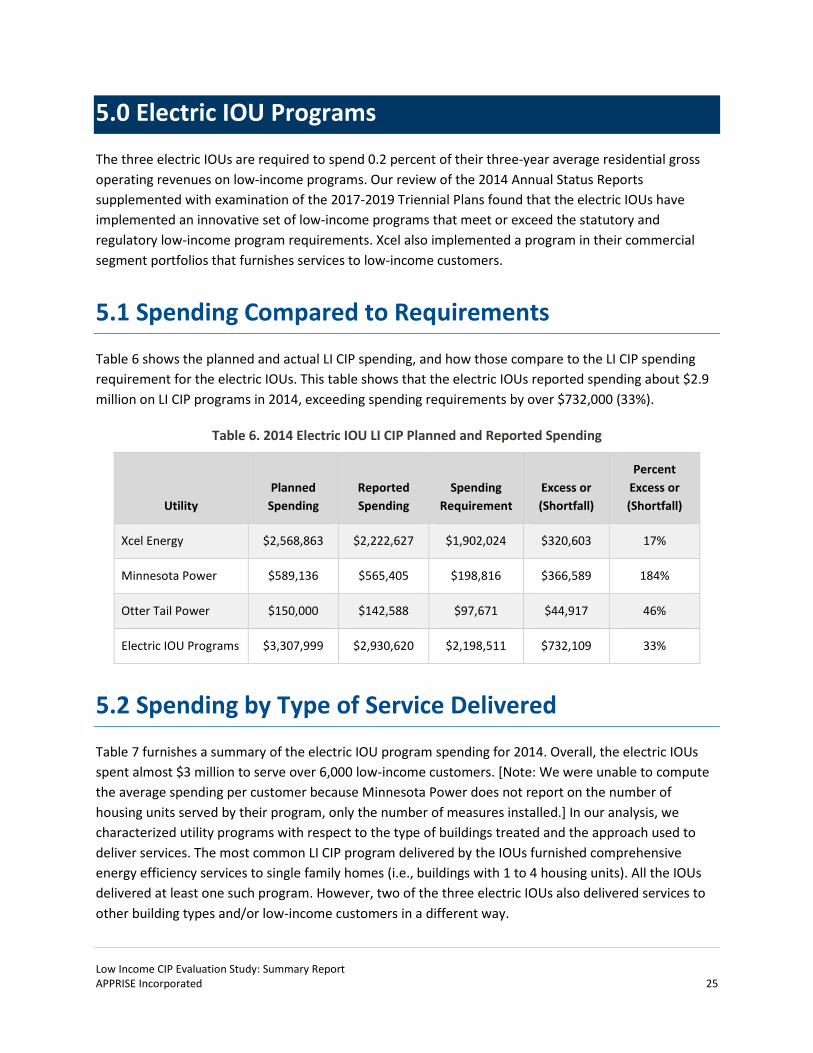
Table 6 shows the planned and actual LI CIP spending, and how those compare to the LI CIP spending requirement for the electric IOUs. This table shows that the electric IOUs reported spending about $2.9 million on LI CIP programs in 2014, exceeding spending requirements by over $732,000 (33%).
Table 6. 2014 Electric IOU LI CIP Planned and Reported Spending
Utility Planned
Spending Reported Spending
Spending Requirement
Excess or (Shortfall)
Percent Excess or (Shortfall)
Xcel Energy $2,568,863 $2,222,627 $1,902,024 $320,603 17%
Minnesota Power $589,136 $565,405 $198,816 $366,589 184%
Otter Tail Power $150,000 $142,588 $97,671 $44,917 46%
Electric IOU Programs $3,307,999 $2,930,620 $2,198,511 $732,109 33%
5.2 Spending by Type of Service Delivered
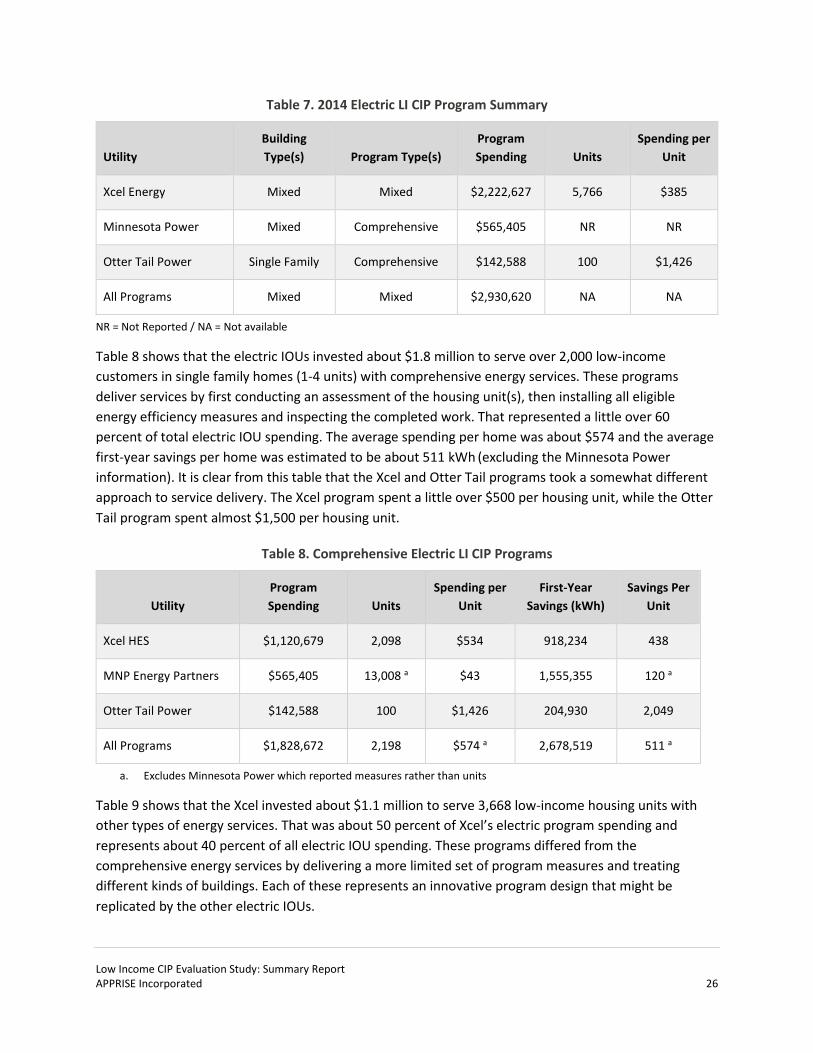
Table 7 furnishes a summary of the electric IOU program spending for 2014. Overall, the electric IOUs spent almost $3 million to serve over 6,000 low-income customers. [Note: We were unable to compute the average spending per customer because Minnesota Power does not report on the number of housing units served by their program, only the number of measures installed.] In our analysis, we characterized utility programs with respect to the type of buildings treated and the approach used to deliver services. The most common LI CIP program delivered by the IOUs furnished comprehensive energy efficiency services to single family homes (i.e., buildings with 1 to 4 housing units). All the IOUs delivered at least one such program. However, two of the three electric IOUs also delivered services to other building types and/or low-income customers in a different way.
Low Income CIP Evaluation Study: Summary Report APPRISE Incorporated 26
Table 7. 2014 Electric LI CIP Program Summary
Utility Building Type(s) Program Type(s)
Program Spending Units
Spending per Unit
Xcel Energy Mixed Mixed $2,222,627 5,766 $385
Minnesota Power Mixed Comprehensive $565,405 NR NR
Otter Tail Power Single Family Comprehensive $142,588 100 $1,426
All Programs Mixed Mixed $2,930,620 NA NA
NR = Not Reported / NA = Not available
Table 8 shows that the electric IOUs invested about $1.8 million to serve over 2,000 low-income customers in single family homes (1-4 units) with comprehensive energy services. These programs deliver services by first conducting an assessment of the housing unit(s), then installing all eligible energy efficiency measures and inspecting the completed work. That represented a little over 60 percent of total electric IOU spending. The average spending per home was about $574 and the average first-year savings per home was estimated to be about 511 kWh (excluding the Minnesota Power information). It is clear from this table that the Xcel and Otter Tail programs took a somewhat different approach to service delivery. The Xcel program spent a little over $500 per housing unit, while the Otter Tail program spent almost $1,500 per housing unit.
Table 8. Comprehensive Electric LI CIP Programs
Utility Program Spending Units
Spending per Unit
First-Year Savings (kWh)
Savings Per Unit
Xcel HES $1,120,679 2,098 $534 918,234 438
MNP Energy Partners $565,405 13,008 a $43 1,555,355 120 a
Otter Tail Power $142,588 100 $1,426 204,930 2,049
All Programs $1,828,672 2,198 $574 a 2,678,519 511 a
a. Excludes Minnesota Power which reported measures rather than units
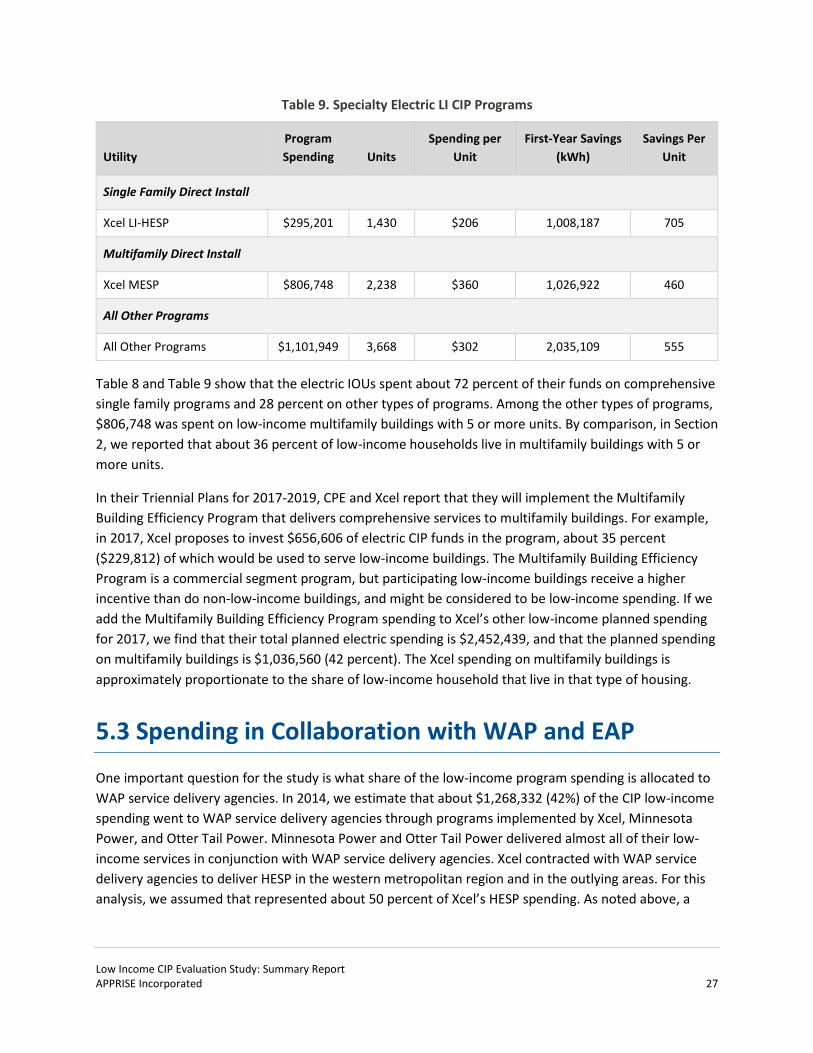
Table 9 shows that the Xcel invested about $1.1 million to serve 3,668 low-income housing units with other types of energy services. That was about 50 percent of Xcel’s electric program spending and represents about 40 percent of all electric IOU spending. These programs differed from the comprehensive energy services by delivering a more limited set of program measures and treating different kinds of buildings. Each of these represents an innovative program design that might be replicated by the other electric IOUs.
Low Income CIP Evaluation Study: Summary Report APPRISE Incorporated 27
Table 9. Specialty Electric LI CIP Programs
Utility Program Spending Units
Spending per Unit
First-Year Savings (kWh)
Savings Per Unit
Single Family Direct Install
Xcel LI-HESP $295,201 1,430 $206 1,008,187 705
Multifamily Direct Install
Xcel MESP $806,748 2,238 $360 1,026,922 460
All Other Programs
All Other Programs $1,101,949 3,668 $302 2,035,109 555
Table 8 and Table 9 show that the electric IOUs spent about 72 percent of their funds on comprehensive single family programs and 28 percent on other types of programs. Among the other types of programs, $806,748 was spent on low-income multifamily buildings with 5 or more units. By comparison, in Section 2, we reported that about 36 percent of low-income households live in multifamily buildings with 5 or more units.
In their Triennial Plans for 2017-2019, CPE and Xcel report that they will implement the Multifamily Building Efficiency Program that delivers comprehensive services to multifamily buildings. For example, in 2017, Xcel proposes to invest $656,606 of electric CIP funds in the program, about 35 percent ($229,812) of which would be used to serve low-income buildings. The Multifamily Building Efficiency Program is a commercial segment program, but participating low-income buildings receive a higher incentive than do non-low-income buildings, and might be considered to be low-income spending. If we add the Multifamily Building Efficiency Program spending to Xcel’s other low-income planned spending for 2017, we find that their total planned electric spending is $2,452,439, and that the planned spending on multifamily buildings is $1,036,560 (42 percent). The Xcel spending on multifamily buildings is approximately proportionate to the share of low-income household that live in that type of housing.
5.3 Spending in Collaboration with WAP and EAP
One important question for the study is what share of the low-income program spending is allocated to WAP service delivery agencies. In 2014, we estimate that about $1,268,332 (42%) of the CIP low-income spending went to WAP service delivery agencies through programs implemented by Xcel, Minnesota Power, and Otter Tail Power. Minnesota Power and Otter Tail Power delivered almost all of their low-income services in conjunction with WAP service delivery agencies. Xcel contracted with WAP service delivery agencies to deliver HESP in the western metropolitan region and in the outlying areas. For this analysis, we assumed that represented about 50 percent of Xcel’s HESP spending. As noted above, a
Low Income CIP Evaluation Study: Summary Report APPRISE Incorporated 28
significant share of Xcel’s spending is on large multifamily buildings. Few of the Minnesota WAP service delivery agencies deliver services to those buildings.
5.4 Spending on Low-Income Renters
The CIP statute and the CIP regulations do not set specific goals for what share of low-income program spending should be allocated to spending on low-income renters. However, the statute references low-income renters and the Minnesota Rules require IOUs to report on the number of renters served by each of their programs. As such, it is reasonable to suggest that it is important for the utilities to consider how much of their low-income program spending is allocated to low-income renters.
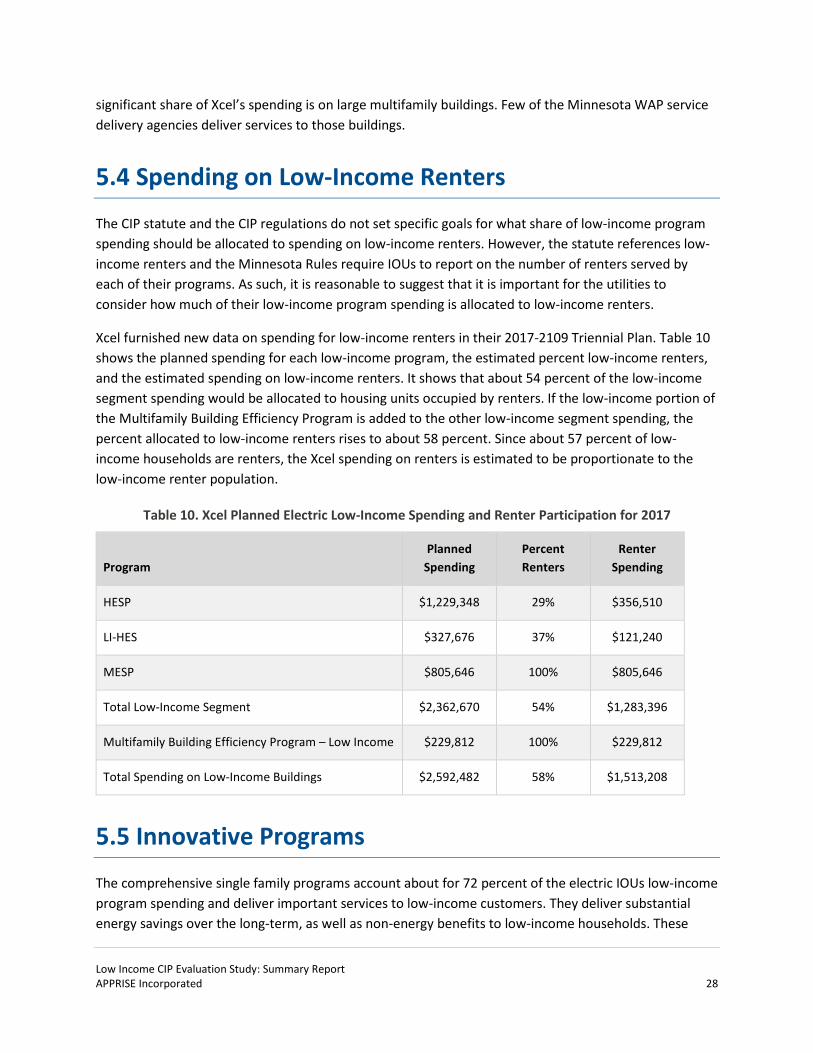
Xcel furnished new data on spending for low-income renters in their 2017-2109 Triennial Plan. Table 10 shows the planned spending for each low-income program, the estimated percent low-income renters, and the estimated spending on low-income renters. It shows that about 54 percent of the low-income segment spending would be allocated to housing units occupied by renters. If the low-income portion of the Multifamily Building Efficiency Program is added to the other low-income segment spending, the percent allocated to low-income renters rises to about 58 percent. Since about 57 percent of low-income households are renters, the Xcel spending on renters is estimated to be proportionate to the low-income renter population.
Table 10. Xcel Planned Electric Low-Income Spending and Renter Participation for 2017
Program Planned
Spending Percent Renters
Renter Spending
HESP $1,229,348 29% $356,510
LI-HES $327,676 37% $121,240
MESP $805,646 100% $805,646
Total Low-Income Segment $2,362,670 54% $1,283,396
Multifamily Building Efficiency Program – Low Income $229,812 100% $229,812
Total Spending on Low-Income Buildings $2,592,482 58% $1,513,208
5.5 Innovative Programs
The comprehensive single family programs account about for 72 percent of the electric IOUs low-income program spending and deliver important services to low-income customers. They deliver substantial energy savings over the long-term, as well as non-energy benefits to low-income households. These
Low Income CIP Evaluation Study: Summary Report APPRISE Incorporated 29
programs represent a good investment in energy sustainability for the low-income households served by the program.
However, Xcel also has invested in other types of programs that might be replicated by the other electric IOUs or electric COUs. They include:
• Low-Income Home Energy Squad (LI-HES) - This is a low-cost direct install program in which a limited set of program services are delivered at no cost to households in a single visit. The LI-HES program has high projected first year energy savings for a comparatively low cost. In addition, the LI-HES program offers IOUs an effective way to screen low-income households for the delivery of more comprehensive program services.
• Multifamily Energy Savings Program (MESP) – This program furnishes direct install of in-unit energy efficiency measures in buildings that are determined to be low-income based on the Department’s guidance.
These programs offer a different way to deliver program services. Some are estimated to have societal cost-effectiveness ratios greater than 1.0. However, one limitation of the analysis is that none have been subjected to rigorous measurement and verification procedures that would give the other utilities confidence that the program operates as effectively as is projected.
5.6 Summary of Findings
The electric IOUs have implemented an innovative set of low-income programs that meet or exceed the low-income program spending requirements. The IOUs collaborate with WAP service delivery agencies that take advantage of the existing program infrastructure. They also have implemented programs that demonstrate effective ways of serving other low-income market segments.
The electric IOUs as a group, and Xcel in particular, appear to be serving all segments of the low-income market. They serve both single family homes and multifamily buildings. They spend more than one-half of their program funds delivering services to low-income renters.
However, it is challenging for electric IOUs to use the experiences of other utilities to decide whether an innovative program model would benefit its customers. Since each utility uses its own procedure for estimating first-year savings and none of the utilities have implemented rigorous measurement as verification procedures, it is difficult for an IOU to know how the addition of a new program model would affect the performance of its LI CIP program portfolio. Implementation of more standardized measurement and verification procedures, along with the establishment of some type of forum for IOUs to share their program experiences might help to resolve that issue and stimulate additional innovation in IOU low-income programs.
Low Income CIP Evaluation Study: Summary Report APPRISE Incorporated 30
6.0 Community Owned Utility (COU) Programs
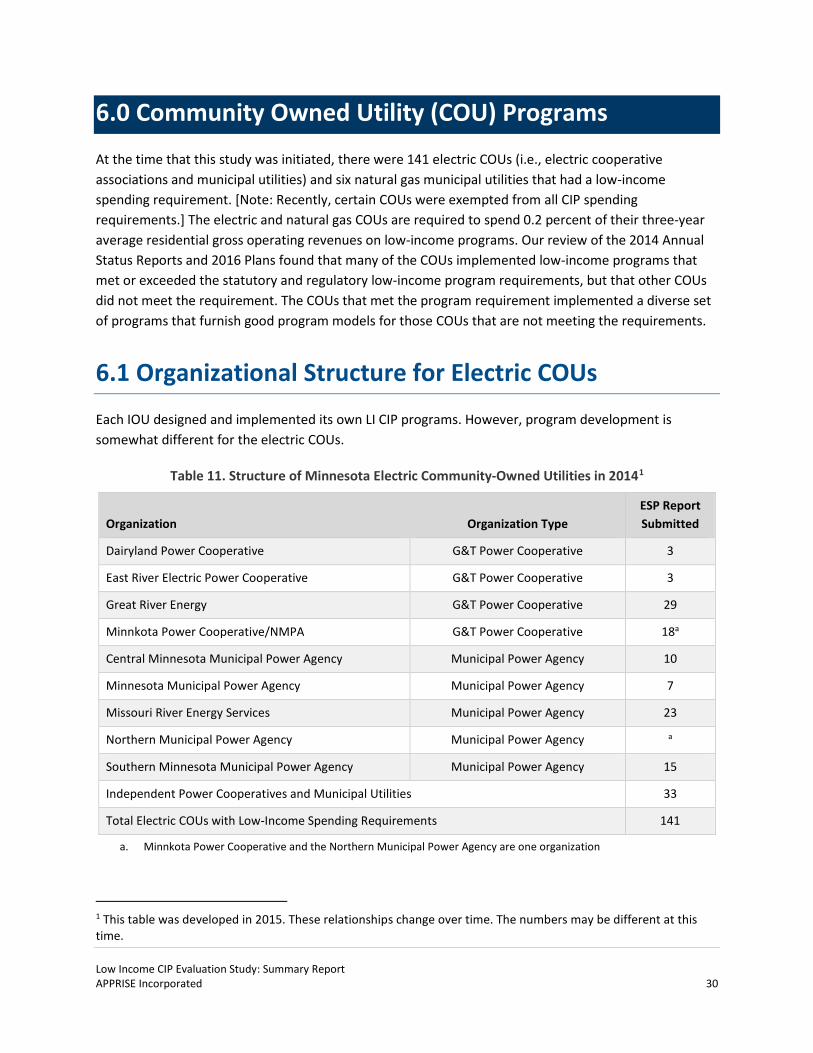
At the time that this study was initiated, there were 141 electric COUs (i.e., electric cooperative associations and municipal utilities) and six natural gas municipal utilities that had a low-income spending requirement. [Note: Recently, certain COUs were exempted from all CIP spending requirements.] The electric and natural gas COUs are required to spend 0.2 percent of their three-year average residential gross operating revenues on low-income programs. Our review of the 2014 Annual Status Reports and 2016 Plans found that many of the COUs implemented low-income programs that met or exceeded the statutory and regulatory low-income program requirements, but that other COUs did not meet the requirement. The COUs that met the program requirement implemented a diverse set of programs that furnish good program models for those COUs that are not meeting the requirements.
6.1 Organizational Structure for Electric COUs
Each IOU designed and implemented its own LI CIP programs. However, program development is somewhat different for the electric COUs.
Table 11. Structure of Minnesota Electric Community-Owned Utilities in 20141
Organization Organization Type ESP Report Submitted
Dairyland Power Cooperative G&T Power Cooperative 3
East River Electric Power Cooperative G&T Power Cooperative 3
Great River Energy G&T Power Cooperative 29
Minnkota Power Cooperative/NMPA G&T Power Cooperative 18a
Central Minnesota Municipal Power Agency Municipal Power Agency 10
Minnesota Municipal Power Agency Municipal Power Agency 7
Missouri River Energy Services Municipal Power Agency 23
Northern Municipal Power Agency Municipal Power Agency a
Southern Minnesota Municipal Power Agency Municipal Power Agency 15
Independent Power Cooperatives and Municipal Utilities 33
Total Electric COUs with Low-Income Spending Requirements 141
a. Minnkota Power Cooperative and the Northern Municipal Power Agency are one organization
1 This table was developed in 2015. These relationships change over time. The numbers may be different at this time.
Low Income CIP Evaluation Study: Summary Report APPRISE Incorporated 31
Most of the electric COUs are members of a generation and transmission power cooperative (electric co-ops) or a municipal power agency (municipals). The CIP statute allows the power cooperatives and municipal power agencies to fulfill their member CIP program responsibilities in aggregate, including their spending requirements and energy savings requirements. As a result, some of the power cooperatives and municipal power agencies have a major role in the design and implementation of CIP programs.
Table 11 shows the number of COUs for which each organization submits reports to the ESP. However, the information in the ESP does not indicate whether the organization or the individual COUs take responsibility for programs. Our in-depth interviews with five of these organizations found that three played an important role in program development while the other two only took responsibility for program reporting. This analysis shows that any initiatives to improve programs should include, but not be restricted to, communication with the power cooperatives and municipal power agencies.
The small number of natural gas COUs that have LI CIP spending requirements each take responsibility for design and implementation of their own programs.
6.2 Spending Compared to Requirements
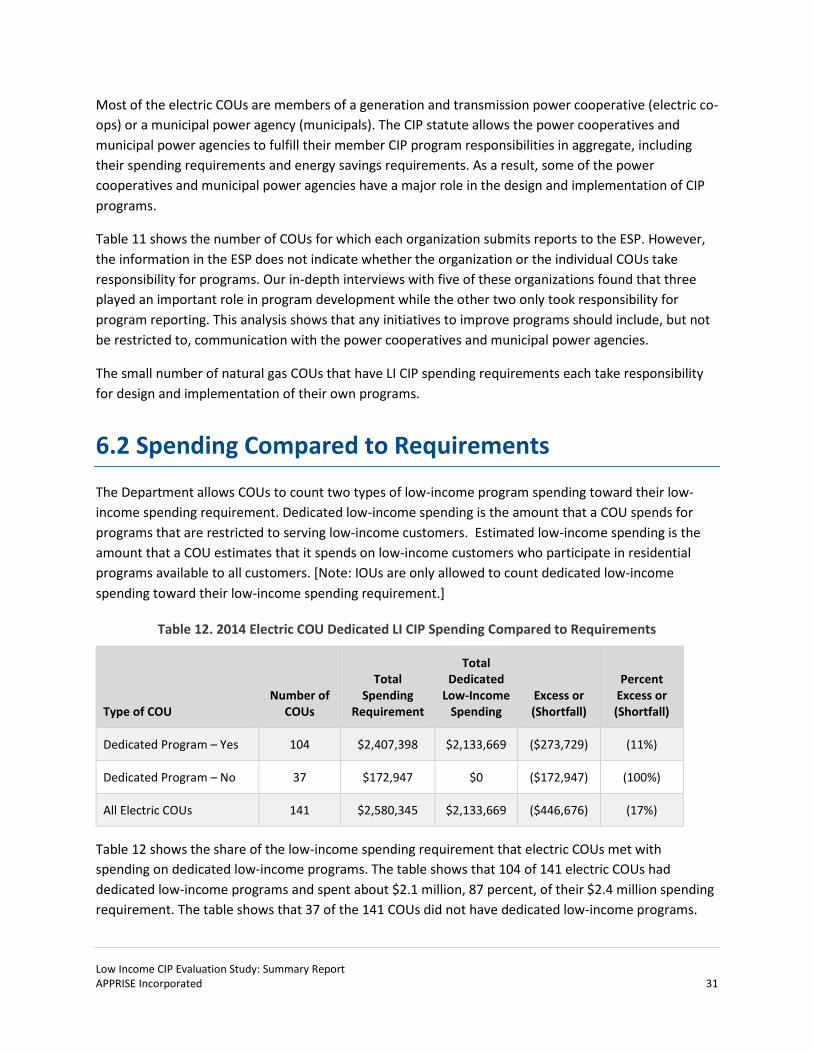
The Department allows COUs to count two types of low-income program spending toward their low-income spending requirement. Dedicated low-income spending is the amount that a COU spends for programs that are restricted to serving low-income customers. Estimated low-income spending is the amount that a COU estimates that it spends on low-income customers who participate in residential programs available to all customers. [Note: IOUs are only allowed to count dedicated low-income spending toward their low-income spending requirement.]
Table 12. 2014 Electric COU Dedicated LI CIP Spending Compared to Requirements
Type of COU Number of
COUs
Total Spending
Requirement
Total Dedicated
Low-Income Spending
Excess or (Shortfall)
Percent Excess or (Shortfall)
Dedicated Program – Yes 104 $2,407,398 $2,133,669 ($273,729) (11%)
Dedicated Program – No 37 $172,947 $0 ($172,947) (100%)
All Electric COUs 141 $2,580,345 $2,133,669 ($446,676) (17%)
Table 12 shows the share of the low-income spending requirement that electric COUs met with spending on dedicated low-income programs. The table shows that 104 of 141 electric COUs had dedicated low-income programs and spent about $2.1 million, 87 percent, of their $2.4 million spending requirement. The table shows that 37 of the 141 COUs did not have dedicated low-income programs.
Low Income CIP Evaluation Study: Summary Report APPRISE Incorporated 32
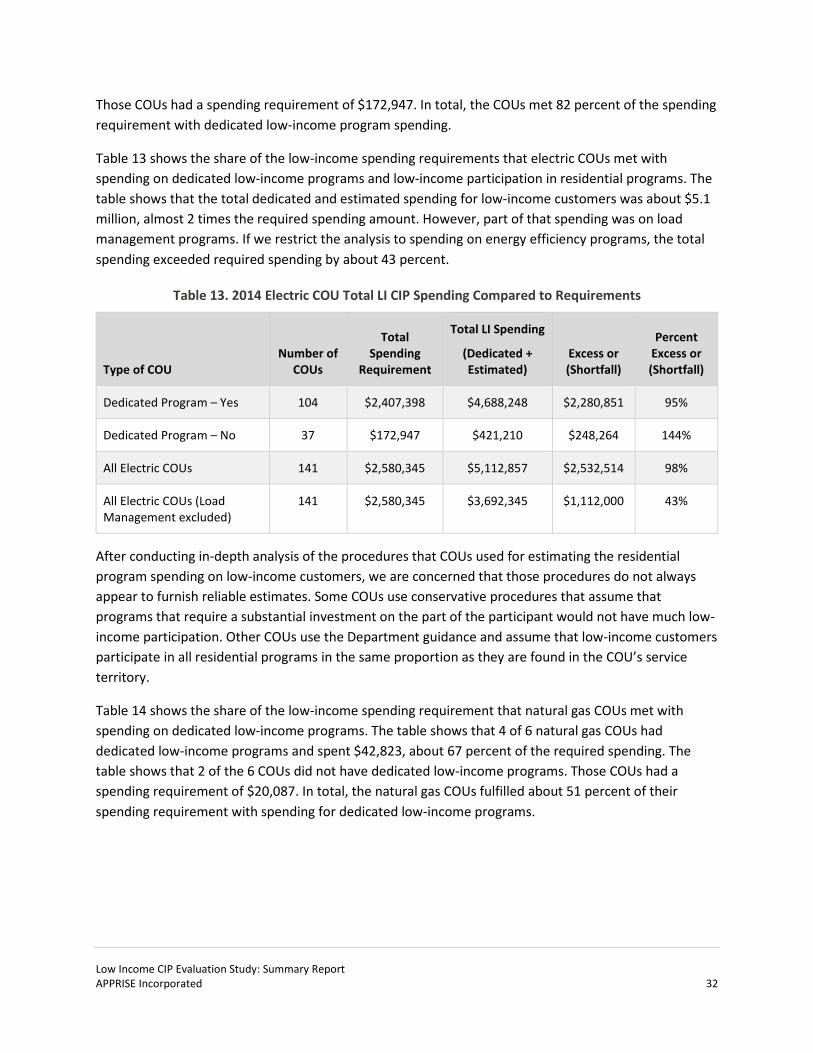
Those COUs had a spending requirement of $172,947. In total, the COUs met 82 percent of the spending requirement with dedicated low-income program spending.
Table 13 shows the share of the low-income spending requirements that electric COUs met with spending on dedicated low-income programs and low-income participation in residential programs. The table shows that the total dedicated and estimated spending for low-income customers was about $5.1 million, almost 2 times the required spending amount. However, part of that spending was on load management programs. If we restrict the analysis to spending on energy efficiency programs, the total spending exceeded required spending by about 43 percent.
Table 13. 2014 Electric COU Total LI CIP Spending Compared to Requirements
Type of COU Number of
COUs
Total Spending
Requirement
Total LI Spending
(Dedicated + Estimated)
Excess or (Shortfall)
Percent Excess or (Shortfall)
Dedicated Program – Yes 104 $2,407,398 $4,688,248 $2,280,851 95%
Dedicated Program – No 37 $172,947 $421,210 $248,264 144%
All Electric COUs 141 $2,580,345 $5,112,857 $2,532,514 98%
All Electric COUs (Load Management excluded)
141 $2,580,345 $3,692,345 $1,112,000 43%
After conducting in-depth analysis of the procedures that COUs used for estimating the residential program spending on low-income customers, we are concerned that those procedures do not always appear to furnish reliable estimates. Some COUs use conservative procedures that assume that programs that require a substantial investment on the part of the participant would not have much low-income participation. Other COUs use the Department guidance and assume that low-income customers participate in all residential programs in the same proportion as they are found in the COU’s service territory.
Table 14 shows the share of the low-income spending requirement that natural gas COUs met with spending on dedicated low-income programs. The table shows that 4 of 6 natural gas COUs had dedicated low-income programs and spent $42,823, about 67 percent of the required spending. The table shows that 2 of the 6 COUs did not have dedicated low-income programs. Those COUs had a spending requirement of $20,087. In total, the natural gas COUs fulfilled about 51 percent of their spending requirement with spending for dedicated low-income programs.
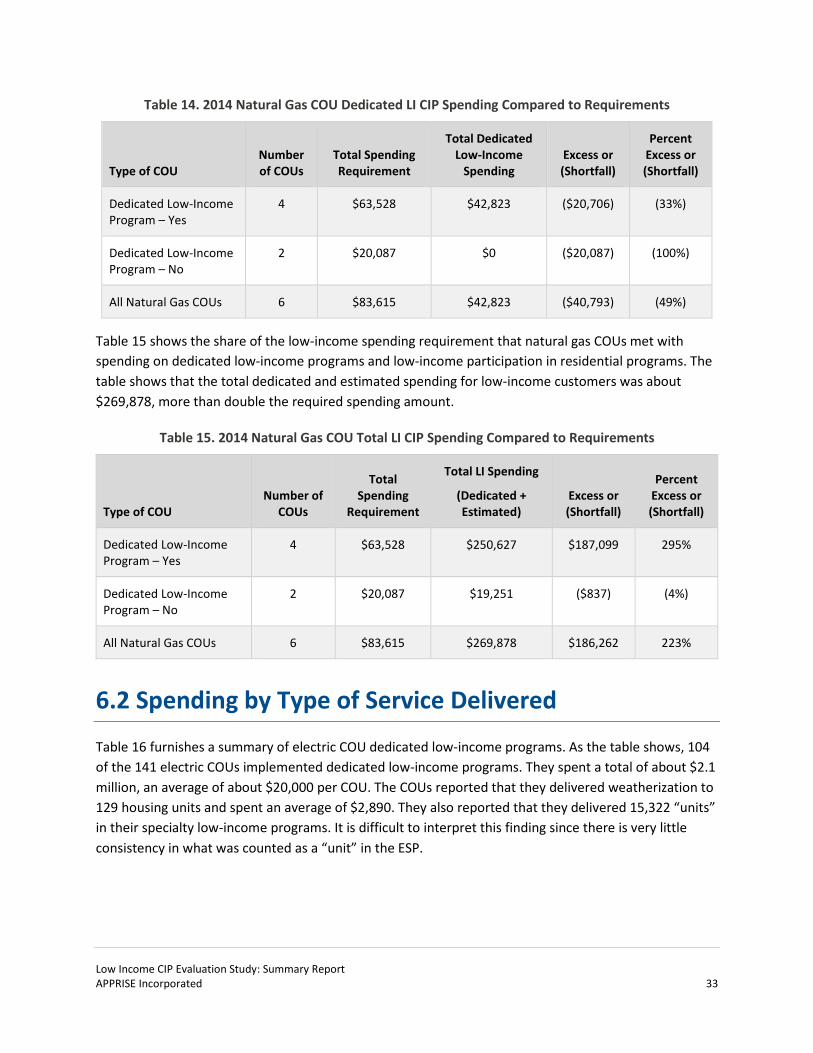
Low Income CIP Evaluation Study: Summary Report APPRISE Incorporated 33
Table 14. 2014 Natural Gas COU Dedicated LI CIP Spending Compared to Requirements
Type of COU Number of COUs
Total Spending Requirement
Total Dedicated Low-Income
Spending Excess or (Shortfall)
Percent Excess or (Shortfall)
Dedicated Low-Income Program – Yes
4 $63,528 $42,823 ($20,706) (33%)
Dedicated Low-Income Program – No
2 $20,087 $0 ($20,087) (100%)
All Natural Gas COUs 6 $83,615 $42,823 ($40,793) (49%)
Table 15 shows the share of the low-income spending requirement that natural gas COUs met with spending on dedicated low-income programs and low-income participation in residential programs. The table shows that the total dedicated and estimated spending for low-income customers was about $269,878, more than double the required spending amount.
Table 15. 2014 Natural Gas COU Total LI CIP Spending Compared to Requirements
Type of COU Number of
COUs
Total Spending
Requirement
Total LI Spending
(Dedicated + Estimated)
Excess or (Shortfall)
Percent Excess or (Shortfall)
Dedicated Low-Income Program – Yes
4 $63,528 $250,627 $187,099 295%
Dedicated Low-Income Program – No
2 $20,087 $19,251 ($837) (4%)
All Natural Gas COUs 6 $83,615 $269,878 $186,262 223%
6.2 Spending by Type of Service Delivered
Table 16 furnishes a summary of electric COU dedicated low-income programs. As the table shows, 104 of the 141 electric COUs implemented dedicated low-income programs. They spent a total of about $2.1 million, an average of about $20,000 per COU. The COUs reported that they delivered weatherization to 129 housing units and spent an average of $2,890. They also reported that they delivered 15,322 “units” in their specialty low-income programs. It is difficult to interpret this finding since there is very little consistency in what was counted as a “unit” in the ESP.
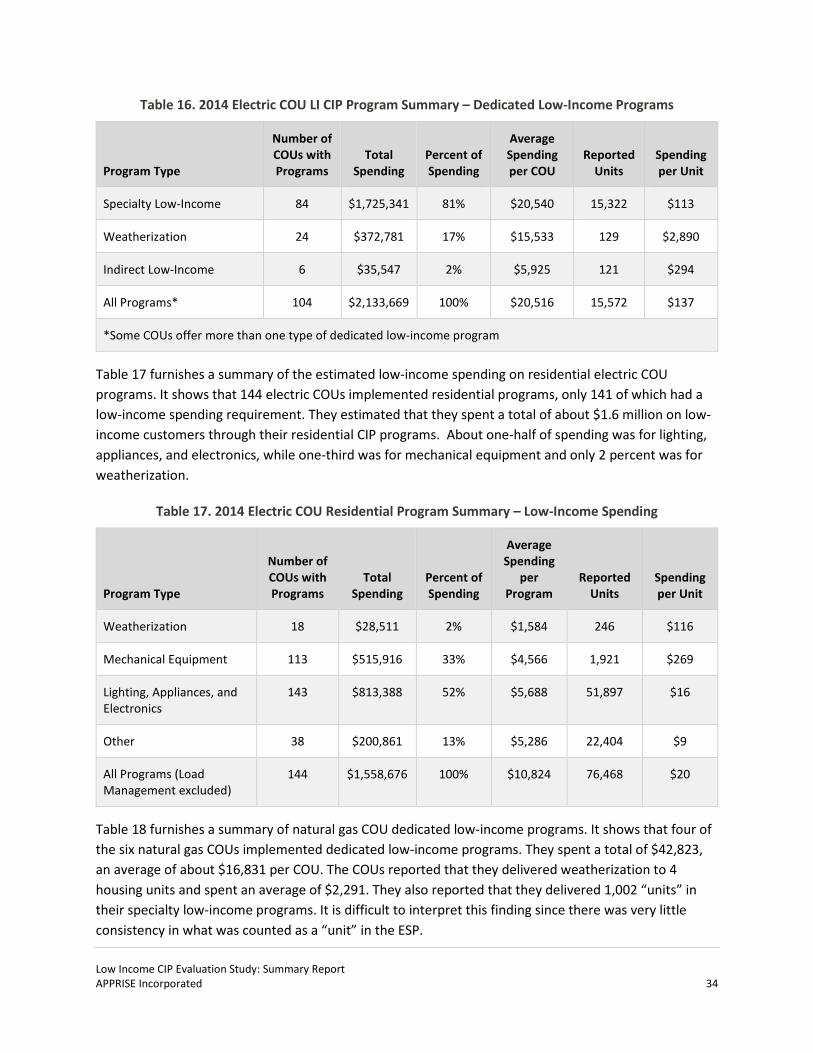
Low Income CIP Evaluation Study: Summary Report APPRISE Incorporated 34
Table 16. 2014 Electric COU LI CIP Program Summary – Dedicated Low-Income Programs
Program Type
Number of COUs with Programs
Total Spending
Percent of Spending
Average Spending per COU
Reported Units
Spending per Unit
Specialty Low-Income 84 $1,725,341 81% $20,540 15,322 $113
Weatherization 24 $372,781 17% $15,533 129 $2,890
Indirect Low-Income 6 $35,547 2% $5,925 121 $294
All Programs* 104 $2,133,669 100% $20,516 15,572 $137
*Some COUs offer more than one type of dedicated low-income program
Table 17 furnishes a summary of the estimated low-income spending on residential electric COU programs. It shows that 144 electric COUs implemented residential programs, only 141 of which had a low-income spending requirement. They estimated that they spent a total of about $1.6 million on low-income customers through their residential CIP programs. About one-half of spending was for lighting, appliances, and electronics, while one-third was for mechanical equipment and only 2 percent was for weatherization.
Table 17. 2014 Electric COU Residential Program Summary – Low-Income Spending
Program Type
Number of COUs with Programs
Total Spending
Percent of Spending
Average Spending
per Program
Reported Units
Spending per Unit
Weatherization 18 $28,511 2% $1,584 246 $116
Mechanical Equipment 113 $515,916 33% $4,566 1,921 $269
Lighting, Appliances, and Electronics
143 $813,388 52% $5,688 51,897 $16
Other 38 $200,861 13% $5,286 22,404 $9
All Programs (Load Management excluded)
144 $1,558,676 100% $10,824 76,468 $20
Table 18 furnishes a summary of natural gas COU dedicated low-income programs. It shows that four of the six natural gas COUs implemented dedicated low-income programs. They spent a total of $42,823, an average of about $16,831 per COU. The COUs reported that they delivered weatherization to 4 housing units and spent an average of $2,291. They also reported that they delivered 1,002 “units” in their specialty low-income programs. It is difficult to interpret this finding since there was very little consistency in what was counted as a “unit” in the ESP.
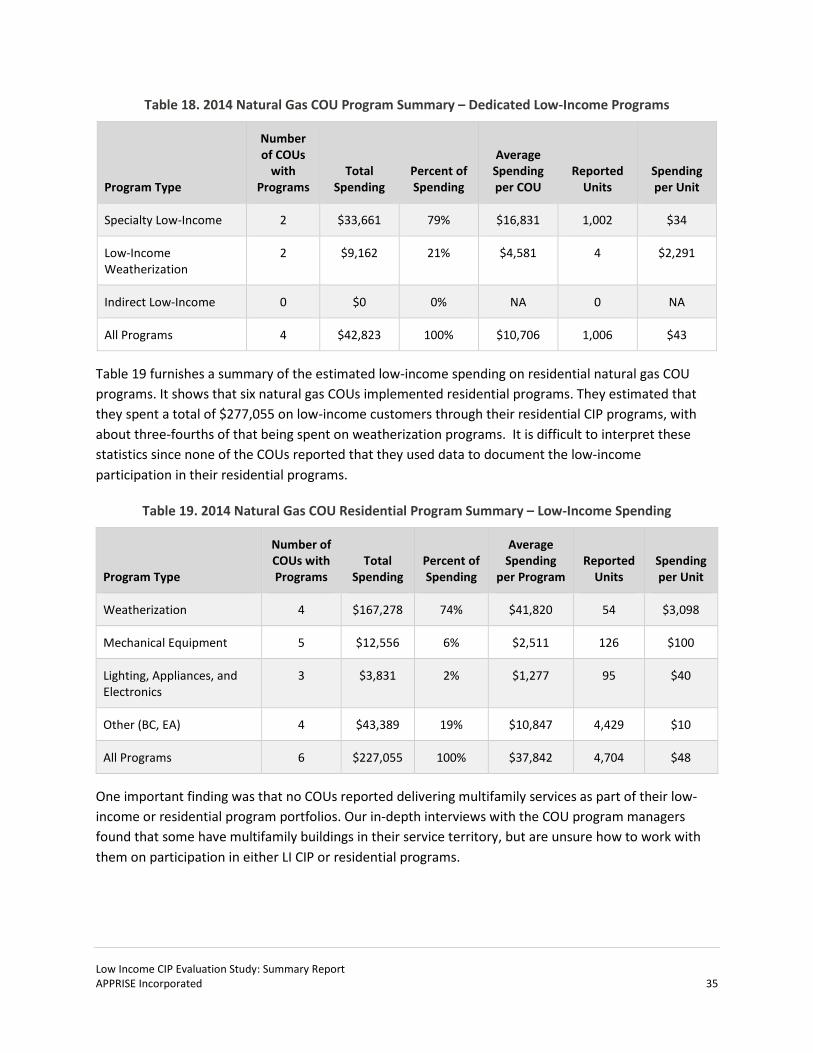
Low Income CIP Evaluation Study: Summary Report APPRISE Incorporated 35
Table 18. 2014 Natural Gas COU Program Summary – Dedicated Low-Income Programs
Program Type
Number of COUs
with Programs
Total Spending
Percent of Spending
Average Spending per COU
Reported Units
Spending per Unit
Specialty Low-Income 2 $33,661 79% $16,831 1,002 $34
Low-Income Weatherization
2 $9,162 21% $4,581 4 $2,291
Indirect Low-Income 0 $0 0% NA 0 NA
All Programs 4 $42,823 100% $10,706 1,006 $43
Table 19 furnishes a summary of the estimated low-income spending on residential natural gas COU programs. It shows that six natural gas COUs implemented residential programs. They estimated that they spent a total of $277,055 on low-income customers through their residential CIP programs, with about three-fourths of that being spent on weatherization programs. It is difficult to interpret these statistics since none of the COUs reported that they used data to document the low-income participation in their residential programs.
Table 19. 2014 Natural Gas COU Residential Program Summary – Low-Income Spending
Program Type
Number of COUs with Programs
Total Spending
Percent of Spending
Average Spending
per Program Reported
Units Spending per Unit
Weatherization 4 $167,278 74% $41,820 54 $3,098
Mechanical Equipment 5 $12,556 6% $2,511 126 $100
Lighting, Appliances, and Electronics
3 $3,831 2% $1,277 95 $40
Other (BC, EA) 4 $43,389 19% $10,847 4,429 $10
All Programs 6 $227,055 100% $37,842 4,704 $48
One important finding was that no COUs reported delivering multifamily services as part of their low-income or residential program portfolios. Our in-depth interviews with the COU program managers found that some have multifamily buildings in their service territory, but are unsure how to work with them on participation in either LI CIP or residential programs.
Low Income CIP Evaluation Study: Summary Report APPRISE Incorporated 36
6.3 Spending in Collaboration with WAP and EAP
One important question for the study is what share of the low-income program spending is allocated to WAP service delivery agencies. However, because that information is not reported to the Department in the ESP, it was not possible to develop an estimate of the share of COU spending allocated to those agencies. We conducted in-depth interviews with eleven COUs. Of those, eight reported that they work with WAP service providers to deliver some or all of their low-income program services.
The in-depth interviews with the COU aggregators, the COUs, and the WAP service providers found that there are opportunities to improve the way that these organizations work together to deliver services to low-income customers in rural areas and in municipalities.
• COU Experiences – Some COUs report that they have positive relationships with WAP agencies, while others report having negative relationships. COUs appreciate having the opportunity to leverage the existing resources made available by the WAP agencies in their service territory. Other COUs reported that the WAP agencies did not always meet the commitments they made to deliver services.
• WAP Agency Experiences – Some WAP agencies report that their COU contracts allow them to deliver more comprehensive services to low-income households and that they have been able to negotiate compensation that covers the cost of delivering program services. Other WAP agencies have reported that the COUs have an unrealistic expectation that the WAP agency can deliver program services without adequate compensation.
• Opportunities – The COUs and WAP agencies both need better information on what is allowed when COUs’ funds are leveraged as part of WAP service delivery.
Both COUs and WAP agencies recommended that the Department take a more active role in helping COUs to understand the most effective ways to work with WAP agencies and in helping WAP agencies to understand the importance of meeting LI CIP commitments.
6.4 Spending on Low-Income Renters
The ESP does not ask COUs to report on the number of renters participating in either their dedicated low-income program or their residential programs. Our in-depth interviews found that COU program managers did not target delivery of services to those customers. As noted above, some COU program managers expressed an interest in working with multifamily buildings but indicated that they would need technical assistance on that issue.
Low Income CIP Evaluation Study: Summary Report APPRISE Incorporated 37
6.5 Innovative Programs
The statistics furnished by the COUs in the ESP demonstrate that, as a group, the COUs are delivering important energy efficiency services to their low-income customers. Our in-depth interviews with the aggregators and program managers also found that the COUs take their CIP and LI CIP responsibilities seriously and that they develop programs they perceive best meet the needs of their low-income customers.
In some cases, COUs have developed innovative program models that might furnish good examples for other COUs of how to increase the efficiency and effectiveness of their programs. Examples include:
• Non-Profit Affordable Housing Program – Duluth Public Works & Utilities works with their local affordable housing organization to furnish incentives that allow the organization to increase the energy efficiency of housing units that they are constructing or rehabilitating.
• Weatherization of Delivered Fuel Housing Units – The Dairyland COUs use the Department’s guidance on Energy Savings from Delivered Fuels to allow their WAP service providers to furnish weatherization services to customers who use a delivered fuel as their main source of heat. However, one issue with that innovation is that it appears that the ESP data entry is not being done correctly and the utility is not getting credit for the weatherization energy savings.
• WAP Agency Screening Services – Moorhead Public Service contracts with the WAP service delivery agency to conduct appliance testing for the Moorhead customers that participate in WAP. The utility program manager then takes responsibility for getting the qualifying appliances delivered to the home. This model takes advantage of the fact that the agency is already scheduled to conduct a home assessment, but reduces the cost to the agency in that it does not require them to follow-up with the appliance contractor or the household.
These program models furnish good examples of ways that COUs with relatively small program budgets can deliver good quality program services.
In some cases, we found that the WAP service provider was responsible for program innovations. The Semcac Community Action Agency proactively markets its services to COUs. They are delivering services to nine different COUs. They tailor their services to meet the needs of each COU. Examples include:
• Delivered Fuel Households – They furnish weatherization services to delivered fuel households for two COUs.
• WAP Deferral Units – Even when the home must be deferred for WAP, they deliver those energy efficiency measures that can be safely installed in the home.
• Electric Only – When there are funds available, they use eHeat to identify homes with high electric usage and deliver electric-only services to those homes.
These procedures help the COUs to meet their spending requirements when there are insufficient opportunities to spend the available LI CIP funds as part of their WAP service delivery.
Low Income CIP Evaluation Study: Summary Report APPRISE Incorporated 38
6.6 Summary of Findings
The COUs face challenges in meeting the low-income spending requirements because many have a relatively small budget for their programs and are located in rural areas where it is costly for contractors to deliver energy efficiency services to customers’ homes. The COU aggregators (i.e., generation and transmission power cooperatives and municipal power agencies) can help the COUs by furnishing program design templates, contracting with suppliers for certain energy efficiency measures, and completing ESP reports. Local WAP agencies and other nonprofit organizations can help the COUs by delivering LI CIP programs services to households that they are already planning to serve as part of their existing programs. Many COUs and local service providers have successfully implemented effective and efficient LI CIP programs. However, others need additional T&TA from the Department to improve their ability to make use of the available resources to meet their spending requirements.
Low Income CIP Evaluation Study: Summary Report APPRISE Incorporated 39
7.0 Recommendations
The purpose of this study is to help the Department of Commerce (Department), utilities, implementation contractors, and other interested parties to develop a better understanding of the how the Low Income (LI) Conservation Improvement Programs (CIP) operate with the goal of identifying ways to increase the efficiency and effectiveness of those programs. The study recommendations summarized in this report are categorized in terms of four objectives.
• Communications – How can information about LI CIP program requirements and opportunities be communicated most effectively to the utilities, service providers, and other parties that are engaged in the program?
• Explicit Program Requirements – What changes in program policies and procedures would increase the effectiveness of and compliance with the explicit LI CIP program requirements?
• Implicit Program Objectives – How can the program partners work together to develop consensus on the implicit program objectives and undertake initiatives that help to move the program toward achievement of those objectives?
• Low-Income Program Best Practices – What are some of the best practices for low-income programs that should be adopted by the Department and implemented by the utilities?
Detailed information about the rationale for each recommendation and the process by which the recommendations would be implemented is provided in the study reports listed in Section 1.
7.1 Communications
As part of this study, the project team conducted in-depth interviews with Department managers and staff, utility program managers, and low-income service providers. In each of those interviews, the respondents recommended that the Department improve frequency and consistency of communications about LI CIP. Information is needed on the following:
• Policies and Procedures – Utilities and service providers want consistent information on what they are required and allowed to do. They perceive that they are not notified when the Department makes decisions about LI CIP policies and procedures and that they do not get information on the policies and procedures for the WAP and EAP programs.
• Innovations – Some survey respondents recommended that the Department develop a forum for sharing information on successful program innovations. For example, Xcel and CPE are implementing a comprehensive multifamily building efficiency program. The other IOUs and COUs are interested in learning how such a program could be implemented in their service territory.
Low Income CIP Evaluation Study: Summary Report APPRISE Incorporated 40
The Department managers and staff discussed communications needs in depth and agreed that they need the following.
• Intra-Department Communications – There needs to be better communication within the Department with respect to policies and procedures that affect the other programs.
• Communications from the Department – Communications from the Department would be best handled by having each unit communicate with the organizations for which they have oversight. For example, the CIP unit would communicate with the utilities and the WAP unit would communicate with WAP service providers.
• LI CIP Forum – There needs to a be a forum in which all parties can share information on program innovations in a way that gives participants details on specific program design, implementation, and assessment procedures.
The major challenge with such a communication plan is that it would be time-consuming to implement. It may be appropriate for the Department to engage an outside consultant to ensure that communications procedures are implemented consistently.
7.2 Explicit Program Requirements
The study found that all of the IOUs and many of the COUs are consistently meeting or exceeding the explicit program requirements. As such, improving compliance with those requirements is not the highest priority recommendation from this study. However, there are two areas in which Department initiatives that we recommend the Department should address.
• Program Requirements – There are some ambiguities in the program requirements. One way that can occur is when the Commissioner issues an Order in the context of a filing related to an individual utility, but the Order does not clarify whether that applies to all utilities. Another way that this can occur is when a utility asks the Department an informal question about whether a particular approach to LI CIP programs is allowed and the Department furnishes an answer to that utility without communicating that information to all utilities. Some examples of such issues include:
o Building Types – Utilities have asked whether certain types of buildings (e.g., homeless shelters, food panties, and schools in low-income neighborhoods) are eligible to participate in LI CIP programs.
o Residential and Business Segment Programs – Some programs outside the low-income program segment offer higher incentives to low-income participants. It is unclear whether that should be counted as LI CIP program spending.
o Spending on Health and Safety Measures – Some utilities perceive that they are not allowed to spend LI CIP funds on health and safety measures while other have included those in their list of allowable measures.
Low Income CIP Evaluation Study: Summary Report APPRISE Incorporated 41
• COU Spending Requirements – Some COUs fail to spend the required amount on low-income households. The Department has not worked with COUs to identify possible ways to address that issue.
The Department should work toward resolving those issues so that the utilities have the ability to develop new initiatives that they are confident will be consistent with program requirements.
7.3 Implicit Program Objectives
There are a number of ways in which the CIP statute and Department guidance has identified objectives that are not explicitly codified as program requirements. As part of this study, we identified some of those objectives, assessed the extent to which the utility LI CIP programs addressed those objectives, and made recommendations for ways to increase the performance of the programs with respect to those objectives. Examples include:
• Low-Income Renters – The statute explicitly mentions low-income renters in the context of the definition of low-income programs. The Rules require IOUs to report on the number of renters served by programs. As part of our assessment, we calculated the share of LI CIP program funds that served low-income renters and found that natural gas IOU programs spend only a small percent of funds on low-income renters, but that electric IOU programs make a significant investment in renter-occupied units. We recommend that the Department require utilities to track spending on low-income renters and encourage appropriate levels of investment in those housing units.
• WAP Protocols – The Department has recommended that utilities collaborate with WAP service providers and/or make use of WAP protocols to ensure that their low-income programs are delivering the highest quality services to low-income households. Even when a program is delivered by a contractor that is not a WAP service provider, the Commissioner has sometimes ordered the utility to follow WAP guidelines for health and safety protocols and for measure selection and installation. However, we found that WAP protocols are not well understood by utilities and that the federal WAP program manager has explicitly stated that leveraged funds are not always required to follow WAP guidelines. We recommend that the Department lead a collaborative effort with the utilities and their service providers to establish guidelines for health and safety testing and measure installation, quality control procedures, and measure selection and installation that start with the WAP protocols, but that adapt those protocols where appropriate to maximize program efficiency and effectiveness.
• Cost-Effectiveness – The statute does not require LI CIP programs to be cost-effective. However, since there is a limited amount of funds available for LI CIP programs, it is appropriate for the utilities to implement those that have the greatest impacts for low-income households. We recommend that the Department work toward developing procedures that optimize the portfolio of low-income programs to make the best use of program resources in terms of delivering savings to low-income households.
Low Income CIP Evaluation Study: Summary Report APPRISE Incorporated 42
The different initiatives listed in this section are time- and resource-intensive; all cannot be accomplished in the near term. Rather, these should be thought of as longer-term objectives for the LI CIP program to be prioritized over the next several years.
7.4 Low-Income Program Best Practices
The study examined successful practices from other jurisdictions that are demonstrated to increase the efficiency and effectiveness of ratepayer-funded low-income programs. It found that some important practices are not part of the Department’s LI CIP programs. Examples include:
• Collaboration with WAP and EAP – The study estimated that WAP service providers receive about 42 percent of the LI CIP funds. In those cases, there is direct collaboration between WAP and LI CIP. However, even where the utility or another contractor delivers the LI CIP program services, it is important for those programs to coordinate service delivery with WAP and EAP. We recommend that the Department and the utilities work together to identify and take advantage of those opportunities for better coordination.
• Measurement and Evaluation Framework – In other jurisdictions, utilities are required to conduct systematic measurement and verification activities to ensure that energy efficiency measures are installed in ways that ensure that the savings potential is realized. Those jurisdictions also require utilities to conduct periodic evaluations to make sure that implementation procedures are efficient and effective. We recommend the Department work with utilities to establish Evaluation, Measurement and Verification (EM&V) protocols to be consistent with these best practices.
• Program Targeting – Program evaluations have demonstrated that targeting certain households can maximize the performance of the program with respect to program objectives. When the primary goal of the program is energy savings, optimized performance t is often achieved by targeting the high energy users. When an important goal of the program is non-energy benefits, there can be other household characteristics that are considered in targeting. We recommend that the Department issue guidance related to program targeting to encourage utilities and their service providers to adopt improved targeting procedures.
The recommendations above are listed in priority order. We recommend that the Department first work on the issue of collaboration, then work toward establishment of EM&V protocols, and finally make use of the outputs from those prior activities to make targeting recommendations.
Low Income CIP Evaluation Study: Summary Report APPRISE Incorporated 43
7.5 Summary of Recommendations
This study does not recommend that the Department make wholesale changes in the program’s policies and procedure nor in the guidance to utilities on how best to design and implement programs. The LI CIP programs generally have been successful in delivering valuable services to low-income households. Rather, the study recommends that the Department work collaboratively with the utilities, service providers, and other parties to make incremental changes that will help to increase the efficiency and effectiveness of the LI CIP programs.