low scr wind identification and mitigation -...
TRANSCRIPT

Low SCR Wind Identification and
Mitigation
Will Lovelace
MIPSYCON 2015
November 11th, 2015

System Background - Diagram

System Background - Diagram

System Background - Description
• 199.5 MW wind farm on remote 115 kV system
• 133 GE 1.5 MW Type 3 machines
• Four control groups
• 54 mile 266.8 ACSR (weak) to the south
• 58 mile T2-477/477 ACSR (strong) to the east
• Originally two load serving lines networked in
2008 when the wind farm was built
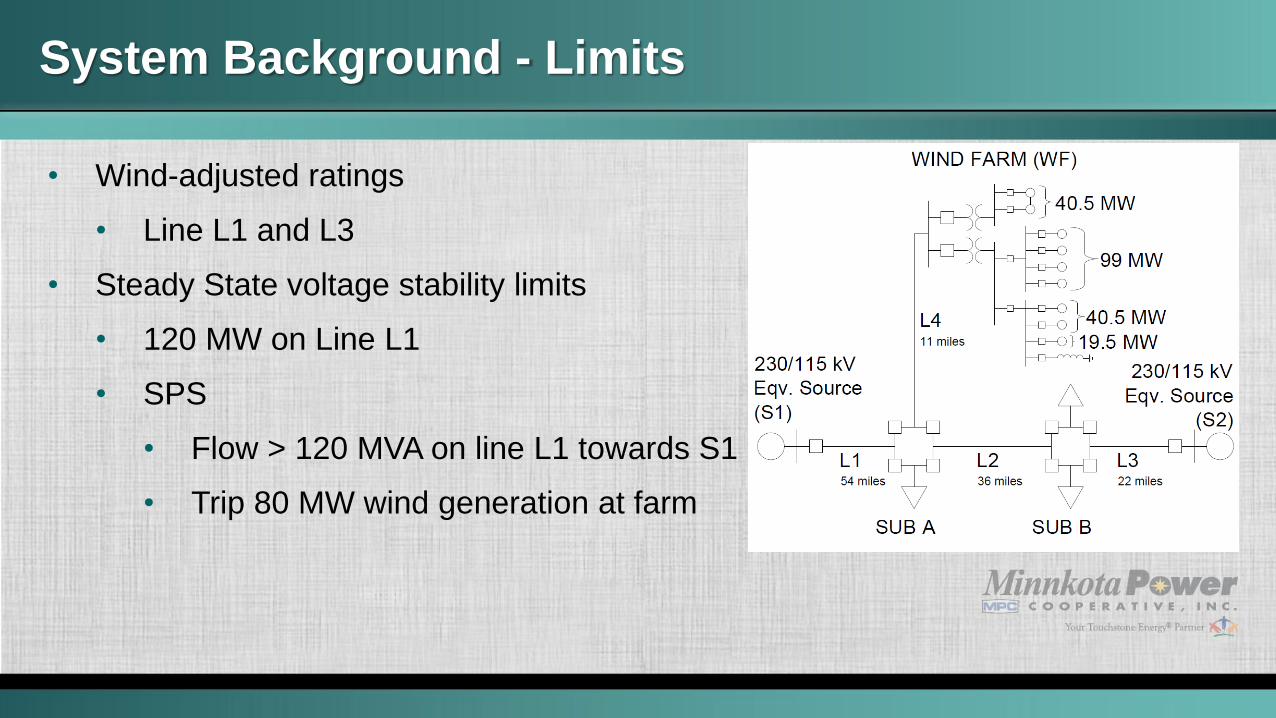
System Background - Limits
• Wind-adjusted ratings
• Line L1 and L3
• Steady State voltage stability limits
• 120 MW on Line L1
• SPS
• Flow > 120 MVA on line L1 towards S1
• Trip 80 MW wind generation at farm

System Background - Operating Processes
• Limit Wind Farm during local 115 kV line
switching
• L1 – No limit
• L2 – 60 MW
• L3 – 60 MW
• No limits for transient stability during prior outage

Composite Short Circuit Ratio (CSCR)
• 𝐶𝑆𝐶𝑅 = 𝑆𝐶𝐶𝑠𝑦𝑠𝑡𝑒𝑚
𝑃𝑤𝑖𝑛𝑑
• 𝑆𝐶𝐶𝑠𝑦𝑠𝑡𝑒𝑚 is the 3ph fault MVA at the high-side wind
generator transformer equivalent bus with all local and
“nearby” high-side wind generator transformer equivalent
buses shorted
• Local and “nearby” wind machines disconnected
• 𝑃𝑤𝑖𝑛𝑑 is the total nameplate capacity of all local and “nearby”
wind generation
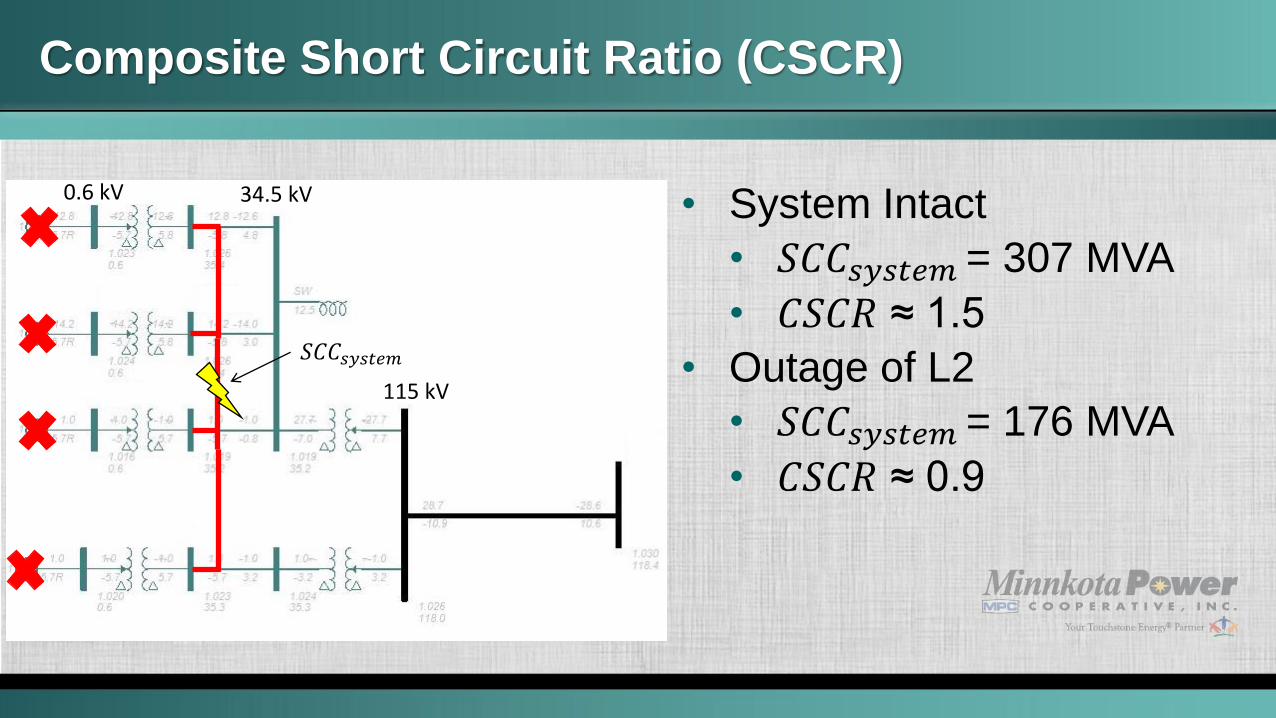
Composite Short Circuit Ratio (CSCR)
• System Intact
• 𝑆𝐶𝐶𝑠𝑦𝑠𝑡𝑒𝑚 = 307 MVA
• 𝐶𝑆𝐶𝑅 ≈ 1.5
• Outage of L2
• 𝑆𝐶𝐶𝑠𝑦𝑠𝑡𝑒𝑚 = 176 MVA
• 𝐶𝑆𝐶𝑅 ≈ 0.9
0.6 kV 34.5 kV
115 kV
𝑆𝐶𝐶𝑠𝑦𝑠𝑡𝑒𝑚

Composite Short Circuit Ratio (CSCR)
• Historically, a CSCR < ~3.0* meant instability
• Presently a CSCR > ~1.0* could be managed with control
changes in some cases
• MPC’s current CSCR interconnection criteria is:
• CSCR < 3.0* (or applicable manufacturer data) requires
further analysis
*The above CSCR limits are not prescriptive and CSCR needs to be considered on a
case-by-case basis.

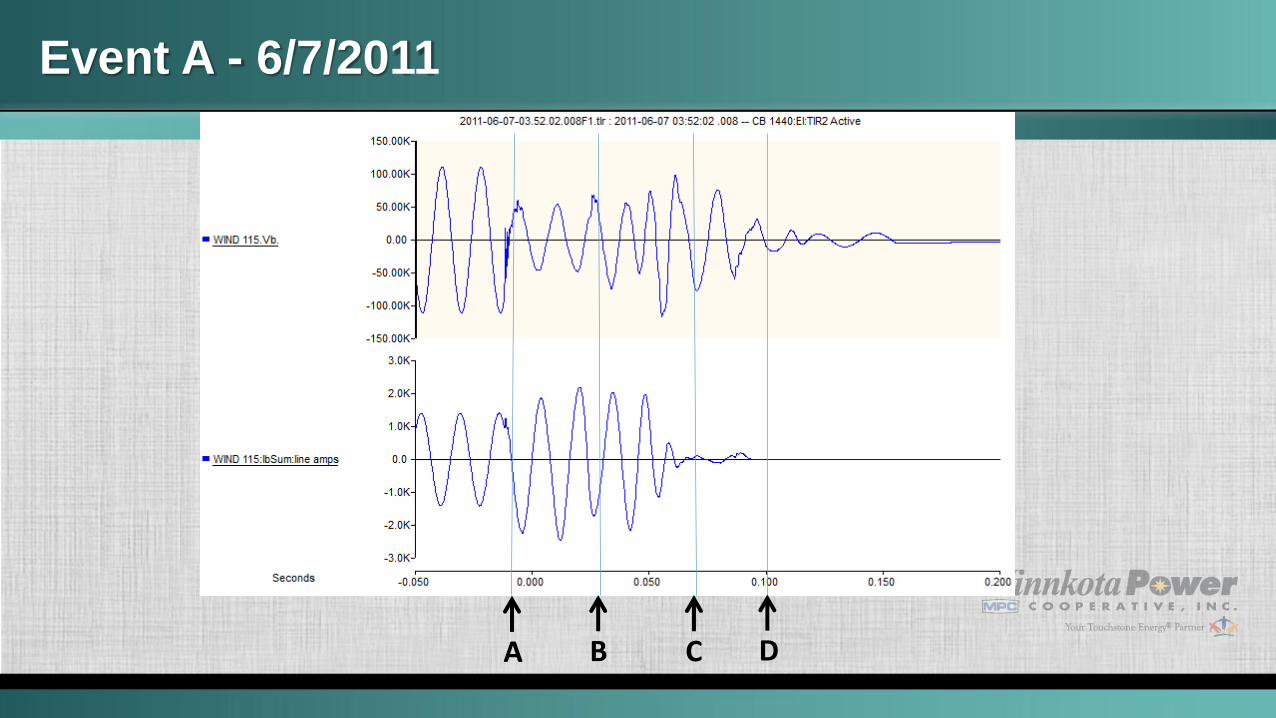
Event A - 6/7/2011
A. Initial B-phase SLG fault on L2
B. L2 opens after ~2 cyc and wind
farm begins to go unstable
C. SUB A Zone 1 Phase B-C
element asserts after ~2.5 cyc
D. L4 opens after ~2 cyc
Event A - 6/7/2011
A B C D

Event B - 11/28/2011
A. L1 manually opened by MPC
Operators and voltage begins to
decay
B. SUB A & B Zone 1 Phase A-B &
B-C elements looking both
directions assert after ~4.4 sec
C. L2 opens after ~1.5 cyc

Event B - 11/28/2011
A B/C B C

Wind Farm Instability vs. Distance Relaying
• The swing briefly (1/4 cyc) “tricks” the
distance element of the SEL 311C
into “seeing” a forward fault
• Too fast (25 Hz) to be handled with
OOS tripping/blocking
• Option: Introduce a Zone 1 phase
distance delay
• NOTE: Be careful with this so as not to propagate
the swing outside the local system

Wind Farm Instability vs. Distance Relaying
• While not intended the operation of the Zone 1 distance
element protects the rest of the system by tripping the farm
BUT
• The wind turbine restart procedure is long and complicated
due to loss of the grid tie, and the operation of the distance
element in every situation is not guaranteed
GE Study #1 – Identify and Qualify Issues
• A model of the local system was built in GE’s EMTP-type
proprietary software
• Three historical events ran
• 6/7/2011
• 11/9/2011
• 11/28/2011
• Model output benchmarked against historical recordings
• Preliminary recommendations
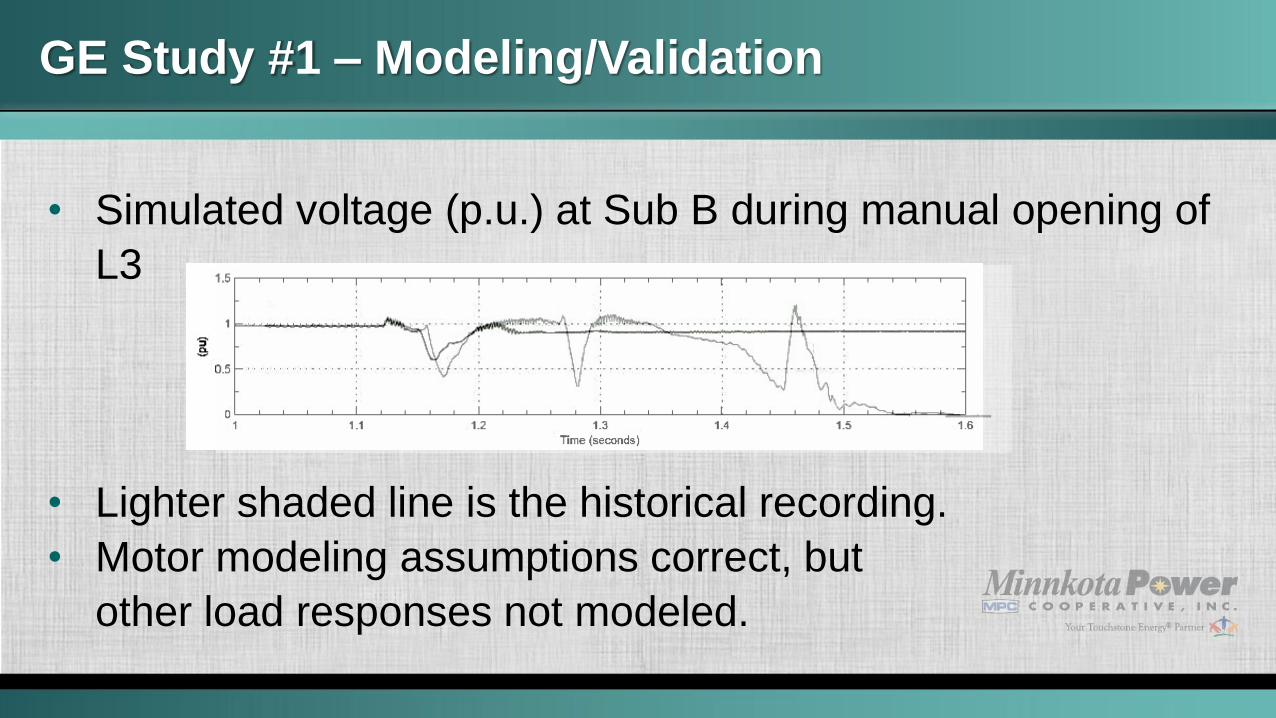
GE Study #1 – Modeling/Validation
• Simulated voltage (p.u.) at Sub B during manual opening of
L3
• Lighter shaded line is the historical recording.
• Motor modeling assumptions correct, but
other load responses not modeled.

GE Study #2 – Quantify Issues and Propose
Solutions
• Refine modeling of Study #1
• Comprehensive analysis
• Long-term voltage stability (plant level control)
• Short-term voltage stability (generator level control)
• Voltage regulator stability (dQ/dV)
• Fast Dynamics
• Specific control change recommendations

GE Study #2 – Voltage Stability
• P-V and Q-P analysis
• Long-term (LT) and
short-term (ST)
• Combinations of
local outages and
contingencies

GE Study #2 – Voltage Regulator Stability
(dQ/dV)
• For most conditions,
more limiting than
voltage stability
Hard limit
Practical limit (+/-10% margin)
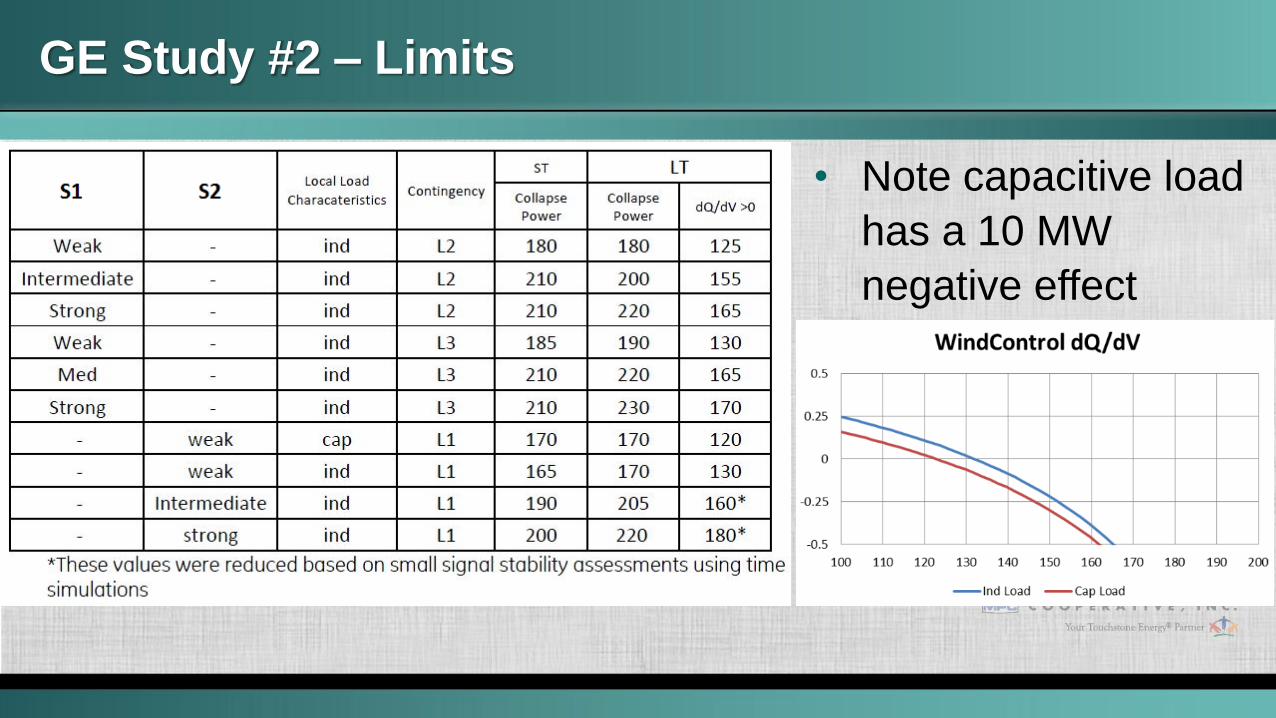
GE Study #2 – Limits
• Note capacitive load
has a 10 MW
negative effect

GE Study #2 – Control Change Summary
• Generator-level control changes
• Plant-level control changes
• Operating process changes
GE Study #2 – Generator level Control
Changes
• Weak grid control changes on ALL turbines
• Decreased gains in control loop
• Lower rate of active current change
• “Fast-stop” feature enabled on 53 turbines
• Detects a large increase in system impedance between
time-steps and trips turbine
• Turbines automatically restart after 2 minutes

GE Study #2 – Plant Level Control Changes
• Reduce response time of voltage regulator
• Enable line-drop compensation
• Slow down power factor regulation
• Limit wind farm to 120 MW following a fast stop event

GE Study #2 – Operating Process Changes
• Prior to control changes being implemented
• During local 115 kV switching: Maintain 60-80 MW limits
• During local 115 kV outages: 80 MW limits
• During adjacent 230 kV and 115 kV system outages: 150-
175 MW limits

GE Study #2 – Operating Process Changes
• After control changes implemented
• During local 115 kV switching: Maintain 60-80 MW limits
• During local 115 kV outages: 120 MW limits
• During adjacent 230 kV and 115 kV system outages: no limits
• Indication of a fast stop event sent to the MPC control room
• Following a fast stop event, the MPC operator must assess the
state of the grid and release the wind farm to full output if
allowable

Control/Process Change Example
A. Fault on L3 opens line
B. Fast Stop trips up to 53 turbines
prior to distance relaying
“seeing” a fault
C. After 2 minutes tripped turbines
reconnect to grid with plant
limiting output to 120 MW
D. Operator closes L3 and releases
farm to full output
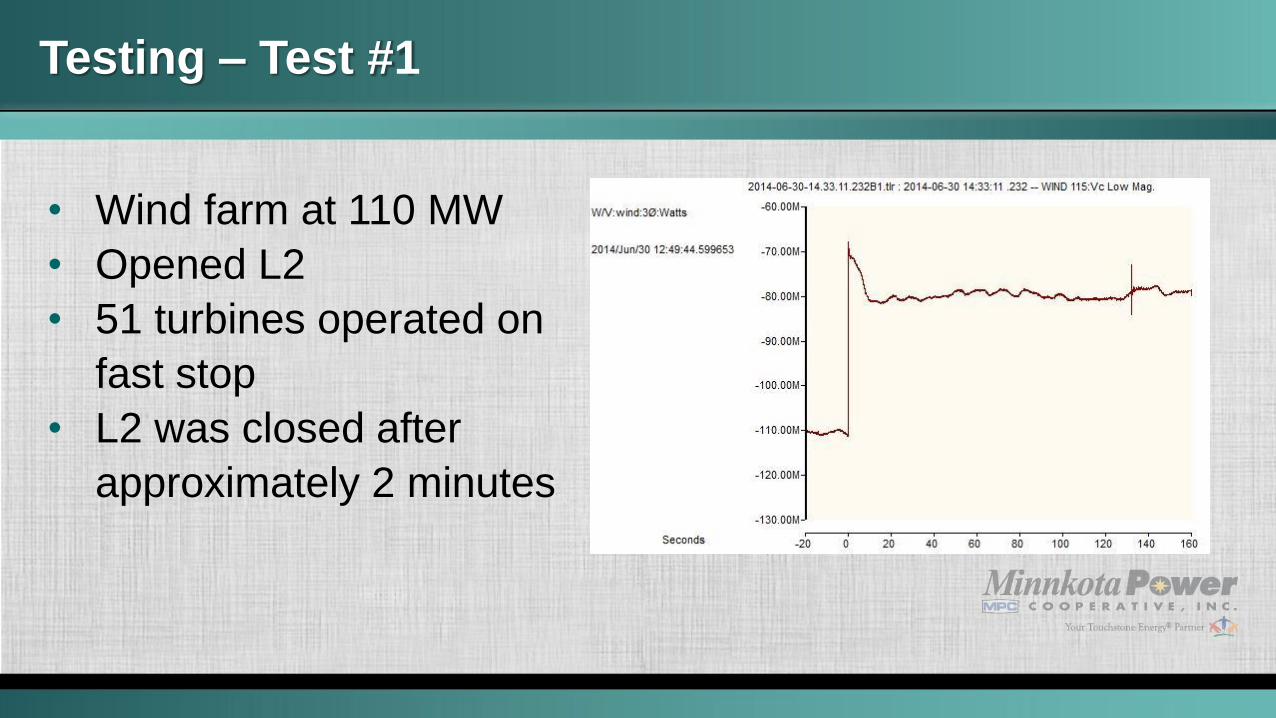
Testing – Test #1
• Wind farm at 110 MW
• Opened L2
• 51 turbines operated on
fast stop
• L2 was closed after
approximately 2 minutes

Testing – Test #1
• Opening L2 w/ Fast Stop vs. Opening L3 w/o Fast Stop

Testing – Test #2
• Wind farm at 185 MW
• Opened L1
• No turbines operated on
fast stop
• Oscillations due to
system response

Testing – Test #3
• Wind farm at 60 MW
• Opened L2
• No turbines operated on
fast stop

Performance Experience
• Overtripping occassionally
occurs
• Remote 230 kV bus fault
example
