low-shift raman microscope
TRANSCRIPT
GROUP # 17
KEVIN ORKIS - EE
BRANDON SEESAHAI - PSE
MATT AVILES – EE/CPE
CHRIS BECK - PSE
Low-Shift Raman Microscope

MOTIVATION
Sponsor: Professor of Chemistry and Forensic Science wants a
Raman spectroscopy system in his lab that detects low-shift
signals.
Raman spectroscopy has applications in forensic science for
analyzing drugs, explosive substances, and other materials for
forensic applications.
Raman spectroscopy and microscope integration: Microscope allows
for easy sampling, sample visualization with high magnification,
and can focus light to a small point to easily create a Raman
Signal.
Low-shift signals provides a more detailed “fingerprint” of a
sample.

GOALS
Integrate Raman spectroscopy with a microscope.
Create a Raman spectroscopy system that can detect low-shift
Raman signals.
“Cheaper”, safe, and easy to use system for non-optics majors.

WHAT IS RAMAN SPECTROSCOPY?
Focus Laser light to a sample to create Raman scattering.
Raman scattering can provide a spectrum that provides the molecular signature
of a material.
Raman scattering: Rayleigh scattering and inelastic scattering (stokes and anti-
stokes).
Laser
Raman Scattering
Stokes Signals of Excedrin Tablet


WORK DISTRIBUTION
Main Secondary
Spectrometer Chris Beck Brandon Seesahai
Excitation Brandon Seesahai Chris Beck
Hardware Matt Aviles Kevin Orkis
Software Kevin Orkis Matt Aviles

OVERALL REQUIREMENT SPECIFICATION
Laser Wavelength = 785 nm
Resolution ≤ 5 cm-1
Detect Peaks ± 200 cm-1 (770.87 nm to 799.13 nm).
Class 1 Laser System
Fit on a Chemistry Lab Table
EXCITATION SECTION OBJECTIVES
Inject a narrow line width laser into a microscope
Focus as much laser power as possible to a sample
Generate Raman scattering that can be detected by a
spectrometer.
Camera imaging of sample

EXCITATION OPTICS
Laser
VBG 1
VBG 2
Periscope
Microscope
Raman
Laser

MICROSCOPE
Olympus BH2 Microscope
Magnification 4 X 10 X 20 X 40 X
N.A. 0.10 0.25 0.40 0.65
Focal Length (mm) 34.23 17.69 8.99 4.61

Laser Input
Raman Signal
Beam Splitters
Illumination Source
INSIDE THE MICROSCOPE

CAMERA
Camera is on top of the microscope.
Camera has the same field of view as the objective
Camera imaging of sample
Matching focal planes
14.5”

CAMERA
Matching focal planes
Defocused
Focused

LASER
532 nm 785 nm 1064 nm
Excitation Efficiency high medium low
Fluorescence high medium low
Heat Absorption low medium High
Laser Wavelength = 785 nm from
Innovative Photonic Solutions (IPS)
Single Mode
Collimated Output Beam with FWHM
0.018 nm.
Maximum output ~100 mW
Optical Isolator

VOLUME BRAGG GRATINGS (VBG)
VBG is a dispersive element for a single
wavelength at a single angle.
Reflects 785 nm and transmits other
wavelengths.
Narrow spectral profile of laser down to less
than 5 cm-1 or 0.31 nm.
Cleans intensity profile.

PERISCOPE MIRRORS
Magnification 4 X 10 X 20 X 40 X
Pupil Diameter (in) 0.27 0.35 0.28 0.24
Raman signal
diameter on Mirror
(in)
0.38 0.49 0.40 0.34
Broadband Dielectric Mirror
0.5” or 1” mirrors? Raman signal will have a
diameter of 0.49” if 10 X is used. 1” Mirrors
cost ~$24 more than 0.5”
Part BB1 – E03
Wavelength Range (nm) (99 %) 750 – 1100
Cost $75.10

SEMROCK FILTER
Single-Edge Short Pass Dichroic
Beamsplitter
Efficient at 45 degrees
Cost $ 225 $335 $335
Reflection Band
(nm)
(97 %) 705 –
900 nm
(90 %) 750 –
1140 nm
(96 %) 770 –
1100 nm
Tranmission
Band (nm)
(93 %) 532 –
690 nm
(90 %) 430 –
700 nm
(93 %) 400 –
730 nm

FILTERING
Correct collimation (Two-lens collimator)
Reduce laser line (Notch Filters)
Remove scattering (Iris aperture)
Pinhole (Optical Fiber)

FILTERING
Raman Signal

SPECTROMETER
Design based on Czerny-Turner spectrometer
Lens (f = 50 mm) collimates light from fiber
Grating (1200 lines/mm, 12.5x12.5 mm) for dispersion
Lens (f = 400 mm) focuses light onto detector

SPECTROMETER

DETECTOR
Collects spectrum
Each pixel represents a single
wavelength
TCD1304AP
Highly sensitive, low dark current
linear image sensor
3648 Pixels
8 um x 200um Pixel Size
Commonly used, cheap, easy to use

CALIBRATION
Calibration assigns pixel # to a
wavelength or wavenumber.
Argon lamp used for
calibration
Pixel Number Wavelength (nm)
154 842.465
256 840.821
1166 826.453
2108 811.531
2187 810.369
2777 801.479
3164 794.818

RESOLUTION CALCULATION
~ 10.3 cm-1
0 200 400 600 800 1000
-1000
0
1000
2000
3000
4000
5000
Inte
nsi
ty (
a.u
.)
Raman Shift (cm-1)
Argon Spectrum
Fit Peak 1
Fit Peak 2
Fit Peak 3
Fit Peak 4
Fit Peak 5
Fit Peak 6
Fit Peak 7
Cumulative Fit Peak
Model Gauss
Equation y=y0 + (A/(w*sqrt(PI/2)))*exp(-2*((x-xc)/w)^2)
Plot Peak1(B) Peak2(B) Peak3(B) Peak4(B) Peak5(B) Peak6(B) Peak7(B)
y0 107.35017 ± 1.89806 107.35017 ± 1.89806 107.35017 ± 1.89806 107.35017 ± 1.89806 107.35017 ± 1.89806 107.35017 ± 1.89806 107.35017 ± 1.8980
xc 162.0012 ± 0.0591 258.61762 ± 0.09109 399.84318 ± 0.10894 418.01533 ± 0.05325 639.54873 ± 0.04392 846.00722 ± 0.07867 869.42043 ± 0.0773
w 11.6083 ± 0.11908 20.29634 ± 0.18457 11.84137 ± 0.20711 12.49648 ± 0.10336 11.65547 ± 0.08854 10.35455 ± 0.16135 10.52721 ± 0.1587
A 31447.96048 ± 283.44 46811.7107 ± 378.02 28381.90823 ± 485.96 62995.01762 ± 492.96 40961.97879 ± 273.73 19007.59945 ± 256.50 19778.3108 ± 258.2
Reduced Chi-S 10017.45253
R-Square(COD 0.97839
Adj. R-Square 0.97827

RESULTS – EXCEDRIN TABLET
Our Spectrometer Ocean Optics Spectrometer
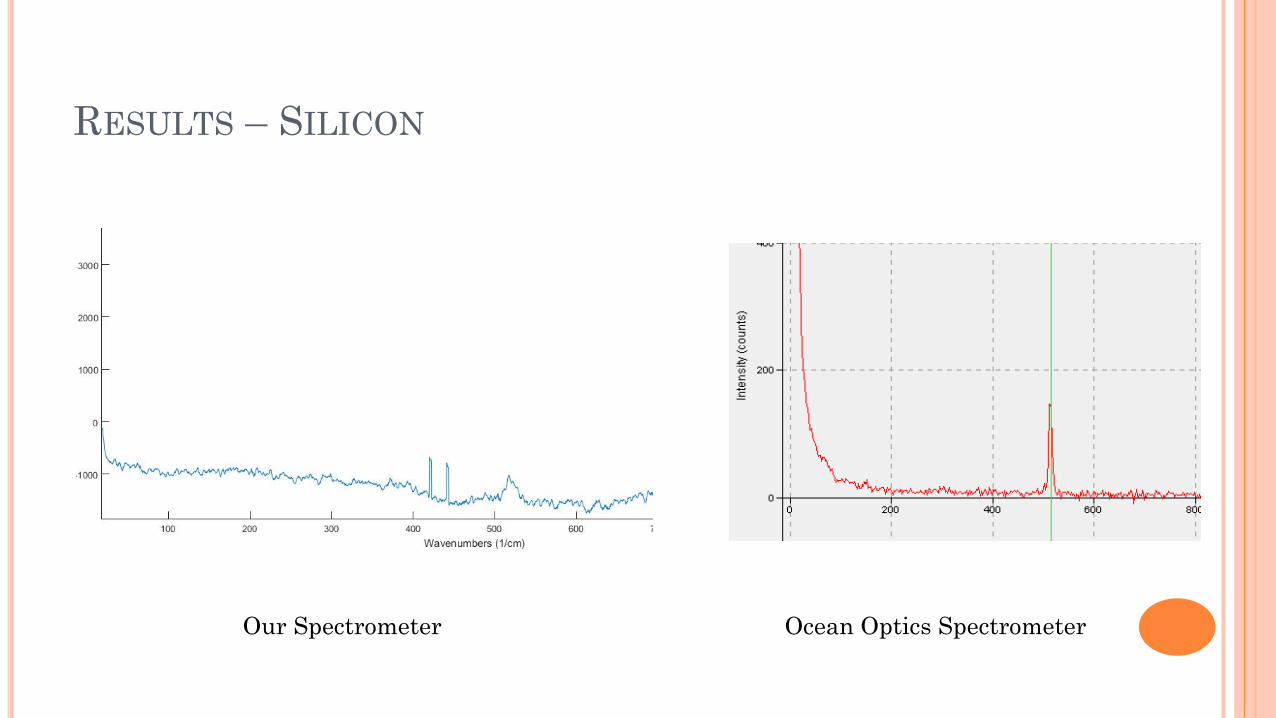
RESULTS – SILICON
Our Spectrometer Ocean Optics Spectrometer

ELECTRICAL DESIGN SPECIFICATIONS
Temperature Monitoring
Laser blocking
Backlight Control
Laser Power Control
Obtain spectrum with CCD

ELECTRICAL DESIGN SPECIFICATIONS
Obtain spectrum with CCD
CCD Cooling to reduce noise
Electrical System 1 Electrical System 2
Temperature Monitoring
Laser blocking
Backlight Control
Laser Power Control

MICROCONTROLLERS
5V System Voltage
16 MHz
23 Programmable I/O
6 Pulse Width Modulation
Easier to Solder (28 pin DIP)
Cheap - $2.21
Easy to use
Electrical System 1 -Atmega328P
Electrical System 2 –Atmega1284P
5V System Voltage
16 MHz
32 Programmable I/O
6 Pulse Width
Modulation
Easier to Solder (44
pin DIP)
Cheap - $5.50
Needs Arduino Flash
Other Considerations – Atmega2560
5V System Voltage
16 MHz
32 Programmable I/O
6 Pulse Width
Modulation
Hard to Solder (100
pin TQFP)
Cheap - $2.31
Easy to use

TEMPERATURE MONITORING
DS18B20 - Digital Temperature
Sensor Uses “One – Wire” Communication
For multiple sensors on a single bus
More Accurate than Analog
Temperature Sensors
Circuit Diagram
• Constantly Monitor temperature with Automatic Cooling• Parts Used:
• Temperature Sensor – Digital• Fans

TEMPERATURE MONITORING
Provides air flow to the
system
1 Intake fan and 1 Outtake
fan
Multicomp MC36031
5V
115mA
600 mW
Pushes 3cu.ft/min
Pulse Width Modulation for variable fan
speed (0V = 0 PWM and 5V = 255 PWM)Duty
Cycle
Voltage Temperature Range PWM Value Fan Speed
0 23mV Less than 70 F ° 0 0
30% .778 V 70 F ° 72 30%
40% 1.123 V 74 F ° 102 40%
60% 2.553 V 78 F ° 153 60%
80% 3.753V 82 F ° 204 80%
100% 4.42 V 86 F ° 255 100%

LASER BLOCKING
Mini Push-Pull 5V Solenoid
Faster than a motor for our
application
Small and cheap - $4.95
Circuit Diagram
• Needed to block the laser while a sample was being loaded on to the sampling stage
• Must be quick

LASER POWER CONTROL
Circuit Diagram
• Display Laser Power (Software) & Control Laser Power.
• Laser uses 100mW and runs on a 5V source.
• Pulse Width Modulation to modulate the power.
Duty Cycle Voltage Power Prior to Calibration PWM
Value
10% .5 10 mW 26
20% 1 20 mW 51
30% 1.5 30 mW 77
40% 2 40 mW 102
50 2.5 50 mW 128
60 3 60 mW 153
70 3.5 70 mW 179
80 4 80 mW 204
90 4.5 90 mW 230
100% 5 V 100 mW 255

BACKLIGHT CONTROL
• Control Microscope backlight
• Allows for user to toggle the backlight on/off
Backlight
Specifications:
24V
1.5A
Runs on separate
power supply
Optional - Plan to
integrate power
supply into the
system

ELECTRONIC SYSTEM 1 - CIRCUIT

ELECTRONIC SYSTEM 1 - PCB

SPECTROMETER CCD CIRCUIT
Only allows for 256 different values.
Reads 800 pixels continuously, not each single pixel.
Doesn’t capture milliVolt changes
Easy Circuit
For 1 Least significant bit = 4.8mV
Did not work for our system
Allows for 65,535 different values.
Reads all 3648 pixels.
Captures microVolt changes
More difficult to implement
For 1 least significant bit = 38uV
Used in our final system
8 Bit CCD Circuit 16-Bit CCD Circuit
• Converts the intensity of light to an associated voltage
• This is done by “shifting” signals between stages

SPECTRUM COMPARISON
8 Bit Spectrum 16-Bit Spectrum
0
10
20
30
40
50
60
70
80
1
26
51
76
101
126
151
176
201
226
251
276
301
326
351
376
401
426
451
476
501
526
551
576
601
626
651
676
701
726
751
776

SPECTROMETER CCD CIRCUIT
The Atmega1284 has to generate clocks to drive the CCD and ADC.
The Master Clock, the Shift Gate, and the Integration Clear Gate.
The CNVST, RD, and the BYTESWAP control lines on the ADC.
To generate the pulses, the ATmega1284 timers were used.
An AD7667 16-bit 1 MSPS converter was used which can digitize a frame
in 16ms
The sensitivity of the 16 bit converter is 2.5V / 65536 = 38µV

ELECTRONIC SYSTEM 2 - SCHEMATIC

ELECTRONIC SYSTEM 2 - PCB

CCD COOLING
A TEC was built because thermal noise was too much when looking at
low voltage signals.
5V, 1.5A TEC plate was used while a fan and a heatsink blow out heat.
CCD Cooling design

SPECTRUM COMPARISON USING THE TEC
Spectrum before cooling.
Noise at its highest is at 6000
analog to digital unit.
Spectrum after cooling.
Noise at its highest is at 800
analog to digital unit

ELECTRICAL SYSTEMS ENCLOSED
GRAPHICAL USER INTERFACE
MATLAB
Used to Control
Laser Power
Fan Speeds
Temperature
Door Sensor
Graph Wavenumber vs Intensity
Camera

GUI FLOW

GUI PICTURE

ISSUES
Optical Issues:
Resolution specification not met
Detector is noisy
Ambient light causing issues
Electrical Issues
Sometimes the Electrical system 1 – Arduino runs “hot” and may “lose connection to the host PC”
Solenoid gets very warm when blocking laser
CCD cooling system generates dew on the CCD.
Software
High serial throughput for a single MATlab interface.
The camera the professor wants to use does not connect with MATlab. Therefore we used the a separate software for the camera connection.

BUDGET
Optics Parts Price
Grating 64.40
Grating Mount 65.90
Focusing Lens 40.50
Focusing Lens Mount 25.25
1st Lens 41.21
1st Lens Mount 16.00
2nd Lens 33.10
2nd Lens Mount 34.70
Cage 4pack 26.37
2'' 5-pack Post Holders 38.50
2" 5-pack Posts 23.36
Notch Filter Mounts 38.70
Mount for Detector 59.20
Kinetic Mirror Mount with a 1" BB1-E03 Mirror 103.50
Semrock Beamsplitter 255.00
Total $ 865.69
Electronics Parts Price
Arduino Uno 24.95
5V 2A Power Supply 7.95
Magnetic Contact Switch 3.95
DS18B20 3.95
Solenoid 4.95
TO-220 Heatsink 0.75
Diode Kit 5.99
Transistor Kit 20
Capacitor kit 20
Resistor Kit 10.99
5V DC Fan 7.99
TCD1304 3.5
LM324 Op Amp 0.58
break-away pin stip male 4.95
FT232RL 14.95
PCB-Team Raman $33
PCB -Electrical System 2 $33
Atmega1284 $6
Max660 Charge Pump $10
Schmartboard $6
ad7667 $22
LM7805 $1
L78L05 Linear Regulator $1
AD8021 $3
Total $250.48

QUESTIONS?