low temperature catalytic ethanol conversion over ceria ...low temperature catalytic ethanol...
TRANSCRIPT

Low Temperature Catalytic Ethanol Conversion Over Ceria-Supported Platinum, Rhodium, and
Tin-Based Nanoparticle Systems
Thesis by
Eugene Leo Draine Mahmoud
In Partial Fulfillment of the Requirements for the Degree of Engineer
California Institute of Technology Pasadena, California
(Defended 2010)

1

2

3
Abstract
Due to the feasibility of ethanol production in the United States, ethanol has become more
attractive as a fuel source and a possible energy carrier within the hydrogen economy. Ethanol
can be stored easily in liquid form, and can be internally pre-formed prior to usage in low
temperature (200oC – 400oC) solid acid and polymer electrolyte membrane fuel cells. However,
complete electrochemical oxidation of ethanol remains a challenge. Prior research of ethanol
reforming at high temperatures (> 400oC) has identified several metallic and oxide-based
catalyst systems that improve ethanol conversion, hydrogen production, and catalyst stability.
In this study, ceria-supported platinum, rhodium, and tin-based nanoparticle catalyst systems
will be developed and analyzed in their performance as low-temperature ethanol reforming
catalysts for fuel cell applications.
Metallic nanoparticle alloys were synthesized with ceria supports to produce the catalyst
systems studied. Gas phase byproducts of catalytic ethanol reforming were analyzed for
temperature-dependent trends and chemical reaction kinetic parameters. Results of catalytic
data indicate that catalyst composition plays a significant role in low-temperature ethanol
conversion. Analysis of byproduct yields demonstrate how ethanol steam reforming over
bimetallic catalyst systems (platinum-tin and rhodium-tin) results in higher hydrogen selectivity
than was yielded over single-metal catalysts. Additionally, oxidative steam reforming results
reveal a correlation between catalyst composition, byproduct yield, and ethanol conversion. By
analyzing the role of temperature and reactant composition on byproduct yields from ethanol
reforming, this study also proposes how these parameters may contribute to optimal catalytic
ethanol reforming.

4
Table of Contents 1 Introduction and Theory .......................................................................................................... 5
1.1 Thermochemistry of Ethanol Reforming ......................................................................... 6
1.1.1 Steam Reforming ..................................................................................................... 6
1.1.2 Partial Oxidation ...................................................................................................... 7
1.1.3 Oxidative Steam Reforming ..................................................................................... 8
1.1.4 Additional Ethanol Reforming Reactions ................................................................. 8
1.2 Metal Catalysts for Ethanol Reforming ............................................................................ 9
1.3 Oxides as Catalysts and Metal Catalyst Supports .......................................................... 11
1.4 Multi-Component Catalyst Systems .............................................................................. 12
1.5 Proposed Work .............................................................................................................. 14
2 Experimental Approach ......................................................................................................... 16
3 Results and Data Analysis ...................................................................................................... 19
3.1 Steam Reforming ........................................................................................................... 22
3.1.1 RhxSn1-x/CeO2, (x = 1, 0.9, 0.8) ................................................................................ 22
3.1.2 PtxSn1-x/CeO2, (x = 1, 0.9, 0.8) ................................................................................. 26
3.1.3 Activation Energies for Rate-Determining Reactions ............................................ 30
3.2 Oxidative Steam Reforming ........................................................................................... 32
3.2.1 RhxSn1-x/CeO2, (x = 1, 0.9, 0.8) ................................................................................ 32
3.2.2 PtxSn1-x/CeO2, (x = 1, 0.9, 0.8) ................................................................................. 36
3.3 Ethanol Reforming with Varying Reactant Composition ............................................... 39
4 Conclusion and Future Work ................................................................................................. 45
5 Acknowledgements ................................................................................................................ 48
6 References ............................................................................................................................. 50
7 Appendix: Plots of Ethanol Reforming Byproducts for Catalysts Studied ............................. 55
7.1 Ethanol Reforming over Rh (5% wt.)/CeO2 .................................................................... 56
7.2 Ethanol Reforming over Rh9Sn1 (5% wt.)/CeO2.............................................................. 60
7.3 Ethanol Reforming over Rh8Sn2 (5% wt.)/CeO2.............................................................. 65
7.4 Ethanol Reforming over Pt (5% wt.)/CeO2 ..................................................................... 68
7.5 Ethanol Reforming over Pt9Sn1 (5% wt.)/CeO2 .............................................................. 72
7.6 Ethanol Reforming over Pt8Sn2 (5% wt.)/CeO2 .............................................................. 78
5
1 Introduction and Theory
Steam reforming is a thermochemical process in which large hydrocarbon molecules are broken
down into hydrogen gas (H2), smaller oxides, and hydrocarbons. Steam reforming of natural
resources is the primary process for the industrial production of hydrogen gas in the world.
About 50% of the world’s production of hydrogen gas and 95% of hydrogen gas production in
the United States is generated from steam reforming of natural gas [13]. When synthesized at a
large scale, steam reforming typically employs a catalyst and high temperatures (> 600oC), and is
the most energy efficient and cost efficient means of producing hydrogen gas.
Steam reforming of alcohols has been proposed as a primary means of hydrogen production for
fuel cell devices. Fuel cells are advantageous as energy conversion devices for several reasons.
They are more energy efficient than Carnot-limited combustion engines. When using hydrogen
gas as a fuel source, the only byproduct produced is water vapor (H2O). Also, the performance
of low temperature (< 100oC) proton exchange membrane fuel cells is suitable for a wide range
of mobile applications. Identifying an appropriate source for hydrogen production will solidify
the role of fuel cells in the energy marketplace.
As a means to address concerns over energy security, sustainability of energy sources, and
global climate change, using a non-petroleum-based energy carrier for fuel cells is critical [11].
Ethanol (CH3CH2OH) is attractive as a feedstock for hydrogen gas production, in part, because of
its ample production domestically—composing 99% of biofuel production in the United States.
Also, ethanol can be produced renewably, it is low in toxicity, it can be easily transported, and it
has a relatively high energy density. Thus the catalytic reforming of ethanol provides a plausible
means of hydrogen gas production for the forthcoming fuel cell industry. For certain

6
intermediate temperature (200oC–400oC) fuel cells, internal reforming of ethanol could improve
reforming efficiency while removing the challenges of hydrogen gas storage from the fuel cell
system. The objective of this section of the thesis is to delineate the different approaches and
reactions incorporated in ethanol reforming, to discuss the advantages of oxide-supported
metal catalysts for hydrogen gas production, and to discuss how multi-component catalysts may
offer improvements in catalytic ethanol reforming.
1.1 Thermochemistry of Ethanol Reforming
The main approaches to ethanol reforming for fuel cells are external reforming, integrated
reforming, and internal reforming [23]. In external reforming, the conversion to hydrogen takes
place in a separate reactor, and the resultant fuel is fed into the fuel channels. These catalytic
systems may be able to benefit from the fuel cell stack’s waste heat, but in general, they
operate as technologically mature independent systems. Integrated reforming involves some
arrangement in which the membrane electrode assembly (MEA) and the reformer are
alternatively arranged within the fuel cell stack. This approach benefits from a close thermal
contact between MEA and the reformer. Internal reforming requires the direct incorporation of
a reformate layer into either the fuel channel and/or anode. This approach ensures maximum
thermal efficiency and a coupling of all reforming byproducts into the anode’s electrochemical
reactions.
Several reaction pathways are available to ethanol reforming, and the thermodynamics of these
reactions are presented in the remainder of this section.
1.1.1 Steam Reforming
The most desirable form of the steam reforming (SR) reaction is endothermic and produces only
hydrogen and carbon dioxide (CO2).

7
CH3CH2OH(l) + 3 H2O(l) 6H2(g) + 2CO2(g) ∆H298 = +347.5 kJ mol-1 (1)
The two other steam reforming reactions produce less desirable byproducts—carbon monoxide
(CO) and methane (CH4)—in exchange with hydrogen or carbon dioxide [3].
CH3CH2OH(l) + H2O(l) 4 H2(g) + 2CO(g) ∆H298 = +341.7 kJ mol-1 (2)
CH3CH2OH(l) + 2 H2(g) 2 CH4(g) + H2O(g) ∆H298 = −114.0 kJ mol-1 (3)
Given that reactions (1) and (2) are endothermic and increase the amount of moles in the
system, SR conditions at high temperatures (> 700oC) will favor hydrogen production and the
methane producing reaction (3) will be less favorable. In the comparison of reactions (1) and
(2), the higher (3:1) molar ratio of water-to-ethanol in reaction (1) favors the production of CO2
as opposed to CO.
1.1.2 Partial Oxidation
When a sub-stoichiometric amount of oxygen gas (O2) is present in the reactant mixture with
ethanol, an exothermic reaction produces carbon dioxide and hydrogen.
CH3CH2OH(l) + 1.5 O2(g) 3 H2(g) + 2CO2(g) ∆H298 = -510.0 kJ mol-1 (4)
Less than ideal reactions that may occur during partial oxidation (PO) conditions would result in
the production of carbon monoxide and/or water vapor [28].
CH3CH2OH(l) + 0.5 O2(g) 3 H2(g) + 2CO(g) ∆H298 = +55.9 kJ mol-1 (5)
CH3CH2OH(l) + 2 O2(g) 3 H2O(g) + 2CO(g) ∆H298 = -669.6 kJ mol-1 (6)

8
PO allows for ethanol reforming at lower temperatures (i.e. without heat input) and without the
presence of steam. However, reaction (4) inherently exhibits a lower hydrogen selectivity—
moles of hydrogen produced per mole of ethanol consumed—then is does reaction (1).
1.1.3 Oxidative Steam Reforming
Oxidative steam reforming (OSR) occurs when steam reforming and the partial oxidation
reaction conditions are coupled. The OSR reaction, also known as autothermal reforming
reaction, results in the production of hydrogen and carbon dioxide with only a small change in
the system’s enthalpy.
CH3CH2OH(l) + 1.8 H2O(l) + 0.6 O2(g) 4.8 H2(g) + 2CO2(g) ∆H298 = +4.5 kJ mol-1 (7)
The hydrogen selectivity for reaction (7) is slightly lower than that of reaction (1). However, the
slight change in the system’s enthalpy would make this equation more sustainable at low
temperatures.
1.1.4 Additional Ethanol Reforming Reactions
Besides the primary reactions described above, other likely reactions include ethanol
decomposition, water gas shift (WGS), ethanol dehydrogenation, ethanol dehydration, and
methanation reactions [33].
CH3CH2OH(l) CO + CH4 + H2 ΔH298 = +91.8 kJ mol-1 (8)
CH3CH2OH(l) 0.5 CO2 + 1.5 CH4 ΔH298 = -31.7 kJ mol-1 (9)
CO + H2O CO2 + H2 ΔH298 = -41.1 kJ mol-1 (10)
CH3CH2OH(l) H2 + CH3CHO(l) ΔH298 = +84.8 kJ mol-1 (11)
CH3CH2OH(l) C2H4(g) +H2O(g) ΔH298 = +87.6 kJ mol-1 (12)
CO + 3H2 CH4 + H2O ΔH298 = -206 kJ mol-1 (13)

9
Due to the many possible reaction pathways that are available for ethanol steam reforming, it is
important to identify which reactions are the most likely to occur and to catalytically promote
the reactions that most strongly favor the production of hydrogen and carbon dioxide. Reaction
(9) is strongly favored at low temperatures (~ 200oC), and may dominate over reactions (1) and
(2). The water-gas-shift reaction (10) strongly favors the conversion of carbon monoxide to
carbon dioxide in the presence of steam [11]. This reaction is an important step in purifying
steam reforming byproducts, particularly because the production of carbon monoxide can result
in the poisoning or deactivation of certain metal catalysts typically used in reformers and fuel
cell anodes. Carbon formation is also a reaction that may result from the presence of carbon-
containing byproducts. Coking may result from the Boudouard reaction, the decomposition of
methane and hydrocarbon polymerization.
2CO C(s) + CO2 ΔH298 = -172 kJ mol-1 (14)
CH4 2H2 + C(s) ΔH298 = +74.6 kJ mol-1 (15)
C2H4 polymers coke (16)
Designing a catalyst system in which these coking reactions are limited is crucial for the
development of a stable and active ethanol reforming catalyst. The challenge has led to
increasing research in the development of stable and active catalysts for ethanol reforming.
1.2 Metal Catalysts for Ethanol Reforming
Typically, ethanol reforming is carried out at high temperatures (> 600oC). An ideal catalyst
system for low-temperature ethanol reforming would be stable, highly selective to H2, and
composed of accessible materials. Noble metal catalysts have typically been used in industrial
catalytic reformers to produce hydrogen from ethanol.

10
Platinum-based catalysts are well-known for being active in the electrochemical oxidation of
alcohols. Ethanol reforming to hydrogen over platinum (Pt) is promoted via ethanol
decomposition (8) and ethanol dehydration (11, 12) [7, 8, 15, 20, 21, 39]. However, ethanol
reforming at lower temperatures (< 500oC) generally leads to catalyst deactivation with
acetaldehyde and methane as the primary byproducts. In particular, the low selectivity to
hydrogen in favor of carbon monoxide suggests that the platinum surface promotes the reverse
water gas shift reaction. Palladium-based catalysts tend to promote similar reaction
byproducts, although activity at low temperatures is lower than platinum [14].
Rhodium (Rh) has been shown to be the most active, stable, and resistant to sintering amongst
oxide-supported noble metals catalysts for ethanol reforming [12]. Rhodium is an efficient
metal catalyst that is active in breaking the carbon–carbon (C-C) and hydrocarbon (H-C) bonds of
possible intermediates—such as acetaldehyde and oxametallacycles—during ethanol steam
reforming [22]. As shown in Figure 1, an oxametallacycle refers to the five-member adsorbed
complex formed by the insertion of a metal dimer into one of the C-O bonds of an ethylene
oxide molecule (C2H4O). The stability of these structures favors the breaking of the C-C bond,
particularly in an oxidizing atmosphere [28]. Given that oxametallacycles are more energetically
favorable on the surface of rhodium than adsorbed acetaldehyde, ethanol decomposition on
rhodium is more likely to promote C-C bond rupture. However, hydrogen selectivity over
rhodium catalysts varies with fabrication, loading, and oxide support. Oxide support is
particularly critical at low temperatures (< 500oC) [10], at which methane and carbon monoxide
production are significant amongst reforming products. This suggests that Rh alone is not
catalytically active enough to efficiently produce hydrogen at low temperatures.

11
Figure 1: Formation of an adsorbed oxametallacycle from an adsorbed ethylene oxide molecule
Amongst non-noble metals, nickel catalysts have also been used in ethanol reforming because
of their known activity in oxidation reactions, their low-temperature activity in dehydrogenation
reactions, and their low cost [30, 31]. Cobalt catalysts have demonstrated peak hydrogen
selectivity at 450oC with a CeZrO4 support [19] and are active in the breaking of the carbon-
carbon bond. However, particle size and coking are factors that limit the stability for both of
these metal catalysts at low temperatures.
1.3 Oxides as Catalysts and Metal Catalyst Supports
Despite the prevalent role of metals in catalytic reactions, studies of oxide materials have
demonstrated their ability to act as catalysts and to enhance the performance and stability of
metal catalysts [3]. The choice of a support material can favor other secondary reactions—such
as water splitting into hydroxyl (OH) groups and hydrogen radicals—and can promote the
migration of these reactive species toward the metal particles. Support materials can also aid in
the dispersion and thermal stability of metal particles.
Cerium oxide or ceria (CeO2) has garnered interest in the material science community for its
ability to participate in homogeneous catalytic reactions [1, 13, 27, 32], such as three-way
catalysis (TWC) and fluid catalytic cracking. The stoichiometric form of ceria is a face-centered
cubic cell with a fluorite structure. When treated in a reducing atmosphere at elevated

12
temperatures, a continuum of oxygen-deficient non-stoichiometric oxides are formed. These
suboxides are readily reoxidized to CeO2 in an oxidizing environment. The ability of CeO2 to
release and store oxygen allows for improved performance from nearby catalysts—such as in
the water-gas shift reaction (10) and ethanol dehydrogenation (11). As a metal support, oxides
and metals have a synergistic relationship. Precious metals promote the reduction and
oxidation of CeO2, while CeO2 stabilizes the dispersion of the precious metal and resists
sintering. Other commonly used supports in steam reforming reactions include aluminum oxide
(Al2O3) [2, 40], magnesium oxide (MgO), titanium oxide (TiO2) [24,29], zinc oxide (ZnO) [4], and
zirconium oxide (ZrO2) [5, 19].
1.4 Multi-Component Catalyst Systems
In an effort to enhance catalytic activity, catalyst development has been increasingly employing
smaller catalyst particle size and metal alloys instead of single metal catalysts. The bifunctional
theory of electrocatalysis was proposed by Watanabe and colleagues [35—37] to account for
the change in electrocatalytic activity of these multi-component systems. This theory is
presupposed on the mixture of electrocatalysts—with different adsorption properties—on the
atomic scale. Watanabe’s work demonstrated how oxidation of organic molecules over
platinum was improved by the atomic level addition of other electrocatalysts (i.e., gold,
ruthenium) that could access lower energy pathways for the adsorption of reactive species.
Effectively, one metal acts as sites for organic species and another metal acts as sites for
oxygen-containing species. Complex reactions involving various species and reaction pathways
will thus occur more efficiently at metal interfaces.
Given the unique performance of multi-phase nanoparticles catalyst systems, there has been an
increasing effort by researchers to identify and describe the varied and synergistic roles of metal

13
and oxide catalyst materials. DeSouza and colleagues conducted a study of ethanol oxidation
over a PtRhx alloy electrode [9]. Using differential electrochemical mass spectroscopy (DEMS)
and Fourier transform infrared spectroscopy (FTIR), their work demonstrated that the addition
of Rh to a Pt catalyst increases the selectivity towards the complete oxidation of ethanol to CO2,
while decreasing selectivity to acetaldehyde. Ethanol oxidation requires C-H bond and C-C bond
dissociation, in addition to CO-O bond coupling. DeSouza’s work suggests that because Pt has a
relatively low bond energy for CO and O adsorption, Pt and PtRhx catalysts are more likely than
Rh to have a lower CO2 activation energy. A linear sweep voltammetric study of adsorbed CO
suggests that Rh ad-atoms modify the electrocatalytic properties of Pt to promote the partial
oxidation of CO [8]. While in a bimetallic system, Rh continues to play the role one would
expect it to perform in a single catalyst system. A mechanistic study of PtRhx confirms that while
Rh allows for the formation of adsorbed oxametallacycles, and thus carbon-carbon bond
decomposition, an additional metal (Pt, Pd) is necessary for efficient hydrogen production [28].
In addition, the presence of a CeO2 support also favors the dehydrogenation of ethanol to
acetaldehyde.
Platinum-tin alloys also participate in the oxidation of ethanol and catalytic promotion of CO
partial oxidation. Dissociative adsorption of water molecules on tin (Sn) allows for OH species to
interact in the dissociative adsorption of ethanol, into CO2 and CH3COOH [34]. Additionally,
numerical calculations suggest that the CO oxidation potential on PtSnx is lower then the
oxidation potential on Pt. However, this has yet to be experimentally confirmed. An
electrochemical characterization of PtSnx and PtSnxOy electrodes by Jiang and colleagues [16]
shows that ethanol oxidation and hydrogen selectivity is more favorable on PtSnxOy. One
possible explanation is that tin oxide particles near Pt particles act as oxygen donor sites for the
CO-O bond coupling.
14
Recent studies of ternary catalyst systems continue to offer new insights into the roles that Pt,
Rh, and Sn play in ethanol reforming. A study of ethanol oxidation over a carbon-supported
Pt6Sn3Ru1 showed high performance relative to the ethanol oxidizing ability of other binary and
ternary catalyst systems considered [38]. The presence of the PtSn phase and the SnO2 were
identified as active structures in C-C bond dissociation. Ribeiro and colleagues considered the
addition of iridium [25] and tungsten [26] to a carbon-supported PtSn binary system. Both
materials enhanced the electrocatalytic activity of PtSn, possibly through some synergistic
structural arrangement with Sn, or by limiting ethanol adsorption in favor of oxygen containing
species. Several studies of PtRhxSny electrodes system have touted their performance as
ethanol oxidation catalysts [6, 17]. However, further studies of PtRhx, PtSnx, and PtRhxSny
catalysts as low-temperature ethanol reformers will be needed to identify the optimal material
for low-temperature reforming and fuel cell conditions.
1.5 Proposed Work
The ideal ethanol reforming catalyst will be highly selective to hydrogen, with a low selectivity to
methane, acetaldehyde, and a minimal production of CO and other large hydrocarbon
complexes while operating in reactor at low temperatures (200oC–400oC) and atmospheric
pressures. Designing an optimal catalyst for hydrogen production from ethanol requires
consideration of the catalyst fabrication technique, proper choice of catalyst components,
support structure, and careful definition of the reforming environment. Catalyst design is
particularly critical in the low temperature regime, where reaction kinetics often plays a role
larger than thermodynamics. In this study, ceria-supported, 5%-weight Pt, Rh, PtSnx, and RhSnx
catalysts will be fabricated and analyzed in their performance as low-temperature ethanol
reforming catalysts for fuel cell applications. We will discuss trends in ethanol reforming over
these catalyst systems, identify reaction kinetic parameters for the production of the ethanol

15
reforming byproducts that we detect, and propose future studies to help identify an optimal
ethanol reforming catalyst.

16
2 Experimental Approach
The catalyst materials used were composed of PtxSn1-x or RhxSn1-x nanoparticles with x = 1, 0.9
and 0.8 on a porous ceria support (95% by weight). The catalysts were fabricated at Occidental
College by Marc Sells, under the supervision of Dr. Adrian Hightower. The mass of each catalyst
sample studied is shown in Table 1. A modified version of reverse micelles synthesis was used
to produce platinum, rhodium, and tin nanoparticles with diameters ranging from 1–10 nm.
Nanoparticles were dispersed on the surface ceria supports, and the resulting cermet powder
was washed, dried, mixed with quartz sand (10 parts by volume), and mounted into a 0.8 inch
diameter plug flow reactor—as shown by the diagram in Figure 2. The catalyst material was
sandwiched in between two fine porous quartz cylinders—one fused to the end of the reactor
tube and the other slip fit into the inlet side of the tube. This setup ensures that inlet gases pass
through the catalyst system at a known rate. A thermocouple was mounted through the inlet-
side quartz cylinder to monitor the catalyst sample temperature, and a horizontal Carbolite tube
furnace was used to heat the reactor.
Table 1: Masses of catalyst material used in ethanol reforming studies
Rh Rh0.9Sn0.1 Rh0.8Sn0.2 Pt Pt0.9Sn0.1 Pt0.8Sn0.2
Catalyst mass used
217 mg 235.4mg 223.5 mg 220.4 mg 254mg 263.5 mg

17
Figure 2: A schematic of the tube furnace reactor setup
Reactant gases and reactant products were ported through the valves at the reactor’s end caps.
The water-to-ethanol gas phase molar ratio of the reactant was set to a desired value by
premixing the liquids in a bubbler, and heating the mixture to a predetermined temperature (≈
70oC). A rotameter was used to flow argon through the bubbler as a means of transporting a
vapor mixture of steam and ethanol to the catalyst. Additional rotameters were used to
transport nitrogen, oxygen, and additional argon to the catalyst bed within the tube furnace
reactor. The measurement of the volume of reactants used and the accuracy of the rotameters
were the primary sources of systematic error observed with results of this study. A liquid
vaporizer was considered for the transport of ethanol, but this method could not yield the large
reactant flow rates required. Flow meters typically operate in much larger ranges than we
required, and flow rates produced were less accurate.
After installing the catalyst in the reactor tube, the catalyst bed was preheated to 400oC at 5oC
per minute under flowing argon for two hours, and then reduced under a 2% H2 flow at a rate of
120 mL/min for 10 hours at the same temperature. Prior to testing the catalyst, the reactor
tube outside of the tube furnace was heated to 200oC by heating tape. The inlet line from the

18
bubbler, the outlet line to the GC, and the reactor end caps were heated to a temperature
between 70oC and 100oC. The reducing flow was removed from the reactor at least an hour
prior to the catalytic studies and gas chromatography was used to confirm that argon was the
only gas present. Catalytic studies were allowed 30 minutes to reach equilibrium prior to the
initial recording of data. Results were averaged over a 30 minute period.
A liquid trap was maintained at a set temperature (i.e. 30oC) and was installed at the reactor
outlet and was used to condense saturated ethanol vapor, saturated water vapor, and any other
saturated vapor byproducts. The remaining gas phase products entered the Varian CP-4900 gas
chromatograph with Molecular Sieve 5A and Porapak Q columns running on argon carrier gas.
Product gas compositions (H2, CO, CO2, CH4, C2H4, C2H6, O2, and CH3CHO) were obtained directly.
Ethanol vapor was also detected by the gas chromatograph. This ethanol vapor is the amount of
unsaturated ethanol vapor at the outlet of the reactor, and thus was not condensed in the liquid
trap. Thus, the product gas composition of ethanol was determined by correlating the amount
of ethanol gas vapor detected to the known vapor pressure of ethanol at the liquid trap’s
temperature. Alternatively, an absorption tube was installed at the reactor outlet to capture all
catalytic products. The tube was then purged with helium gas and analyzed for gas and liquid
phase products using the GC/MS setup (Hewlett-Packard 6890 GC -5973 MSD System) in
Caltech’s Environmental Analysis Center under the supervision of Dr. Nathan Dalleska. Kinetic
reaction parameters reported were obtained by numerical fitting of experimental data in the
Origin 6.1 software package.

19
3 Results and Data Analysis
Steam reforming (SR) of ethanol was studied using a reactant mixture with a molar water-to-
ethanol ratio of 3:1, which corresponded to the ideal stoichiometric ratio for the production of
hydrogen (1). The ratio of catalyst weight to reactant flow rate was 7.8 (kg / m/sec). Ethanol
vapor, steam, and argon flow rates were set at 10, 31, and 120 sccm, respectively. These
conditions produced a Gas Space Hourly Velocity (GHSV)—defined as the milliliters of reactant
flow per hour per milliliters of catalyst used—of approximately 5000 hr-1 at 400oC over ceria-
supported Pt. The total amount of ethanol converted was the difference between the ethanol
flow rate at the inlet and the detected ethanol flow rate at the outlet. While hydrogen
selectivity would be maximized at lower reactant feed rates (and lower GSHV), low reactant
conversion (≈ 25%) and a smaller slope in molar-selectivity-to-GSHV is required to accurately
study kinetic reaction data in the differential regime of the reactor. Figure 3 shows a plot of
GSHV versus ethanol conversion and hydrogen selectivity using steam reforming conditions over
a ceria-supported platinum catalyst. At a GSHV of 5000 hr-1 the steam reforming reaction
should occur in the differential regime of the reactor. Systemic error for steam reforming
measurements is represented by error bars of 5.4%. Product gases will be presented in units of
molar selectivity, defined in this study as the ratio of moles produced for a certain byproduct to
the moles of ethanol converted.

20
Figure 3: Plot of hydrogen selectivity and ethanol conversion versus reactant residence time over a Pt/CeO2
catalyst. Temperature is 400oC, and the reactant mixture has a water-to-ethanol ratio of 3:1.
Oxidative steam reforming (OSR) of ethanol was studied using a water-to-ethanol-to-oxygen
molar ratio of 1.8:1.0:0.6, which corresponds to the optimal stoichiometric ratio for the
production of hydrogen (7). The ratio of catalyst mass to reactant flow rate was 6.1 (kg /
m/sec). Ethanol vapor, steam, oxygen, and argon flow rates were set to 15.7, 28.2, 9.4, and 120
sccm, respectively. These settings produced a GSHV of approximately 6400 hr-1 at 400oC over
ceria-supported Pt. Ethanol conversion at these conditions is around 40% (see Figure 4), but
hydrogen selectivity is relatively low and appears independent of residence time at these
conditions. Thus, OSR at a GSHV of 6400 hr-1 should fall within the differential regime of the
reactor and allow for accurate calculation of kinetic information. Systemic error for oxidative
steam reforming measurements is represented by error bars of 7.1%.

21
Figure 4: Plot of hydrogen selectivity and ethanol conversion versus reactant residence time over a Pt/CeO2
catalyst. Temperature is 400oC, and the reactant mixture has a water-to-ethanol-to-oxygen molar ratio of
1.8:1.0:0.6.
Reforming byproducts for steam reforming and oxidative steam reforming were studied at 50oC
intervals between 200oC and 400oC over ceria-supported platinum, rhodium, platinum-tin, and
rhodium-tin catalysts using the flow rates information given above. For results using different
reactant flow conditions, reactant composition will be noted in subsequent sections. Reforming
byproducts were analyzed for trends resulting from the varying the stoichiometric reactant
compositions. The steam, ethanol or oxygen concentration in the reactant mixture was varied,
while the remaining reactant components were held constant. During these studies,
temperature was held constant at 400oC.

22
3.1 Steam Reforming
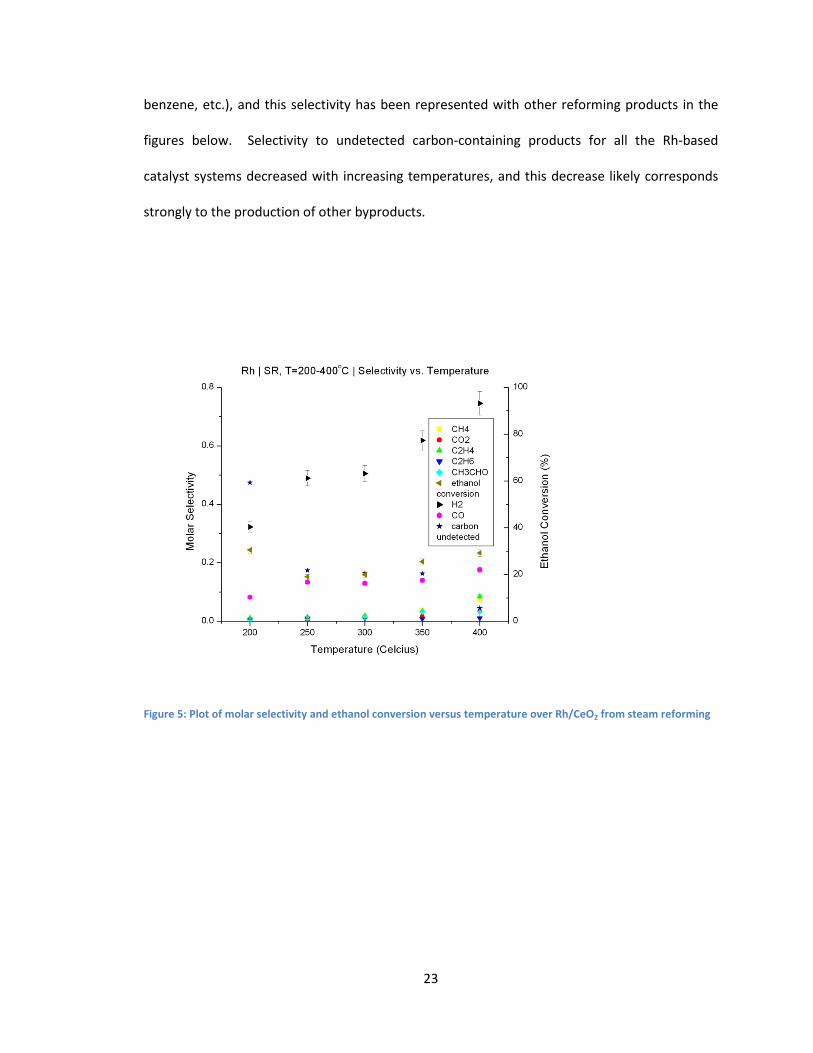
3.1.1 RhxSn1-x/CeO2, (x = 1, 0.9, 0.8) Selected results of the ethanol steam reforming studies over Rh-based catalysts are presented in
Figures 5–10. Ethanol conversion is one of the primary means for comparing the performance
of a catalyst, as it correlates the efficiency of the complex reaction mechanisms that produce
the byproducts detected. The conversion of ethanol varied between 20% and 40%, generally
increasing with increasing temperature over Rh, while slightly decreasing with increasing
temperature over Rh8Sn2. Ethanol reforming over Rh9Sn1 produced the highest ethanol
conversion (30–35%) amongst Rh-based catalysts. Selectivity for hydrocarbons and carbon
dioxide remained minimal (< 0.1) for all Rh-based catalyst systems and temperatures, although
selectivity for these products was enhanced by increasing temperature. As shown in Figure 8,
selectivity to smaller hydrocarbons (methane, ethylene) and carbon dioxide was higher with
steam reforming over the Rh catalyst, while selectivity to acetaldehyde (ethanal/CH3CHO) was
higher with steam reforming over Rh-Sn catalyst systems. The primary products observed in
these steam reforming studies were hydrogen and carbon monoxide. Carbon monoxide
selectivity increased with increasing temperature across all catalyst systems studies (0.1–0.2).
Hydrogen selectivity increased with temperature for the Rh and the Rh8Sn2 catalyst. Selectivity
increased more slowly and exponentially for the Rh9Sn1 catalyst. At 400oC, production and
selectivity to hydrogen was highest for Rh8Sn2, followed by Rh9Sn1 and Rh. The Rh9Sn1 catalyst
had the lowest hydrogen selectivity in the group at temperatures below 350oC, while the Rh8Sn2
catalyst had the highest selectivity above 300oC. Finally, by calculating the difference between
the moles of carbon in the reactants and the moles of carbon in the products, the moles of
undetected carbon-containing products can be estimated. This difference can be attributed to
the selectivity for carbon-containing products that were not detected by our experiment (i.e.,
23
benzene, etc.), and this selectivity has been represented with other reforming products in the
figures below. Selectivity to undetected carbon-containing products for all the Rh-based
catalyst systems decreased with increasing temperatures, and this decrease likely corresponds
strongly to the production of other byproducts.
Figure 5: Plot of molar selectivity and ethanol conversion versus temperature over Rh/CeO2 from steam reforming

24
Figure 6: Plot of molar selectivity and ethanol conversion versus temperature over Rh9Sn1/CeO2 from steam
reforming
Figure 7: Plot of molar selectivity and ethanol conversion versus temperature over Rh8Sn2/CeO2 from steam
reforming

25
Figure 8: Plot of carbon product selectivity from steam reforming over Rh/CeO2-based catalysts
Figure 9: Plot of carbon monoxide and carbon dioxide selectivity from steam reforming over Rh/CeO2-based
catalysts

26
Figure 10: Plot of hydrogen selectivity and ethanol conversion from steam reforming over Rh/CeO2-based catalysts
3.1.2 PtxSn1-x/CeO2, (x = 1, 0.9, 0.8) Results for ethanol reforming over Pt-based catalysts are presented in Figures 11–16. The
conversion of ethanol varied slightly between values of 25% and 40%, with no strong correlation
to temperature for any of the catalysts. Selectivities for carbon dioxide and hydrocarbon
production over Pt are similar to those over Rh; remaining small (≤ 0.1) and showing increases
with increasing temperature. As shown in Figure 14, hydrocarbon and carbon dioxide selectivity
was highest over the Pt8Sn2; while decreasing as Sn content in the catalyst decreases. Hydrogen
selectivity and temperature dependent trends varied significantly as Sn content was added to
the Pt catalyst. As temperature increased, molar selectivity to hydrogen increased over Pt and
Pt8Sn2. Over the Pt9Sn1 catalyst, molar selectivity to hydrogen decreased slightly with increasing
temperature from a value of 0.75 to 0.6. The selectivity to hydrogen at 200oC for the Pt9Sn1
catalyst was significantly larger than the other Pt catalyst systems studied. Above 250oC,
hydrogen selectivity was slightly higher over the Pt8Sn2 system. Trends in carbon monoxide

27
selectivity for the different Pt-based systems approximately mirrored the hydrogen selectivity
trends. Finally, selectivity to undetected carbon-containing products decreased as temperature
increased and as the Sn composition of the catalyst increased. Given that this trend holds true
for both Pt-based and Rh-based catalysts, these results suggest that the larger unidentified
products play a significant role in ethanol reforming within this temperature range.
Figure 11: Plot of molar selectivity and ethanol conversion versus temperature over Pt/CeO2 from steam reforming

28
Figure 12: Plot of molar selectivity and ethanol conversion versus temperature over Pt9Sn1/CeO2 from steam
reforming
Figure 13: Plot of molar selectivity and ethanol conversion versus temperature over Pt8Sn2/CeO2 from steam
reforming

29
Figure 14: Plot of carbon selectivity from steam reforming over Pt/CeO2-based catalysts from steam reforming
Figure 15: Plot of hydrogen selectivity and ethanol conversion from steam reforming over Pt/CeO2-based catalysts

30
Figure 16: Plot of carbon monoxide and carbon dioxide selectivity from steam reforming over Pt/CeO2-based
catalysts
3.1.3 Activation Energies for Rate-Determining Reactions Ethanol reforming over various catalyst systems was measured at various temperatures, in
order to gain information about the reaction rate. Activation energies for the different
byproduct species were derived from mathematical fitting to the Arrhenius relation
in which k is the rate constant, ko is a constant pre-exponential factor, Ea is the activation energy
of the rate-determining reaction step, R is the universal gas constant, and T is the absolute
temperature. The production of byproducts measured at the outlet of the reactor was taken as
the rate constant. Using the expression above, activation energies were derived from the steam
reforming results shown in the Appendix. In Table 2, activation energies from steam reforming
studies of various catalyst systems are displayed for byproducts with deterministic trends.
Ethanol conversion to hydrogen was the most efficient over the Rh8Sn2 catalyst, followed by

31
Pt8Sn2, Rh, and Pt catalyst systems. The Rh and Rh8Sn2 catalyst produced carbon monoxide and
some hydrocarbons with similar activation energies, while steam reforming over Rh9Sn1 and Pt9-
Sn1 is significantly less efficient for the same byproducts.
Table 2: Activation energies (kJ) for steam reforming byproducts detected between temperatures of 200oC and
400oC. (Activation energies calculated between temperatures of 200oC and 350oC)* (Activation energies calculated
between temperatures of 300oC and 400oC)**
Catalyst CH4 CO2 C2H4 C2H6 CH3CHO H2 CO
5 % Rh / CeO2 33 46 53 132 16 47 61
5 % Rh9Sn1 / CeO2 49 104 90 113 73 66 104
5 % Rh8Sn2 / CeO2* 75 45 54 45 82 120
5% Pt / CeO2 17 89 52 50
5% Pt9Sn1 / CeO2 87 96 87 116
5% Pt8Sn2 / CeO2 112 68 17 51** 50**
When comparing the results of ethanol steam reforming over Rh-based catalyst systems
studied, Rh8Sn2 showed the highest molar selectivity to hydrogen at 400oC and the highest
activation energy for H2. As indicated by the Arhenius Equation, a high activation energy
correlates with strong temperature dependence; and Sn composition in the Rh catalysts
strengthens this correlation in almost linear fashion. However, steam reforming over Pt-based
catalyst systems showed less consistency in their species production trends or activation
energies. Steam reforming over Pt9Sn1, produced the highest activation energy for hydrogen
production amongst the Pt-based catalysts. Additionally, the high hydrogen selectivity at 200oC
and the trend of decreasing hydrogen selectivity with increasing temperature over the Pt9Sn1
catalyst was an intriguing anomaly within this study. While the role of catalyst composition,

32
alloy microstructure, and reactor temperature may have varying or interrelated roles on
byproduct selectivity; this result suggests that ethanol catalyst composition may be optimized
for prime ethanol conversion within a range of temperatures. In addition, the trends presented
suggest that there are several competing reaction pathways for hydrogen production within the
temperature range studied. Carbon dioxide and carbon monoxide production over Pt catalysts
was enhanced by the addition of a Sn component. On the other hand, carbon dioxide
production over Rh catalysts systems was reduced by the presence of the Sn component.
Additionally, the Pt-Sn catalyst systems were more effective in the production of hydrogen at
low temperatures then were the Rh-Sn catalyst systems.
3.2 Oxidative Steam Reforming
In this study, oxidative steam reforming considers ethanol reforming in the presence of oxygen
and steam in which Water:Ethanol:Oxygen = 1.8:1:0.6.
3.2.1 RhxSn1-x/CeO2, (x = 1, 0.9, 0.8) Figures 17–21 show molar selectivity data plotted versus temperature over Rh-based catalysts.
Compared to the steam reforming data, ethanol conversion in oxidative steam reforming is
enhanced (40–60% for Rh-based catalysts). However, this enhancement leads to an increased
selectivity of small carbon-containing species (CO, CO2, and CH4) and does not lead to an
increased production or selectivity to hydrogen. Over the Rh catalyst, the molar selectivity to
hydrogen was similar to the selectivity of methane and carbon monoxide (≈ 0.15), while carbon
dioxide was produced at slightly larger selectivities. This trend remains fairly temperature
independent below 350oC. Plots for oxidative steam reforming over Rh9Sn1 and Rh8Sn2 catalysts
show similar trends in product selectivity. Selectivity to hydrogen, carbon monoxide, carbon
dioxide, and methane was measured between 0.15 and 0.35 at temperatures of 350oC and
below. Over the Rh9Sn1 catalyst, carbon dioxide decreased slightly and hydrogen increased

33
steadily with increasing temperature. Over Rh8Sn2, the selectivity of carbon dioxide peaked at
400oC, whereas selectivity to hydrogen and carbon monoxide decreased with increasing
temperature. Selectivity to other detected byproducts (larger hydrocarbons) remained minimal
(< 0.1) in all studies of oxidative steam reforming over Rh based samples. Selectivity to
undetected carbon-containing products is shown in Figure 17, but was minimal over the
remaining Rh-Sn systems.
Figure 17: Plot of molar selectivity and ethanol conversion versus temperature over Rh/CeO2 from steam reforming

34
Figure 18: Plot of molar selectivity and ethanol conversion versus temperature over Rh9Sn1/CeO2 from steam
reforming
Figure 19: Plot of molar selectivity and ethanol conversion versus temperature over Rh8Sn2/CeO2 from steam
reforming

35
Figure 20: Plot of hydrogen selectivity and ethanol conversion over Rh/CeO2-based catalysts from oxidative steam
reforming
Figure 21: Plot of carbon monoxide and carbon dioxide selectivity over Rh/CeO2-based catalysts from oxidative
steam reforming

36
3.2.2 PtxSn1-x/CeO2, (x = 1, 0.9, 0.8) Oxidative steam reforming results from Pt-based catalysts are presented in Figures 22-26.
Ethanol conversion varied slightly with respect to temperature and was highest over the Pt8Sn2
catalyst (≈ 55%), followed by Pt9Sn1 (≈ 50%), and Pt (≈ 45%). These results show that increasing
Sn content correlates directly to an increased ethanol conversion. As shown in Figures 25 & 26,
increasing Sn content strongly correlated to increasing hydrogen selectivity, increasing carbon
monoxide selectivity, and decreasing carbon dioxide selectivity. Hydrogen and carbon
monoxide selectivities were highest over the Pt8Sn2 catalyst, followed by Pt9Sn1, and Pt. On
average across the temperatures studied, carbon dioxide selectivity (0.15-0.35) was highest over
the Pt catalysts, followed by Pt9Sn1, and Pt8Sn2 catalysts. Selectivity to hydrocarbons remained
minimal (< 0.1) but was largest over Pt8Sn2. There were no strong temperature dependent
trends observed.
Figure 22: Plot of molar selectivity and ethanol conversion versus temperature over Pt/CeO2 from oxidative steam
reforming

37
Figure 23: Plot of molar selectivity and ethanol conversion versus temperature from over Pt9Sn1/CeO2 from
oxidative steam reforming
Figure 24: Plot of molar selectivity and ethanol conversion versus temperature over Pt8Sn2/CeO2 from oxidative
steam reforming

38
Figure 25: Plot of hydrogen selectivity and ethanol conversion over Pt/CeO2-based catalysts from oxidative steam
reforming
Figure 26: Plot of carbon monoxide and carbon dioxide selectivity over Pt/CeO2-based catalysts from oxidative
steam reforming.

39
Selectivities to products for oxidative steam reforming were significantly more independent of
temperature than were byproduct selectivities from steam reforming. Additionally, the
enhanced ethanol conversion improved production of carbon monoxide, carbon dioxide, and
methane. However, hydrogen production was severely decreased and rendered oxidative
steam reforming inefficient as compared to steam reforming. For these reasons, activation
energies were not calculated for oxidative steam reforming products. Finally, the role of Sn on
product selectivity and ethanol is more deterministic in conjunction with the Pt catalyst then
with the Rh catalyst.
3.3 Ethanol Reforming with Varying Reactant Composition
Reforming products were additionally studied to determine the effect of shifts in reactant
composition on the composition of product gas. The composition for one component of the
reactant mixture was varied, while the other reactant components were held constant.
Temperatures were held constant at 400oC. By varying reactant composition around the
stoichiometric reactant ratios for steam reforming and oxidative steam reforming; and
measuring the related changes in effluent production, we can calculate the reaction orders of
the detected byproducts with respect to the variable reactant. In chemical kinetics, a reaction
order with respect to a certain reactant is defined as the power to which a reactant’s
concentration affects the product’s reaction rate. This relationship is expressed as
,
in which r is the reaction rate, k is the reaction constant, A is the reactant concentration, and x is
the reaction order. Reaction order would be equal to the stoichiometric coefficient in a single-
step elementary reaction. Using the expression above, byproduct reaction orders were derived
from the steam reforming results shown in the Appendix. In this study, we will analyze reaction

40
orders for different byproducts and compare how reaction orders change with the catalyst
compositions considered. This approach will allow us to identify which reactant components
and catalyst compositions most strongly effect product composition.
Reaction orders for different steam reforming byproducts are shown in Tables 3–4. Information
on the reactant compositions that produced the reaction orders is given in the subsequent
tables. Reaction order information is most relevant for the largest products of steam
reforming—hydrogen and carbon monoxide. Table 3 displays reaction orders for steam
reforming byproducts in which the steam content was varied. It was unexpected that increasing
steam content would slightly inhibit the production of H2 for the case of steam reforming over
Rh and Pt8Sn2; as hydrogen reaction orders would be positive based on reactions (1) and (2) .
However, this is not the case for the remaining catalyst systems. Hydrogen production
increased as steam concentration increased over Rh9Sn1, Rh8Sn2, Pt, and Pt9Sn1 catalyst systems.
Due to similarities in the reaction orders for H2 and CH3CHO for the Rh-Sn catalysts systems, it is
plausible that these species could be principally produced by ethanol dehydrogenation (11);
which would corroborate these species’ close reaction orders. Increasing water content in the
reactant composition improved the production of carbon dioxide and methane over Rh9Sn1 and
Pt9Sn1; while reducing production of these byproducts over Rh8Sn2 and Pt8Sn2. The role of
increasing ethanol concentration on steam reforming over Rh catalyst improved the production
of all identifiable products rather uniformly, and may be due to ethanol decomposition
reactions (8-9) . Hydrogen and hydrocarbon production was enhanced more strongly by the
ethanol concentration than by the water concentration when steam reforming is conducted
over Rh & Pt catalyst systems; while hydrogen production is more effectively enhanced by water
concentration over the Rh-Sn and Pt9Sn1 catalyst systems.

41
Table 3: Reaction orders of byproducts with respect to water for steam reforming over different catalysts. The
ratio of water-to-ethanol in the reactant is 4.0–2.0. The ethanol flow rate is 10.4 sccm.
CH4 CO2 C2H4 C2H6 CH3CHO H2 CO
Rh -0.334 0.772 -0.906 -0.031 -0.667 -0.211 -0.225
Rh9Sn1 0.789 0.695 -0.931 -0.938 0.955 0.858 0.924
Rh8Sn2 -0.073 -0.953 -0.709 0.932 0.955 0.964 -0.968
Pt -0.169 -0.254 -0.994 -0.724 0.794 0.220 -0.656
Pt9Sn1 0.692 0.171 -0.2945 -0.811 .910 0.608 -0.179
Pt8Sn2 -0.555 -0.256 -0.9765 -1.000 -0.424 -0.578 0.896
Table 4: Reaction orders of byproducts with respect to ethanol for steam reforming over different catalysts. The
ratio of water-to-ethanol in the reactant is 4.50–2.25. The water flow rate is 31.1 sccm.
CH4 CO2 C2H4 C2H6 CH3CHO H2 CO
Rh 0.768 0.792 0.889 0.713 0.893 0.83 0.754
Rh9Sn1 0.948 0.667 0.409 0.563 0.52 0.81 0.592
Rh8Sn2 0.669 -0.755 0.999 0.563 0.52 0.808 0.648
Pt 0.979 0.880 0.949 0.963 0.103 0.997 -0.997
Pt9Sn1 -0.362 -0.346 -0.094 -0.663 0.106 0.316 0.753
Pt8Sn2 -0.822 -0.353 0.863 -0.283 -0.227 -0.262 -0.941
Reaction orders for oxidative steam reforming byproducts are shown in Tables 5–6. Information
on the reactant compositions that produced the reaction orders is given in the subsequent
tables. Increasing steam concentration in the reactant composition has varying effects on
hydrogen production. As shown in Table 5, hydrogen production decreased over Rh and Pt9Sn1;

42
while increasing over Rh9Sn1, Pt, and Pt8Sn2. On the other hand, increasing steam concentration
favorably affected carbon monoxide and methane production over Rh, while decreasing carbon
monoxide and methane production over Rh9Sn1, Pt, and Pt9Sn1. Increasing water concentration
had less of an effect on production of these species over Rh8Sn2. Carbon dioxide production was
enhanced by increasing water concentration in the reactant mixture over Rh and Pt. This trend
was reversed over Pt-Sn systems and Rh8Sn2, as carbon dioxide production decreased with
increasing steam concentration. In general, increasing water concentration in the reactant
composition was more favorable to the production of carbon-containing species over Rh and Pt
while promoting hydrogen production over Rh9Sn1 and Pt8Sn2 catalyst systems. In Table 6,
reaction orders with respect to oxygen were shown for various byproducts. Increasing the
oxygen content of the reactants lead to increases in hydrogen production over Rh and decreases
in hydrogen production over the Rh-Sn and Pt-based catalyst systems. The primary effect of
increasing the oxygen reactant composition was an almost linear increase in the production of
carbon dioxide for all catalyst systems studied; and the order of the carbon dioxide reaction is
strongly corroborated by the species order in stoichiometric partial oxidation reaction (4) and
the stoichiometric oxidative steam reforming reaction (7). Methane production increased with
increasing oxygen reactant composition, but this effect decreased as Sn was added to the
catalyst composition. Additionally, increasing oxygen content in the reactant composition lead
to increased carbon monoxide production over Rh and Rh8Sn2, while decreasing carbon
monoxide production over Rh9Sn1 and Pt-based catalyst systems.

43
Table 5: Reaction order of byproducts with respect to water for oxidative steam reforming over different catalysts.
The ratio of water-to-ethanol is 2.4–1.2. The ethanol flow rate is 15.7 sccm and the oxygen rate is 9.4 sccm.
CH4 CO2 C2H4 C2H6 CH3CHO H2 CO
Rh 0.932 0.784 0.431 0.984 0.825 -0.611 0.863
Rh9Sn1 -0.877 0.295 -0.088 -0.987 -0.858 0.706 -0.91
Rh8Sn2 -0.194 -0.797 0.436 0.362 0.995 0.042 0.149
Pt -0.670 1.000 0.183 -0.780 0.270 0.407 -0.836
Pt9Sn1 -0.999 -0.988 -0.664 -0.995 0.042 -0.861 -1
Pt8Sn2 -0.332 -0.976 0.362 0.133 0.159 0.499 .207
Table 6: Reaction order of byproducts with respect to oxygen for oxidative steam reforming over different
catalysts. The ratio of oxygen-to-ethanol is 0.4–0.8. The water flow rate is 28.2 sccm and the oxygen 9.4 sccm.
CH4 CO2 C2H4 C2H6 CH3CHO H2 CO
Rh 0.902 0.913 0.681 0.854 1 0.822 -0.422
Rh9Sn1 0.709 0.926 -0.104 0.883 -0.401 -0.455 0.833
Rh8Sn2 0.246 1.000 -0.965 0.384 -0.995 -0.909
Pt 0.997 1.000 -0.685 0.993 0.016 -0.604 0.992
Pt9Sn1 0.905 0.973 0.692 0.912 0.991 -0.190 0.980
Pt8Sn2 0.443 0.972 -0.319 0.206 -0.645 -0.471 0.409
As shown in Table 7, increasing ethanol content in the reactant composition lead to various
effects on the reaction order of byproducts over the catalysts studied. Hydrogen production
over Rh and Rh9Sn1 and Pt8Sn catalysts was improved by increasing ethanol content, while
hydrogen production was reduced by increasing ethanol composition over Pt9Sn1 catalysts.
44
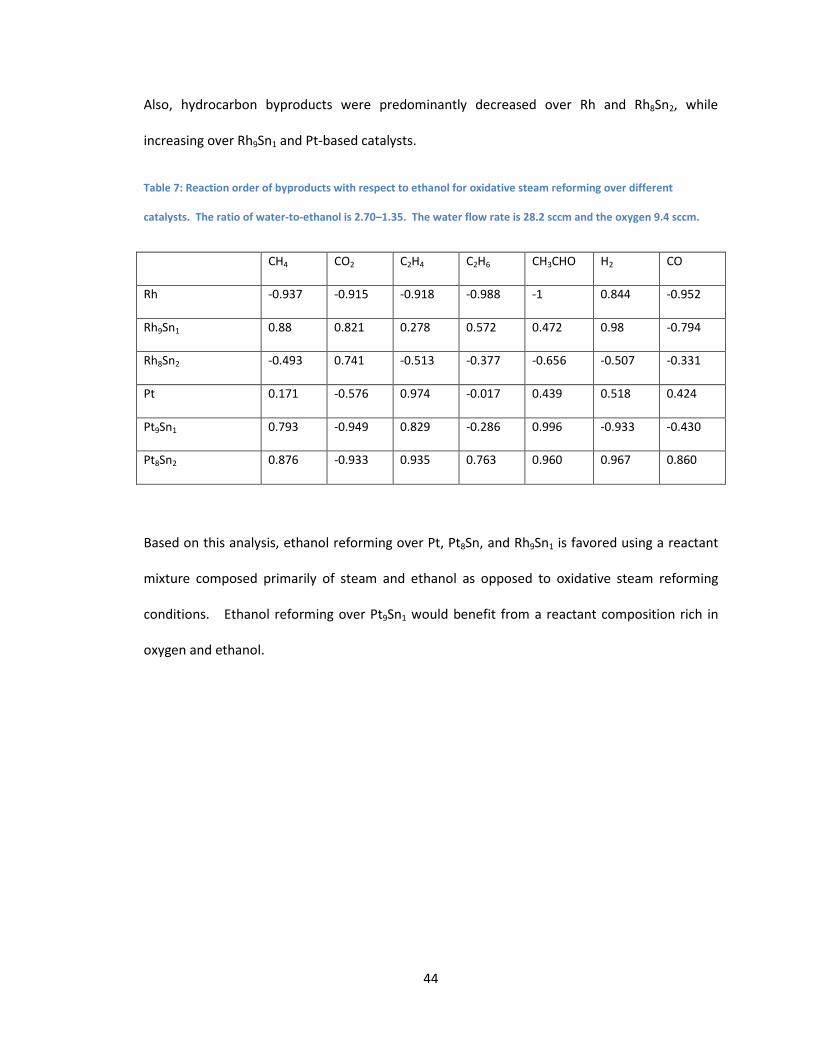
Also, hydrocarbon byproducts were predominantly decreased over Rh and Rh8Sn2, while
increasing over Rh9Sn1 and Pt-based catalysts.
Table 7: Reaction order of byproducts with respect to ethanol for oxidative steam reforming over different
catalysts. The ratio of water-to-ethanol is 2.70–1.35. The water flow rate is 28.2 sccm and the oxygen 9.4 sccm.
CH4 CO2 C2H4 C2H6 CH3CHO H2 CO
Rh -0.937 -0.915 -0.918 -0.988 -1 0.844 -0.952
Rh9Sn1 0.88 0.821 0.278 0.572 0.472 0.98 -0.794
Rh8Sn2 -0.493 0.741 -0.513 -0.377 -0.656 -0.507 -0.331
Pt 0.171 -0.576 0.974 -0.017 0.439 0.518 0.424
Pt9Sn1 0.793 -0.949 0.829 -0.286 0.996 -0.933 -0.430
Pt8Sn2 0.876 -0.933 0.935 0.763 0.960 0.967 0.860
Based on this analysis, ethanol reforming over Pt, Pt8Sn, and Rh9Sn1 is favored using a reactant
mixture composed primarily of steam and ethanol as opposed to oxidative steam reforming
conditions. Ethanol reforming over Pt9Sn1 would benefit from a reactant composition rich in
oxygen and ethanol.

45
4 Conclusion and Future Work
Binary metallic catalysts offer several advantages over single-phase metal catalysts for the
purposes of low-temperature ethanol reforming. Steam reforming over Pt-Sn and Rh-Sn
catalysts showed improvements in hydrogen selectivity over single-phase Pt and Rh catalysts
between 200oC and 400oC. Ethanol reforming over Pt8Sn2 and Rh8Sn2 offered lower activation
energies for hydrogen then single-phase systems offered; and thus the most efficient of the
systems considered for the production of hydrogen. However, ethanol reforming over Pt9Sn1
and Rh9Sn1 yielded activation energies for hydrogen that were higher than the single-phase
systems. The most surprising result was that the Pt9Sn1 catalyst system showed the largest
hydrogen selectivity and productivity at 200oC of all the catalyst systems considered. These
results demonstrate the plausibility of catalytic ethanol reforming in a temperature range that
would be suitable for the operation of solid acid fuel cells and polymer electrolyte membrane
fuel cells. Selectivity trends and kinetic information suggest that the role of catalyst
composition may have a primary but varying role on the ethanol reforming reaction mechanism.
Additionally, it was unexpected that increasing steam content would slightly inhibit the
production of hydrogen over Rh and Pt8Sn2. However, steam reforming over the Rh-Sn and
Pt9Sn1 catalyst systems favors a reactant mixture with a rich steam composition.
Oxidative steam reforming over these catalyst systems showed improvements in ethanol
conversion, and production of carbon monoxide, carbon dioxide, and methane. However,
hydrogen production was severely decreased, and renders oxidative steam reforming inefficient
as compared to steam reforming. By calculating the yield of undetected carbon-containing
products and showing how production of carbon-containing products decreases with increasing
temperature, this study indicates the need for a more complete identification of ethanol
reforming byproducts at low temperature. The ability to identify all reforming byproducts

46
would further clarify selectivity trends, kinetic reaction parameters, and possible reaction
mechanism.
This study has served to elucidate the relationship between ethanol reforming conditions,
catalyst composition, and resultant product composition in a temperature that has been
frequently disregarded by similar studies of ethanol conversion. Kinetic parameters have been
identified and certain trends in product selectivity have been highlighted; but there is much
work to be done before establishing a credible model of the ethanol reforming reaction
mechanism or optimizing a catalyst for ethanol reforming.
Amongst the catalyst systems considered for ethanol steam reforming, hydrogen production
was highest over Pt9Sn1 and Rh8Sn2 for the temperature range of 200oC to 400oC. Further
hydrogen production and kinetic information could be obtained from decreasing the reactant’s
flow rate and increasing the reactant’s steam content during reforming over these catalyst
systems. The resulting conditions would serve to enhance hydrogen production and ethanol
conversion, while providing more kinetic information from which to assess the associated
reaction mechanism.
A similar study of different Pt-Rh-Sn catalyst systems would be useful in clarifying how catalyst
composition effects ethanol reforming. Previous studies of ternary catalyst systems have
suggested that synergistic interactions between catalyst components can allow new reaction
pathways for ethanol reforming. Given that in this study, hydrogen selectivity peaks at different
temperatures for Pt9Sn1 and Pt8Sn2, ethanol reforming over an optimized Pt-Rh-Sn catalyst
system could reveal more information about the role of catalyst composition and reactor
temperature.
Finally, additional experimental methods could be used to analyze reforming byproducts and to
further characterize the catalyst materials employed. The use of a GC/MS would extend analysis

47
of ethanol conversion by detecting liquid products—particularly some heavier carbon-
containing compounds. A complete picture of reforming byproducts could help to identify
possible reaction pathways, as well as address other issues of catalyst deactivation and optimal
reactor conditions.

48
5 Acknowledgements
This work has been funded by The James Irvine Foundation and the California Institute of
Technology, Office of Graduate Studies. Additional support has been provided by the Office of
Naval Research and the Global Climate and Energy Program of Stanford University.
I’d like to sincerely thank my thesis committee—Dr. Sossina M. Haile, Dr. Kaushik Bhattacharya,
and Dr. Joseph E. Shepherd. These scientists have offered their academic support and their
patience. My deepest appreciation is offered to my advisor Sossina, whose bold scholarship and
steadfast vision in her field have motivated me to push past earlier setbacks and to see this
journey to its full completion. I’ve been profoundly humbled by the guidance of Dr. David
Goodwin, whose sense of creativity and adventure first garnered my interest in the study of fuel
cells and interfacial chemistry. This experience has been greatly strengthened by the
collaborative efforts and the friendship of Dr. Adrian Hightower. The opportunity to complete
this study would not have been possible without his inspiration and advocacy.
In addition, Professor Ken Pickar has my gratitude for allowing me the privilege to serve as his
teaching assistant and—despite my naivety—the opportunity to take part in the rewriting of his
course curriculum. The experience afforded me training and mentorship that has and continues
to profoundly shape my aspirations as an educator. Thanks are due to my friends and
colleagues for all the ways that they have contributed to my graduate education, for both
challenging and championing my work, for their emotional support, and for their persistent
motivation when I had little left and less to give in return. Continued love to my parents, Quida
and Eugene. Thank you for nurturing me, for showing me how to love, and for teaching me
what in life is worth the fight.

49
This thesis is dedicated to the memory of Elaine Joy Aton de la Cruz. I remain indebted to her
friendship, her consciousness and the boldness with which she pursued her life.
All praise is due to the creator. Any errors, omissions, or oversimplifications are my own, for
which I accept full responsibility and seek forgiveness.

50
6 References
1. O. Akdim, W. Cai, V. Fierro, H. Provendier, A. van Veen, W. Shen, and C. Mirodatos.
Oxidative Steam Reforming of Ethanol over Ni–Cu/SiO2, Rh/Al2O3 and Ir/CeO2: Effect of
Metal and Support on Reaction Mechanism. Top Catal 51 2008: 22–38.
2. F. Aupretre, C. Descorme, and D. Duprez. Hydrogen production for fuel cells from the
catalytic ethanol steam reforming. Top Catal 30 2004: 487-491
3. F. Aupretre, C. Descorme, D. Duprez, D. Casanave, and D. Uzio. Ethanol steam
reforming over MgxNi1−xAl2O3 spinel oxide-supported Rh catalysts. Journal of Catalysis.
233 2005: 464-477.
4. P. Bera and J. M. Vohs. Reaction of CH3OH on Pd/ZnO(0001) and PdZn/ZnO(0001) Model
Catalysts. J. Phys. Chem. C 111 2007: 7049-7057.
5. J.L. Bi, Y.Y. Hong, C.C. Lee, C.T. Yeh, and C.B. Wang. Novel zirconia-supported catalysts
for low-temperature oxidative steam reforming of ethanol. Catalysis Today 129 2007:
322–329.
6. F. Colmati, E. Antolini, E.R. Gonzalez. Preparation, structural characterization and
activity for ethanol oxidation of carbon supported ternary Pt–Sn–Rh catalysts. J. of
Alloys and Compounds: 456 2008: 264–270.
7. Y. Chen, Z. Shao, and N. Xu. Ethanol Steam Reforming over Pt Catalysts Supported on
CexZr1-xO2 Prepared via a Glycine Nitrate Process. Energy & Fuels 22 2008: 1873–1879.
8. S.M. de Lima, I.O. da Cruz, G. Jacobs, B.H. Davis, L.V. Mattos, and F.B. Noronha. Steam
reforming, partial oxidation, and oxidative steam reforming of ethanol over Pt/CeZrO2
catalyst. Journal of Catalysis 257 2008: 356–368.

51
9. J.P.I. de Souza, S.L. Queiroz, K. Bergamaski, E.R. Gonzalez, and F.C. Nart. Electro-
Oxidation of Ethanol on Pt, Rh, and PtRh Electrodes. A Study Using DEMS and in-Situ
FTIR Techniques. J. Phys. Chem. B 106 2002: 9825-9830
10. A. Erdohelyi, J. Raskó, T. Kecskés, M. Tóth, M. Dömök, and K. Baán. Hydrogen formation
in ethanol reforming on supported noble metal catalysts. Catalysis Today 116 2006:
367–376.
11. A.E. Farrell, R.J. Plevin, B.T. Turner, A.D. Jones, M. O’Hare, and D.M. Kammen. Ethanol
Can Contribute to Energy and Environmental Goals. Science. 311 27 January 2006: 506-
508.
12. F. Frusteri, S. Freni, L. Spadaro, V. Chiodo, G. Bonura, S. Donato, and S. Cavallaro. H2
production for MC fuel cell by steam reforming of ethanol over MgO supported Pd, Rh,
Ni and Co catalysts. Catalysis Communications 5 2004: 611–615.
13. A. Haryanto, S. Fernando, N. Murali, and S.l. Adhikari. Current Status of Hydrogen
Production Techniques by Steam Reforming of Ethanol: A Review. Energy & Fuels. 19
2005: 2098-2106.
14. H. Idriss, C. Diagne, J. P. Hindermann, A. Kiennemann, and M.A. Barteau. Reactions of
Acetaldehyde on CeO2 and CeO2-Supported Catalysts. Journal of Catalysis 155 1995:
219-237.
15. G. Jacobs, R.A. Keogh, and B.H. Davis. Steam reforming of ethanol over Pt/ceria with co-
fed hydrogen. Journal of Catalysis 245 2007: 326–337.
16. L. Jiang, G. Sun, S. Sun, J. Liu, S. Tang, H. Li, B. Zhou, and Q. Xin. Structure and chemical
composition of supported Pt–Sn electrocatalysts for ethanol oxidation. Electrochimica
Acta 50 2005: 5384–5389.
52
17. A. Kowal, S.Lj. Gojkovic, K.S. Lee, P. Olszewski, and Y.E. Sung. Synthesis, characterization
and electrocatalytic activity for ethanol oxidation of carbon supported Pt, Pt–Rh, Pt–
SnO2 and Pt–Rh–SnO2 nanoclusters. Electrochemistry Communications 11 2009: 724–
727
18. F.H.B. Lima and E.R. Gonzalez. Ethanol electro-oxidation on carbon-supported Pt–Ru,
Pt–Rh and Pt–Ru–Rh nanoparticles. Electrochimica Acta 53 2008: 2963–2971.
19. S.S.Y. Lin, D.H. Kim, and S.Y. Ha. Hydrogen Production from Ethanol Steam Reforming
Over Supported Cobalt Catalysts. Catal Lett 122 2008: 295–301.
20. L.V. Mattos and F.B. Noronha. Partial oxidation of ethanol on supported Pt catalysts.
Journal of Power Sources 145 2005: 10–15.
21. L.V. Mattos and F.B. Noronha. The influence of the nature of the metal on the
performance of cerium oxide supported catalysts in the partial oxidation of ethanol.
Journal of Power Sources 152 2005: 50–59.
22. M. Mavrikakis, D.J. Doren, and M.A. Barteau. Density Functional Theory Calculations for
Simple Oxametallacycles: Trends across the Periodic Table. Journal of Physical
Chemistry B 102 1998: 394-399.
23. K.D. Pointon. Review of work on internal reforming in the Solid Oxide Fuel Cell. British
Gas plc. Crown. 1997.
24. J. Raskó, A. Hancz, and A. Erdóhelyi. Surface species and gas phase products in steam
reforming of ethanol on TiO2 and Rh/TiO2. Applied Catalysis A: General 269 2004: 13-25.
25. J. Ribeiro, D.M. dos Anjos, K.B. Kokoh , C. Coutanceau, J.M. Léger, P. Olivi, A.R. de
Andrade, and G. Tremiliosi-Filho. Carbon-supported ternary PtSnIr catalysts for direct
ethanol fuel cell. Electrochimica Acta 52 2007: 6997–7006.

53
26. J. Ribeiro, D.M. dos Anjos, J.M. Léger, F. Hahn, P. Olivi, A.R. de Andrade, G. Tremiliosi-
Filho, and K.B. Kokoh. Effect of W on PtSn/C catalysts for ethanol electrooxidation. J.
Appl. Electrochem. 38 2008: 653-662.
27. H.S. Roh, Y. Wang, D.L. King, A. Platon, and Y.H. Chin. Low temperature and H2 selective
catalysts for ethanol steam reforming. Catalysis Letters 108 2006: 15-19.
28. P.Y. Sheng, A.Yee, G.A. Bowmaker, and H. Idriss. H2 Production from Ethanol over Rh–
Pt/CeO2 Catalysts: The Role of Rh for the Efficient Dissociation of the Carbon–Carbon
Bond. Journal of Catalysis. 208 2002: 393-403.
29. M. Singh, N. Zhou, D.K. Paul, and K.J. Klabunde. IR spectral evidence of aldol
condensation: Acetaldehyde adsorption over TiO2 surface. Journal of Catalysis 260
2008: 371–379.
30. N. Srisiriwat, S. Therdthianwong, and A. Therdthianwong. Oxidative steam reforming of
ethanol over Ni/Al2O3 catalysts promoted by CeO2, ZrO2 and CeO2–ZrO2. International
Journal of Hydrogen Energy 34 2009: 2224-2234.
31. J. Sun, X.P. Qiu, F. Wu, W.T. Zhu. H2 from steam reforming of ethanol at low
temperature over Ni/Y2O3,Ni/La2O3 and Ni/Al2O3 catalysts for fuel-cell application.
International Journal of Hydrogen Energy 30 2005: 437 – 445
32. A. Trovarelli. Catalytic properties of ceria and CeO2-containing materials Catalysis
reviews: science and engineering. 38 1996: 439-520.
33. P.D. Vaidya and A.E. Rodrigues. Insight into steam reforming of ethanol to produce
hydrogen for fuel cells. Chemical Engineering Journal. 117 2006: 39-49.

54
34. F. Vigier, C. Coutanceau, F. Hahn, E.M. Belgsir, and C. Lamy. On the mechanism of
ethanol electro-oxidation on Pt and PtSn catalysts: electrochemical and in situ IR
reflectance spectroscopy studies. Journal of Electroanalytical Chemistry 563 2004: 81–
89.
35. M. Watanabe and S. Motoo. Electrocatalysis by Ad-atoms. Part 1. Enhancement of
oxidation of methanol on platinum and palladium by gold ad-atoms. Journal of
Electroanalytical Chemistry 60 1976: 259-266.
36. M. Watanabe and S. Motoo. Electrocatalysis by Ad-atoms. Part 2. Enhancement of
oxidation of methanol on platinum by ruthenium ad-atoms. Journal of Electroanalytical
Chemistry 60 1976: 267-273.
37. M. Watanabe and S. Motoo. Electrocatalysis by Ad-atoms. Part 3. Enhancement of
oxidation of carbon-monoxide on platinum by ruthenium ad-atoms. Journal of
Electroanalytical Chemistry 60 1976: 275-283.
38. G. Wu, R. Swaidan, and G. Cui. Electrooxidations of ethanol, acetaldehyde and acetic
acid using PtRuSn/C catalysts prepared by modified alcohol-reduction process. Journal
of Power Sources 172 2007: 180–188.
39. A. Yee, S.J. Morrison, and H. Idriss. A Study of Ethanol Reactions over Pt/CeO2 by
Temperature-Programmed Desorption and in Situ FT-IR Spectroscopy: Evidence of
Benzene Formation. Journal of Catalysis 191 2000: 30–45.
40. L. Zhang, J. Liu, W. Li, C. Guo, and J. Zhang. Ethanol steam reforming over Ni-Cu/Al2O3-
MyOz (M = Si, La, Mg, and Zn) catalysts. Journal of Natural Gas Chemistry 18 2009: 55–
65.

55
7 Appendix: Plots of Ethanol Reforming Byproducts for Catalysts Studied
The following plots derived from the study of ethanol reforming catalysts over Pt-based and Rh-based catalysts. ‘Production v.s. Temperature’ plots display measured resultant volumetric gas composition over a temperature range of 200oC to 400oC. ‘Arhenius Plots’ show the logarithm of volumetric gas composition versus the logarithm of the inverse absolute temperature (K-1). We can use the relationship
k = yo + Ae-E/RT,
to represent the production of ethanol reforming byproducts; in which k is the byproduct gas composition, T is absolute temperature in Kelvins, R is the gas constant, E is activation energy, A is the exponential prefactor. In this experiment, yo corresponds to the ethanol conversion that occurs in the reactor without contact with the catalyst bed (i.e. thermodynamically, as a function of heating in the reactor prior to the reactant’s contact with the catalyst bed). In the table below, the experimentally measured value of yo (the steam reforming that occurs in the reactor at 200oC, without the presence of the catalyst bed) is compared to the numerical fit to yo, as generated from the data in Figure 61 and 73. The close agreement between the experimental and numerically fit values in Table 8 shows that ethanol conversion prior to the reactor bed does contribute to the formation of ethanol reforming products at a consistent level.
Table 8: Conversion of ethanol in the reactor, outside of the catalyst bed.
yo value for fitting of steam reforming data Log (CH4) Log (C2H4) Log (H2) Log (CH4) Measured (Sand only/ catalyst removed, 200oC) -2.40 -1.87 -0.20 -0.84 Fit from Steam Reforming over Pt8Sn2 -2.29 -1.85 -0.32 -0.84 Fit from Steam Reforming over Pt9Sn1 -2.23 -1.84 -0.25 -0.84
From the Arhenius plots, we may derive the activation energy for each product species we detect via numerical fitting. Finally, log-log plots display the logarithm of gas composition versus the logarithm of reactant composition. The linear slope of each byproduct’s data set in these plots equates to the reaction orders for the production of the measured product species. The values derived from these plots are presented in the Results and Data Analysis Section of this paper.

56
7.1 Ethanol Reforming over Rh (5% wt.)/CeO2
Figure 27: Product gas composition versus Temperature for steam reforming. Molar ratio of water-to-ethanol in the reactant gas is 3:1. The ratio of catalyst mass to reactant flow is 7.8 kg · sec /m, while ethanol vapor and steam flow rates were set at 10 and 31 sccm.
Figure 28: Arhenius plot of the product gas composition for steam reforming.

57
Figure 29: Log-log plot of product gas composition versus the inlet steam partial pressure. The ratio of catalyst mass to reactant flow was 6.2 – 10.4 kg · sec/m. Ethanol flow rate was held constant at 10.4 sccm.
Figure 30: Log-log plot of product gas composition versus the inlet ethanol partial pressure. The ratio of catalyst mass to reactant flow was 7.2 – 8.5 kg · sec/m. Steam flow rate has held constant at 31.1 sccm.

58
Figure 31: Product gas composition versus temperature for oxidative steam reforming. Molar ratio of water-to-ethanol-to-oxygen in the reactant gas is 1.8:1.0:0.6. The ratio of catalyst mass to reactant flow was 6.1 kg · sec/m, while ethanols vapor, steam, oxygen and argon flow rates were set to 15.7, 28.2, 9.4 and 120 sccm, respectively.
Figure 32: Arhenius plot of the product gas composition for oxidative steam reforming.
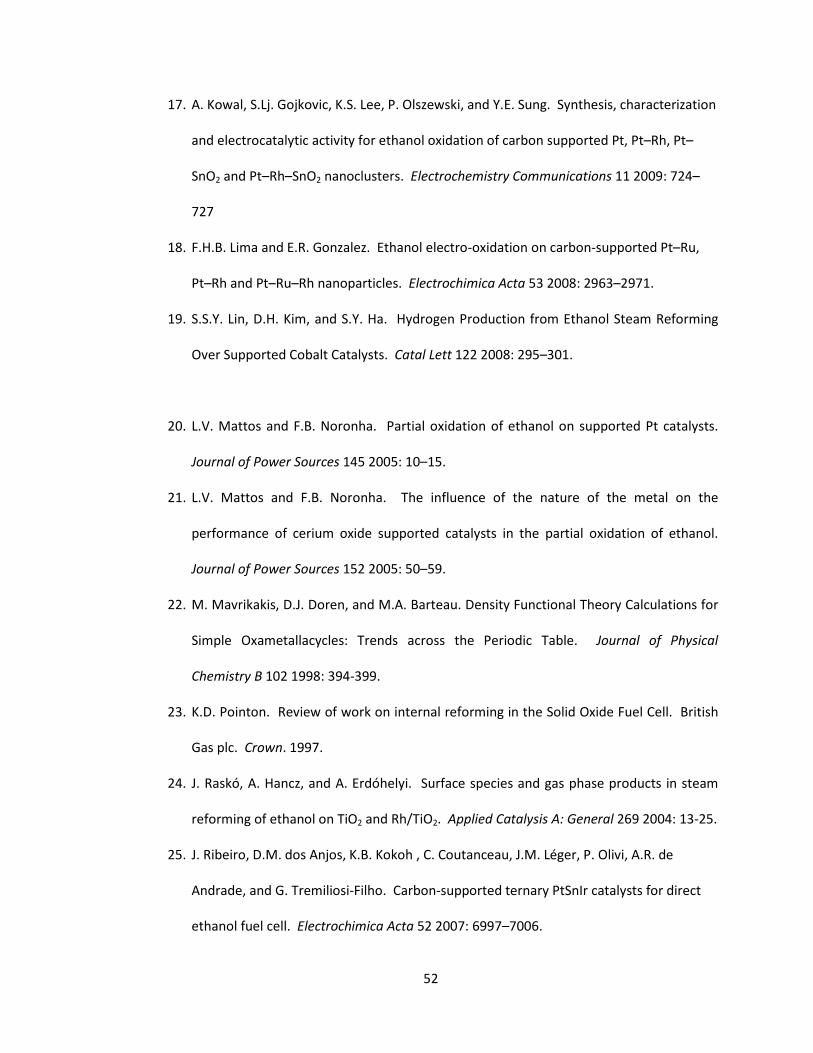
59
Figure 33: Log-log plot of product gas composition versus the inlet steam partial pressure. The ratio of catalyst mass to reactant flow was 5.2 – 7.4 kg · sec/m. Ethanol and oxygen flow rates were held constant at 9.4 and 15.7 sccm. The molar ratio of water:ethanol:oxygen in the reactant gas is 1.2-2.4:1:0.6.
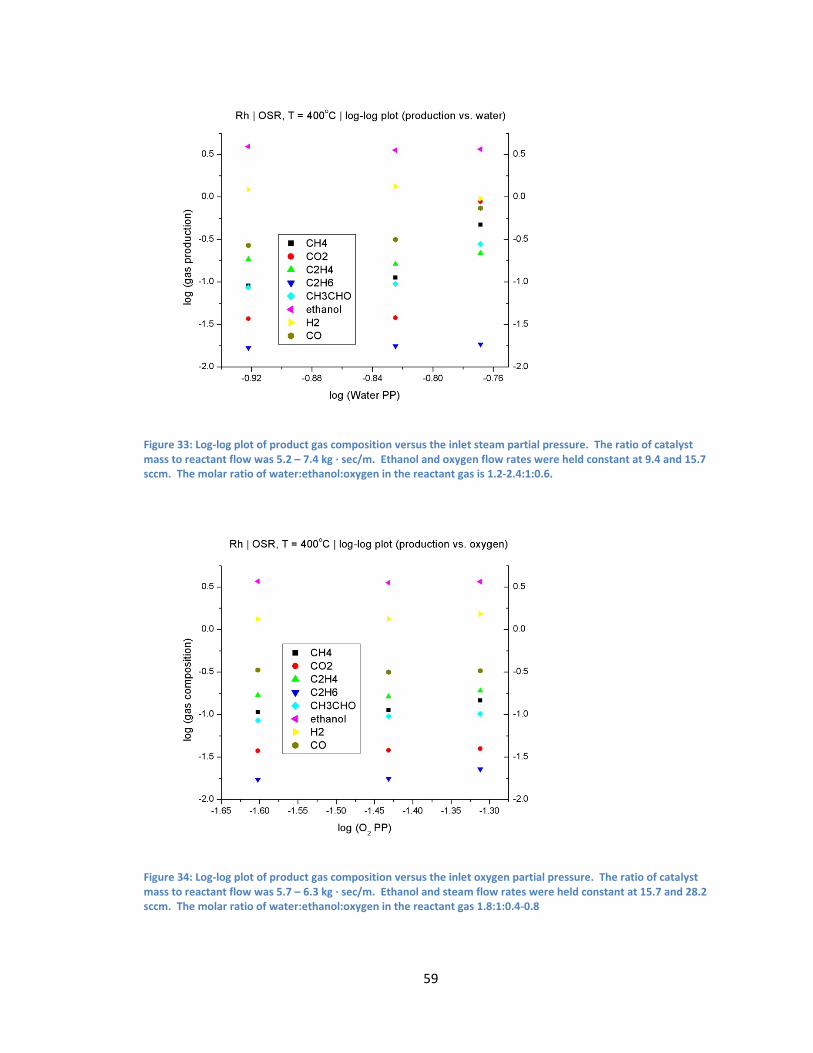
Figure 34: Log-log plot of product gas composition versus the inlet oxygen partial pressure. The ratio of catalyst mass to reactant flow was 5.7 – 6.3 kg · sec/m. Ethanol and steam flow rates were held constant at 15.7 and 28.2 sccm. The molar ratio of water:ethanol:oxygen in the reactant gas 1.8:1:0.4-0.8

60
Figure 35: Log-log plot of product gas composition versus the inlet ethanol partial pressure. The ratio of catalyst mass to reactant flow was 5.5 – 6.7 kg · sec/m. Oxygen and steam flow rates were held constant at 9.4 and 28.2 sccm. The molar ratio of water:ethanol:oxygen in the reactant gas 1.8:1.33-0.66:0.6.
7.2 Ethanol Reforming over Rh9Sn1 (5% wt.)/CeO2
Figure 36: Product gas composition versus Temperature for steam reforming. Molar ratio of water-to-ethanol in the reactant gas is 3:1. The ratio of catalyst mass to reactant flow was 7.8 kg · sec/m, while ethanol vapor and steam flow rates were set at 10 and 31 sccm.

61
Figure 37: Arhenius plot of the product gas composition for steam reforming.
Figure 38: Log-log plot of product gas composition versus the inlet steam partial pressure. The ratio of catalyst mass to reactant flow was 6.2 – 10.4 kg · sec/m. Ethanol flow rate was held constant at 10.4 sccm.
62
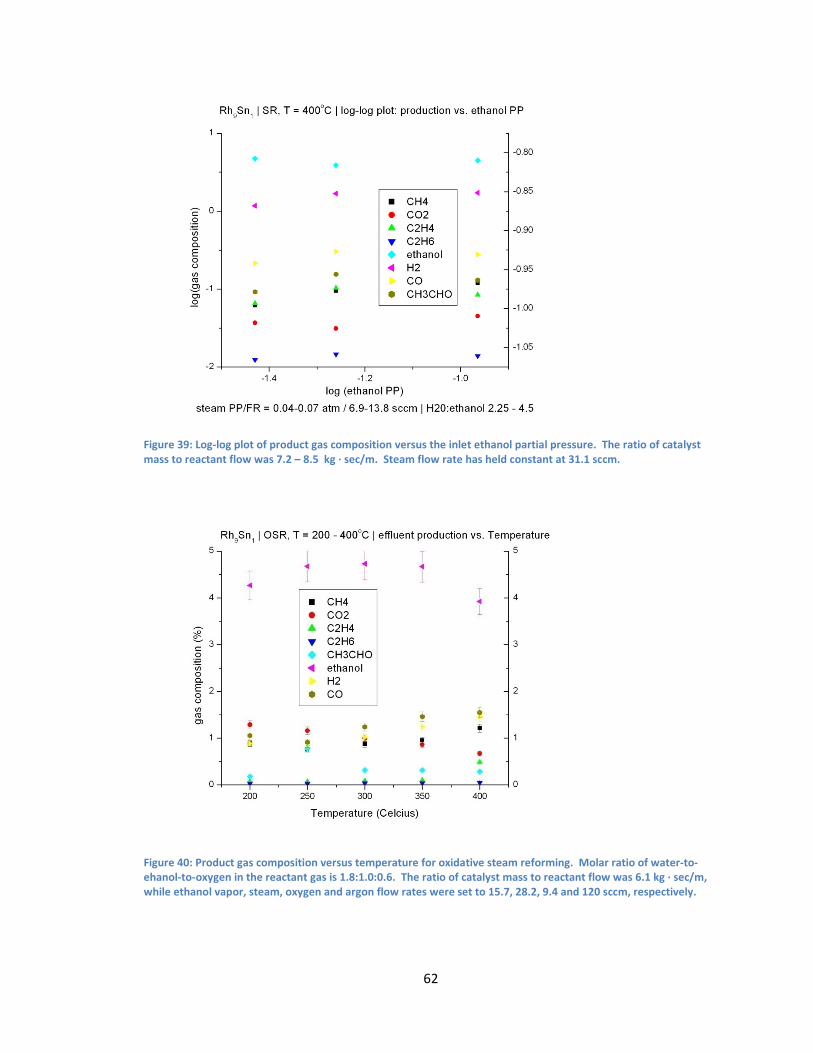
Figure 39: Log-log plot of product gas composition versus the inlet ethanol partial pressure. The ratio of catalyst mass to reactant flow was 7.2 – 8.5 kg · sec/m. Steam flow rate has held constant at 31.1 sccm.
Figure 40: Product gas composition versus temperature for oxidative steam reforming. Molar ratio of water-to-ehanol-to-oxygen in the reactant gas is 1.8:1.0:0.6. The ratio of catalyst mass to reactant flow was 6.1 kg · sec/m, while ethanol vapor, steam, oxygen and argon flow rates were set to 15.7, 28.2, 9.4 and 120 sccm, respectively.

63
Figure 41: Arhenius plot of the product gas composition for oxidative steam reforming.
Figure 42: Log-log plot of product gas composition versus the inlet steam partial pressure. The ratio of catalyst mass to reactant flow was 5.2 – 7.4 kg · sec/m. Ethanol and oxygen flow rates were held constant at 9.4 and 15.7 sccm. The molar ratio of water:ethanol:oxygen in the reactant gas is 1.2-2.4:1:0.6.

64
Figure 43: Log-log plot of product gas composition versus the inlet oxygen partial pressure. The ratio of catalyst mass to reactant flow was 5.7 – 6.3 kg · sec/m. Ethanol and steam flow rates were held constant at 15.7 and 28.2 sccm. The molar ratio of water:ethanol:oxygen in the reactant gas 1.8:1:0.4-0.8.
Figure 44: Log-log plot of product gas composition versus the inlet ethanol partial pressure. The ratio of catalyst mass to reactant flow was 5.5 – 6.7 kg · sec/m. Oxygen and steam flow rates were held constant at 9.4 and 28.2 sccm. The molar ratio of water:ethanol:oxygen in the reactant gas 1.8:1.33-0.66:0.6.

65
7.3 Ethanol Reforming over Rh8Sn2 (5% wt.)/CeO2
Figure 45: Product gas composition versus Temperature for steam reforming. Molar ratio of water-to-ethanol in the reactant gas is 3:1. The ratio of catalyst mass to reactant flow was 7.8 kg · sec /m, while ethanol vapor and steam flow rates were set at 10 and 31 sccm.
Figure 46: Arhenius plot of the product gas composition for steam reforming.

66
Figure 47: Log-log plot of product gas composition versus the inlet steam partial pressure. The ratio of catalyst mass to reactant flow was 6.2 – 10.4 kg · sec/m. Ethanol flow rate was held constant at 10.4 sccm.
Figure 48: Log-log plot of product gas composition versus the inlet ethanol partial pressure. The ratio of catalyst mass to reactant flow was 7.2 – 8.5 kg · sec/m. Steam flow rate has held constant at 31.1 sccm.

67
Figure 49: Product gas composition versus temperature for oxidative steam reforming. Molar ratio of water-to-ethanol-to-oxygen in the reactant gas is 1.8:1.0:0.6. The ratio of catalyst mass to reactant flow was 6.1 kg · sec/m
was used, while ethanol vapor, steam, oxygen and argon flow rates were set to 15.7, 28.2, 9.4 and 120 sccm, respectively.
Figure 50: Arhenius plot of the product gas composition for oxidative steam reforming.

68
7.4 Ethanol Reforming over Pt (5% wt.)/CeO2
Figure 51: Product gas composition versus Temperature for steam reforming. Molar ratio of water-to-ethanol in the reactant gas is 3:1. The ratio of catalyst mass to reactant flow was 7.8 kg · sec/m was used, while ethanol vapor and steam flow rates were set at 10 and 31 sccm.
Figure 52: Arhenius plot of the product gas composition for steam reforming.

69
Figure 53: Log-log plot of product gas composition versus the inlet steam partial pressure. The ratio of catalyst mass to reactant flow was 6.2 – 10.4 kg · sec/m. Ethanol flow rate was held constant at 10.4 sccm.
Figure 54: Log-log plot of product gas composition versus the inlet ethanol partial pressure. The ratio of catalyst mass to reactant flow was 7.2 – 8.5 kg · sec/m. Steam flow rate has held constant at 31.1 sccm.

70
Figure 55: Product gas composition versus temperature for oxidative steam reforming. Molar ratio of Water-to-Ethanol-to-Oxygen in the reactant gas is 1.8:1.0:0.6. The ratio of catalyst mass to reactant flow was 6.1 kg · sec/m, while ethanol vapor, steam, oxygen and argon flow rates were set to 15.7, 28.2, 9.4 and 120 sccm, respectively.
Figure 56: Arhenius plot of the product gas composition for oxidative steam reforming.

71
Figure 57: Log-log plot of product gas composition versus the inlet steam partial pressure. The ratio of catalyst mass to reactant flow was 5.2 – 7.4 kg · sec/m. Ethanol and oxygen flow rates were held constant at 9.4 and 15.7 sccm. The molar ratio of water:ethanol:oxygen in the reactant gas is 1.2-2.4:1:0.6.
Figure 58: Log-log plot of product gas composition versus the inlet oxygen partial pressure. The ratio of catalyst mass to reactant flow was 5.7 – 6.3 kg · sec/m. Ethanol and steam flow rates were held constant at 15.7 and 28.2 sccm. The molar ratio of water:ethanol:oxygen in the reactant gas 1.8:1:0.4-0.8.

72
Figure 59: Log-log plot of product gas composition versus the inlet ethanol partial pressure. The ratio of catalyst mass to reactant flow was 5.5 – 6.7 kg · sec/m. Oxygen and steam flow rates were held constant at 9.4 and 28.2 sccm. The molar ratio of water:ethanol:oxygen in the reactant gas 1.8:1.33-0.66:0.6.
7.5 Ethanol Reforming over Pt9Sn1 (5% wt.)/CeO2
Figure 60: Product gas composition versus Temperature for steam reforming. Molar ratio of water-to-ethanol in the reactant gas is 3:1. The ratio of catalyst mass to reactant flow was 7.8 kg · sec/m, while ethanol vapor and steam flow rates were set at 10 and 31 sccm.

73
Figure 61: Arhenius plot of the product gas composition for steam reforming.
Figure 62: Log-log plot of product gas composition versus the inlet steam partial pressure. The ratio of catalyst mass to reactant flow was 6.2 – 10.4 kg · sec/m. Ethanol flow rate was held constant at 10.4 sccm.

74
Figure 63: Log-log plot of product gas composition versus the inlet ethanol partial pressure. The ratio of catalyst mass to reactant flow was 7.2 – 8.5 kg · sec/m. Steam flow rate has held constant at 31.1 sccm.
Figure 64: Product gas composition versus temperature for oxidative steam reforming. Molar ratio of water-to-ethanol-to-oxygen in the reactant gas is 1.8:1.0:0.6. The ratio of catalyst mass to reactant flow was 6.1 kg · sec /m2, while ethanol vapor, steam, oxygen and argon flow rates were set to 15.7, 28.2, 9.4 and 120 sccm, respectively.

75
Figure 65: Arhenius plot of the product gas composition for oxidative steam reforming.
Figure 66: Log-log plot of product gas composition versus the inlet steam partial pressure. The ratio of catalyst mass to reactant flow was 5.2 – 7.4 kg · sec/m. Ethanol and oxygen flow rates were held constant at 9.4 and 15.7 sccm. The molar ratio of water:ethanol:oxygen in the reactant gas is 1.2-2.4:1:0.6.

76
Figure 67: Log-log plot of product gas composition versus the inlet oxygen partial pressure. The ratio of catalyst mass to reactant flow was 5.7 – 6.3 kg · sec/m. Ethanol and steam flow rates were held constant at 15.7 and 28.2 sccm. The molar ratio of water:ethanol:oxygen in the reactant gas 1.8:1:0.4-0.8.
Figure 68: Log-log plot of product gas composition versus the inlet ethanol partial pressure. 5.5 – 6.7 kg · sec/m. oxygen and steam flow rates were held constant at 9.4 and 28.2 sccm. The molar ratio of water:ethanol:oxygen in the reactant gas 1.8:1.33-0.66:0.6.

77
Figure 69: Log-log plot of product gas composition versus the inlet steam partial pressure. The ratio of catalyst mass to reactant flow was 5.2 – 7.4 kg · sec/m. Ethanol and oxygen flow rates were held constant at 9.4 and 15.7 sccm. The molar ratio of water:ethanol:oxygen in the reactant gas is 1.2-2.4:1:0.6.
Figure 70: Log-log plot of product gas composition versus the inlet oxygen partial pressure. The ratio of catalyst mass to reactant flow was 5.7 – 6.3 kg · sec/m. Ethanol and steam flow rates were held constant at 15.7 and 28.2 sccm. The molar ratio of water:ethanol:oxygen in the reactant gas 1.8:1:0.4-0.8.

78
Figure 71: Log-log plot of product gas composition versus the inlet ethanol partial pressure. The ratio of catalyst mass to reactant flow was 5.5 – 6.7 kg · sec/m. Oxygen and steam flow rates were held constant at 9.4 and 28.2 sccm. The molar ratio of water:ethanol:oxygen in the reactant gas 1.8:1.33-0.66:0.6.
7.6 Ethanol Reforming over Pt8Sn2 (5% wt.)/CeO2
Figure 72: Product gas composition versus Temperature for steam reforming. Molar ratio of water-to-ethanol in the reactant gas is 3:1. The ratio of catalyst mass to reactant flow was 7.8 kg · sec/m, while ethanol vapor and steam flow rates were set at 10 and 31 sccm.

79
Figure 73: Arhenius plot of the product gas composition for steam reforming.
Figure 74: Log-log plot of product gas composition versus the inlet steam partial pressure. The ratio of catalyst mass to reactant flow was 6.2 – 10.4 kg · sec/m. Ethanol flow rate was held constant at 10.4 sccm.

80
Figure 75: Log-log plot of product gas composition versus the inlet ethanol partial pressure. The ratio of catalyst mass to reactant flow was 7.2 – 8.5 kg · sec/m. Steam flow rate has held constant at 31.1 sccm.
Figure 76: Product gas composition versus temperature for oxidative steam reforming. Molar ratio of Water-to-ethanol-to-oxygen in the reactant gas is 1.8:1.0:0.6. The ratio of catalyst mass to reactant flow was 6.1 kg · sec/m, while ethanol vapor, steam, oxygen and argon flow rates were set to 15.7, 28.2, 9.4 and 120 sccm, respectively.

81
Figure 77: Arhenius plot of the product gas composition for oxidative steam reforming.
Figure 78: Log-log plot of product gas composition versus the inlet steam partial pressure. The ratio of catalyst mass to reactant flow was 5.2 – 7.4 kg · sec/m. Ethanol and oxygen flow rates were held constant at 9.4 and 15.7 sccm. The molar ratio of water:ethanol:oxygen in the reactant gas is 1.2-2.4:1:0.6.
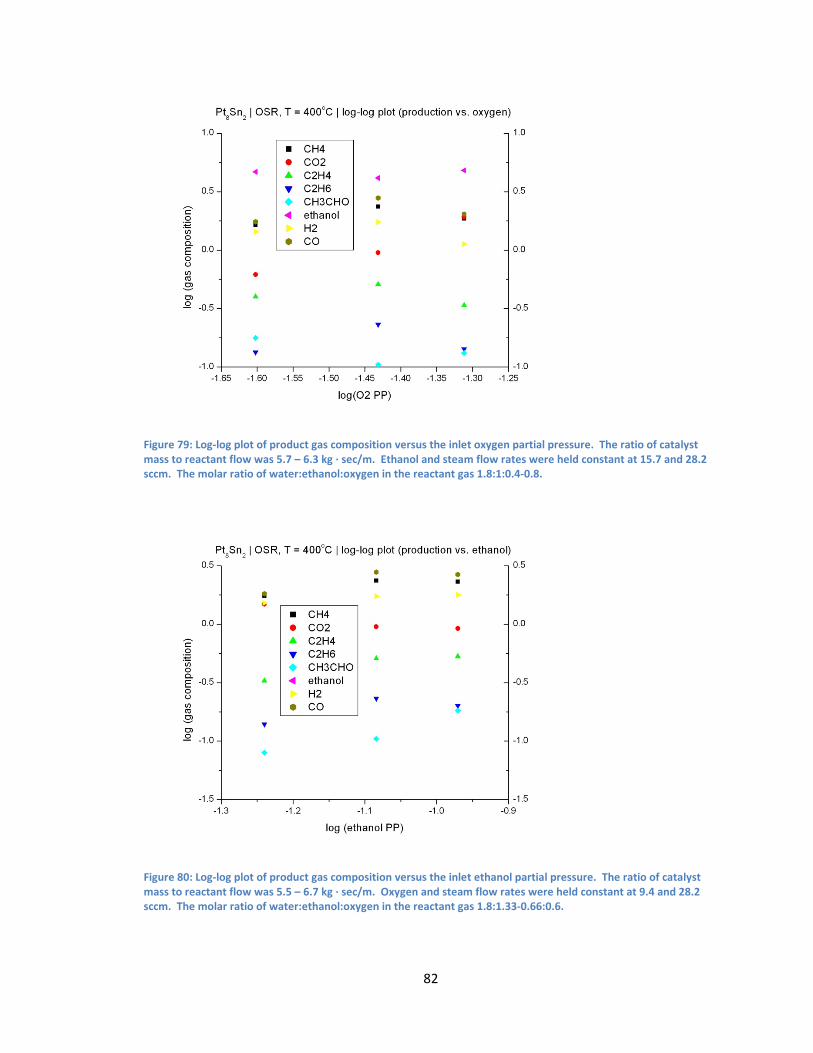
82
Figure 79: Log-log plot of product gas composition versus the inlet oxygen partial pressure. The ratio of catalyst mass to reactant flow was 5.7 – 6.3 kg · sec/m. Ethanol and steam flow rates were held constant at 15.7 and 28.2 sccm. The molar ratio of water:ethanol:oxygen in the reactant gas 1.8:1:0.4-0.8.
Figure 80: Log-log plot of product gas composition versus the inlet ethanol partial pressure. The ratio of catalyst mass to reactant flow was 5.5 – 6.7 kg · sec/m. Oxygen and steam flow rates were held constant at 9.4 and 28.2 sccm. The molar ratio of water:ethanol:oxygen in the reactant gas 1.8:1.33-0.66:0.6.

83
Figure 81: Log-log plot of product gas composition versus the inlet steam partial pressure. The ratio of catalyst mass to reactant flow was 5.2 – 7.4 kg · sec/m. Ethanol and oxygen flow rates were held constant at 9.4 and 15.7 sccm. The molar ratio of water:ethanol:oxygen in the reactant gas is 1.2-2.4:1:0.6.
Figure 82: Log-log plot of product gas composition versus the inlet oxygen partial pressure. The ratio of catalyst mass to reactant flow was 5.7 – 6.3 kg · sec/m. Ethanol and steam flow rates were held constant at 15.7 and 28.2 sccm. The molar ratio of water:ethanol:oxygen in the reactant gas 1.8:1:0.4-0.8.

84
Figure 83: Log-log plot of product gas composition versus the inlet ethanol partial pressure. The ratio of catalyst mass to reactant flow was 5.5 – 6.7 kg · sec/m. Oxygen and steam flow rates were held constant at 9.4 and 28.2 sccm. The molar ratio of water:ethanol:oxygen in the reactant gas 1.8:1.33-0.66:0.6