lse ‘europe in question’ discussion paper series · lse ‘europe in question’ discussion...
TRANSCRIPT
LSE ‘Europe in Question’ Discussion Paper Series
The Politics of Disinflation Bob Hancké and Tim Vlandas
LEQS Paper No. 127/2017
December 2017
All views expressed in this paper are those of the authors and do not necessarily represent the views of the editors or the LSE. © Bob Hancké and Tim Vlandas
Editorial Board Dr Bob Hancke
Dr Jonathan White Dr Sonja Avlijas
Dr Auke Willems Mr Hjalte Lokdam
The Politics of Disinflation Bob Hancké* and Tim Vlandas** Abstract What explains the shift from the moderate to high inflation rates of the Golden Age of post-war capitalism to the low inflation regime of monetarism in the 1970s and 1980s? Conventional views emphasise the rise of monetarism as a new economic paradigm that convinced policy makers to delegate monetary policy to conservative and independent central banks – a view that comes in many variants, from constructivist to orthodox economics. In contrast to these arguments, we introduce electoral and party politics into the debate. This paper models and examines the shifts in the inflationary preferences of the median voter and their translation into party politics and economic policies. As the median voter accumulates nominal assets against a background of de facto and de jure increasing job security and rising wages, her preferences on macro-economic policies shift from concerns about employment-friendly to inflation-averse policies. Social democratic parties, who are pivotal players in this regard because of their ‘natural’ preference for high employment over low inflation, are thus forced to adopt anti-inflation policies as well to remain electorally viable. We show that the employment situation of the average worker improved in every respect during the 1960s and 1970s, that most of the population became inflation averse during the 1970s and 1980s, and that social democratic parties were forced to adopt more economically orthodox party manifestos. We then analyse the shift to a low inflation regime in a series of country case studies. Keywords: inflation, Western Europe, Monetarism, Keynesianism, electoral
politics * London School of Economics and Political Science
Email: [email protected] ** University of Reading
Email: [email protected]
The Politics of Disinflation
Table of Contents
Introduction ..........................................................................................................................1
1. Explaining disinflation ..................................................................................................3
2. Shifting macro-economic preferences of the median voter ............................9
3. From median voter to policies ................................................................................ 17
4. The moving median voter and the shifting party system.............................. 21
5. Economic security, inflation aversion, party orthodoxy and inflation..... 27
6. Case studies: the UK, France, Germany and Sweden ....................................... 33
United Kingdom: From Thatcher to Blair via low inflation ........................... 33
France: from socialism in one country to competitive disinflation ............... 37
Germany: Social-democratic monetarism ......................................................... 42
Sweden: Holding the fort .................................................................................... 44
7. Conclusion ...................................................................................................................... 49
References .......................................................................................................................... 52
Appendix ............................................................................................................................. 56
Acknowledgements We thank Dustin Voss for excellent research assistance, and seminar participants at APSA 2017, University of Geneva, LSE, Sciences Po Paris, and in particular Lucio Baccaro, Matthias Matthijs, Jonas Pontusson, and Thomas Sattler for comments on those occasions. We are also very grateful to Peter Hall and Björn Bremer for detailed comments on previous versions of the paper.
Bob Hancké and Tim Vlandas
1
The Politics of Disinflation
Introduction
Between the end of the Second World War and today, inflation rates varied
dramatically across countries and over time in Europe. In the 1950s both
inflation rates and variation across advanced capitalist countries were quite
high by contemporary standards. In 1956, for instance, inflation was 11.6% in
Finland, 4.9% in Sweden, almost 5% in the UK, 2.6% in Germany, 5.8% in Spain,
and 3.8% in Norway (OECD 2016). Despite the relatively high levels in many
countries, it was rarely identified as a problem, and attention went
disproportionately to economic growth and the goal of full employment. In
Austria and Germany, the average growth rate of GDP per capita during the
1950s was 5.6% (for Austria) and 7% (Germany) 2.2% in France 3.4% in Belgium
(Maddison 2013 database). During the 1960s, inflation again fluctuated sharply,
this time against a background of full employment and high economic growth
– but was not seen as a serious policy problem either. This perception changed
in the 1970s, when the simultaneous occurrence of high inflation, rising
unemployment, and low growth was identified as a major economic policy
problem, with inflation increasingly as the more serious one (see table 1).
The monetarist interventions of the first half of the 1980s by the Banque de
France under Mitterrand, the Bank of England under Thatcher and Paul
Volcker's Federal Reserve heralded a much more subdued inflation regime and
by 1990, inflation appeared to be conquered, though against a background of
relatively high equilibrium unemployment rates and low economic growth,
The Politics of Disinflation
2
both usually understood as problems with their roots in rigid supply-side
institutions.
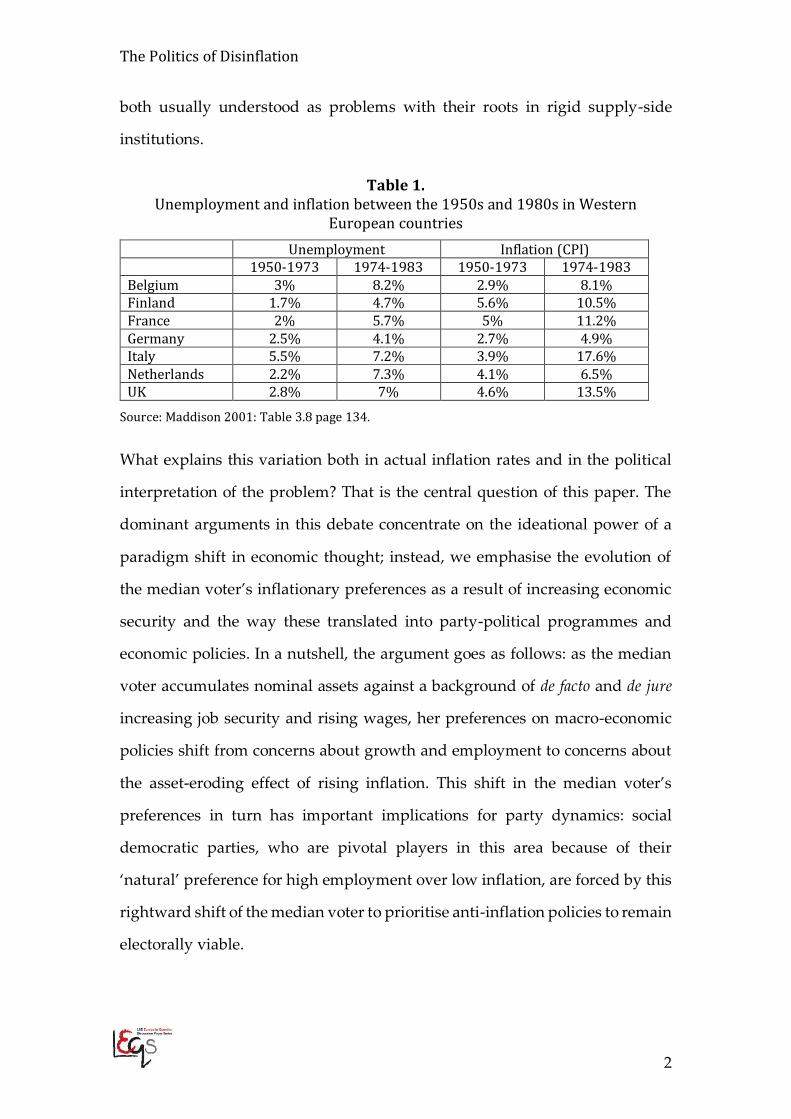
Table 1. Unemployment and inflation between the 1950s and 1980s in Western
European countries Unemployment Inflation (CPI) 1950-1973 1974-1983 1950-1973 1974-1983 Belgium 3% 8.2% 2.9% 8.1% Finland 1.7% 4.7% 5.6% 10.5% France 2% 5.7% 5% 11.2% Germany 2.5% 4.1% 2.7% 4.9% Italy 5.5% 7.2% 3.9% 17.6% Netherlands 2.2% 7.3% 4.1% 6.5% UK 2.8% 7% 4.6% 13.5%
Source: Maddison 2001: Table 3.8 page 134.
What explains this variation both in actual inflation rates and in the political
interpretation of the problem? That is the central question of this paper. The
dominant arguments in this debate concentrate on the ideational power of a
paradigm shift in economic thought; instead, we emphasise the evolution of
the median voter’s inflationary preferences as a result of increasing economic
security and the way these translated into party-political programmes and
economic policies. In a nutshell, the argument goes as follows: as the median
voter accumulates nominal assets against a background of de facto and de jure
increasing job security and rising wages, her preferences on macro-economic
policies shift from concerns about growth and employment to concerns about
the asset-eroding effect of rising inflation. This shift in the median voter’s
preferences in turn has important implications for party dynamics: social
democratic parties, who are pivotal players in this area because of their
‘natural’ preference for high employment over low inflation, are forced by this
rightward shift of the median voter to prioritise anti-inflation policies to remain
electorally viable.
Bob Hancké and Tim Vlandas
3
The relevance of this question should be obvious. Understanding the political
dynamics underlying inflation and disinflation is not only important in
historical perspective; equally important is bringing politics back into the wider
picture of big shifts in economic policy-making. It is possibly even of
significance today because of the struggles of OECD economies to generate
higher inflation in the wake of the Great Recession. For the past decade, most
advanced capitalist economies have witnessed extremely low inflation, often
verging on deflation, and with interest rates close to zero, have been forced to
resort to quasi-fiscal monetary policies (known as ‘quantitative easing’) to
avoid being stuck pushing on a string, in the words of Keynes. Understanding
how exactly we got here could shed light on the policy options today.
The balance of this paper starts with a short review of the debates on the
disinflation of the 1980s, moves on to a detailed exposition of our argument
before delving into several empirical subsections on the mechanism that we
propose. We end that empirical section with a set of short case studies – of the
UK, France, Germany and Sweden – on the political dynamics surrounding
disinflation. A short conclusion summarises the findings and raises some
further questions.
1. Explaining disinflation
Arguably the single most important set of approaches to the question of low
inflation and its institutional corollaries builds on an important ideational shift
in macroeconomic theory. According to the economists’ narrative, as Iversen &
Soskice (2006) call this, politicians suddenly realised in the 1970s that inflation
was a bad thing because everyone in the economy anticipated it. Prices thus
rose without real effects if governments tried to inflate the economy and
governments, quite sensibly, created institutions, such as conservative,
The Politics of Disinflation
4
independent central banks, to enforce price stability (in two very different
versions but with the same conclusion, see Barro & Gordon 1983; McNamara
1998). The 1970s were the era when the shortcomings of Keynesian macro-
economic policies became clear to everyone; faced with stagnation, a new
regime, foreshadowed by new macro-economic thinking, was installed. This
ideational shift was, needless to say, supported by a dramatic rise in the
perception of the dangers of inflation in the 1970s and 1980s by citizens,
politicians and interest groups.
These ideational arguments, powerful as they may seem, face the simple
problem that every approach based on ideas faces: the defeat of one way of
understanding the economy and the victory of a competing vision cannot be
explained, neither ex ante nor ex post, simply with reference to the substance of
the ideas alone. The notion of sound money at the basis of monetarism has in
some form or other been around since the formalization of classical economics
in the 18th century and embodied in the gold standard regime, yet has been
more or less politically attractive over the past 250 years depending on the
politics of economic policy, not the functional requirements of economic
problems. New ideas may be a necessary condition for such shifts, but they are
far from sufficient.
Hall’s (1989) interesting ancillary argument about the political conditions for
policy learning does not really resolve the problem, since policy change, even
in what may appear to be a highly technical matter such as macro-economic
policy, requires more than the bureaucratic and elite politics that complement
these ideational approaches. Put differently, since sustained anti-inflation
policies have §both short-term and long-term distributional effects, they
eventually also require approval and support by electorates, and voters,
especially those groups in the population that are disproportionately hurt by
Bob Hancké and Tim Vlandas
5
such a shift in macro-economic policy making, may have different ideas about
the priorities of economic policy.
In fact, it is not even obvious to what extent the complementary point of a
growing problem load that focused attention on inflation is convincing. Take
the countries with comparatively low (average) inflation rates in the 1970s,
such as Germany (5%), Austria (6%), Belgium (7%) and the Netherlands (7%);
in all of these, inflation was one of the two most important (economic) policy
problems, according to opinion polls, usually collecting 65-70% of the votes.
But in countries that faced comparatively much higher inflation rates over the
decade – Italy (12%), Ireland (13%) and the UK (13%) – the population did not
have a higher sense of inflation as a major problem. There is simply not a very
strong relationship between the inflation rate and feelings about inflation
across these countries.
Materialist political scientists, starting with Hibbs (1977), have developed a
very different argument: Left governments, with a constituency of salaried
workers depending on employment for their livelihood, cared more about
unemployment than inflation; for governments of the Right, who represented
more economically privileged groups in the population, the opposite was the
case. For these interpretations, inflation is the outcome of domestic distributive
conflict between Labour and Capital over the surplus generated by economic
growth (Hirsch & Goldthorpe 1978; Carlin & Soskice 1990). Wage bargaining
systems where workers can, for a variety of mainly political and institutional
reasons, systematically claim wage rates that are higher than labour
productivity rates (i.e. where the wage share in the economy rises), produce,
all other things equal, higher inflation than those where nominal wages and
productivity are more closely aligned. Conversely, the increasing weakness of
Labour after 1980, expressed in declining union density (Visser 2013),
fragmentation of collective bargaining systems (Katz 1993), and labour market
The Politics of Disinflation
6
deregulation (Vlandas 2013; Avdagic 2013) allowed capital to capture a larger
share of economic growth, and inflation rates fell, since businesses did not have
to raise prices to compensate for losses associated with higher wages. This
dynamic captures almost perfectly the adjustment from the high-inflation
1970s to the low-inflation 1990s.
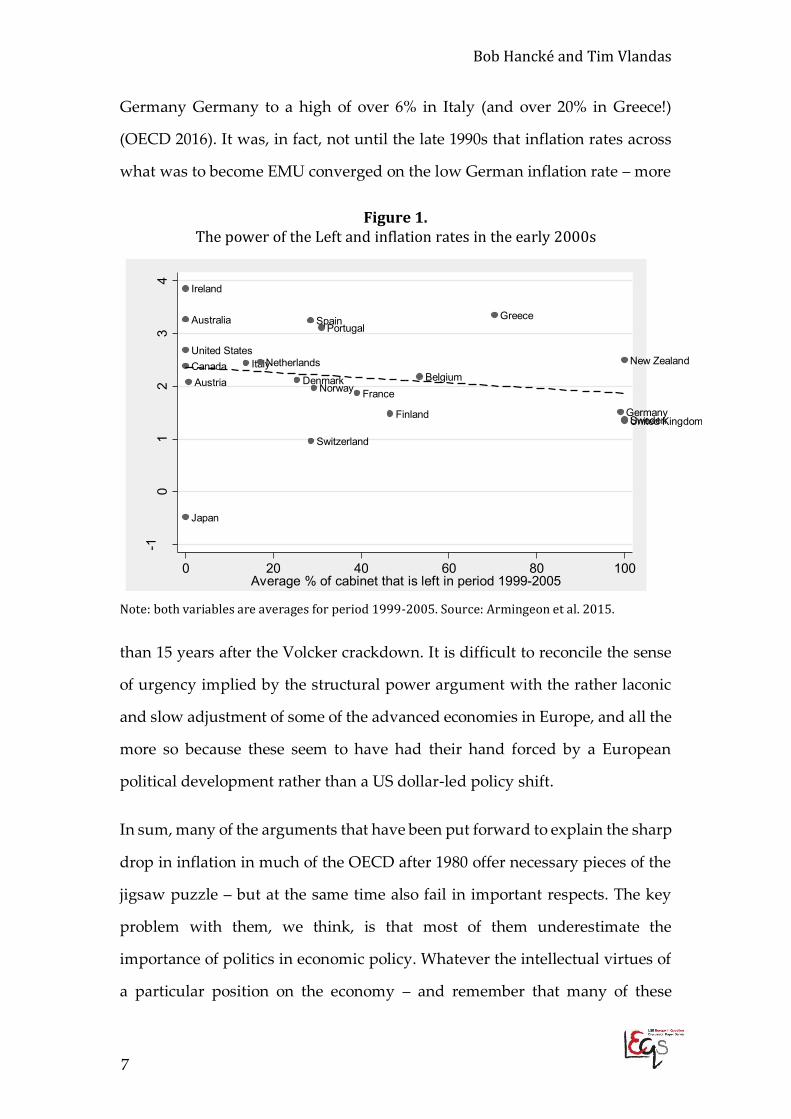
But this argument also faces a few important problems. The partisan argument
by Hibbs (1977) certainly sounded persuasive when it was published, but a
look at party manifestos, government policies and inflation rates since the
1990s suggests that Left parties of a social-democratic bent have now also
become inflation hawks, not to be outdone by their Right counterparts (see
Notermans 2000: 160-221; Boix 2000). Simple correlations between inflation
rates and Left control of cabinet, as reported in Figure 1, have been negative in
the period 1999-2005 for much of the OECD. Since the argument about different
policy preferences of Left and Right held for the 1960s (as in Hibbs 1977),
something else must have changed after that period to undermine this
previously robust relationship.
A more structural materialist argument emphasises the international political-
economic constraints imposed by the sudden turn towards disinflation in the
US under Fed Chairman Paul Volcker in the early 1980s (Brenner 2000).
Because of the central role of the dollar in the international monetary system,
all major convertible currencies were forced to follow the US when the Fed
dramatically raised interest rates to force inflation down, and the effect was a
generalised disinflationary bias in the OECD economies. While this
international monetary framework certainly may have set the direction of
change, it has a hard time explaining the variation in timing among the
advanced capitalist economies. As late as 1990, right before the start of the
Maastricht process leading to EMU, and which heralded a generalised
disinflation regime across the EU, inflation rates varied from a low of 2.7% in
Bob Hancké and Tim Vlandas
7
Germany Germany to a high of over 6% in Italy (and over 20% in Greece!)
(OECD 2016). It was, in fact, not until the late 1990s that inflation rates across
what was to become EMU converged on the low German inflation rate – more
Figure 1. The power of the Left and inflation rates in the early 2000s
Note: both variables are averages for period 1999-2005. Source: Armingeon et al. 2015.
than 15 years after the Volcker crackdown. It is difficult to reconcile the sense
of urgency implied by the structural power argument with the rather laconic
and slow adjustment of some of the advanced economies in Europe, and all the
more so because these seem to have had their hand forced by a European
political development rather than a US dollar-led policy shift.
In sum, many of the arguments that have been put forward to explain the sharp
drop in inflation in much of the OECD after 1980 offer necessary pieces of the
jigsaw puzzle – but at the same time also fail in important respects. The key
problem with them, we think, is that most of them underestimate the
importance of politics in economic policy. Whatever the intellectual virtues of
a particular position on the economy – and remember that many of these
Australia
Austria BelgiumCanada
Denmark
Finland
France
Germany
Greece
Ireland
Italy
Japan
Netherlands New Zealand
Norway
PortugalSpain
Sweden
Switzerland
United Kingdom
United States
-10
12
34
Con
sum
mer
Pric
e In
dex
0 20 40 60 80 100Average % of cabinet that is left in period 1999-2005
cpi_allmeanearly2000s Fitted values
The Politics of Disinflation
8
supposed virtues remain under discussion – the translation into actual policies
requires a majority in legislative settings to pass. Put differently, even the most
brilliant policy idea will not gain political traction if it systematically destroys
the livelihood of its electorate.
In this paper, therefore, we aim to bring politics, particularly distributive
politics, back into the debate, and do so in two steps. The first step models and
examines the shifts in the economic policy preferences of the median voter: as
she accumulated nominal assets against a background of de facto and de jure
rising job security and wages, her preferences on macro-economic policies
shifted from concern about growth and employment-friendly policies to
inflation-averse policies. The second is to introduce that development into a
model of party competition, by examining at which point the median voter had
shifted sufficiently to the Right (i.e. prefers inflation-averse policies) to carry all
parties, but especially the pivotal Social-Democrats, along to the Right. Our
hypothesis is that this shift in party platforms took place after a series of
electoral defeats by Social-Democratic parties, who misunderstood the
electoral implications of the improvement in the median voter's economic
security (for which, ironically, their own policies and policy orientations in the
post-war period were mainly responsible). Combined, these two points suggest
that the turn towards inflation-averse policies in the late 1970s and the 1980s is
the consequence of a shift in the underlying political sociology of the electorate
and its translation into party platforms. The existence of new concepts of
macro-economic policy-making that were transmitted through elite networks
mattered because they provided a more or less coherent theoretical framework
both to analyse the new world and to offer intellectual foundations for new
policies – but the median voter dynamic drove the political process. This
interaction between shifting policy preferences of the median voter and
electoral success or failure also helps understand why previous periods of high
Bob Hancké and Tim Vlandas
9
inflation went, in policy terms at least, almost unnoticed. However, once the
median voter moved to the Right, low inflation became a pervasive policy goal
across the entire political spectrum. Governments may have forced central
banks to become conservative and independent to guard price stability, but
they did so in response to very strong electoral pressures, thus our argument.
The balance of this paper presents this argument in four stages. We start by
developing a model that explains shifts in median voter preferences with
regard to inflation and then links that to the electoral competition to which
social-democratic parties, the natural proponents of an employment-oriented
economic policy, were exposed. We then offer descriptive evidence for our
argument, followed by case studies of four countries – the UK, France,
Germany and Sweden. The final section concludes by sketching some of the
wider implications.
2. Shifting macro-economic preferences of the median voter
The first step in our argument deals with the relative preferences of the median
voter for economic growth and inflation (we assume growth to cover both
increases in real disposable income and security of employment) and we
identify two key concepts in that regard.
The first is the subjective perception of job loss: since current income is entirely
dependent on wages, and future income depends on the accumulation of
human capital, a process impeded through unemployment, losing one’s job is
tantamount to a significant reduction in income, now and in the future, and
more broadly to a deterioration of future life chances. A higher subjective
perception of job loss implies that people are relatively speaking more
concerned about unemployment than about inflation. In one of the few studies
The Politics of Disinflation
10
on this question, Scheve (2002) documents that greater exposure to
unemployment risk leads to lower inflation aversion: respondents with more
weeks of unemployment in the previous year are less inflation averse (Scheve
2002: 27). In addition, national unemployment rates and individual-level
aversion to inflation are also negatively correlated (Scheve 2004: 15).
Unemployed people are less inflation averse, while high-income individuals –
with a lower risk of costly unemployment – are more so (Scheve 2004: 17). Our
own analysis of Eurobarometer data from 1970 to 2000 suggests that
Employment Protection Legislation, which reduces subjective unemployment
risk, is positively associated with inflation aversion (see table A3 in appendix).
Using the International Social Science Program (ISSP) data, we also find that
insiders in permanent employment are more inflation averse than labour
market outsiders in unemployment and precarious employment (see table A4
in appendix). Retired individuals, by definition not concerned about current
and future unemployment risk, are also more inflation averse (Vlandas 2017).
The second variable starts from the income derived from the accumulation of
nominal assets such as savings and other monetary income, pension funds and
(in most places in the OECD) housing, with a relatively fixed (nominal) value
– or at least until the deregulation of financial markets in the 1980s and 90s.
Nominal assets have the particular characteristic that their value is eroded by
inflation above zero; unless that is compensated by increases in value of the
assets (through rising stock markets, for example, or real estate inflation),
holders of such assets see their wealth disappear (or at least perceive it that
way) when inflation is positive. Therefore, if people with assets are, everything
else equal, more inflation averse, a rise in asset holdings throughout the
population will lead to a higher degree of inflation aversion regardless of
inflation actually having that effect of eroding the value of these assets. There
is very convincing evidence that asset holders are more inflation averse:
Bob Hancké and Tim Vlandas
11
Scheve’s (2002: 26) analysis of the British Household Panel Survey, which asks
respondents whether ‘keeping inflation down’ or ‘keeping unemployment
down’ is the priority, finds ‘clear evidence that ownership of nominal assets
has a statistically and substantively significant positive effect on inflation
aversion among citizens’. Similarly, relying on both Eurobarometer and ISSP
data, Vlandas (2017) also finds that older retired individuals who rely on
pensions and are more likely to hold assets are also more inflation averse.1
These two relatively uncontroversial points about the subjective costs of job
loss and of asset-eroding inflation allow us to build a simple model. Let us start
by imagining a Taylor-rule type heuristic, which captures the utility function
of an individual voter as a cost-minimisation problem with relation to the
output gap (and therefore the negative effects of low growth on employment
and wages) and inflation.
The positive externality associated with a small output gap (i.e. the benefit of a
relatively small output gap that accrues to an individual, especially in terms of
employment security and wage) is mediated by the subjective perception of the
costs of job loss E. Similarly, the (perceived or real) costs of inflation are a
function of nominal assets A. Higher inflation has (or is seen to have) a higher
cost for those who have accumulated more nominal assets. The following
stylised developments capture what we are looking for with this model. In
1955, E was large for a typical voter: full employment was still a distant dream,
employment protection (EPL) was relatively weak and trade unions had at best
only recently settled into their roles of guardians of the post-war settlement.
1 There is some debate about the reasons for inflation aversion among households with mortgages: inflation is not necessarily a negative evolution for them, since rising general price levels can lead to asset inflation, including houses, while inflation erodes debt in mortgages. But rising inflation also produces a restrictive reaction by the central bank, which then (rapidly) increases debt service in a market with variable mortgages such as the UK and the USA and will have a negative effect on the employment rate.
The Politics of Disinflation
12
However, A was very small (she had accumulated few nominal assets, since
both real wages and savings rates were low). A similar voter in 1975 (or the
same one twenty years later; see below) may well have faced a very different
situation, in which E was relatively small: full employment meant that the
probability of job loss was very low, strong EPL was policed by strong trade
unions, and the developed welfare states assured that even without
employment, replacement incomes were relatively high. The term A, in
contrast, would have grown considerably and may even have been relatively
large, represented by more assets in the shape of, amongst others, savings,
defined benefits pension schemes and mortgaged houses (in an era before
speculative bubbles). Between 1955 and 1975, therefore, the perception of the
relative impact of the output gap and inflation almost certainly converged and
may even have reversed in some countries.
Figure 2 offers a graphic representation of the problem with notation that we
will use in the rest of this paper. The vertical axis covers our two variables of
interest, the subjective perception of job loss (E) and the accumulation of
nominal assets (A) on an ordinal scale. When the subjective perception of job
loss is high, the utility that the median voter derives from having a small output
gap is high because a large output gap is seen as having a large negative effect
on their employment security; conversely, the greater the accumulation of
nominal assets, the higher the utility from having a low inflation. The
horizontal axis covers time. Our argument is that these two variables move, in
stylised fashion, along the curves E and A, starting out in the first period with
E significantly above A, the two converging in period II, and A overtaking E in
period III. Note that this mechanism could cover both individual life cycles –
in the limiting case, pensioners do not care at all about their employment
prospects (Vlandas 2017) – and the individual effects of ‘societal development’
life cycles, with a different person in the same occupation being considerably
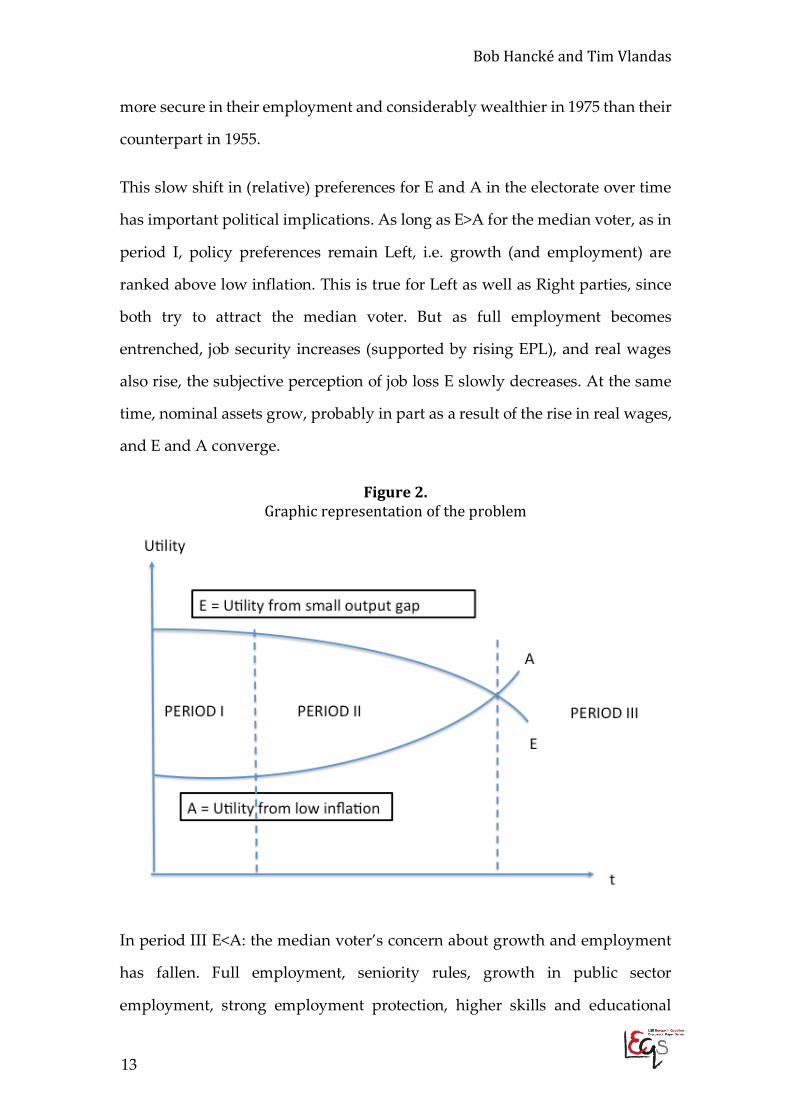
Bob Hancké and Tim Vlandas
13
more secure in their employment and considerably wealthier in 1975 than their
counterpart in 1955.
This slow shift in (relative) preferences for E and A in the electorate over time
has important political implications. As long as E>A for the median voter, as in
period I, policy preferences remain Left, i.e. growth (and employment) are
ranked above low inflation. This is true for Left as well as Right parties, since
both try to attract the median voter. But as full employment becomes
entrenched, job security increases (supported by rising EPL), and real wages
also rise, the subjective perception of job loss E slowly decreases. At the same
time, nominal assets grow, probably in part as a result of the rise in real wages,
and E and A converge.
Figure 2. Graphic representation of the problem
In period III E<A: the median voter’s concern about growth and employment
has fallen. Full employment, seniority rules, growth in public sector
employment, strong employment protection, higher skills and educational
The Politics of Disinflation
14
attainment, and increasing numbers of retirees who are retired for longer all
have the effect that the median voter’s subjective perception of job loss is very
low and the importance attached to a small output gap is relatively low as a
result. At the same time the accumulation of nominal assets such as savings,
pensions and houses has reached a point where the concern about the erosion
of their nominal value trumps (the meanwhile considerably smaller) concerns
about growth and jobs. In period III, therefore, the median voter’s preferences
have been pulled to the Right, i.e. she has become more sensitive to high
inflation (with an inflation rate of zero as optimal).
This dynamic captures quite well the evolution of the political sociology of
advanced capitalist countries since WW II. After post-war reconstruction,
salaried employment was crucial as a source of income for the vast majority of
the population in most western European countries, even in those where
agriculture was still an important sector, such as France and Italy. On average,
wage earners made up the majority of the active population among western
European nations. Households spent a considerable amount of their income on
food and housing. In 1953-4, for instance, a household with two adults and two
children in the middle of the income distribution would be spending 40% of its
income on food in the UK and 42% in Germany (Kramper 2000: 53). At the same
time, very few voters had accumulated significant assets. For instance, the US
homeownership rate was only 43.6% in 1940 (Davis 2012) and most households
in Europe rented their house in 1945 (Horsewood & Dol 2013: 4). The welfare
state was also fairly limited, with social expenditures as a proportion of GDP
below 15% in most European countries in the 1950s (Flora 1986): household
income thus was primarily if not solely the result of salaried employment.
Human capital was generally quite low: in 1950 less than 50% of the population
between 25-64 years of age in OECD countries had completed upper secondary
education or higher (OECD 2001: 84, Fig B6). This overall constellation
Bob Hancké and Tim Vlandas
15
corresponds with period I in our model above, in which E>A for the median
voter.
During the Wirtschaftwunder, the trente glorieuses and generally the Golden Age
of Capitalism in the late 1950s, the 1960s and the early 1970s, full employment
policies, employment protection and growing real wages significantly reduced
the threat of unemployment and poverty for the vast majority of the
population.2 Disposable real income rose fast during that period and doubled
or more in the two decades between 1955 and 1975. In the 1951-55 and 1956-65
periods, for example, average annual real wage growth was consistently above
5% and above 7% in West Germany, above 5% and above 3% in France, above
3% and above 2% in the US and slightly less than 2% and above 3% in the UK
(Brown & Darby 1985: 249). As a result, the share of income spent on food fell
significantly, to 26% in the UK and 30% in Germany in 1973 (Kramper 2000:
53). Job security increased significantly as a result of tight labour markets and
institutional safeguards such as increased employment protection, guarded by
courts and trade unions, which also ensured wage increases in line with
productivity growth. And, lest we forget the shifting composition of the
workforce, a growing share was employed by government in public services,
usually with stable life-time employment contracts: by the late 1970s the public
sector accounted for more than 25% of employment in most of the OECD.
Higher real incomes also meant that savings could partly be channelled into
assets such as pension funds and housing. Thus for instance, the US
homeownership rate increased from 55% in 1950 to 62.1% in 1960, 64.2% in
1970, and 65.6% in 1980 (Davis 2012: 3). Between 1970 and 1980 the home
ownership share as a percentage of the housing stock rose from 41% to 48% in
2 The growth rate of per capita GDP for Western Europe was 4.08% in 1950-1973 – the highest growth rate in recorded history (Maddison 2001: 126).
The Politics of Disinflation
16
Austria, from 45% to 51% in France, from 49% to 56% in the UK, and from 50
to 59% in Italy (Horsewood & Dol 2013: 4). Social expenditures increased
significantly reaching more than 25% by the late 1970s in most European
countries (Flora 1986), thus providing substantial replacement income if
citizens were unable to work. This generalized increase in employment security
and accumulation of assets in the advanced capitalist world corresponds to the
stylised period II in our model, in which E and A converge.
After the 1970s and in part supported by government policies, the
accumulation of nominal assets started to spread quickly across the population.
For instance in the UK, household total financial assets expanded massively
from 1957 onwards, from 43 billion British Pound Sterling in 1957 to GBP 106
billion in 1970, and GBP 304 billion in 1980 (Sbano 2008: 47). At the same time,
financial assets also grew in value. The index of the share price (with 1989 as
100) increased from 2.4 in 1950 to 19.8 in 1973 and to 100 in 1989 in France, from
3.6 to 33.5 to 100 in Germany, from 3.1 to 15.2 and to 100 in UK, and from 5.2 to
32.6 and to 100 in US (Maddison 2001: 141). Real disposable income rose to
being twice as high, or more, than in the previous generation, which translated
into higher savings. In addition, despite rising aggregate unemployment rates
in the 1970s, job security and the chance of obtaining paid employment was
actually de facto very high for the vast majority of the workforce, especially
those with formal secondary and tertiary education.3 A large and rising share
of the electorate grew older, eventually exiting the labour market and
becoming increasingly reliant on pensions and income derived from nominal
assets rather than work (Vlandas 2017).
3 In a context where education to upper secondary level or higher increased from under 50% to more than 60% in the 1970s in OECD countries (OECD 2001: 84).
Bob Hancké and Tim Vlandas
17
These developments are captured by period III in our model, when E<A: for
the vast majority of the working (and voting) population, the threat of long-
term unemployment had become extremely low or inexistent, and households
had become a lot wealthier as a result of disposable income growing beyond
immediate needs. The fall in both market and post-tax income inequality
between the 1950s and the 1990s also secured a relatively homogenous spread
of income growth in most OECD economies, and especially the continental
European and Nordic countries. At some point after the 1960s (or the 1970s in
some countries), therefore, E<A. The possibility of unemployment and the cost
associated with job loss had fallen dramatically for most of the (working)
population, and the median voter’s preference ordering shifted from Left (with
employment concerns trumping inflation aversion) to Right.
Obviously, the stylized picture painted here is exactly that: a stylized picture
that needs to be refined by bringing in variations across the economies of the
OECD. The type of capitalism in a country, its demographic evolution, the
timing of different stages of industrialization and de-industrialization, and
other exogenous factors can influence these developments. For now, the central
message to take away from this analysis is that for the median voter after the
Second World War, the relative weights of employment (and economic
growth), symbolised by ‘E’ in our model, and accumulated nominal assets, ‘A’
in the model, reversed in her preference ordering. With it came, as we will
document in the next sections, an increased fear of inflation – which translated
into a shift to the Right in terms of preferences of economic policy-making
3. From median voter to policies
The second step in our argument tries to understand how the shifting
preferences of the median voter found an expression in party platforms and
The Politics of Disinflation
18
policy options. By making this process a problem rather than simply assuming
it away as most median voters have done, we begin to address a point that is
often ignored in studies relying on the median voter as a central driver of
politics. We know that if the median voter’s subjective perception of the loss
associated with inflation trumps the loss associated with possible
unemployment, she moves to the Right. But what then? Not only would a
median voter model whereby her preferences are immediately mapped onto
positions of parties strictly speaking only hold in pure majoritarian systems (of
which there are actually very few in continental Europe: France and Italy, who
come closest, effectively are diluted majoritarian systems); there is also the
question of how, why and when positions adopted by the median voter find
their way into party policy platforms. To take an example from another policy
area: the median voter might well be in favour of reintroducing the death
penalty for violent crimes that involve minors as victims, or in the USA the
median voter is presumably not averse to (cheaper) universal health care. Yet
neither of these policies has been adopted. There seems to be a missing step in
the median voter–policy nexus. Assuming that median voter preferences steer
the political agenda, the question is how changes in those preferences with
regard to macro-economic outcomes – inflation versus growth and
unemployment in our case – led to changes in policies?
We think that policy areas, and positions in policy areas, are ‘owned’ by
political parties: Social democratic (SD) parties play a pivotal role in this
particular economic policy. Think of SD parties (along the lines of what we did
above) as the ‘natural’ expression of the preferences of the median voter in a
world in which economic insecurity trumps (modest) wealth accumulation
(E>A). Since all other parties are to the Right of the SD parties and therefore
Bob Hancké and Tim Vlandas
19
always prefer relatively more restrictive macro-economic policies4, the critical
shift happens when SD parties also adopt more restrictive monetary policies,
since that pushes the entire policy area considerably to the Right. This changes
the question from a rather general 'when did parties or policy-making move to
the Right?' to a narrower and more specific 'how and when did SD parties move
to the Right on macro-economic policy?’.
Our central hypothesis in this regard builds directly on the median voter model
above: if the median voter has become more conservative in terms of macro-
economic policy preferences when E<A, SD parties followed the median voter
after defeats with an employment-oriented manifesto (where E > A), by also
adopting inflation-averse policies as the priority. As a result, the economic
policy spectrum moved dramatically to the Right, because all other parties to
the Right of the SD parties had already attributed higher values to A than to E
in the past, and only electoral competition anchored them on a growth-friendly
path at that time. In effect the dynamics of the median voter's concern for her
accumulated wealth against a background of negligible economic insecurity
forced the SD parties to the Right in economic policy terms.
More formally, consider the dynamics between the median voter (MV) and SD
parties in a one-dimensional space with three parties, Left (L), Centre (C) and
Right (R), in which all three parties command (to keep things simple) one-third
of the vote, and C can form coalitions with both L and R. In period I (when E>A
in the MV’s preference ordering), L and C combined command more than 50%
of the vote. Since the median voter’s preference ordering is E>A, L reflects the
plurality of the voters, L and C have a majority (with C tactically choosing to
4 We treat Communist parties as similar to SD on this dimension and ignore the – usually Right – populist parties that have a strong exclusionary, 'national' social dimension in their policies, but usually have very little of intelligence to offer on macro-economic policy. With very few exceptions these far Left and far Right parties have in fact played only a very small role in actual election outcomes.
The Politics of Disinflation
20
follow L’s lead on macroeconomic policy to avoid electoral penalties in the next
election) and economic policy remains more sensitive to employment than
inflation. Again, to keep things simple, assume that the share of the vote does
not change dramatically from one election to the next (but might obviously
change significantly over longer periods of time).
In Period II, when E=A for the MV, C can now effectively choose between L
and R, without the risk of electoral penalties: the MV is, as it were, indifferent
between E and A. Both a CL and a CR coalition yield a viable majority. C might
want to stay in a coalition with L for reasons that are unrelated to this particular
economic policy stance. Yet if C reads the move of the MV as a permanent shift
to the Right, it will also consider and actively pursue a coalition with R (since
that will allow C to reflect preference shifts more accurately and tactically reap
electoral rewards by combining hawkish policies on inflation with more dovish
positions on other policies outside macro-economics). That heralds period III:
E<A for the MV and the CR coalition is now entrenched.
Meanwhile L can hold on to expansive policies as long as that is part of the
coalition with C. As the MV’s preferences move to the Right, L can hold out as
the employment and growth-friendly alternative but will ultimately be forced
to adopt a policy that is closer to R than to the original L position lest it stumbles
from one election defeat to another and sees its electoral basis decline. With
that conversion on macro-economics by the social-democratic parties, inflation
aversion has become the new centre in the political system, reflecting the MV’s
preferences for low inflation.
The next sections provide descriptive and analytical empirical evidence for
these arguments – first of the shift rightwards in median voter preferences and
then for the translation of this into social democratic party platforms as a result
of electoral competition.
Bob Hancké and Tim Vlandas
21
4. The moving median voter and the shifting party system
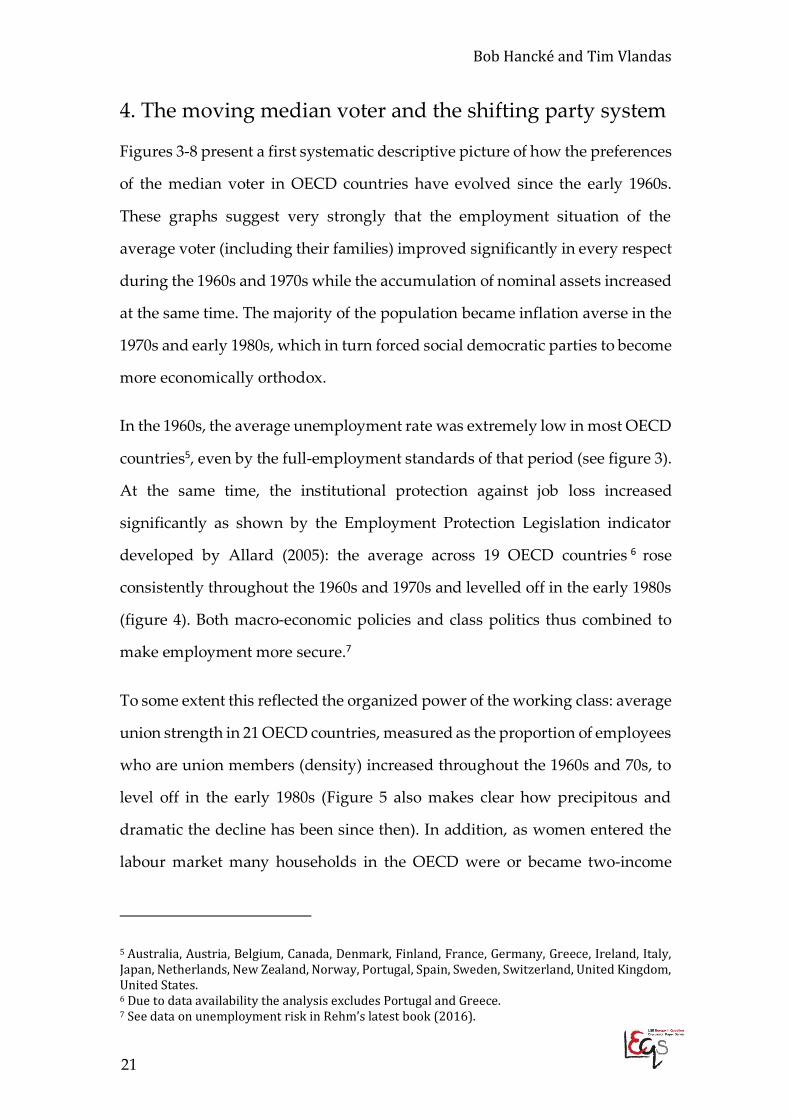
Figures 3-8 present a first systematic descriptive picture of how the preferences
of the median voter in OECD countries have evolved since the early 1960s.
These graphs suggest very strongly that the employment situation of the
average voter (including their families) improved significantly in every respect
during the 1960s and 1970s while the accumulation of nominal assets increased
at the same time. The majority of the population became inflation averse in the
1970s and early 1980s, which in turn forced social democratic parties to become
more economically orthodox.
In the 1960s, the average unemployment rate was extremely low in most OECD
countries5, even by the full-employment standards of that period (see figure 3).
At the same time, the institutional protection against job loss increased
significantly as shown by the Employment Protection Legislation indicator
developed by Allard (2005): the average across 19 OECD countries 6 rose
consistently throughout the 1960s and 1970s and levelled off in the early 1980s
(figure 4). Both macro-economic policies and class politics thus combined to
make employment more secure.7
To some extent this reflected the organized power of the working class: average
union strength in 21 OECD countries, measured as the proportion of employees
who are union members (density) increased throughout the 1960s and 70s, to
level off in the early 1980s (Figure 5 also makes clear how precipitous and
dramatic the decline has been since then). In addition, as women entered the
labour market many households in the OECD were or became two-income
5 Australia, Austria, Belgium, Canada, Denmark, Finland, France, Germany, Greece, Ireland, Italy, Japan, Netherlands, New Zealand, Norway, Portugal, Spain, Sweden, Switzerland, United Kingdom, United States. 6 Due to data availability the analysis excludes Portugal and Greece. 7 See data on unemployment risk in Rehm’s latest book (2016).
The Politics of Disinflation
22
earner families in the 1970s and early 1980s. The data are not consistently
available since 1960 to calculate a meaningful cross-country average but
individual cases suggest that many countries had high female employment
rates by 1970s and 1980s (see table 2). Even if unemployment rates among men
increased, this means that in many countries possibly 60-65% of households
could rely on two incomes.
Figure 3: Low unemployment in 1960s and 70s in OECD countries
Figure 4: EPL rises from 60s to 80s in OECD countries
Figure 5: Union strength rises in 60s and 70s in OECD
Figure 6: Housing ownership increases in OECD
If we take the owner occupancy rate in housing (housing/home ownership) as
a proxy for assets, an interesting picture emerges. Against this background of
increasing employment security (and broader social protection and economic
security), average households slowly became wealthier. As Figure 6 shows,
24
68
10
Une
mpl
oym
ent r
ate
1960 1970 1980 1990 2000Year
.51
1.5
22.
5
EP
L (a
llard
inde
x)
1960 1970 1980 1990 2000Year
3540
4550
Uni
on d
ensi
ty
1960 1970 1980 1990 2000Year
5052
5456
5860
Hou
sing
ow
ners
hip
rate
1960 1970 1980 1990 2000Year
Bob Hancké and Tim Vlandas
23
home ownership rates in the OECD 8 rose quickly from about half of the
occupancies in 1960 to almost 58% in 1980, and leveled off by 1990 just below
60%.
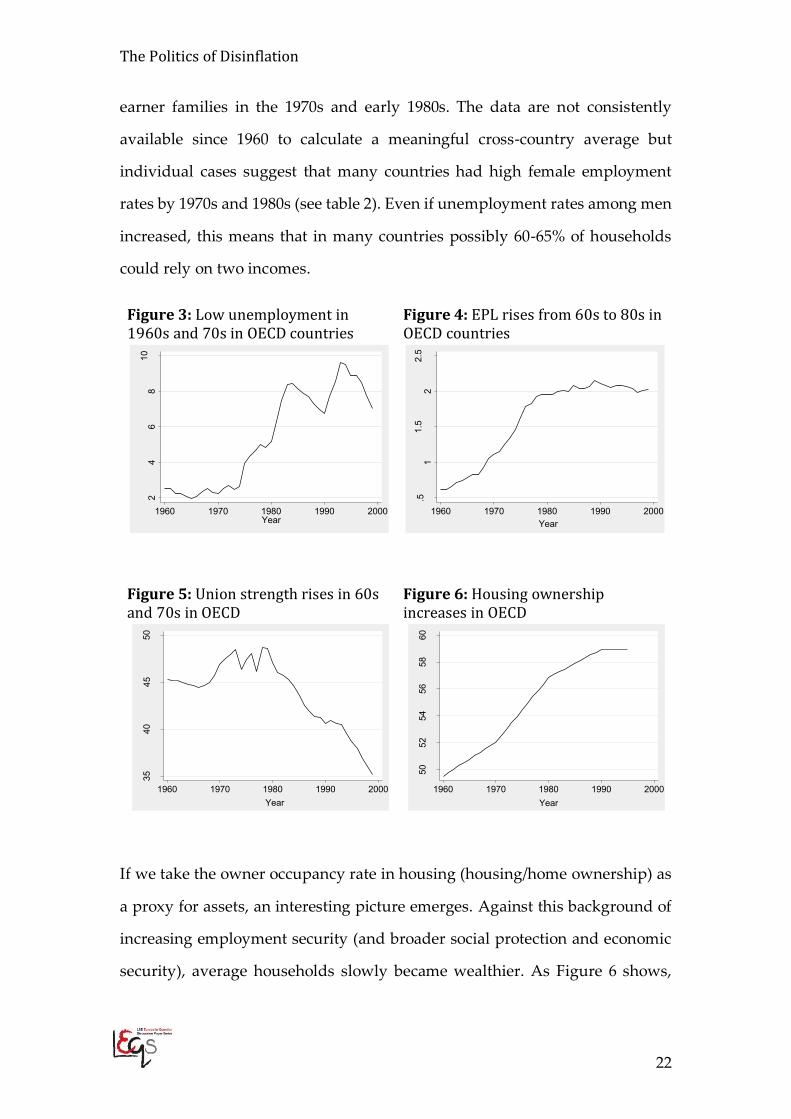
Table 2. Female employment rates passing 50% threshold in selected countries
Country Earliest data Year of earliest data
First available data point above 50%
Country for which data<50% exist Canada 47% 1976 51% 1979 Germany 46% 1970 51% 1989 Norway 48% 1972 59% 1975 US 39% 1960 51% 1977
First data point suggests these countries had already passed the 50% mark early on Finland 60% 1963 64% 1979 Sweden 53% 1963 70% 1978 Japan 53% 1968
First available datapoint in 1980s Australia 52% 1986 Denmark 64% 1983 France 50% 1983 New Zealand 60% 1986 UK 1984
Source: The following examples are rounded and taken from the comparative politics dataset (Armingeon et al. 2015).
To compare our proxy for assets with what happened to subjective
employment insecurity requires creating an index for the latter, which is more
complicated. An obvious choice would be the unemployment rate but this may
be related to inflation through a direct economic (short-term Phillips curve)
mechanism rather than the political and policy channel that we explore here.
Unemployment may also be a poor predictor of insecurity when income
replacement rates are high and/or strong EPL means that insiders do not face a
large risk of being unemployed in dualised economies (see Rueda 2007;
Emmenegger et al. 2012). We therefore choose to rely on two main variables to
create an index of labour market security: Employment Protection Legislation,
which captures job security, and educational attainment in years, which captures
8 The cross-national average excludes Greece and Portugal due to a lack of data.
The Politics of Disinflation
24
(the increased development of) human capital. EPL could be argued to have a
positive impact on wages, but this then actually stacks the cards against our
argument because if this effect were to dominate, the correlation between EPL
and inflation would be positive (think of this as the conventional new
Keynesian view, as in Carlin and Soskice (2006), or the Kaleckian view, both of
which suggest that the inflation rate rises if job security increases).
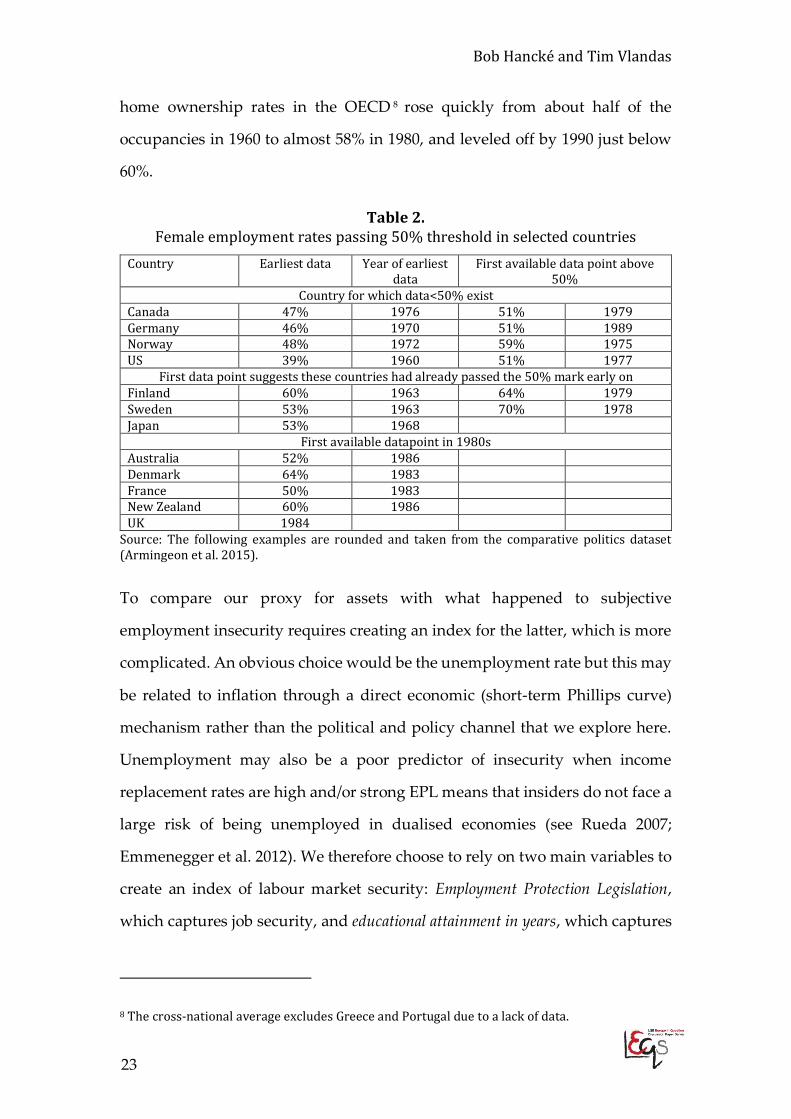
Figure 7. Labour market insecurity and asset ownership, cross-country average
In Figure 7, we plot the cross-country average of the inverse9 of our index of
labour market security and our index of asset ownership. Both indices are
standardised with a standard deviation of 1 and mean of 0, which allows us to
evaluate in which period our cross-country average was under or above the
average for the whole sample for each index. Before 1980, labour market
insecurity was high (i.e. the inverse of security was high, meaning that labour
9 We calculate the inverse to facilitate the identification of the point at which the curve for the rise of home ownership crosses the curve capturing labour market security.
-1-.5
0.5
11.
5
1960 1970 1980 1990 2000time
Inverted labour market security indexHome ownership index
Bob Hancké and Tim Vlandas
25
market security was low) while home ownership was low. Around 1980, labour
market insecurity fell below the average for the period 1960-2003 while home
ownership rose above the period average. This is an encouraging result, as it is
almost exactly what we anticipated in our model and which was graphically
represented in figure 2.
The results of this combination of (perceived) increased employment security
and accumulation of assets was that the majority of the population – which
obviously included the median voter – became considerably more inflation
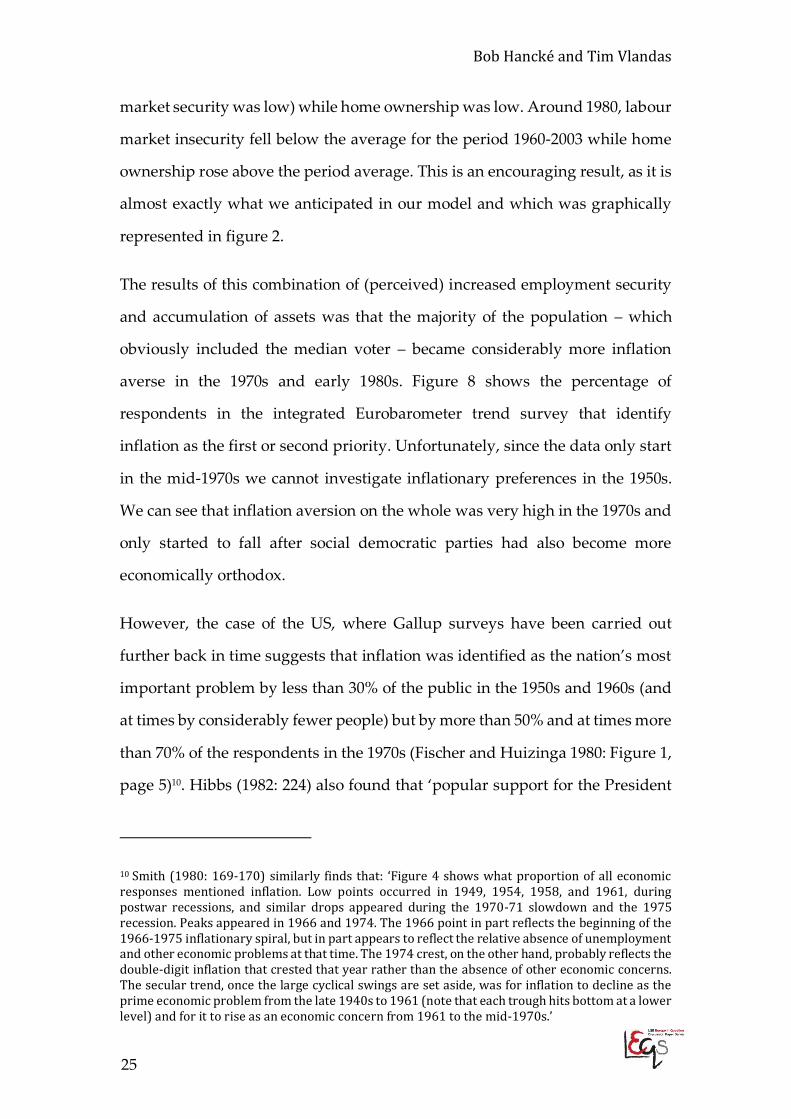
averse in the 1970s and early 1980s. Figure 8 shows the percentage of
respondents in the integrated Eurobarometer trend survey that identify
inflation as the first or second priority. Unfortunately, since the data only start
in the mid-1970s we cannot investigate inflationary preferences in the 1950s.
We can see that inflation aversion on the whole was very high in the 1970s and
only started to fall after social democratic parties had also become more
economically orthodox.
However, the case of the US, where Gallup surveys have been carried out
further back in time suggests that inflation was identified as the nation’s most
important problem by less than 30% of the public in the 1950s and 1960s (and
at times by considerably fewer people) but by more than 50% and at times more
than 70% of the respondents in the 1970s (Fischer and Huizinga 1980: Figure 1,
page 5)10. Hibbs (1982: 224) also found that ‘popular support for the President
10 Smith (1980: 169-170) similarly finds that: ‘Figure 4 shows what proportion of all economic responses mentioned inflation. Low points occurred in 1949, 1954, 1958, and 1961, during postwar recessions, and similar drops appeared during the 1970-71 slowdown and the 1975 recession. Peaks appeared in 1966 and 1974. The 1966 point in part reflects the beginning of the 1966-1975 inflationary spiral, but in part appears to reflect the relative absence of unemployment and other economic problems at that time. The 1974 crest, on the other hand, probably reflects the double-digit inflation that crested that year rather than the absence of other economic concerns. The secular trend, once the large cyclical swings are set aside, was for inflation to decline as the prime economic problem from the late 1940s to 1961 (note that each trough hits bottom at a lower level) and for it to rise as an economic concern from 1961 to the mid-1970s.’
The Politics of Disinflation
26
was relatively more sensitive to nominal, inflation economic performance than
to real economic performance in the 1970s than in the previous decade. In the
1960s the mean of the real elasticities was about twice the mean of the inflation
elasticities (0.3 versus 0.14); in the 1970s the average real and nominal
elasticities were both in the vicinity of one-half. By the second quarter of 1980
the relative impact of inflation on political support had increased enormously.’
Figure 8: Inflation aversion peaked in 1970s and early 1980s
Figure 9: Average ‘economic orthodoxy’ of party manifesto
The top panel of Figure 9 maps the degree of ‘economic orthodoxy’ in every
decade covered by the party manifesto database (Volkens et al. 2014) and
shows very clearly that social democratic parties became more economically
orthodox in the 1970s, reached a peak in the 1980s, which remained stable in
the 1990s and only started to fall in the 2000s – when inflation was no longer a
matter of concern, even among Right parties and extremely orthodox
0 1 2 3
2000s
1990s
1980s
1970s
1960s
All parties - Western EuropeSocial democratic parties - Western Europe

Bob Hancké and Tim Vlandas
27
economists (although it never ceased to be one for central bankers, as we saw
during the onset of the financial crisis). If we focus only on western European
countries11, shown in the bottom panel of Figure 9, social democratic parties
became more orthodox in the 1970s and continued to become more orthodox
in the 1980s and 1990s. Following a decade of low inflation the manifestos of
both the social democratic parties and their right-wing counterparts had
become very similar in terms of adherence to economic orthodoxy.
In general terms, therefore, these aggregate figures suggest that the three
phenomena more or less follow our logic: with the increase of employment
security, and the accumulation of nominal wealth, the move to the Right of the
median voter in turn brings about a shift to the Right of SD parties in their
economic policy platforms.
5. Economic security, inflation aversion, party orthodoxy and inflation
In figures 10-12, we present several combinations of relevant variables that
allow us to explore, at least descriptively, the key causal relationships in our
argument. We systematically plotted shifts in one of our independent variables
in the argument in a decade against shifts in the following decade – for
economic security, inflation aversion, party manifestos, and actual effects on
inflation rates.
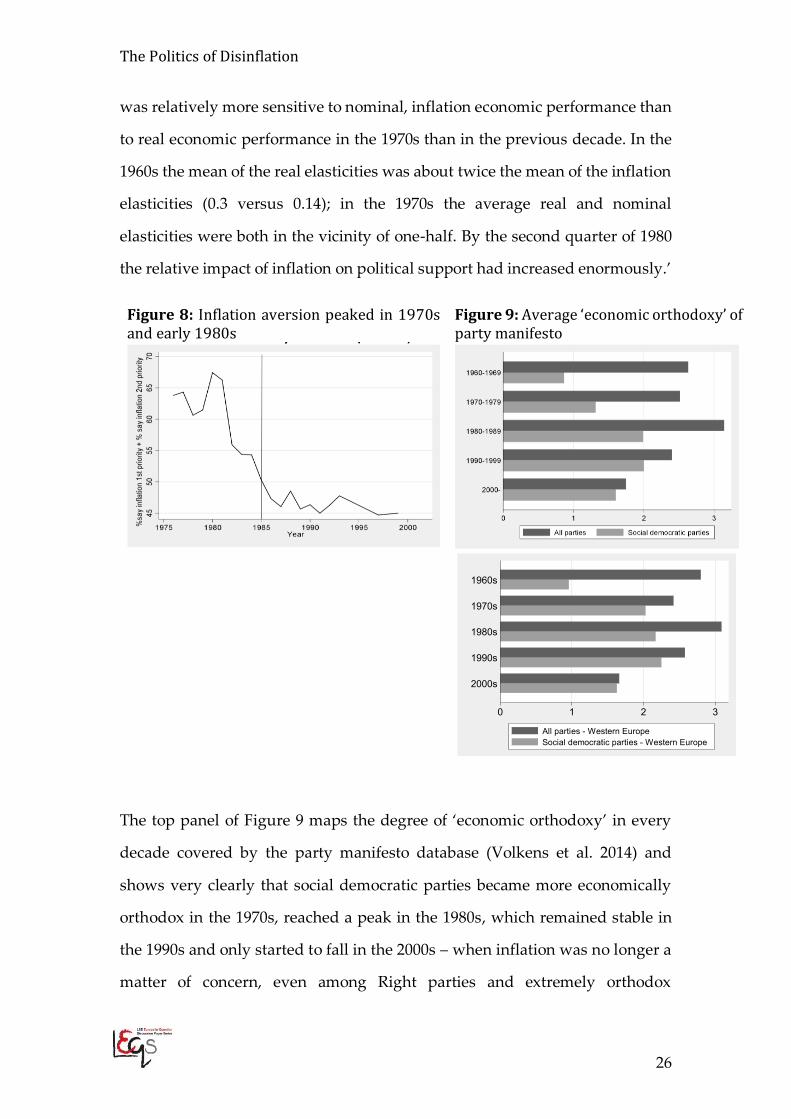
Figure 10 plots the relation between our index of economic security (which
combines the two indices of labour market security – not the previously
constructed inverted version – and assets presented in Figure 7) and the mean
11 The following countries are included in the analysis: Austria, Belgium, Denmark, Finland, France, Germany, Great Britain, Greece, Iceland, Ireland, Italy, Netherlands, Norway, Portugal, Spain, Sweden, and Switzerland.
The Politics of Disinflation
28
inflation aversion in the 1980s. That association is positive, although the spread
of cases across the two-dimensional space is large, with Belgium and Denmark,
Figure 10. Security and party manifesto economic orthodoxy in the 1980s
Figure 11. Inflation aversion and party manifesto economic orthodoxy
belgium
denmark
france
germany
ireland
italy
netherlands
spain
united kingdom
.4.5
.6.7
.3 .4 .5 .6 .7Security index in 1980s
Inflation aversion in 1980s Fitted values
austria
belgiumbelgium
belgium
denmark
denmarkdenmark
finland
france
france
france
germany
germany
germany greece
greece
ireland
ireland
ireland
italyitaly
italyluxembourgluxembourgluxembourg
netherlands
netherlands
netherlands
norway
portugal
portugal
spain
spain
sweden
united kingdom
united kingdom
united kingdom
02
46
0 .2 .4 .6 .8Mean inflation aversion in previous decade
Party manifesto orthodoxy in current decade Fitted values
Bob Hancké and Tim Vlandas
29
for example, scoring roughly equally high on the economic security index but
found on opposite sides of the party orthodoxy score. The bivariate correlation
coefficient associated with the data in Figure 10 is 0.39 (with a p-value of 0.30).
Inflation aversion, in turn, is positively correlated with higher economic
orthodoxy of parties in the decade that follows, as figure 11 demonstrates. The
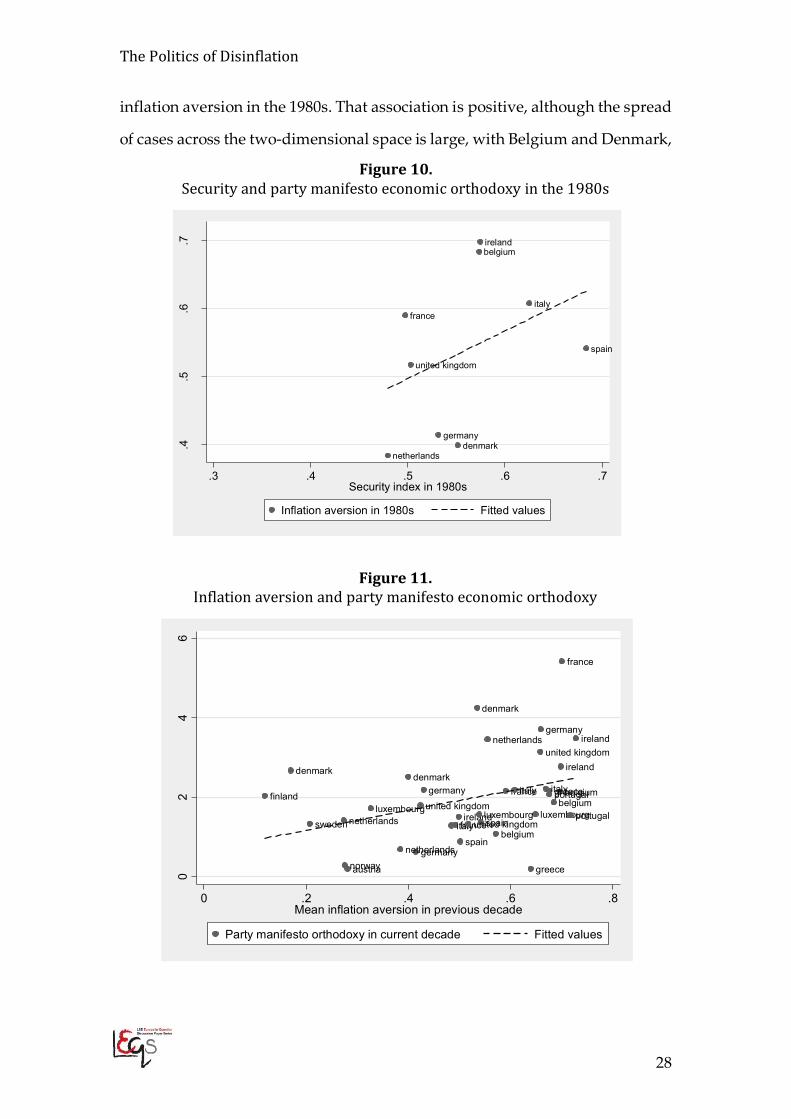
Figure 12. Party manifesto economic orthodoxy in a decade and inflation in the next decade
bivariate correlation coefficient between inflation aversion in the decade before
and the average score of party manifestoes over a decade is 0.37 (and a p-value:
0.025). The spread of cases is also slightly narrower than in the case of figure
10. In addition to the scatter plot in Figure 11, we also performed a simple
regression analysis, which consisted of 34 observations. We used average
orthodoxy in economic policy platforms in a country over a decade as our
dependent variable, whilst inflation as well as mean inflation aversion in the
preceding decade were our independent variables. This regression analysis
suggests that inflation aversion has a (significant) positive relationship with
australia
australia
austria
austria
belgium
belgium
canada
canada
denmark
denmark
finland
finland
france
france
germany
germanyireland
ireland
italy
italy
japan
netherlands
netherlands
new zealand
new zealand
norway
norway
sweden
sweden
switzerland
switzerland
united kingdom
united kingdom
united states
united states
05
1015
20
0 5 10 15Party manifesto orthodoxy in previous decade
Inflation in current decade Fitted values
The Politics of Disinflation
30
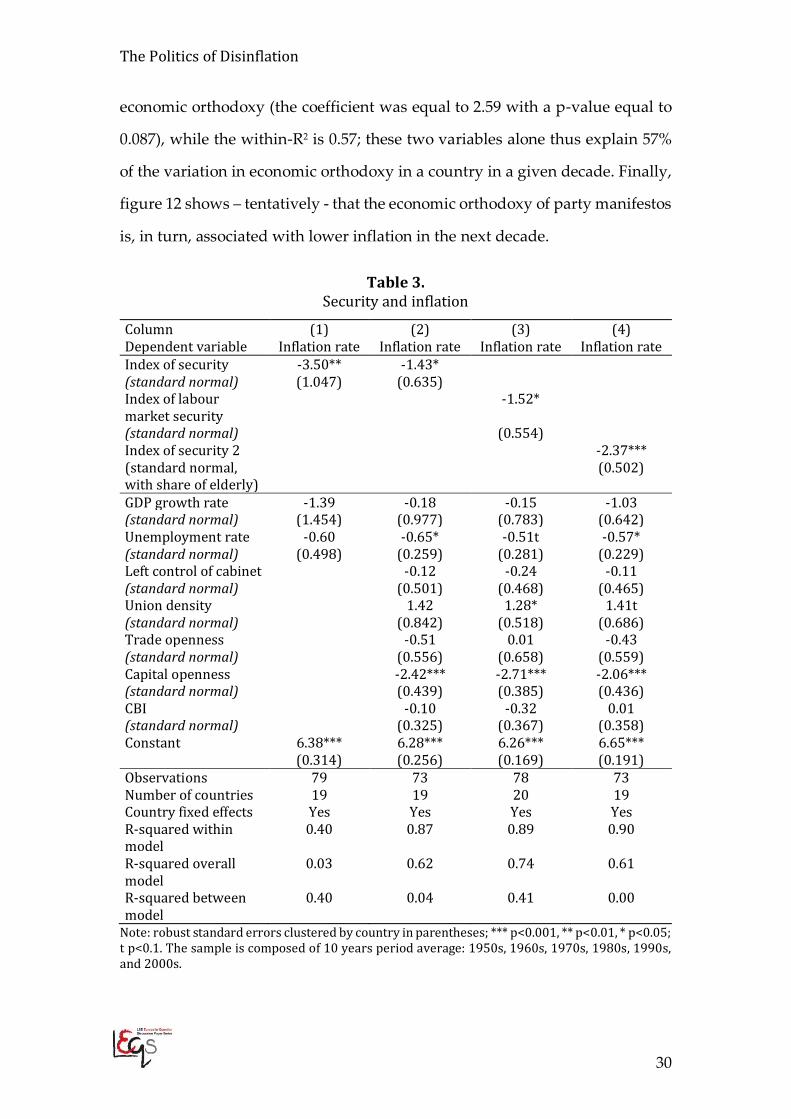
economic orthodoxy (the coefficient was equal to 2.59 with a p-value equal to
0.087), while the within-R2 is 0.57; these two variables alone thus explain 57%
of the variation in economic orthodoxy in a country in a given decade. Finally,
figure 12 shows – tentatively - that the economic orthodoxy of party manifestos
is, in turn, associated with lower inflation in the next decade.
Table 3. Security and inflation
Column (1) (2) (3) (4) Dependent variable Inflation rate Inflation rate Inflation rate Inflation rate Index of security -3.50** -1.43* (standard normal) (1.047) (0.635) Index of labour market security
-1.52*
(standard normal) (0.554) Index of security 2 -2.37*** (standard normal, with share of elderly)
(0.502)
GDP growth rate -1.39 -0.18 -0.15 -1.03 (standard normal) (1.454) (0.977) (0.783) (0.642) Unemployment rate -0.60 -0.65* -0.51t -0.57* (standard normal) (0.498) (0.259) (0.281) (0.229) Left control of cabinet -0.12 -0.24 -0.11 (standard normal) (0.501) (0.468) (0.465) Union density 1.42 1.28* 1.41t (standard normal) (0.842) (0.518) (0.686) Trade openness -0.51 0.01 -0.43 (standard normal) (0.556) (0.658) (0.559) Capital openness -2.42*** -2.71*** -2.06*** (standard normal) (0.439) (0.385) (0.436) CBI -0.10 -0.32 0.01 (standard normal) (0.325) (0.367) (0.358) Constant 6.38*** 6.28*** 6.26*** 6.65*** (0.314) (0.256) (0.169) (0.191) Observations 79 73 78 73 Number of countries 19 19 20 19 Country fixed effects Yes Yes Yes Yes R-squared within model
0.40 0.87 0.89 0.90
R-squared overall model
0.03 0.62 0.74 0.61
R-squared between model
0.40 0.04 0.41 0.00
Note: robust standard errors clustered by country in parentheses; *** p<0.001, ** p<0.01, * p<0.05; t p<0.1. The sample is composed of 10 years period average: 1950s, 1960s, 1970s, 1980s, 1990s, and 2000s.
Bob Hancké and Tim Vlandas
31
Results from a preliminary regression analysis on a sample of 21 OECD
countries in the period 1950s-2000s seem to confirm our hypothesis (see table
3). Our regression analysis reports robust standard errors clustered by country,
includes country fixed effects and is carried out on 10-years period average to
capture the fact that we are looking at slow moving shifts in variables rather
than year-on-year variation. Column 1 suggests that our index of security
combining both labour market security and home ownership (shown in Figure
7) is negatively correlated with inflation when controlling for GDP growth and
unemployment. Adding Left control of cabinet, union density, central bank
independence, and trade as well as capital openness does not change the results
(column 2). In column 3, we show that focusing just on labour market security
while excluding assets does not change the results. Adding the share of elderly
in our index to capture the fact that the elderly are more inflation averse and
unaffected by labour market insecurity (see Vlandas 2017) does not change the
results (column 4).
If we use yearly data the results do not change (table A2 in appendix). One
could argue that this correlation is coincidental and driven by the high inflation
and low security of the 1970s. In column 3 of table A2, we therefore restrict the
sample to the moderately low-inflation post-1978 period: our index of
economic security is still statistically significant. In column 4, we investigate
whether the results are robust to the exclusion of country fixed effects: union
density is no longer significant but our index of economic security remains
significant with the correct sign. In columns (5) and (6), we take the first and
second lags, respectively, of our key independent variables (except for GDP
growth). In column 7 we present the results when we run the regression on 5-
years period averages and in columns 8 to 10 we try alternative specifications
of our index of security. The main results are unchanged. Finally in column 11,
The Politics of Disinflation
32
we add union density to this index of economic security (which as a result
becomes composed of EPL, educational attainment, housing ownership, the
share of elderly and union density): the coefficient is still negative and
significant at the 10% level. Finally, we have also rerun the yearly analysis
using an error correction model (ECM)12 which suggest our index of security
has a significant negative long run effect on inflation but no short term effect
(not included in this paper but available from authors).
An important caveat at this stage is that there are potentially important
methodological problems with such a regression analysis because of the nature
of our dependent variable and argument. Our aim is to explain a regime shift
– from Keynesianism to monetarism (captured in the transition from
moderate/high to low inflation), which happens at a single point in time in all
developed countries (though not necessarily at the same time), and not the cross-
national variation in inflation across countries and time. In addition, we argue that
this shift was driven by a combination of changes in the economic conditions of
the electorate, which fed into their inflation preferences and in turn into
political parties’ economic orthodoxy. Economic insecurity might also be
endogenous to inflation, at least partly. As a result the correlational logic
underpinning regression analysis might not provide a good test of our
argument, which is why we pay more heed to the careful historical analysis of
how these shifts have occurred in Western Europe in the next section.13
12 Panel data unit root tests on the yearly sample reject the null hypothesis that all panels contain a unit root for inflation but not for our index of security so the latter may be non-stationary. ECMs are designed to handle non-stationarity. The error correction coefficient is statistically significant suggesting both series are co-integrated (i.e. the error term is stationary) and hence the inference from the ECM is valid. 13 Focusing on the impact of ageing is more promising from a statistical perspective because the share of ageing is exogenous to inflation. Ageing on its own is unlikely to lead to a shift in the inflation regime, but if we are right we should observe that countries where the share of people above 65 is larger also have lower inflation. This is precisely what Vlandas (2017) finds using a wide range of methods and samples. He provides robust statistical evidence for the part of our argument that is exogenous to inflation and can be expected to have a cross-national effect.
Bob Hancké and Tim Vlandas
33
That said, we have thus far found highly suggestive aggregate historical,
descriptive cross-national, and statistical-analytical evidence for our argument.
But the analysis was carried at a level of aggregation that makes it hard to trace
the process through which changing economic conditions feed, through the
electorate, into shifts in party positions. This is what we do in the next section.
6. Case studies: the UK, France, Germany and Sweden
The dynamics between the median voter and social-democratic parties are the
subject of four short case studies of the UK, France, Germany and Sweden,
more or less going back to the mid-1960s. The four countries embody the main
broad political-economic models found in Western Europe, thus maximising
the differences between these systems: this suggests that the causal mechanism
operates regardless of broader historical-institutional background conditions
(see also Hall 2007 on these four). In addition, they also teach us something
more immediate with regard to the argument that links median voters and
social-democratic parties. Across these four cases, we will go from a pure
majoritarian electoral system, where median voter preferences directly
influence the electoral fortunes of social-democratic parties, to a pure
proportional system in Germany and Sweden – but with the latter having a
hegemonic social-democratic party that can, to some extent at least, shield itself
from direct electoral competition on macroeconomic policies. That means that
we have both cases of high median voter influence (the UK and, to a lesser
extent, France), cases of party competition beyond a simple dyad and, in the
latter, even one with low levels of multi-party competition.
United Kingdom: From Thatcher to Blair via low inflation
We start with the United Kingdom, the country in Europe with a straight
majoritarian electoral system. Here the logic implied by our argument unfolds
The Politics of Disinflation
34
quite nicely. In essence the story starts, not unsurprisingly, with Margaret
Thatcher’s election victory in 1979. The policies the Conservative Prime
Minister adopted afterwards grafted themselves onto slow shifts in the
economic situation of the median voter, with the effect that Thatcher de facto
changed the profile of the latter. While her government initially was not off to
an auspicious start, once unemployment fell in the mid-1980s, the fear of job
loss also fell significantly as a result of a previously large increase in education,
possibly the single best predictor of increased life chances and especially low
unemployment in the late 1980s and 1990s. This came on the back of a
significant reduction in working hours during the post-war boom years
(Sutcliffe 1996: 147). In addition, the combination of lower taxes and financial
deregulation induced a ‘wealth effect’ among voters (Crouch 2009).
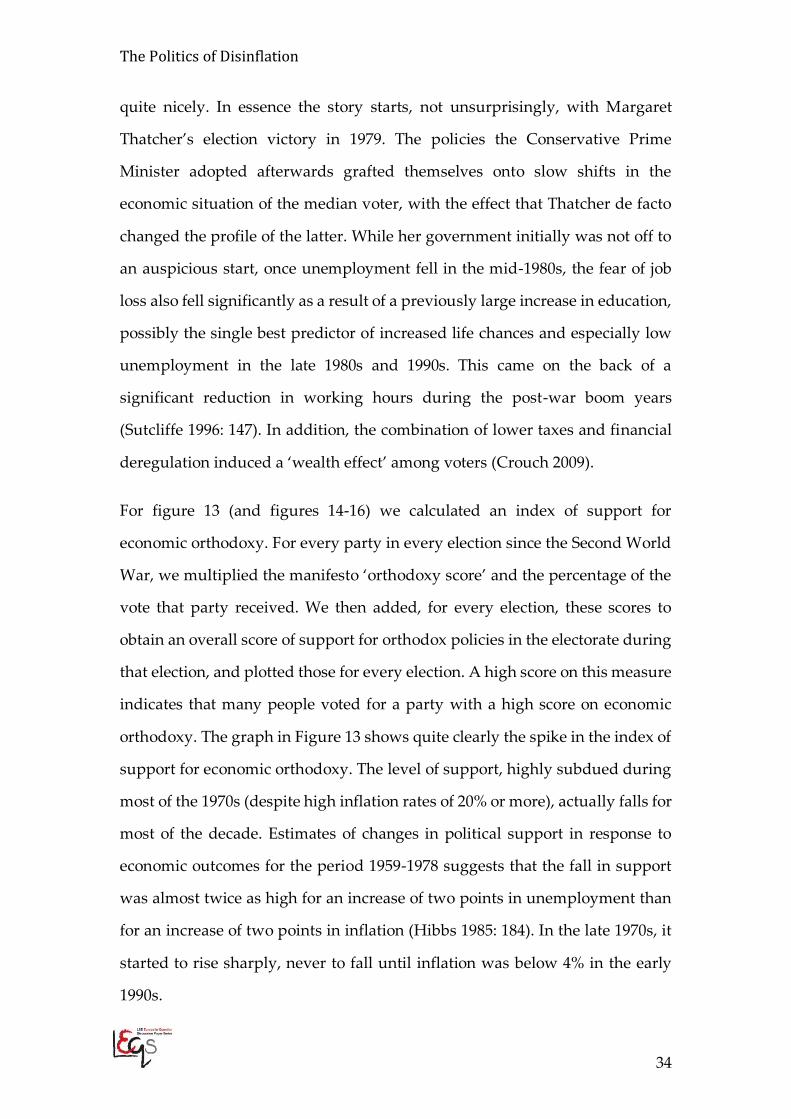
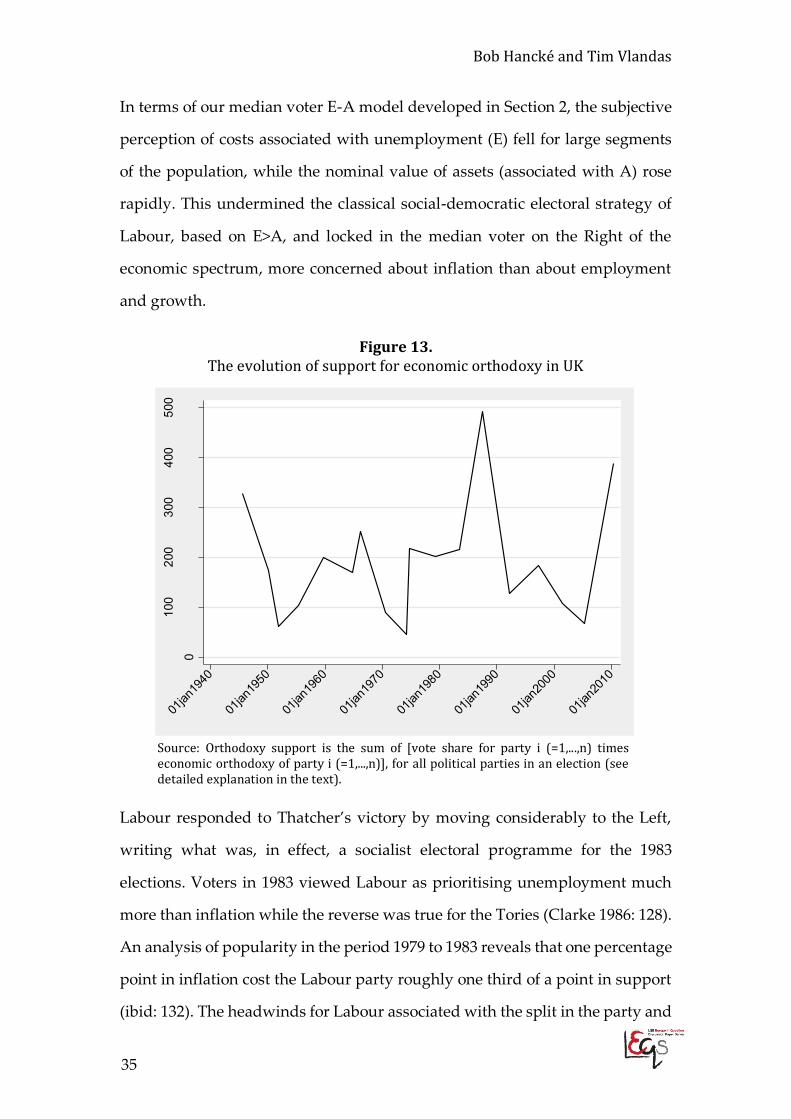
For figure 13 (and figures 14-16) we calculated an index of support for
economic orthodoxy. For every party in every election since the Second World
War, we multiplied the manifesto ‘orthodoxy score’ and the percentage of the
vote that party received. We then added, for every election, these scores to
obtain an overall score of support for orthodox policies in the electorate during
that election, and plotted those for every election. A high score on this measure
indicates that many people voted for a party with a high score on economic
orthodoxy. The graph in Figure 13 shows quite clearly the spike in the index of
support for economic orthodoxy. The level of support, highly subdued during
most of the 1970s (despite high inflation rates of 20% or more), actually falls for
most of the decade. Estimates of changes in political support in response to
economic outcomes for the period 1959-1978 suggests that the fall in support
was almost twice as high for an increase of two points in unemployment than
for an increase of two points in inflation (Hibbs 1985: 184). In the late 1970s, it
started to rise sharply, never to fall until inflation was below 4% in the early
1990s.
Bob Hancké and Tim Vlandas
35
In terms of our median voter E-A model developed in Section 2, the subjective
perception of costs associated with unemployment (E) fell for large segments
of the population, while the nominal value of assets (associated with A) rose
rapidly. This undermined the classical social-democratic electoral strategy of
Labour, based on E>A, and locked in the median voter on the Right of the
economic spectrum, more concerned about inflation than about employment
and growth.
Figure 13. The evolution of support for economic orthodoxy in UK
Source: Orthodoxy support is the sum of [vote share for party i (=1,...,n) times economic orthodoxy of party i (=1,...,n)], for all political parties in an election (see detailed explanation in the text).
Labour responded to Thatcher’s victory by moving considerably to the Left,
writing what was, in effect, a socialist electoral programme for the 1983
elections. Voters in 1983 viewed Labour as prioritising unemployment much
more than inflation while the reverse was true for the Tories (Clarke 1986: 128).
An analysis of popularity in the period 1979 to 1983 reveals that one percentage
point in inflation cost the Labour party roughly one third of a point in support
(ibid: 132). The headwinds for Labour associated with the split in the party and
0
100
200
300
400
500
Aus
terit
y su
ppor
t
01jan
1940
01jan
1950
01jan
1960
01jan
1970
01jan
1980
01jan
1990
01jan
2000
01jan
2010
The Politics of Disinflation
36
the ultra-patriotic mood in the country after the Falklands war, both of which
have been invoked as reasons for Labour’s defeat that year, certainly made
things worse for the party, but they should not divert attention from the long-
term development in the British electorate towards explicit inflation aversion.
In response, the Kinnock years saw a gradual move to the centre-Left,
symbolized in the struggles against the socialist factions that had organized
within the Labour party. On macroeconomics, the party adopted a
considerably more orthodox platform for the 1987 election than it had done
even in the late 1970s (when inflation was, in fact, rampant and thus arguably
required a vigorous policy response): the score for orthodoxy as recorded in
the Party Manifestos Project shot up from close to zero in 1983 to 2.5 out of 5 in
1987. The Labour party gained ground in the election that year, but remained
nonetheless over 10 percentage points behind the Tories. By 1992, the Tories
and Labour were neck-and-neck in the election, which Labour lost narrowly,
but in the 1997 election, Labour won a massive majority with an election
manifesto that scored 4.5 on economic orthodoxy – effectively moving to the
Right of the Conservatives. Keen to brandish their new credentials, once in
office, Tony Blair and Gordon Brown handed operational independence to the
Bank of England, thus sealing the fight against inflation AND against growth-
oriented Keynesianism in their own party – at least until the financial crisis of
2008.
In sum, once the median voter’s preferences had moved from concern over
growth and employment to fear of inflation, Labour slowly followed suit, and
ended up being more orthodox than the Conservative Party. In a dramatic and
highly symbolic move a few days after Labour’s election victory in 1997, the
Blair government handed the Bank of England political independence: in that
new inflation-targeting regime the government set the target and appointed
Bob Hancké and Tim Vlandas
37
governors, but the latter, in the Monetary Policy Committee of the Bank, were
given the autonomy to decide how to meet the target.
France: from socialism in one country to competitive disinflation
A very similar process took place in France, our second case. Under the Fifth
Republic the Left took a long time getting to power, and was elected in 1981 on
what would today be considered a far-Left programme, while at the same time,
the electorate was slowly moving to the Right on economic policy issues. The
conversion to a soft version of monetarism and inflation targeting followed a
series of defeats against the centre-Right and, very importantly, a series of
struggles within the Socialist Party – but ultimately the French Left ended up
in a very similar position to Labour (pushed there, to some extent, by European
economic policy constraints), after a very similar conversion.
The place to start the French case study is the post-war boom. Between the end
of post-war reconstruction (around 1950) and the second oil shock in 1979, the
French lived through what became known as the ‘Trente Glorieuses’ (or
‘Glorious Thirty’, in the words of Fourastié 1979). The country modernised its
economy and industry, becoming the best pupil of Taylorism and Fordism on
the continent (Hancké 2002), while standards of living for the average family
almost doubled during the first twenty years of that period: spending on food
and clothing took up roughly 65% of household’s consumption in 1950, fell to
54% in 1959, and to 44.5 % in 1968 (Sutcliffe 1996: 145), while average annual
working hours fell by more than 250 hours between 1950 and 1973 (Sutcliffe
1996: 147). Wealth was slowly accumulated, while job security increased
dramatically for the majority of workers. Private savings as a fraction of
national income had increased significantly during the 1950s and 1960s and
The Politics of Disinflation
38
remained high in the 1970s.14 From its lowest point in the 20th century after the
Second World War, the wealth to disposable income ratio increased from under
300% to over 400% by the late 1970s and early 1980s.15 Temporary work was
regulated in the 1970s (Vlandas 2013) while the EPL index (developed by
Allard 2005) shot up from 0.1 in 1960 to 2.3 in 1980, 2.8 in 1985 and 3 in 1990.
Educational attainment also increased sharply in the 1980s, on the back of
government policies to have over 75% of a cohort pass their certificate of
secondary studies, the Baccalauréat, by 1994 (up from 25% in 1984), and go on
to higher studies, in technical or academic colleges and universities. In effect,
by the mid-1980s, inflation looked like a far more important problem for the
vast majority of the French than unemployment – despite the jump in the
unemployment rate in the previous years. More than 70% of respondents to the
standard Eurobarometer survey put inflation as the first or second biggest
problem in the early 1980s. This contrasts markedly with the political
importance of inflation prior to that. Though the Eurobarometer does not have
data on inflation aversion, in an analysis of presidential approval ratings and
economic indicators in the period 1969 to 1978, Hibbs and Vasilatos (1981: 52-
3) find that inflation did not have a statistically significant impact whereas the
growth of real income did.
Most of French post-war economic history can be understood as a combination
of rapid, centralized supply side modernization, and a fight against resulting
inflation, either through wage repression (Ross 1982) or through ultimately
self-defeating devaluations (which make exports cheaper while making
imports, in what is a very open economy, more expensive and thus fuel
inflation). This tension came to a head in the social explosion of May 1968
14 See figure 11, http://piketty.pse.ens.fr/files/EU%20Wealth%2023-11-2010.pdf 15 See figure 5, http://piketty.pse.ens.fr/files/EU%20Wealth%2023-11-2010.pdf
Bob Hancké and Tim Vlandas
39
(Howell 1989), which partly modernized the wage-setting system, but also led
to a devaluation of the Franc by more than 10%. The attempt by President De
Gaulle to have his social policies ratified through a referendum backfired and
after the General’s resignation, the 1969 presidential election turned into a
massive defeat for the candidate of the Left, Gaston Defferre, with only 5% of
the vote and shut out of the second round. François Mitterrand took advantage
of this defeat to agglomerate all the Left parties (one of them was called,
somewhat anachronistically in an era of predominantly national politics, the
‘French Section of the Workers’ International’ or SFIO) and founded the Parti
Socialiste (PS), a Left-leaning centre-Left party in 1971.
After president Pompidou’s death in 1974, Mitterrand almost beat the centrist
Giscard d’Estaing in the follow-up election (49% against 51%), and as a result
the Left expected to win a majority in the 1978 parliamentary elections, which
would de facto turn the president into a lame duck. This did not happen, and
the lesson the Left drew was that the election programme required a bit more
of an edge: it accused French capitalism of not being dynamic enough,
producing both uncompetitive industries and high unemployment and
inflation; the answer lay, according to this analysis, in the nationalisation of key
industries and banks, as this was the only way to modernize and prepare them
for increased competition in the Single European Market. Mitterrand, the
candidate of the Left in 1981, won the presidential elections that year, and
immediately embarked on an expansionary programme led by the Parisian
centre, while also introducing decentralized buffering institutions designed to
emulate the German economy (including, importantly, its low-inflation
effects). Labour relations, regional policies and finance were reorganized to
increase innovation, productivity and allocative efficiency and thus reduce the
need for periodic devaluations. These policies failed in many respects (Levy
1999; Hancké 2002: 37-56): neither unions nor employers were able to handle
The Politics of Disinflation
40
the new governance responsibilities handed to them by law, banks were
uneasy leaving the cosy financial shelter offered by the state, and regions
became vacuous extensions of the centre without any of the local dynamism
that decentralisation was supposed to spawn. French capitalism was, so it
seemed, simply not transformable. The government responded to the emerging
crisis by devaluing the Franc in 1982. At the occasion, Finance minister Jacques
Delors pointed out that currency depreciations of this sort needed strong
accompanying measures to assure others, and especially Germany, that France
was serious about containing inflation (Favieu & Martin-Roland 1990: 489). As
things got increasingly worse – both inflation and unemployment rose in 1982
– the Left lost local and regional elections that year. Using data that covers both
Giscard d'Estaing's presidency from October 1974 to May 1981, and the period
under Mitterrand’s first two years of presidency until 1983, Lafay (1984: 345)
shows that inflation seems to have a stable, negative effect on the popularity of
the president. The year 1983 was the year of the second ‘rupture’, with
socialism in one country this time. For a while, the Left of the PS stood its
ground: the Cabinet was, in fact, totally divided between those who wished to
pursue a consistent Keynesian policy of reflation and thus willing to risk
French membership of the European Monetary System (the EMS, the
immediate ancestor of EMU) as a result, and those who considered austerity
and disinflation to be the basis for a sound economic policy that would allow
the Franc to stabilize. By deciding to stay in the EMS, Mitterrand not only tied
the currency to the Deutschmark (thus sacrificing all macroeconomic
adjustment tools), but also imposed a drastic centrally led disinflation
programme (Lordon 1998). Delors relied on the subservience of the Banque de
France to quell sources of inflation in the system (leaving little doubt among
the unions about an appropriate, i.e. disinflationary, wage rate). By the mid-
1980s, as a result, a disinflationary regime had taken root in France, and the
inflation rate fell from 9.5% in 1983 to 3.3 in 1987).
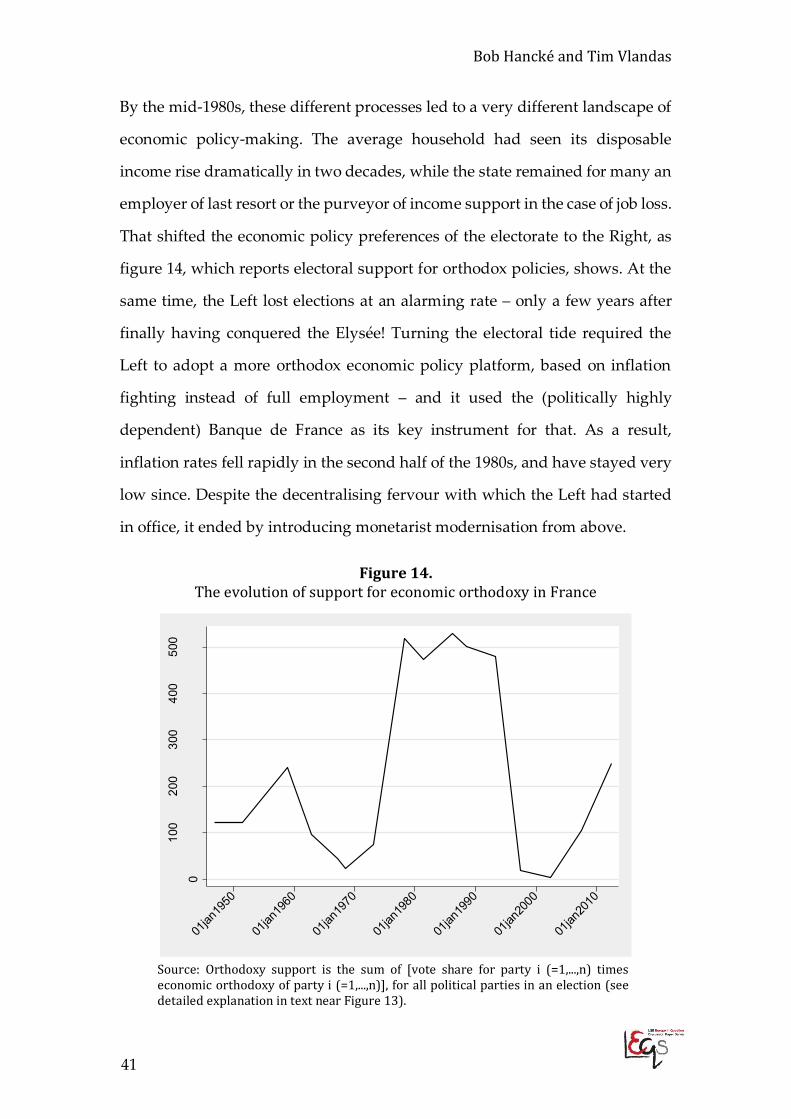
Bob Hancké and Tim Vlandas
41
By the mid-1980s, these different processes led to a very different landscape of
economic policy-making. The average household had seen its disposable
income rise dramatically in two decades, while the state remained for many an
employer of last resort or the purveyor of income support in the case of job loss.
That shifted the economic policy preferences of the electorate to the Right, as
figure 14, which reports electoral support for orthodox policies, shows. At the
same time, the Left lost elections at an alarming rate – only a few years after
finally having conquered the Elysée! Turning the electoral tide required the
Left to adopt a more orthodox economic policy platform, based on inflation
fighting instead of full employment – and it used the (politically highly
dependent) Banque de France as its key instrument for that. As a result,
inflation rates fell rapidly in the second half of the 1980s, and have stayed very
low since. Despite the decentralising fervour with which the Left had started
in office, it ended by introducing monetarist modernisation from above.
Figure 14. The evolution of support for economic orthodoxy in France
Source: Orthodoxy support is the sum of [vote share for party i (=1,...,n) times economic orthodoxy of party i (=1,...,n)], for all political parties in an election (see detailed explanation in text near Figure 13).
0
100
200
300
400
500
Aus
terit
y su
ppor
t
01jan
1950
01jan
1960
01jan
1970
01jan
1980
01jan
1990
01jan
2000
01jan
2010
The Politics of Disinflation
42
Germany: Social-democratic monetarism
Our third case is Germany, the home base of monetarism in Europe. In many
ways, low inflation in Germany may seem impossible to explain – because it is
overdetermined. The policy mix in the larger sense is impressive indeed:
entrenched inflation fears harking back to the twenties, the independent
Bundesbank, the German mark as the symbol of the post-war economic revival,
and the strong interest organizations at the basis of German competitiveness.
Add to that the fact that the social-democratic party, the SPD, had its damascene
conversion as early as 1959 in the Bad Godesberg conference, where it accepted
capitalism as the key organizing economic principle of the country, the absence
of a serious threat on the Left for most of the post-war years, and that the trade
unions are of the ‘responsible’ kind, aware of the macro-economic effects of
their actions, and it would be hard to even begin to imagine high inflation. Yet
the history of disinflation as pursued by the SPD in Germany maps, somewhat
surprisingly perhaps, quite well onto our model.
Despite everything that points in the opposite direction (not least the absence
of a solid Keynesian tradition in German academia; see Allen 1989), the SPD
remained a left-wing, Keynesian-inspired party for most of the 1960s: during
the years in office after 1965 (in the Grand Coalition) and as a senior partner
with the FDP from 1969 to 1982, the party pursued expansive policies where
possible. Left voters in the 1970s attached more importance to unemployment
relative to inflation than conservative voters (Kirchgässner 1991). The
Bundesbank switched to monetary targeting in 1974, but once the trade unions
understood that the central bank would retaliate against inflationary wage
settlements, they moderated wage claims and the Bundesbank relaxed its
stance. In the 1970s, as a result of electoral pressures, the SPD did not move to
the Right (as could have been anticipated), but actually to the Left. After the
1976 election, when the SPD lost almost 10% of its seats, Chancellor Helmut
Bob Hancké and Tim Vlandas
43
Schmidt agreed to a fiscal stimulus package to combat rising unemployment
(Notermans 2000: 177), and at the Bonn summit one year later, Germany even
agreed to be the economic ‘locomotive’ of the world economy in a concerted
fiscal expansion. For most of the 1960s and 1970s, therefore, the SPD remained
a relatively traditional social-democratic party with a Keynesian
macroeconomic orientation – with massive electoral success as a result (gaining
40% or more of the popular vote and for many years between 40 and 47 per cent
of the seats in the lower house).
The fall of the Schmidt government in 1982 heralded a fundamental shift in the
SPD’s approach to macroeconomic policy-making. The 1987 election was fought
on traditional Left-Right terrain, with a large part of the SPD election
programme based on standard wage increases and Keynesian policies for full
employment. The SPD lost the election and in response shed its Keynesian
cloak, emphasizing labour market flexibility and other supply-side measures
(Notermans 2000: 228). This sealed the conversion of the social democrats to
monetarism.
These political developments took place against a background of wide-ranging
yet slow-moving shifts in the economic fortunes of the electorate. Throughout
the 1960s and early 1970s, unemployment remained solidly below 2%, and
while it increased moderately during the remaining part of the 1970s, it was
under 5% – very low by European standards at the time. More importantly,
those in jobs saw their economic security increase significantly: measured as the
OECD employment protection legislation (EPL) index, job security increased
from 1.2 in 1960 to 1.4 in 1970 and 2.9 in 1975 and stayed at that level until the
mid-1980s; union density increased from 32% in 1970 to nearly 35% in 1980; and
wages increased significantly: between 1962 and 1969, for instance, hourly
wages in manufacturing increased by more than 50% (Sutcliffe 1996: 145).
Average annual working hours, in turn, fell almost 25% by 500 hours between
The Politics of Disinflation
44
1950 and 1973 (Sutcliffe 1996: 147). While job security increased, savings shot up
as a result of increased disposable income, and the rate of home ownership
increased significantly from 29% in 1960 to 40% in 1980.
By the early 1980s, the median voter in Germany was, as these figures reflect,
relatively wealthy, relatively secure in his job and could rely on a generous
welfare system if income were to fall as a result of unemployment, health or
retirement. For him, the economic insecurity associated with the end of the war,
reconstruction and the early 1950s was a distant memory by then. Erosion of the
value of their assets through inflation was a far more important problem, and
political parties, even on the Left, rapidly reflected that shift. By the mid-1980s,
with the conversion of the SPD, all parties had become proponents of sound
money policies.
Sweden: Holding the fort
Sweden offers our final case study. The country is interesting for the argument
we are developing here for several reasons. One, it is a standard electoral system
of proportional representation – but one in which one party, the social-
democratic SAP, dominated the political scene for almost all of the post-war era,
often with large pluralities or even absolute parliamentary majorities. And
secondly, despite the general affluence of the population and the political and
institutional orientation towards full employment for most of the post-war
period (levels and growth rates of GDP/cap in PPP terms are among the highest
in the world and unemployment among the lowest), the SAP stubbornly
resisted calls for a more restrictive policy regime until well into the 1980s and
even the early 1990s (Notermans 1993). In other words, while the median voter’s
concrete preoccupations objectively must have shifted to the Right, the
hegemony of the social-democratic party was such that it could trump this and
maintain a growth and full employment oriented regime, at least until the early
Bob Hancké and Tim Vlandas
45
1990s. The case study thus also offers a mirror to our argument about party
competition: when the dual threat of defection by the electorate (and by centrist
parties) to the Right is absent or very weak, social-democratic parties retain
important degrees of autonomy from the shifting preferences of the median
voter.
Let us start the analysis with the evolution of employment security and wealth
of the median voter. Sweden since the Second World War offers an almost
unique combination of several policies and institutions that increased and
stabilised employment security for the bulk of the population at a high level:
the relentless pursuit of full employment, the generalised rise in educational
attainment, the very high union density rates and the strong position of trade
unions in the domestic political economy more generally, the combination of
relatively strong EPL and active retraining policies for the unemployed,
coupled with generous unemployment benefits, and a large public sector as
employer. For any voter who was employed, the potential cost of
unemployment was low: it combined a low risk of unemployment with high
actual income or replacement income. In our E-A model, E was therefore on a
rapid downward trajectory.
Yet despite the dramatic increase in the standard of living during the post-war
boom years – real GDP/cap increased from $6739 (1990 dollars) in 1950 to over
14000 dollars in 1975 (Maddison 2013 database) – few families were able to build
up significant assets because of the high tax rates. Net household savings rates
remained low as a result, at 4.5% of GDP in the 1950s and 2.1% in the 1970s
(Henrekson et al. 1996: 258), and both levels of and growth in home ownership
was and remains low as well (it only increased from about 40% in the 1970s to
about 45% in the 2000s – Nickell 2006). The high tax rate and the redistribution
that followed implied, of course, that the economic security of citizens remained
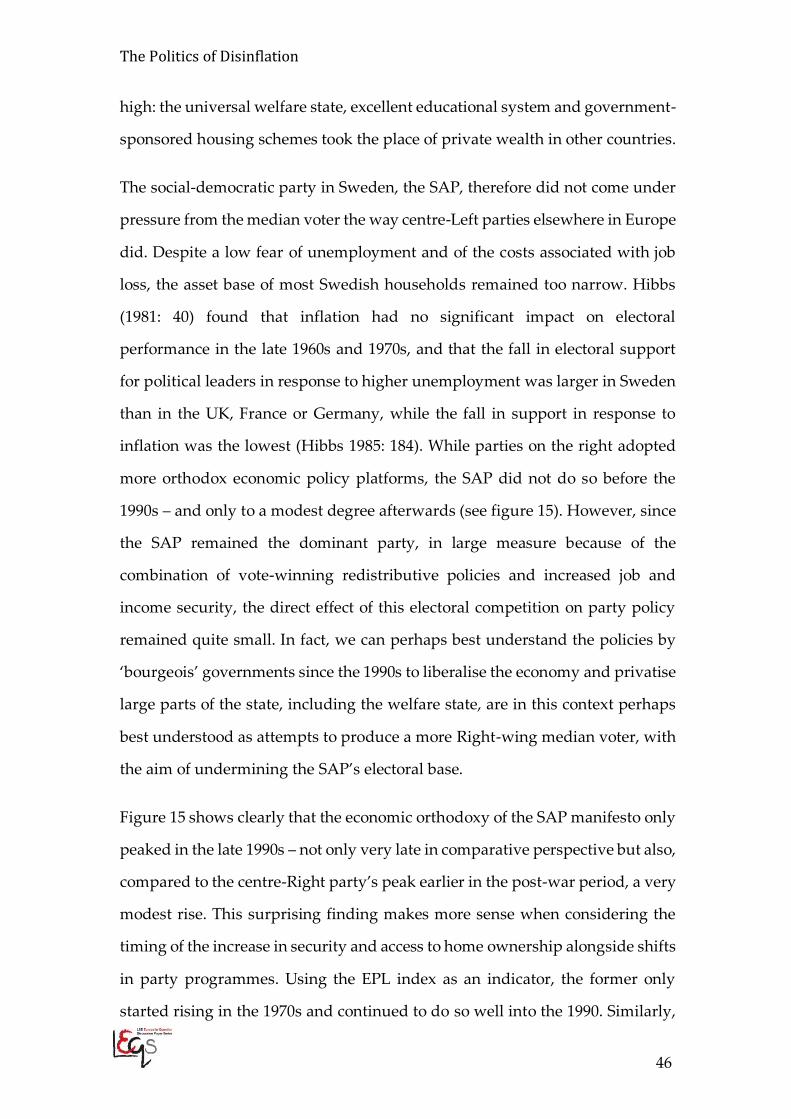
The Politics of Disinflation
46
high: the universal welfare state, excellent educational system and government-
sponsored housing schemes took the place of private wealth in other countries.
The social-democratic party in Sweden, the SAP, therefore did not come under
pressure from the median voter the way centre-Left parties elsewhere in Europe
did. Despite a low fear of unemployment and of the costs associated with job
loss, the asset base of most Swedish households remained too narrow. Hibbs
(1981: 40) found that inflation had no significant impact on electoral
performance in the late 1960s and 1970s, and that the fall in electoral support
for political leaders in response to higher unemployment was larger in Sweden
than in the UK, France or Germany, while the fall in support in response to
inflation was the lowest (Hibbs 1985: 184). While parties on the right adopted
more orthodox economic policy platforms, the SAP did not do so before the
1990s – and only to a modest degree afterwards (see figure 15). However, since
the SAP remained the dominant party, in large measure because of the
combination of vote-winning redistributive policies and increased job and
income security, the direct effect of this electoral competition on party policy
remained quite small. In fact, we can perhaps best understand the policies by
‘bourgeois’ governments since the 1990s to liberalise the economy and privatise
large parts of the state, including the welfare state, are in this context perhaps
best understood as attempts to produce a more Right-wing median voter, with
the aim of undermining the SAP’s electoral base.
Figure 15 shows clearly that the economic orthodoxy of the SAP manifesto only
peaked in the late 1990s – not only very late in comparative perspective but also,
compared to the centre-Right party’s peak earlier in the post-war period, a very
modest rise. This surprising finding makes more sense when considering the
timing of the increase in security and access to home ownership alongside shifts
in party programmes. Using the EPL index as an indicator, the former only
started rising in the 1970s and continued to do so well into the 1990. Similarly,
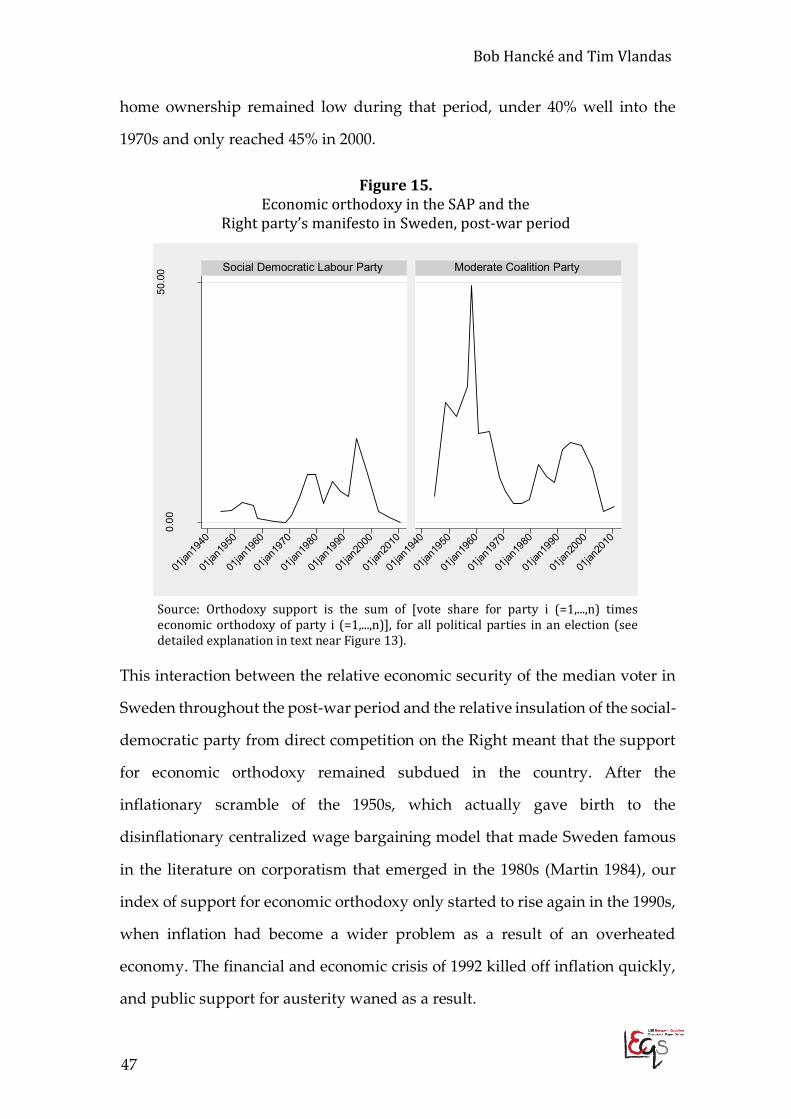
Bob Hancké and Tim Vlandas
47
home ownership remained low during that period, under 40% well into the
1970s and only reached 45% in 2000.
Figure 15. Economic orthodoxy in the SAP and the
Right party’s manifesto in Sweden, post-war period
Source: Orthodoxy support is the sum of [vote share for party i (=1,...,n) times economic orthodoxy of party i (=1,...,n)], for all political parties in an election (see detailed explanation in text near Figure 13).
This interaction between the relative economic security of the median voter in
Sweden throughout the post-war period and the relative insulation of the social-
democratic party from direct competition on the Right meant that the support
for economic orthodoxy remained subdued in the country. After the
inflationary scramble of the 1950s, which actually gave birth to the
disinflationary centralized wage bargaining model that made Sweden famous
in the literature on corporatism that emerged in the 1980s (Martin 1984), our
index of support for economic orthodoxy only started to rise again in the 1990s,
when inflation had become a wider problem as a result of an overheated
economy. The financial and economic crisis of 1992 killed off inflation quickly,
and public support for austerity waned as a result.
0.00
50.0
0
01jan
1940
01jan
1950
01jan
1960
01jan
1970
01jan
1980
01jan
1990
01jan
2000
01jan
2010
01jan
1940
01jan
1950
01jan
1960
01jan
1970
01jan
1980
01jan
1990
01jan
2000
01jan
2010
Social Democratic Labour Party Moderate Coalition Party
Eco
nom
ic o
rthod
oxy
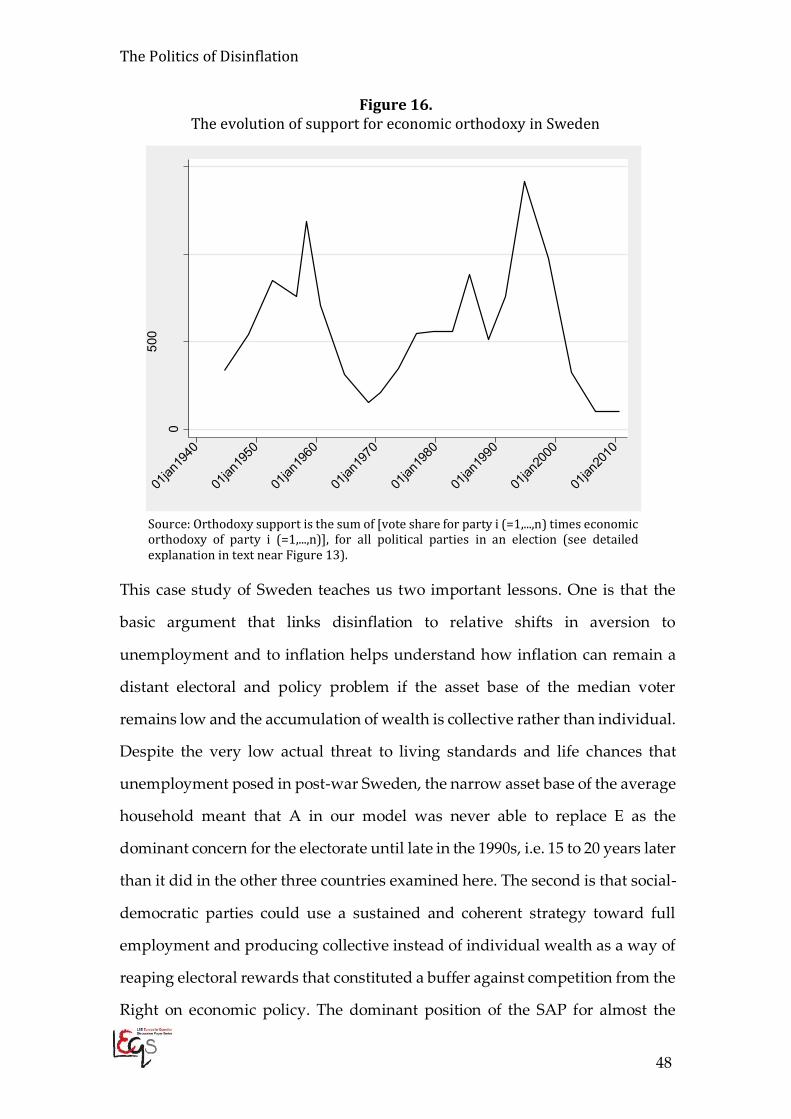
The Politics of Disinflation
48
Figure 16. The evolution of support for economic orthodoxy in Sweden
Source: Orthodoxy support is the sum of [vote share for party i (=1,...,n) times economic orthodoxy of party i (=1,...,n)], for all political parties in an election (see detailed explanation in text near Figure 13).
This case study of Sweden teaches us two important lessons. One is that the
basic argument that links disinflation to relative shifts in aversion to
unemployment and to inflation helps understand how inflation can remain a
distant electoral and policy problem if the asset base of the median voter
remains low and the accumulation of wealth is collective rather than individual.
Despite the very low actual threat to living standards and life chances that
unemployment posed in post-war Sweden, the narrow asset base of the average
household meant that A in our model was never able to replace E as the
dominant concern for the electorate until late in the 1990s, i.e. 15 to 20 years later
than it did in the other three countries examined here. The second is that social-
democratic parties could use a sustained and coherent strategy toward full
employment and producing collective instead of individual wealth as a way of
reaping electoral rewards that constituted a buffer against competition from the
Right on economic policy. The dominant position of the SAP for almost the
0
500
1000
1500
Aus
terit
y su
ppor
t
01jan
1940
01jan
1950
01jan
1960
01jan
1970
01jan
1980
01jan
1990
01jan
2000
01jan
2010
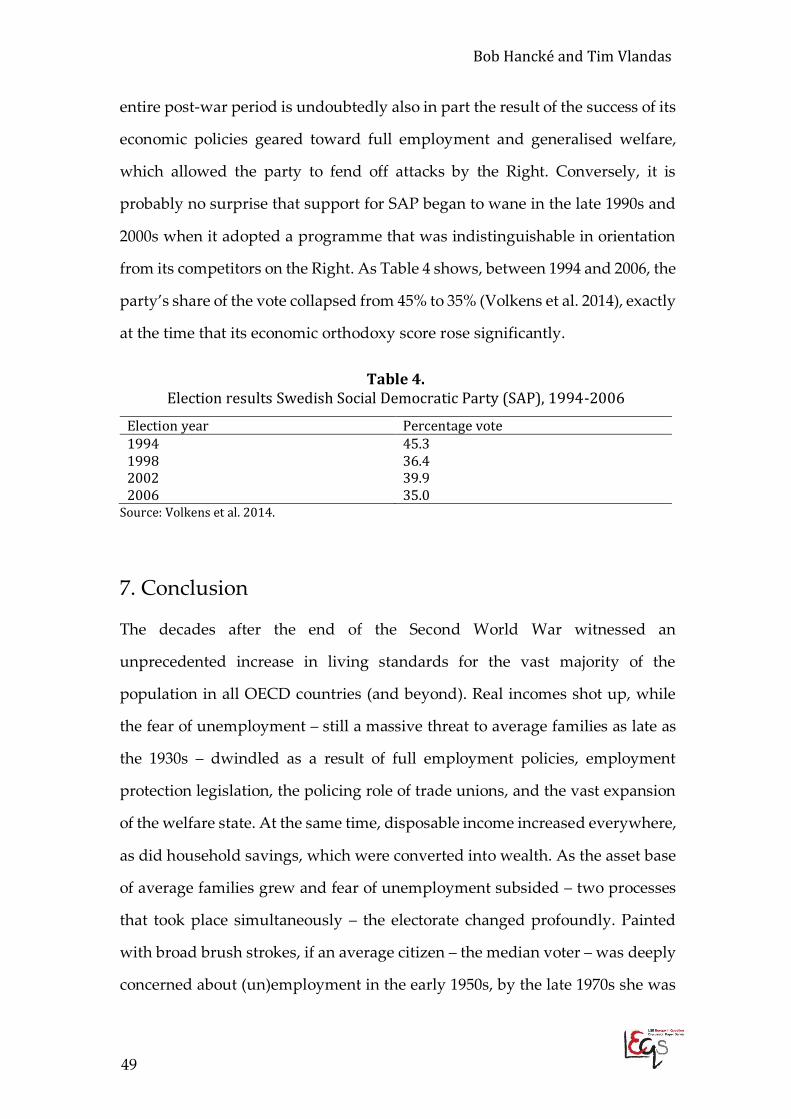
Bob Hancké and Tim Vlandas
49
entire post-war period is undoubtedly also in part the result of the success of its
economic policies geared toward full employment and generalised welfare,
which allowed the party to fend off attacks by the Right. Conversely, it is
probably no surprise that support for SAP began to wane in the late 1990s and
2000s when it adopted a programme that was indistinguishable in orientation
from its competitors on the Right. As Table 4 shows, between 1994 and 2006, the
party’s share of the vote collapsed from 45% to 35% (Volkens et al. 2014), exactly
at the time that its economic orthodoxy score rose significantly.
Table 4. Election results Swedish Social Democratic Party (SAP), 1994-2006
Election year Percentage vote 1994 45.3 1998 36.4 2002 39.9 2006 35.0
Source: Volkens et al. 2014.
7. Conclusion
The decades after the end of the Second World War witnessed an
unprecedented increase in living standards for the vast majority of the
population in all OECD countries (and beyond). Real incomes shot up, while
the fear of unemployment – still a massive threat to average families as late as
the 1930s – dwindled as a result of full employment policies, employment
protection legislation, the policing role of trade unions, and the vast expansion
of the welfare state. At the same time, disposable income increased everywhere,
as did household savings, which were converted into wealth. As the asset base
of average families grew and fear of unemployment subsided – two processes
that took place simultaneously – the electorate changed profoundly. Painted
with broad brush strokes, if an average citizen – the median voter – was deeply
concerned about (un)employment in the early 1950s, by the late 1970s she was
The Politics of Disinflation
50
at least as much and possibly more concerned with rising inflation, which was
eroding the value of the assets she had accumulated.
That rightward shift of the median voter was reflected in the economic policies
adopted by the main parties. While both the centre-Left and the centre-Right
were full-employment oriented in the early 1960s, by the mid-1970s, the centre-
Left was usually alone in that position. Electoral competition – elections are won
in the centre, wherever that may move – forced social-democratic parties to the
Right, and by the late 1980s most centre-Left parties had adopted more
orthodox economic policy platforms, revolving around ‘sound money’ policies
(cf. Przeworski & Sprague 1988). As a result of this shift, disinflation became
entrenched across the political spectrum, control of inflation had become the
primary policy goal, institutionalised in independent, conservative central
banks, and inflation rates fell sharply everywhere and remained low since the
early 1990s.
Our findings imply, therefore, that it is not because other parties had adopted
the correct macro-economic policies in the past, as the combination of ideational
and new-classically orthodox arguments suggests, that social-democratic
parties moved to follow them (the effects of these policies remain a topic for
debate, not least since economic growth rates have been lower since the
generalised introduction of more restrictive macro-economic policies – cf. Glyn
2006), but because of party competition against the background of a changing
electorate in terms of economic security. In sum, this argument allows us to
understand the general adoption of monetarist policies throughout the OECD,
as we set out to do.
Finally, two points for further research beyond the few remarks on that earlier
in this paper. One, our argument turns much of the conventional wisdom in this
area on its head. Both Keynesian and Kaleckian approaches in political
Bob Hancké and Tim Vlandas
51
economy, as well as models derived from those, assume or imply a Phillips-
curve inspired inverse relationship between full employment and inflation. Put
simply, if unemployment falls to very low levels, the bargaining power of
workers increases and wages rise; employers pass on these cost increases to
consumers as price hikes. These then feed back into wage negotiations as cost-
of-living adjustment and inflation begins to rise without an institutional check
(see Carlin & Soskice 2006: 27-202 for the clearest version of the argument as a
whole). We think that the relation between unemployment and inflation is more
dynamic: the bargaining power of workers may have this effect, but only up to
the point where the average worker, who we assume also to be (close to) the
median voter, has accumulated assets that forces him to fear inflation more than
threats to his employment status. What we need to specify here are the extra
conditions that our model introduces and which have the effect of turning the
Phillips curve-inspired theories on their head.
Secondly, governments are exposed to many different pressures when they
make decisions about policies to pursue. Among those are international
contexts that might, and often do, limit their autonomy, new ideas about
policies, and domestic partisan politics. Our paper does not claim that the latter
is all that mattered; but it does point out that ignoring it leaves a big hole in our
understanding of the Great Moderation and especially in our understanding of
the political origins of the Great Moderation. The quasi-monopolisation of the
debate on the causes of disinflation by economists (and by political scientists
who only pay attention to economic variables) has made political scientists and
political economists shy of wading into that debate. Our paper, so we hope, is a
way to reopen this discussion on the politics of economic policies, including
their slow-moving, long-term effects. The economy is, after all, far too serious
to be left to economists.
The Politics of Disinflation
52
References
Allard, Gayle (2005). “Measuring Job Security Over Time: In Search of a Historical Indicator”, Instituto de Empresa Working Paper WP05-17. URL: http://latienda.ie.edu/working_papers_economia/WP05-17.pdf.
Allen, Christopher S. (1989). “The Underdevelopment of Keynesianism in the Federal Republic of Germany”, pp. 263-289 in Peter Hall (ed.) The Political Power of Economic Ideas: Keynesianism across Nations. Princeton, NJ: Princeton University Press.
Armingeon, Klaus, Christian Isler, Laura Knöpfel, David Weisstanner and Sarah Engler (2015). Comparative Political Data Set 1960-2013. Bern: Institute of Political Science, University of Bern.
Avdagic, Sabina (2013). “Partisanship, political constraints and employment protection reforms in an era of austerity”, European Political Science Review 5(3): 431-55.
Barro, Roberto J. and David B. Gordon (1983). “A positive theory of monetary policy in a natural rate model”, The Journal of Political Economy 91(4): 589-610.
Boix, Charles (2000). “Partisan Governments, the International Economy and Macroeconomic Policies in OECD Countries, 1964-93”, World Politics 53: 38-73.
Brenner, Robert (2000). “The boob and the bubble”, The New Left Review 6: 4-44.
Brown, Arthur J. and Jane Darby (1985). World Inflation Since 1950: An International Comparative Study. Cambridge: Cambridge University Press.
Carlin, Wendy and David Soskice (1990). Macroeconomics and the Wage Bargain: A modern approach to unemployment, inflation and the exchange rate. Oxford: Oxford University press.
Carlin, Wendy and David Soskice (2006). Macroeconomics: Imperfections, Institutions and Policies. Oxford: Oxford University Press.
Clarke, Harold D. (1986). “Politics, economics and party popularity in Britain, 1979–83”, Electoral Studies 5(2): 123-141.
Crouch, Colin (2009). “Privatised Keynesianism: An unacknowledged policy regime.” British Journal of Politics and International Relations 11(3): 382-99.
Cukierman, Alex, Steven B. Webb and Bilin Neyapti (1992). “Measuring the independence of central banks and its effect on policy outcomes”, The World Bank Economic Review 6(3): 353-398.
Davis, Morris A. (2012). “Questioning Homeownership as a Public Policy Goal”, Cato Institute Policy Analysis No. 696. URL: http://object.cato.org/sites/cato.org/files/pubs/pdf/PA696.pdf.
De Neve, Jan‐Emmanuel (2009). The Median Voter Data Set: Voter Preferences across 50 Democracies from 1945. Available at SSRN: http://ssrn.com/abstract=1348323 or http://dx.doi.org/10.2139/ssrn.1348323
Emmenegger, Patrick, Silja Hausermann, Bruno Palier and Martin Seeleib- Kaiser (2012). The Age of Dualization. The Changing Face of Inequality in Deindustrializing Societies. Oxford: OUP.
Eurobarometer (2005). The Mannheim Eurobarometer Trend File 1970 – 2002. Data Set Edition v2.0.1. Codebook and Unweighted Frequency Distributions updated by Iris Leim and Meinhard Moschner, ZA, Cologne. January 20, 2005. (codebook update as of June 17, 2009). By Hermann Schmitt, MZES Mannheim, Evi Scholz ZUMA Mannheim.
Bob Hancké and Tim Vlandas
53
Favieu, Pierre and Michel Martin-Roland (1990). La décennie Mitterrand: Les ruptures 1981-1984. Paris: Seuil.
Fischer, Stanley and John Huizinga (1980). “Inflation, unemployment and public opinion polls”, MIT Working Paper No. 256, April 1980.
Flora, Peter (1986). Growth to Limits: The Western European Welfare States since World War II. Berlin; New York: De Gruyter.
Fourastié, Jean (1979). Les trente glorieuses: ou La Révolution invisible de 1946 à 1975. Paris: Fayard.
Glyn, Andrew (2006). Capitalism Unleashed. Oxford: Oxford University Press.
Hirsch, Fred and John H. Goldthorope (1978). The political economy of inflation. London: Martin Robertson.
Hall, Peter (1989). The Economic Power of Political Ideas. Princeton University Press.
Hall, Peter (2007). “The Evolution of Varieties of Capitalism in Europe”, pp.39-88 in Bob Hancké, Martin Rhodes & Mark Thatcher (eds.), Beyond Varieties of Capitalism: Conflict, Contradictions and Complementarities in the European Economy. Oxford University Press.
Hancké, Bob (2002). Large Firms and Institutional Change: Industrial Renewal and Economic Restructuring in France. Oxford: Oxford University Press.
Henrekson, Magnus, Lars Jonung and Joakim Stymne (1996). “Economic Growth and the Swedish Model”, pp. 240-89 in Nicholas Crafts and Gianni Toniolo (2002). Economic Growth in Europe Since 1945. Cambridge University Press.
Hibbs, Douglas (1977). “Political Parties and Macroeconomic Policy,” The American Political Science Review 71(4): 1467-1487.
Hibbs, Douglas (1981). “The Impact of Economic Performance on Electoral Support in Sweden, 1967-1978”. Scandinavian Political Studies 4(1): 33-50.
Hibbs, Douglas (1982). “Public Concern about Inflation and Unemployment in the United States: Trends, Correlates, and Political Implications”, National Bureau of Economic Research. URL: http://www.nber.org/chapters/c11460.
Hibbs, Douglas (1985). “Inflation, Political Support, and Macroeconomic Policy”, pp. 175-195 in Leon N. Lindberg and Charles S. Maier (eds.) The Politics of Inflation and Economic Stagnation. Washington, D.C.: The Brookings Institution.
Hibbs, Douglas and Nicholas Vasilatos (1981). “Performance economique et fonction de popularite des presidents Pompidou et Giscard D'estaing”, Revue d'economie politique 93(1): 44-61.
Horsewood, Nicholas and Kees Dol (2013). “Home ownership, mobility and unemployment: a re-evaluation of the Oswald thesis”, Neujobs Working Paper No.14.3a. URL: http://www.neujobs.eu/sites/default/files/NEUJOBS%2014%203a%20Home%20ownership%20and%20Unemployment%20_final_.pdf
Howell, Chris (1989). Regulating Labour: The State and Industrial Relations Reform in Postwar France. Princeton NJ: Princeton University Press.
Iversen, Torben and David Soskice (2006). “New Macroeconomics and Political Science”, Annual Review of Political Science 9: 425-53.
The Politics of Disinflation
54
Katz, Harry C., Sarosh Kuruvilla and Lowell Turner (1993). “Trade Unions and Collective Bargaining”, Working Paper Series 1099. The World Bank, Education and Social Policy Department.
Kirchgässner, Gebhard (1991). “On the Relation Between Voting Intention and the Perception of the General Economic Situation: An Empirical Analysis for the Federal Republic of Germany, 1972 –1986.” European Journal of Political Economy 7(4): 497-526.
Kramper, Peter (2000). From Economic Convergence to Convergence in Affluence? Income Growth, Household Expenditure and the Rise of Mass Consumption in Britain and West Germany, 1950-1974. London: Department of Economic History, London School of Economics. URL: http://eprints.lse.ac.uk/22382/1/wp56.pdf
Lafay, Jean-Dominique (1984). “Political Change and Stability of the Popularity Function: The French General Election of 1981”, Political Behavior 6(4): 333-352.
Levy, Jonah (1999). Tocqueville’s Revenge. Cambridge, MA: Harvard University Press.
Lordon, Frédéric (1998). “The Logic and Limits of Désinflation Compétitive”, Oxford Review of Economic Policy 14(1): 96-113.
Maddison, Angus (2001). The World Economy. A Millennial Perspective. Paris: OECD, Development Centre Studies.
Maddison, Angus (2013). The Maddison-Project. URL: http://www.ggdc.net/maddison/maddison-project/home.htm, 2013 version.
Martin, Andrew (1984). “Trade Unions in Sweden. Strategic Responses to Change and Crisis.” pp. 190-359 in Peter Gourevitch, Andrew Martin, George Ross, Stephen Bornstein, Andrei Markovits and Christopher Allen (eds.), Unions and Economic Crisis. Britain, West Germany, and Sweden. London: George Allen & Unwin.
McNamara, Kathleen (1998). The Currency of Ideas. Ithaca NY: Cornell University Press.
Nickell, William (2006). “The CEP-OECD institutions data set (1960-2004)”, CEPDP 759. London: Centre for Economic Performance, London School of Economics and Political Science, ISBN 0753020653.
Notermans, Ton (1993). “The Abdication from National Policy Autonomy: Why the macroeconomic regime has become so Unfavourable to Labor”, Politics and Society 21(2): 133-67.
Notermans, Ton (2000). Money, Markets and the State. Cambridge: Cambridge University Press.
OECD (2001). The Well-being of Nations: The Role of Human and Social Capital. Education and Skills. Centre for Educational Research and Innovation. URL: http://www.oecd.org/site/worldforum/33703702.pdf
OECD (2016). Inflation (CPI). OECD Data. URL: https://data.oecd.org/price/inflation-cpi.htm.
Przeworski, Adam and John Sprague (1988). Paper Stones: A History of Electoral Socialism. Chicago: University of Chicago Press
Rehm, Philip (2016). Risk Inequality and Welfare States. Social Policy Preferences, Development, and Dynamics. Cambridge: Cambridge University Press.
Ross, George (1982). “The Perils of Politics: French Unions and the Crisis of the 1970s.” pp. 13-94 in Peter Lange, George Ross and Maurizio Vannicelli (eds.), Unions, Change and Crisis: French and Italian Union Strategy and the Political Economy, 1945-1980. London: George Allen & Unwin.
Bob Hancké and Tim Vlandas
55
Rueda, David (2007). Social Democracy Inside Out: Partisanship and Labor Market Policy in Industrialized Democracies. Oxford; New York: OUP.
Sbano, Teresa (2008). “New historical data for assets and liabilities in the UK”, Economic & Labour Market Review (2)4: 40-6.
Scheve, Kenneth (2002). “Public Demand for Low Inflation”, Bank of England and Yale University Working Paper No. 172. New Haven, CT: Yale University.
Scheve, Kenneth (2004). “Public Inflation Aversion and the Political Economy of Macroeconomic Policymaking”, International Organisation 58(1): 1-34.
Smith, Tom (1980). “America's Most Important Problem. A Trend Analysis, 1946-1976”, Public Opinion Quarterly 44(2): 164-80.
Sutcliffe, Anthony (1996). An Economic and Social History of Western Europe Since 1945. London and New York: Longman.
Visser, Jelle (2013). “Wage Bargaining Institutions. From Crisis to Crisis”, European Economy Economic Papers 488. Brussels: European Commission. URL: http://ec.europa.eu/economy_finance/publications/economic_paper/2013/pdf/ecp488_en.pdf.
Vlandas, Tim (2013). “The politics of temporary work deregulation in Europe: solving the French puzzle”, Politics and Society 41(3): 425-460.
Vlandas, Tim (2017). “Grey Power and the Economy: Ageing and Inflation across Advanced Economies”, Comparative Political Studies. Forthcoming.
Volkens, Andrea, Pola Lehmann, Nicolas Merz, Sven Regel, Annika Werner, Lacewell Onawa Promise and Henrike Schultze (2014). The Manifesto Data Collection. Manifesto Project (MRG / CMP / MARPOR). Version 2014b. Berlin: Wissenschaftszentrum Berlin für Sozialforschung (WZB).
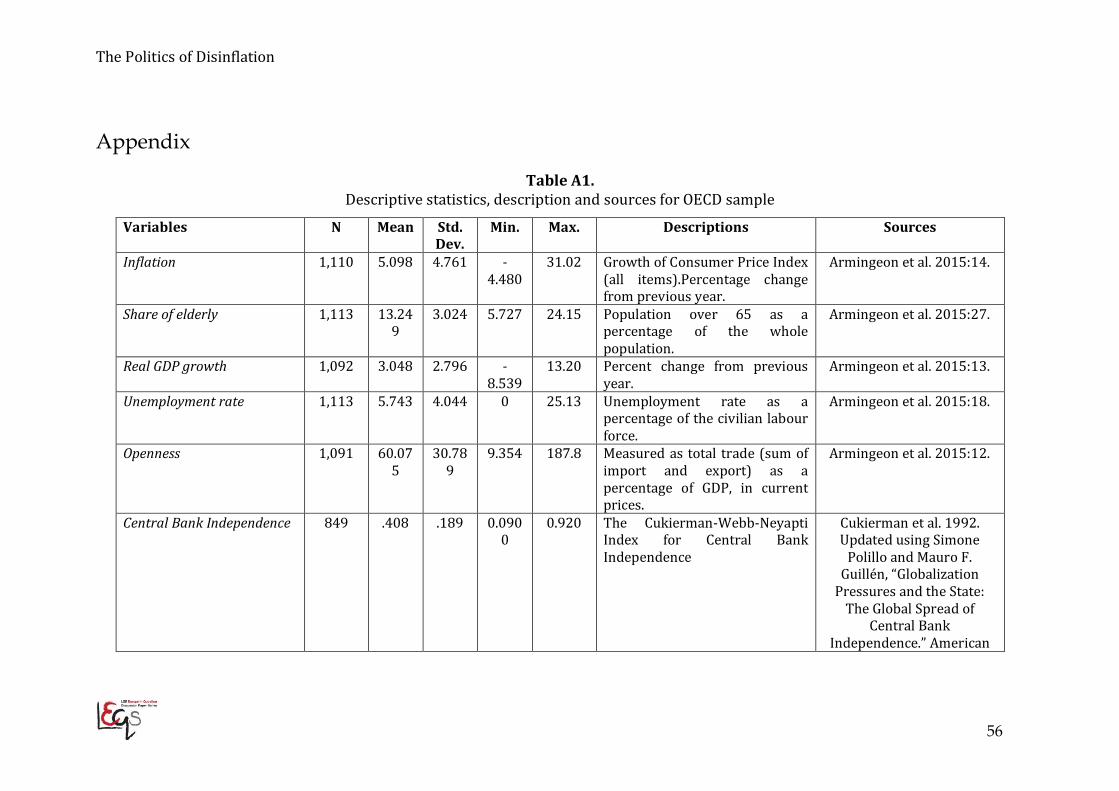
The Politics of Disinflation
56
Appendix
Table A1. Descriptive statistics, description and sources for OECD sample
Variables N Mean Std. Dev.
Min. Max. Descriptions Sources
Inflation 1,110 5.098 4.761 -4.480
31.02 Growth of Consumer Price Index (all items).Percentage change from previous year.
Armingeon et al. 2015:14.
Share of elderly 1,113 13.249
3.024 5.727 24.15 Population over 65 as a percentage of the whole population.
Armingeon et al. 2015:27.
Real GDP growth 1,092 3.048 2.796 -8.539
13.20 Percent change from previous year.
Armingeon et al. 2015:13.
Unemployment rate 1,113 5.743 4.044 0 25.13 Unemployment rate as a percentage of the civilian labour force.
Armingeon et al. 2015:18.
Openness 1,091 60.075
30.789
9.354 187.8 Measured as total trade (sum of import and export) as a percentage of GDP, in current prices.
Armingeon et al. 2015:12.
Central Bank Independence 849 .408 .189 0.0900
0.920 The Cukierman-Webb-Neyapti Index for Central Bank Independence
Cukierman et al. 1992. Updated using Simone
Polillo and Mauro F. Guillén, “Globalization
Pressures and the State: The Global Spread of
Central Bank Independence.” American
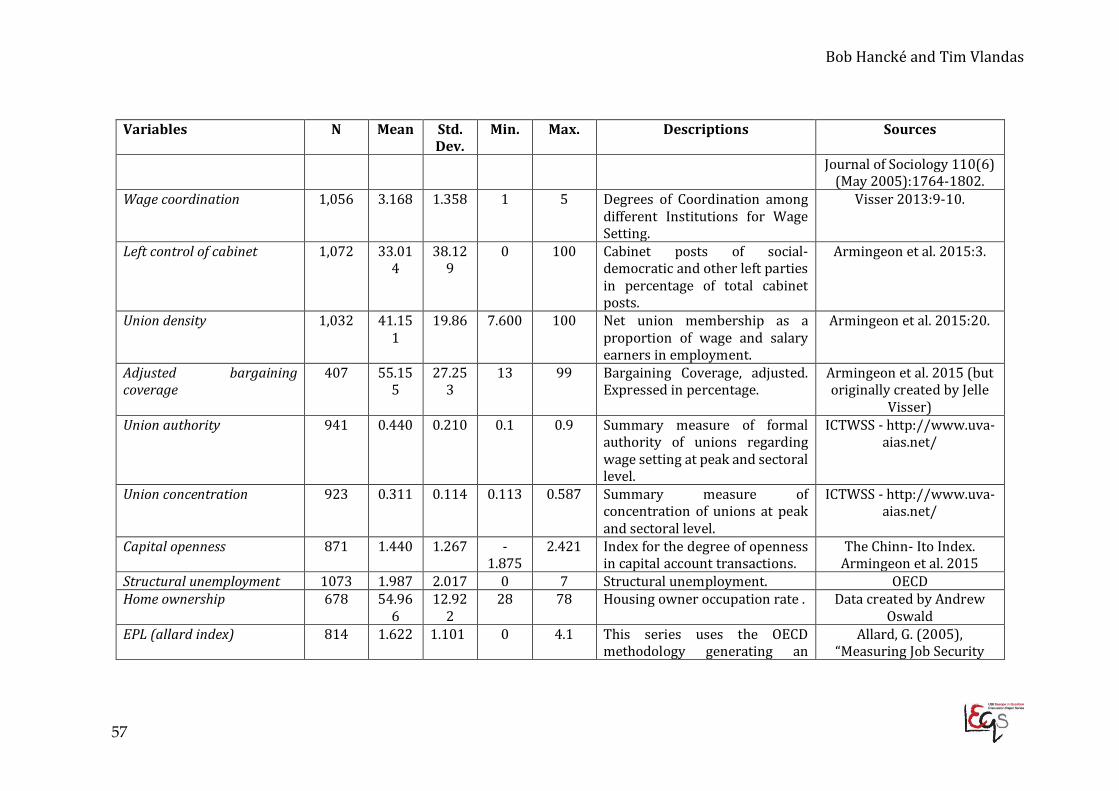
Bob Hancké and Tim Vlandas
57
Variables N Mean Std. Dev.
Min. Max. Descriptions Sources
Journal of Sociology 110(6) (May 2005):1764-1802.
Wage coordination 1,056 3.168 1.358 1 5 Degrees of Coordination among different Institutions for Wage Setting.
Visser 2013:9-10.
Left control of cabinet 1,072 33.014
38.129
0 100 Cabinet posts of social-democratic and other left parties in percentage of total cabinet posts.
Armingeon et al. 2015:3.
Union density 1,032 41.151
19.86 7.600 100 Net union membership as a proportion of wage and salary earners in employment.
Armingeon et al. 2015:20.
Adjusted bargaining coverage
407 55.155
27.253
13 99 Bargaining Coverage, adjusted. Expressed in percentage.
Armingeon et al. 2015 (but originally created by Jelle
Visser) Union authority 941 0.440 0.210 0.1 0.9 Summary measure of formal
authority of unions regarding wage setting at peak and sectoral level.
ICTWSS - http://www.uva-aias.net/
Union concentration 923 0.311 0.114 0.113 0.587 Summary measure of concentration of unions at peak and sectoral level.
ICTWSS - http://www.uva-aias.net/
Capital openness 871 1.440 1.267 -1.875
2.421 Index for the degree of openness in capital account transactions.
The Chinn- Ito Index. Armingeon et al. 2015
Structural unemployment 1073 1.987 2.017 0 7 Structural unemployment. OECD Home ownership 678 54.96
6 12.92
2 28 78 Housing owner occupation rate . Data created by Andrew
Oswald EPL (allard index) 814 1.622 1.101 0 4.1 This series uses the OECD
methodology generating an Allard, G. (2005),
“Measuring Job Security
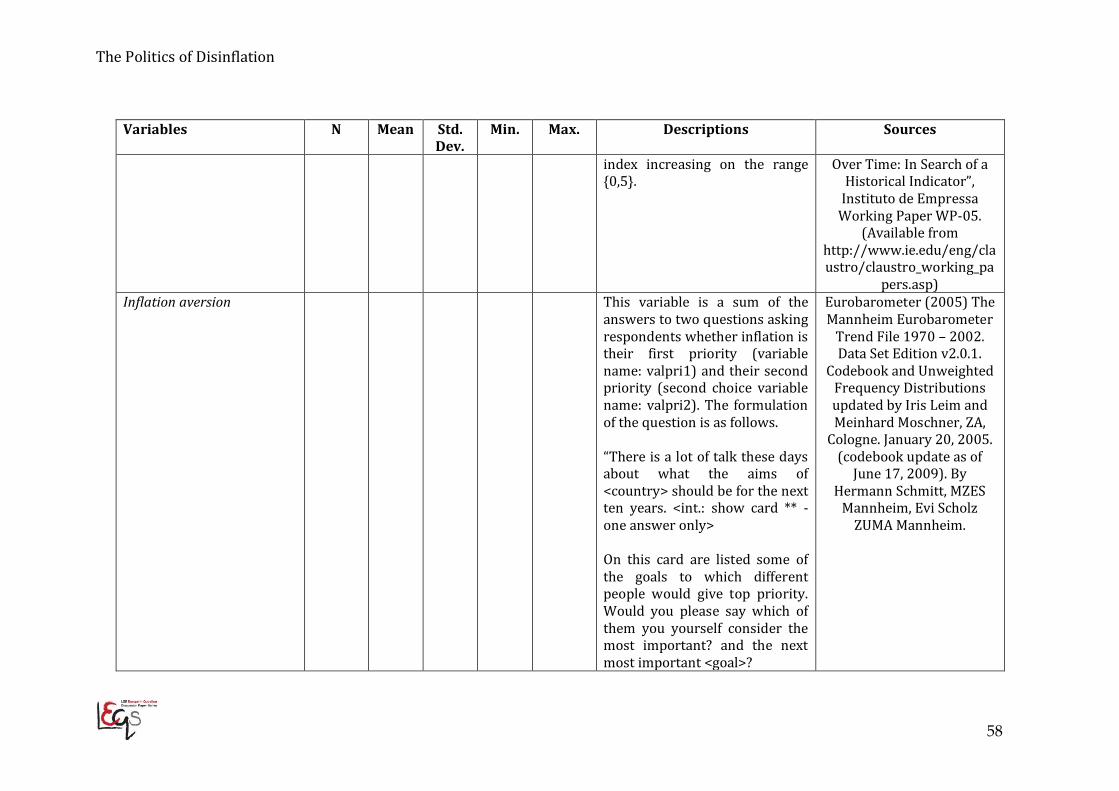
The Politics of Disinflation
58
Variables N Mean Std. Dev.
Min. Max. Descriptions Sources
index increasing on the range {0,5}.
Over Time: In Search of a Historical Indicator”,
Instituto de Empressa Working Paper WP-05.
(Available from http://www.ie.edu/eng/claustro/claustro_working_pa
pers.asp) Inflation aversion This variable is a sum of the
answers to two questions asking respondents whether inflation is their first priority (variable name: valpri1) and their second priority (second choice variable name: valpri2). The formulation of the question is as follows. “There is a lot of talk these days about what the aims of <country> should be for the next ten years. <int.: show card ** - one answer only> On this card are listed some of the goals to which different people would give top priority. Would you please say which of them you yourself consider the most important? and the next most important <goal>?
Eurobarometer (2005) The Mannheim Eurobarometer
Trend File 1970 – 2002. Data Set Edition v2.0.1.
Codebook and Unweighted Frequency Distributions updated by Iris Leim and Meinhard Moschner, ZA,
Cologne. January 20, 2005. (codebook update as of
June 17, 2009). By Hermann Schmitt, MZES
Mannheim, Evi Scholz ZUMA Mannheim.

Bob Hancké and Tim Vlandas
59
Variables N Mean Std. Dev.
Min. Max. Descriptions Sources
1. maintenance of law and order 2. giving the people more say in government decisions 3. fighting rising prices 4. protecting freedom of expression 103 8. dk, na 9. inap104
Economic orthodoxy Economic Orthodoxy Need for economically healthy government policy making. May include calls for: • Reduction of budget deficits; • Retrenchment in crisis; • Thrift and savings in the face of economic hardship; • Support for traditional economic institutions such as stock market and banking system; • Support for strong currency.
Volkens, Andrea / Lehmann, Pola / Merz, Nicolas / Regel, Sven / Werner, Annika with
Lacewell Onawa Promise / Schultze, Henrike (2014):
The Manifesto Data Collection. Manifesto Project (MRG / CMP /
MARPOR). Version 2014b. Berlin:
Wissenschaftszentrum Berlin für Sozialforschung
(WZB).
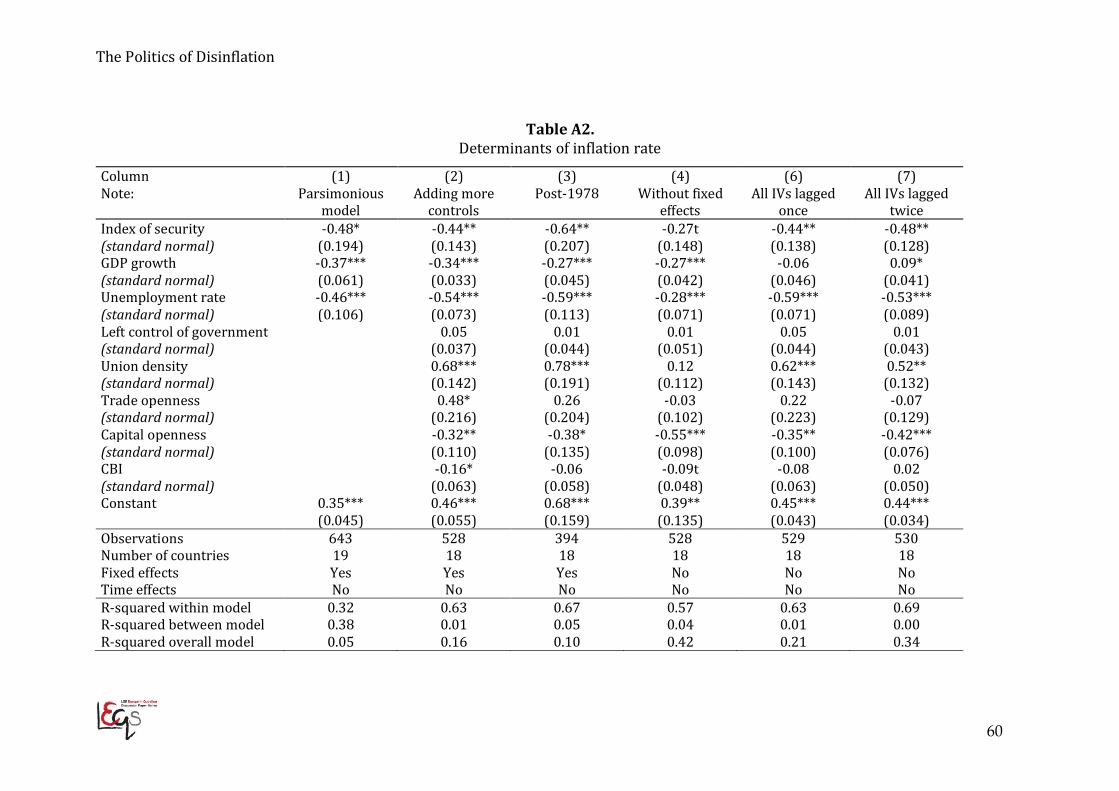
The Politics of Disinflation
60
Table A2. Determinants of inflation rate
Column (1) (2) (3) (4) (6) (7) Note: Parsimonious
model Adding more
controls Post-1978 Without fixed
effects All IVs lagged
once All IVs lagged
twice Index of security -0.48* -0.44** -0.64** -0.27t -0.44** -0.48** (standard normal) (0.194) (0.143) (0.207) (0.148) (0.138) (0.128) GDP growth -0.37*** -0.34*** -0.27*** -0.27*** -0.06 0.09* (standard normal) (0.061) (0.033) (0.045) (0.042) (0.046) (0.041) Unemployment rate -0.46*** -0.54*** -0.59*** -0.28*** -0.59*** -0.53*** (standard normal) (0.106) (0.073) (0.113) (0.071) (0.071) (0.089) Left control of government 0.05 0.01 0.01 0.05 0.01 (standard normal) (0.037) (0.044) (0.051) (0.044) (0.043) Union density 0.68*** 0.78*** 0.12 0.62*** 0.52** (standard normal) (0.142) (0.191) (0.112) (0.143) (0.132) Trade openness 0.48* 0.26 -0.03 0.22 -0.07 (standard normal) (0.216) (0.204) (0.102) (0.223) (0.129) Capital openness -0.32** -0.38* -0.55*** -0.35** -0.42*** (standard normal) (0.110) (0.135) (0.098) (0.100) (0.076) CBI -0.16* -0.06 -0.09t -0.08 0.02 (standard normal) (0.063) (0.058) (0.048) (0.063) (0.050) Constant 0.35*** 0.46*** 0.68*** 0.39** 0.45*** 0.44*** (0.045) (0.055) (0.159) (0.135) (0.043) (0.034) Observations 643 528 394 528 529 530 Number of countries 19 18 18 18 18 18 Fixed effects Yes Yes Yes No No No Time effects No No No No No No R-squared within model 0.32 0.63 0.67 0.57 0.63 0.69 R-squared between model 0.38 0.01 0.05 0.04 0.01 0.00 R-squared overall model 0.05 0.16 0.10 0.42 0.21 0.34
Bob Hancké and Tim Vlandas
Recent LEQS papers White, Jonathan “Between Rules and Discretion: Thoughts on Ordo-liberalism” LEQS Paper No. 126,
November 2017 Costa Font, Joan & Zigante, Valentina “Building ‘Implicit Partnerships’? Financial Long Term Care
Entitlements in Europe” LEQS Paper No. 125, October 2017 Bohle, Dorothee “Mortgaging Europe's periphery” LEQS Paper No. 124, September 2017 Iordanoglou, Chrysafis & Matsaganis, Manos “Why Grexit cannot save Greece (but staying in the Euro
area might)” LEQS Paper No. 123, August 2017 Saka, Orkun “'Domestic banks as lightning rods? Home bias during the Eurozone crisis” LEQS Paper No.
122, February 2017 Coulter, Steve “Signalling Moderation: UK Trade Unions, ‘New Labour’ and the Single Currency” LEQS
Paper No. 121, December 2016 Di Cataldo, Marco “Gaining and losing EU Objective 1 funds: Regional development in Britain and the
prospect of Brexit” LEQS Paper No. 120, November 2016 Avlijas, Sonja “Vicious and virtuous cycles of female labour force participation in post-socialist Eastern
Europe” LEQS Paper No. 119, November 2016 Crescenzi, Riccardo & Iammarino, Simona. “Global Investments and Regional Development Trajectories:
the Missing Links” LEQS Paper No. 118, October 2016 Teasdale, Anthony. “The Fouchet Plan: De Gaulle’s Intergovernmental Design for Europe” LEQS Paper
No. 117, October 2016 Campos, Nauro F. & Macchiarelli, Corrado. “Core and Periphery in the European Monetary Union:
Bayoumi and Eichengreen 25 Years Later” LEQS Paper No. 116, September 2016 Foresti, Pasquale & Napolitano, Oreste. “On the Stock Markets’ Reactions to Taxation and Public
Expenditure” LEQS Paper No. 115, September 2016 Gelepithis, Margarita. “Rethinking the paradox of redistribution: how private insurance and means
testing can lead to universalizing reform” LEQS Paper No. 114, July 2016 Costa-Font, Joan & Turati, Gilberto. “Regional Health Care Decentralization in Unitary States: Equal
Spending, Equal Satisfaction?” LEQS Paper No. 113, June 2016 Bilgel, Fırat & Can Karahasan, Burhan. “Thirty Years of Conflict and Economic Growth in Turkey: A
Synthetic Control Approach” LEQS Paper No. 112, June 2016 Kochenov, Dimitry. “EU Citizenship and Withdrawals from the Union. How Inevitable Is the Radical
Downgrading of Rights?” LEQS Paper No. 111, June 2016 Marzinotto, Benedicta. “Income Inequality and Macroeconomic Imbalances under EMU” Paper No. 110,
May 2016 Luca, Davide. “Do bureaucracies enhance or constrain policy effectiveness? Evidence from Turkey’s
central management of public investment” Paper No. 109, April 2016
Bob Hancké and Tim Vlandas
57
LEQS European Institute London School of Economics Houghton Street WC2A 2AE London Email: [email protected] http://www2.lse.ac.uk/europeanInstitute/LEQS/Home.aspx