lse research articles online - connecting repositories · 2012-12-11 · rafael gomez, morley...
TRANSCRIPT

LSE Research Articles Online
The desire for unionisation amongst
youth and adults in Canada
Rafael Gomez, Morley Gunderson and Noah Meltz
Articles available via LSE Research Articles Online are protected under intellectual property law, including copyright law. Any use made of the contents should comply with the relevant law Cite this version: Gomez, R., Gunderson, M., Meltz, N. (2002). The desire for unionisation amongst youth and adults in Canada. London: LSE Research Articles Online. Available at: http://eprints.lse.ac.uk/archive/00000363/ This is an electronic version of an Article published in the British Journal of Industrial Relations 40 (3) pp. 521-542 © 2002 Blackwell Publishing. http://dx.doi.org/10.1111/1467-8543.00245
http://eprints.lse.ac.uk Contact LSE Research Articles Online at: [email protected]

THE DESIRE FOR UNIONISATION AMONGST YOUTH AND ADULTS IN CANADA
Rafael Gomez, Morley Gunderson and Noah Meltz Rafael Gomez is at the London School of Economics and Morley Gunderson is the CIBC Professor of Youth Employment at the University of Toronto. At the time this paper was written, Noah Meltz -- a former Director and Research Associate of the Centre for Industrial Relations of the University of Toronto and a Professor Emeritus at that University -- was at Netanya Academic College in Israel. Editors’ note: On January 29, 2002, Noah Meltz died in Jerusalem. The editors of this special edition and of the BJIR would like to recognise his contribution to both the conference from which the papers for this special edition were selected and to the journal as a referee over many years, as well as his immense influence on Canadian Industrial Relations. The conference was organised to mark his retirement from the University of Toronto. Authors’ note: It has been a privilege and pleasure working with Noah on this and on our other collaborations. As a mentor and friend, he will be missed but never forgotten.

Abstract This paper reports research based on the Lipset and Meltz (1997) Canada-U.S. Labour Attitudes Survey data for Canada that indicates that youths have a stronger preference than do adults for unionisation. It shows that most of that difference reflects the stronger desire of youths to have unions deal with workplace issues as compared to the exposure of youths to these issues. Preferences for unionisation for youths more so than for adults are influenced by social factors such as familial union status and the attitudes of peers, as well as by the possible roles of potential substitutes for unionisation such as progressive HRM practices and legislative protection. Implications of the findings for the future of unionisation and the organising of youth are discussed.
1

1. Introduction It is often asserted that trade unions are outmoded institutions, unable to reach a new generation
of workers imbued with individualistic values -- values that are at odds with the collective ethos
underpinning unionism (O’Bannon 2001: 100-101). These assertions attribute declines in union
membership that are occurring across most of the Western industrialised world to young people’s
reduced desire for union membership. These claims appear to be bolstered by the fact that the
unionisation rate for young workers (those aged 15-24) is less than half than that of adult
workers (those aged 25+). In particular, Britain, Canada, and the United States all display youth
unionisation rates that are two and a half times lower than those of adult workers (Bryson et. al.
2001: 17).
However, to establish that the labour movement’s future is at risk because young people are
turning their backs on unions, one has to establish two things: first, that the youth-adult
unionisation differential is growing and, second, that this is due to a lower desire for membership
on the part of youths compared to adults. Our empirical evidence for Canada contradicts both of
these claims. Specifically, we find: (i) that the youth-adult union density differential, while
rising slightly during the mid 1990s, remained constant throughout the decade; (ii) that the desire
for union membership is actually higher among youths than it is among adults in our sample and
(iii) that most of that greater demand reflects the stronger desire of youths to have unions deal
with workplace issues, rather than the greater exposure of youths to these issues.
Our first result clearly undermines the main plank upon which the ‘union-movement-is-
dead’ view rests its case. Our second finding creates somewhat of a puzzle (since the actual
unionisation rate is much lower for youths compared to adults), but it is entirely consistent with a
queuing model (Farber 1983:1421; 2001:17) of union membership determination in which
2

unions do not represent all individuals who prefer to be in a unionised job because the costs to
both individuals and unions of acquiring union status are unevenly spread across workers (e.g.,
organizing costs are greater for some segments of employees than for others). Finally, our third
finding -- that predictors of desired unionisation display greater response elasticity for youth as
compared to adults – is compatible with a model where youth attitudes in general, and towards
union membership in particular, are relatively more malleable. Consequently, determinants of
desired union membership, such as social capital and union voice procedures, should affect
young workers to a greater extent than adults. The reasons for these relationships are outlined in
detail later in the text.
The paper begins by examining unionisation rates for youths and adults in Canada. Next, we
turn to our specification of the determinants of preferences for unionisation, first setting out
theoretical considerations based on a comparison of economic and social psychological models
of union attitude formation and then presenting our empirical model. Youth-adult differences in
the factors that affect preferences for unionisation are then discussed. The paper concludes with
a summary of the main findings and a discussion of the implications of these preference
differences for unions and management.
2. Unionisation rates for youths and for adults
Union density rates in Canada have consistently been far lower for youths than for adults. Table
1 shows that in the decade of the 1990s, youth density ranged from almost one-half to one-third
of the adult rate. This difference between youths and adults is much greater than the variation
within the different adult subgroups where the unionisation rates are fairly similar. As youths
mature, the density rates of the older age cohort are similar to the density rates of the early adult
3

age group in the preceding cohort. In 2000, the 25-44 age group had a union density rate very
close to the rate for 25-44 year olds in 1990, and that figure is still almost double the youth rate
in 1990 or 2000. The stability of the youth-adult density differential (last row of Table 1)
implies that there is no disproportionate trend towards lower union membership amongst youth.
It is this persistence of the large adult-youth density differential that requires explaining.
[Place Table 1 about here]
A number of reasons have been offered in the literature for the lower union density rates
of youths as compared to adults. In a Canadian context, membership and coverage tend to come
with the job (Gallager 1999: 239; Payne 1989: 113). One obvious factor, therefore, contributing
to low union density amongst the young is that youths occupy jobs that have low union coverage
rates such as retail and private services (Meltz 1993: 209). As young cohorts age they enter
industries and occupations with higher density rates and they also move from temporary jobs to
more long-term jobs across a wider spectrum of industries, which again increases the likelihood
of unionisation.
It is also reasonable to expect that youths would have a lower preference for unionisation
than adults, since turnover rates are much higher among the young (Lowe 1998: 246) implying
that young workers have a lower commitment to a job and are more inclined to exercise the exit
option than the voice option when disapproving of working conditions. This higher turnover of
youths implies that the perceptions of the costs and benefits of unionisation for youth would be
expected to differ from that of adults, especially if the benefits for youth tend to come in the
distant future (Bain and Elias 1995:81). It is to the determinants of those preferences that we
now turn.
4

3. Determinants of preferences for unionisation by youths and adults
The different preferences that youths and adults have towards unionisation can be
modelled from an economic framework that is complemented and enriched by a social
psychological perspective. We begin with an economic analysis of preferences for unionisation
based on an expected utility approach advanced by Farber (2001:16) and Riddell (1993:117).
Once we demonstrate how attitudes towards unionisation enter the standard expected utility
framework, Montgomery’s (1999) social psychological model of self-concept formation will
help us understand how these same preferences are shaped by family and the socialisation
process prior to, and during, the initial stages of a working career (e.g., Barling et. al. 1991;
Kelloway et. al. 1996)
Attitudes and preferences are important since they generally lead to the formation of a
behavioral intention on the part of an individual, which, when afforded a sufficient degree of
control over behavior, will induce that individual to carry out their intentions when the
opportunity arises (Ajzen 1991). Given that attitudes are important determinants of intentions,
and that intentions are the immediate antecedents of behavior (Sutton 1998) it is not surprising to
find that positive attitudes towards unions tend to lead to pro-union actions, such as voting for
unions in representation elections (Fiorito 1987:282; Montgomery 1989). Attitudes towards
unions, therefore, are an important ingredient in sustaining or replenishing membership.
3.1 An economic model of union preferences
Following Farber (1983: 1421) and Riddell (1993: 119), the conventional assumption among
labour economists is that workers have stable preferences for unionisation, and that individuals
will prefer unionisation if the expected utility of a union job exceeds that of a non-union job.
This in turn depends upon the costs and benefits of unionisation as affected by such factors as the
5

expected union wage premium and non-wage aspects of employment such as relationships with
supervisors and chances for promotion or layoff. The utility associated with unionisation will
also be affected by unmeasured attitudes reflecting tastes or preferences towards union
membership.
It is this latter inclination of an individual -- to be either ‘pro-union’ or ‘anti-union’
independent of the benefits and costs of unionisation -- that is of particular relevance in the
context of youth-adult differences in preferences for unionisation. Traditionally, economists
treat independent tastes for unionisation as fixed, but such preference formation can be better
understood by extending the economic framework through social-psychological models of
preference formation.
3.2 A social psychological model of union preference formation
Rather than utilizing a utility function, as do economists, social psychologists talk about the self
and the process by which self-concepts are formed (Aronson 1988). We utilise that perspective
by arguing that young workers start off essentially as ‘black boxes’ with no well-defined self-
concept concerning unionisation. Their preferences concerning union membership are therefore
malleable (Lowe and Rastin 2000:203) and are substantially influenced by social background
(e.g., whether a family member is a member of a union or not) and the attitudes of peers (e.g.,
whether family and friends are generally supportive of unions). The importance of family and
the socialisation process prior to, and during, the initial stages of a working career is emphasised,
for example, in Barling et. al. (1991) and Kelloway et. al. (1996). The socialisation process is
further influenced by the nature of early workplace experiences (e.g., whether a worker is
employed in a unionised or a non-unionised environment). The importance of initial exposures
to unions and preferences for unionisation throughout the life course is emphasised in Freeman
6

and Diamond (2001), and for youths in particular by Fullagar and Barling (1989), Fullagar et. al.
(1995), and Payne (1989). Following Coleman (1988), this vector of various social factors
which influence demand for unionisation can be grouped under the heading social capital.
Building upon this foundation of social capital, the socialisation process for any given
worker can be summarised using Montgomery’s (1999: 6) attribution model of self-concept
formation. The dynamics of the self-attribution model depend on the assumptions one makes
about the self-concept and how well defined it is before a worker enters the labour market. A
young worker with little or no employment experience has a different dynamic than an adult
worker with many years of labour market experience. Youth preferences are established early
and solidify with age and experience (Lowe and Rastin, 2000:216). The ordering of the feedback
model reflects this process, with a young worker first influenced by social capital (e.g., familial
union status and prevailing social and workplace norms) which leads to certain individual actions
(e.g., applying for union jobs or participation in organising drives). These actions are then
internalised through attributions such as beliefs about the importance of loyalty to an employer
or ideals concerning individual or collective solutions to workplace problems. Youth idealism in
the unionisation process is emphasised, for example, in Cregan and Johnston (1990). Finally, it is
through these attributions that a pro-or anti-union self-concept is formed, which in turn feeds
back into the initial social capital of the community, continuing to fuel the dynamic
intergenerational process of preference formation outlined above. Summarizing the schematic
laid out in Montgomery (1999: 6), the dynamic process moves from (1) social capital to (2)
individual actions to (3) internalisation through attribution formation to (4) self-concept
formation which in turn feeds back into social capital formation in following periods.
7
The modelling framework above implies that as workers mature and gain labour market
experience, the proclivity to be for or against unionisation becomes more inelastic (i.e., less
responsive to alteration from social forces and prevailing workplace norms). As workers age,
preferences become more fixed as opposed to being responsive to other variables. This has
important implications for unions and their organisers, as it indicates that although youths make
up only 1/5 of all union members, they are attitudinally amenable to union membership, whereas
adults appear to be less sensitive to altering their preferences for union representation based on
factors found inside and outside of the workplace.
4. Econometric analysis procedures
Our dependent variable is a measure of preferences for unionisation based on the response to the
survey question “All things considered, if you had a choice, would you personally prefer to
belong to/ remain in a labour union or not?” (hereafter simply referred to as preferring a union).
Logistic regression equations are estimated separately for youths and adults, based on the
dichotomous dependent variable coded 1 if respondents would prefer to belong to a union, and 0
if not. The 12.8 % of respondents who indicated “did not know” to the question on their
preference for a union were omitted from the analysis since they could not logically be grouped
as being closer to either the yes or the no category, and a separate analysis of the “did not know”
category did not seem merited. The results are very similar if they are grouped with the
respondents who indicated “no”.
Our independent variables are drawn from survey responses that reflect the perceived
costs and benefits of unionisation for youth and adult workers. The independent variables are
grouped into five general categories: (i) social capital indicators (whether union member in the
8

family, and whether family and friends support unions); (ii) attitudes towards traditional union
policies (positive attitude towards pay standardisation; positive view of worker political power;
preference for layoffs based on seniority; perception that collective solutions to work problems
are best); (iii) perceptions about the employer and the job (feel no loyalty to employer; feels
employees are treated unfairly at work; perceives poor opportunity for advancement at work;
worried about layoffs); (iv) union-voice substitutes (no progressive HRM practices at job; feels
unprotected by workplace law); and, (v) individual characteristics (gender; union status; political
position). How each variable is measured is detailed in Table 2. Our explanatory variables are
coded such that a positive coefficient is expected.
[Place Table 2 about here]
As outlined in Nielson (1998:116), for binary coded dependent variables as in logistic
regressions, the difference in probabilities of preferring membership can be decomposed into one
part which is caused by differing propensities (R) and another part which is explained by
differences in characteristics (C) between youths (y) and adults (a). Using adults as the standard,
the average estimated probability of desired unionisation for both age groups is given by
(1) yi
Ni
ByiXFyPy
N
/1
ˆ∑ ⎥⎦⎤
⎢⎣⎡
==
(2) [ ]ai
Ni aiXFaP
aN
/1
ˆ∑=
= δ
where N i is the number of observations for each age group j. Define
(3) [ ]ai
Ni
BaiXFyaP
aN
/1
ˆ∑=
=
9

where (1) is the preferred rate of union membership amongst adults that would be predicted if
each adult worker retained his or her ‘union-preferring’ individual and workplace characteristics,
but the impacts of those characteristics on the probability of preferring to belong to a union were
the same as those estimated for youths. The intergenerational union preference gap can then be
decomposed using the following identity, which defines R and C:
(4) 4342143421
C
yPyaP
R
yaPaPyPaP −+−=−
The term R is the average probability that D=1 for adults minus the average probability that D=1
if adults reacted like youth. The term C is the average probability that D=1 for adults if they
reacted like youth minus the average probability that D=1 for youths.
From an empirical perspective, the modelling framework outlined in Section 3 implies
that the response parameters (i.e., coefficients) to social capital and various other determinants of
unionisation will be larger for youths than for comparable adults. As well, the cumulative effect
of this greater responsiveness on the part of youths should explain a larger portion of the overall
difference in the preferences on the part of youths compared to adults for unionisation. That is,
in the decomposition analysis, the component due to response differences (coefficients) between
youths and adults should be greater than the component due to differences between youths and
adults in their characteristics (independent variables).
5. The data and limitations
Our empirical analysis of the preferences for unionisation utilises data from the Lipset and Meltz
(1997) Canada-U.S. Labour Attitudes Survey for Canada. The survey utilized quota sampling
(Kervin 1992: 220) to generate a representative sample of workers by determining how many
10

responses were needed to obtain representativeness over observable characteristics based on
Census data (e.g., region, gender, age and employment status) and then contacting households
until those sample targets are met . Quota sampling does not have a sampling frame and hence
there is no conventional “response rate” since there is no randomly drawn target sample from
which a proportion of valid responses can be drawn. Of those contacted, however, 58.7%
responded. Given that quota sampling is designed specifically to ensure a representative sample
across various observable characteristics (based on Census data in this case), it is not surprising
that the survey characteristics match very closely the population characteristics as given by the
Census (Table 3).
[Place Table 3 about here]
The purpose of the survey was to determine attitudes toward work, institutions and social
policy. Information was obtained on general values of workers, including views on
individualism versus group or communitarian orientation, the appropriate role of governments,
confidence in institutions, and perceptions of labour market outcomes such as their expectations
about layoffs.
The Angus Reid Group, one of Canada’s leading public opinion survey firms,
administered the survey through telephone calls - which averaged 20-26 minutes per respondent
- in June and early July 1996. The survey yielded a representative sample of 1495 working-age
people in Canada. Cases were eliminated in our analysis if they were missing observations on
the dependent variable, reducing our sample to 1,204 (1,057 adults and 147 youths).
The small youth sample makes it is more difficult to obtain precise estimates of the
underlying relationship for youths compared to the larger sample of adults. We sustained the
youth sample size in part by including 40 non-employed respondents with the 107 who were
11

employed at the time of the survey. The non-employed were asked all questions except on
perceptions of work conditions and jobs, and on union voice substitutes, that is, those in groups
(iii) and (iv) above. Their responses were coded as “unknown” for these questions. For all other
questions they are treated as regular respondents, responding with their views of the situation.
The preferences of the non-employed are important since many are looking for work and others
are about to obtain work. We can assume that they respond to questions based on their past or
expected status or on their general view of those situations. Their responses are meaningful
since our goal is to capture general preferences for unionisation, not whether one would vote for
a union at his or her particular job.
Including the non-employed in the analysis is further buttressed by the fact that we also
ran the model with an added non-employed dummy variable (compared to employed). The logit
coefficient of 0.053 was statistically insignificant (p = 0.97), yielding a marginal effect of 0.01.
That is, there was virtually no difference in the preferences for unionisation between the
employed versus non-employed. Furthermore, the other coefficients (unreported but available
from the authors on request) remained virtually unchanged. In spite of this similarity between
the preferences of the employed and non-employed, we regard the small sample for youths as a
limitation of our analysis. We would have preferred to have a larger sample for youths both to
obtain more precise estimates and to be able to restrict the analysis only to the employed.
A second limitation of our analysis – common method variance – may arise if
respondents with certain characteristics may self-report in a way that systematically affects both
independent and dependent variables, giving rise to spurious correlation. As emphasised by
Hartley and Barling (1998:167) once the survey data has been collected there is little that can be
done other than recognising the possible limitation and interpreting the results with caution.
12
6. Results
A Chow-type test (Greene 2000: 826) on the similarity of the coefficients in the youth and adult
equations yielded a Likelihood Ratio of 394.72 which is well above the critical value of 135.81
at the 0.01 level of significance from the chi-squared distribution. This indicates that the
underlying structure (i.e., coefficients) of the two equations were significantly different from
each other so that separate equations are appropriate.
6.1 Decomposition analysis and overall picture As indicated in Table 4, 56.7 percent of youths in our sample (row 1) compared to 49.8 percent
of adults (row 2) expressed a preference to belong to a union, for an overall difference of 6.9 in
favour of youths preferring unions (row 6). As indicated in row 4, about two-thirds (62 percent)
of the higher preference of youths for unionisation can be attributed to the greater response of
youths to prefer unionisation, and about one third (38 percent as indicated in row 5) can be
attributed to the fact that youths are more exposed to the social capital, workplace issues or
attitudes that give rise to a greater preference for unionisation to deal with such issues in general.
This finding also confirms our hypothesis that older respondents have a more hardened attitude
towards unions that cannot be so readily dislodged by external influences.
[Place Table 4 about here]
Table 5 indicates the separate impact of each of the various independent variables
influencing the probability of preferring unionisation amongst youths and adults in Canada. As
is conventional, marginal effects or changes in probabilities are reported, calculated from the
logit coefficients that are also given in Table 5.
[Place Table 5 about here]
In general, the results confirm our hypothesis that youth are more responsive than adults
to the determinants of preferences for unionisation. That is, the changes in probabilities are
13

generally larger and more often statistically significant for youths (column 3) compared to adults
(column 7). In part as a result of this, youths have a stronger overall desire for unionisation than
do adults as discussed previously in the decomposition analysis and as indicated in the first row
of the table whereby 56.7 percent of youths and 49.8 percent of adults in our sample indicate that
they would prefer a union. The subsequent rows show the effects of various characteristics on
the preferences for union membership. Both the sample means of the explanatory variables and
the effect they have on the probability of preferring unionisation (i.e., the logit coefficients
translated into changes in probability) are discussed and compared since each provide interesting
information on youth-adult differences in unionisation.
6.1 The effects of social capital and social norms
Persons who have a union member in the family are themselves much more likely to prefer
unionisation, with the effect being more than three times as strong for youths compared to adults.
Specifically, the probability of preferring unions is 0.37 higher for youths from families with an
existing union member, while it is 0.11 higher for adults in the same circumstances. As
anticipated from the social psychological model of union preference formation, families are a
more important influence in shaping the preferences of youths than is the case for adults.
A similar pattern prevails for the influence of family and friends and their support for
unionisation. That is, the influence of family and friends is important for both youths and adults,
but once again stronger for youths than for adults. Specifically, the probability of preferring
unions is 0.41 higher for youths whose family and friends support unions, compared to 0.29
higher for adults in the same circumstances. The influence of family and friends is therefore
much stronger in determining the preferences for youths than for adults.
14

6.2 The effects of traditional union policies
The probability of preferring a union is higher amongst persons who prefer pay standardisation
as opposed to merit-based pay. This is understandable given that unions also generally prefer
such pay standardisation. The effect is almost twice as large for youth (0.30) compared to adults
(0.18) highlighting our proposition that youths are more responsive than are adults to the factors
that influence preferences for unionisation in general. The sample means also indicate that
approximately 20 percent of youths tend to have a positive attitude to pay standaridisation, with a
slightly higher figure for adults.
Not surprisingly, the probability of preferring unionisation is considerably higher for
persons who also feel that workers should have more political power. The impact is especially
large for youth (0.34) compared to adults (0.23). The mean values also indicate that
proportionately more youths (77 percent) compared to adults (61percent) in our sample think that
workers should have more political power. In essence, youths have a more positive view of
workers having political power compared to adults and youths are more prepared to act on it by
supporting unionisation.
The proportion of respondents who follow the traditional union policy of preferring
layoffs based solely on seniority was lower for youths (0.36) than for adults (0.42). These
differences are not as large as one may have expected given that layoffs based on seniority as
opposed to merit would disproportionately benefit adults. Those youths who do believe that
layoffs should be based only on seniority, however, do not seem prepared to translate their
beliefs into reality by supporting unions (i.e., their coefficients on preferring unions are
insignificant for youths). Adults who believe that layoffs should be based on seniority, however,
are much more likely to act on their beliefs by supporting unions since unions would help
15
translate those beliefs into reality by supporting the seniority principle (i.e., the coefficient on
preferring unions is positive, large and significant for adults who support the seniority principle).
The proportion of youths and adults in our sample who believe that individual solutions
to workplace problems are better than collective solutions is fairly similar for youths and adults.
The fact that almost half of each group responded they “did not know” to this question (see note
at bottom of Table 3) suggests that substantial numbers could be persuaded to support either
collective or individual policies (e.g., unions or progressive HRM practices).
Even though similar proportions of youths and adults in our sample feel that collective
solutions to workplace problems are better than individual solutions, adults seem more willing to
act on their views through supporting unions (i.e., the adult coefficient is positive and significant,
P = 0.02, while the youth coefficient is insignificant, P = 0.61). This is one of the few areas
where adults seem more willing than youths (i.e., where the magnitude of the coefficient was
greater for adults than for youths) to express a greater preference for unionisation when they had
a belief that was conducive to unionisation.
6.3 The effect of working conditions and job characteristics
Adults who feel no loyalty to their employer or who do not know if they feel loyalty to their
employer are 0.16 more likely to prefer a union, compared to adults who feel loyalty to their
employer (although this effect is significant only at the 0.12 level). For youths, the effect is
statistically insignificant (P = 0.73).
The effect of the perception of employees being treated unfairly is more dramatic for
youths. Specifically, the probability of preferring unions is 0.42 greater for youths who perceive
employees are being treated unfairly, compared to youths who do not perceive employees as
being treated unfairly. For adults, the impact of unfair treatment is small (0.07) and statistically
16

insignificant. Importantly, the sample means indicate that 58 percent of youths compared to only
13 percent of adults perceive employees as being treated unfairly at their workplace. In essence,
youths have a much stronger perception of unfair treatment at the workplace and are more
prepared to support unionisation as a result. The substantial numbers of both youths and adults
who reported that they “did not know” whether employees are treated unfairly at work (see note
at bottom of Table 3) suggests that substantial numbers could be influenced by unions or by
progressive HRM practices that would facilitate fair treatment at work.
The mean values indicate that the same proportion of youths and adults (around 31
percent) tend to think they have poor opportunity for advancement. Interestingly, this has an
opposite effect on youths compared to adults. Adults who feel they have a poor opportunity for
advancement are more likely to prefer unions, while for youths the opposite is the case (although
statistically insignificant). This is not surprising given that the seniority principle followed by
unions is apt to favour adult opportunities for advancement at the expense of young workers.
Only about 19 percent of youths, compared to 31.5 percent of adults in our sample, worry
about layoffs, perhaps reflecting the lower cost of layoffs to youths and the fact that they expect
to be laid off given the practice of “last-in, first-out”. The different impact that this concern for
layoffs has on preferences for unionisation between youths and adults, however, is large –
increasing the probability of preferring a union by 42 percent for youths with zero impact for
adults. This is somewhat surprising since unions would tend to foster the last-in, first-out
phenomenon that tends to put youths at more risk of layoffs, compared to adults.
6.4 The effect of union voice substitutes
A lack of progressive HRM practices at work (e.g., self-directed work teams, total quality
management, quality circles, employee involvement programs, as defined earlier in Table 2)
17

leads to a large preference for unions on the part of youths, but no effect on the preferences of
adults. This highlights the possibility that progressive HRM practices can be a substitute for
unionisation (a concern long recognized in the literature) especially in the minds of younger
workers in the years when their preferences for their ‘ideal’ working environment are being
shaped. It also highlights the understandable resistance that unions often have to such practices
since they are a viable threat to unions, especially for the new generation of workers that have
not been raised under a history of unionism.
Similar portions of adults and youths in our sample felt that they were protected by
workplace law (51 percent). The fact that slightly over 30 percent (see note at bottom of Table
3) of both youths and adults did not know if they felt protected again highlights the substantial
numbers who could be influenced by such protection (to the extent that it is a substitute for the
protection provided by unions). This is especially the case for youths since those who felt that
they were not protected by workplace law were 0.35 more likely to prefer a union than were
youths who felt they were protected by such laws.
6.5 The effect of individual characteristics
The preference for unionisation is lower for male compared to female youths, and the opposite
for male compared to female adults. This is one of the few variables that has a sign difference
between youths and adults. The sign reversal is consistent with unions catering to male
preferences for older persons, but shifting towards female preferences, as women become more
prominent in the workforce and in unions. The effects, however, are statistically insignificant,
marginally so in the case of youths (p = 0.11) and more so in the case of adults (p = 0.19).
The preference for unionisation is vastly higher for both youths and adults who are
currently union members compared to those who are not union members. Youths who are union
18

members are 0.36 more likely to prefer unionisation than are youths who are not union members,
and the effect is slightly larger for adults. The fact that union members (for both youths and
adults) prefer unionisation suggests that the number who want to remain certified vastly
outweighs the number of union members who would prefer decertification.
As indicated by the sample mean values, the political orientation of youths and adults in
terms of left, right and centre on the political spectrum are remarkably similar. This is somewhat
surprising given the perception that people become more conservative as they age, but it is
consistent with the perspective that youths today are more conservative than youths of yesterday.
As expected, persons at the centre and especially on the left in the political spectrum are more
likely to prefer unions than are persons on the right of the spectrum, although the effects are not
statistically significant for youths (P = 0.22).
7. Conclusions
Our analysis of the preferences for unionisation on the part of youths and adults gives rise
to the following generalisations:
Youths have a stronger preference than do adults for unions in general and most of that
reflects the stronger desire of youths to have unions deal with workplace issues, than it
reflects the exposure of youths to these issues. Conversely, as workers age they appear to
have a weaker preference for unions to deal with workplace issues.
The preferences of young workers for unionisation are malleable and strongly shaped by
their accumulated social capital, such as union membership in the family and the attitudes of
family and friends towards unions, highlighting the cumulative and inter-generational effects
that can be involved in the transmission of union status.
19

• Substitutes for unionisation such as progressive HRM practices and legislative protection
also have a powerful effect on young workers’ preferences for unionisation. The fact that
youths who felt unprotected by labour law had a strong preference for unions highlights the
conventional dilemma that unions face in this area. They may support protective legislation
for reasons of social justice and because it can raise the cost of non-union labour relative to
union labour that already has that protection through the collective agreement. But such
legislation can also be a substitute for unionisation to the extent that it reduces the need to
provide the protection through unionisation.
Large number of respondents indicated that they “did not know” whether collective or
individual solutions were better, or whether employees were treated unfairly at work, or
whether they felt unprotected by workplace law. This highlights the substantial number of
youths who could be persuaded into individual or collective solutions (e.g., progressive HRM
practices or unions) to deal with such workplace issues.
Our analysis implies that there is a large potential among youths in our sample to either
support or oppose unionisation, depending on the views of family and friends about unions and
depending on conditions inside the workplace. In essence, unions have an opportunity to
increase the rate of unionisation among youth if youths become more acquainted with unions and
if they are in workplaces where they believe that employees are not being fairly treated.
Investment by unions in education and organizing can have a long-term payoff for the labour
movement. By tilting the taste for unionisation more strongly in the positive direction, any union
organizing and educational programme targeted to today’s youth can have a multiplier effect on
successive generations because as workers age, independent predictors of union preferences
become less important and less effective in shifting tastes for unionisation.
20

The large impacts of the “union member in the family” and the “family and friends
support unions” variables, offers one explanation for the cumulative, snowballing effect that
occurs when initial union decline seems to foster subsequent union decline, as in the U.S. over
the last three decades. If union membership begins to fall, then it is less likely that there will be
a union member in the family, and less likely that family and friends will support unions
(especially given the earlier positive effect of union status on preferences for unionisation). In
such circumstances, union decline begets further union decline, given the much stronger effect
that these variables have on youths as compared to adults. The implications of this finding for
union organizing are striking, since the intergenerational transmission of non-union forms of
social capital will persist as young cohorts mature and continue working throughout their
lifecycle. Of course, the same process works in the opposite direction. Effective union
organising today can have multiplier effects well into the future, as it leads to more union family
members and more union friendly family and peers, both of which enhance preferences for
unionisation, especially amongst youths upon which future unionisation is built.
A number of surprises in our empirical study also add to possibilities for organising
youth. Relative to adults, youth have a more supportive view of worker political power and they
are only slightly more supportive of merit as a basis for layoffs. Youths are more positive about
unions than are adults and this is a potential that unions can build upon. The fact that almost half
of the youth had no views on individual versus collective solutions to problems in the workplace
adds further credence to the perspective that the views of youth are malleable. This can perhaps
account for the large discrepancy between greater stated desire for union membership and lower
realised demand for unionisation (union density at the time of the survey was only 13.0 percent
for youths compared to 36.0 percent for adults, even though youth had a stronger preference for
21

unions than did adults). It also means that the manner in which unions and management
ultimately respond to the views and needs of young persons will have a strong influence on the
future of unions and of workplace practices.
Acknowledgements
Financial assistance from the Social Sciences and Humanities Research Council and the
Government of Canada project on Regional Aspects of Employment Relations Policy in Canada
and the Leverhulme Future of Trade Unions in Britain fund is gratefully acknowledged. We also
thank Bruce Pearce and Konstantinos Tzioumis for their research assistance, and Alex Bryson,
Mike Campolieti, Doug Hyatt, David Metcalf, two anonymous referees and Tom Kochan, Anil
Verma, Stephen Wood (in their editorial capacity) for comments on earlier drafts of this paper.
22

References Ajzen, I. (1991). ‘The theory of planned behavior’. Organizational Behavior and Human
Decision Processes, 50: 179-211.
Aronson, E. (1988). The Social Animal. New York: WH Freeman.
Bain, G. and Elias, P. (1985). ‘Trade union membership in Great Britain: An individual level
analysis’. British Journal of Industrial Relations, 23: 71-92.
Barling, J., Kelloway, E. and Bremermann, E. (1991). ‘Pre-employment predictors of union
attitudes: the role of family socialization and work beliefs’. Journal of Applied
Psychology, 76: 725-731.
Bryson, A., Gomez, R., Gunderson, M. and Meltz, N.M. (2001). ‘Youth-adult differences in the
demand for unionization: Are American, British, and Canadian workers all that
different?’ Discussion Paper 515. Centre for Economic Performance, London School of
Economics.
Coleman, J. (1988). ‘Social capital in the creation of human capital’. American Journal of
Sociology, 94: S95-S120.
Cregan, C. and Johnston, S. (1990). ‘An industrial relations approach to the free rider problem:
young people and trade union membership in the UK’. British Journal of Industrial
Relations, 28: 84-104.
Farber, H. (1983). ‘The determination of the union status of workers’. Econometrica, 51: 1417-
38.
Farber, H. (2001). ‘Notes on the economics of labor unions’. Working Paper 452. Industrial
Relations Section, Princeton University.
Fiorito, J. (1987). “Political instrumentality perceptions and desires for union representation”.
Journal of Labor Research, 45: 271-289.
23

Freeman, R.B. and Diamond, W. (2000). ‘Liking the workplace you have: The incumbency
effect in preferences towards unions’, Working Paper 1115, Centre for Economic
Performance, London School of Economics.
Fullagar, C. and Barling, J. (1989). ‘A longitudinal test of a model of the antecedents and
consequences of union loyalty’. Journal of Applied Psychology, 74: 213-227.
Fullagar, C., Gallagher, D., Gordon, M. and Clark, P. (1995). ‘Impact of early socialisation on
union commitment and participation: a longitudinal study’. Journal of Applied
Psychology, 80: 147-157.
Gallagher, D. (1999). ‘Youth and labour representation’, In J. Barling and E.K. Kelloway (eds.),
Young Workers: Varieties of Experience. Washington, D.C.: American Psychological
Association.
Greene, W. (2000). Econometric Analysis, Fourth edition, Prentice-Hall.
Hartley, G and J. Barling (1998). ‘Employee attitude surveys’, In K.Whitefiled and G.Strauss
(eds.), Researching the World of Work: Strategies and Methods in Studying Industrial
Relations. Ithaca: Cornell University Press.
Kelloway, E., Barling, J. and Agar, S. (1996). ‘Pre-employment predictors of children’s union
attitudes: the moderating role of identifying with parents’. Journal of Social Psychology,
136: 413-415.
Kervin, J. (1992). Methods for Business Research. New York: Harper-Collins.
Lipset, S.M. and Meltz, N.M. (1997). ‘Canadian and American attitudes toward work and
institutions’, Perspectives on Work, 1(3): 14-20.
Lowe, G. (1998). ‘The future of work: implications for unions’. Relations Industrielles/
Industrial Relations, 53: 235-257.
24

Lowe, G. and Rastin, S. (2000). ‘Organizing the next generation: influences on young workers’
willingness to join unions’, British Journal of Industrial Relations, 38, 203-222.
Meltz, N.M. (1993). ‘Unionism in the private service sector: A Canada-United States
Comparison,” In J. Jensen and R. Mahon (eds.), The Challenge of Restructuring: North
American Markets Respond. Philadelphia: Temple University Press.
Montgomery, B.R. (1989). ‘The influence of attitudes and normative pressures on voting
decisions in a union certification election’. Industrial and Labor Relations Review, 42:
262-79.
Montgomery, J.D. (1999). ‘The self as a fuzzy set of roles: role theory as a fuzzy system’.
Discussion Paper No. 4. Interdisciplinary Institute of Management, London School of
Economics.
Nielson, H.S. (1998). ‘Discrimination and detailed decomposition in logit models’. Economic
Letters, 61: 115-120.
O’Bannon (2001). ‘Managing our future: The generation X factor’, Public Personnel
Management, 30 (1), 95-109.
Payne, J. (1989). ‘Trade union membership and activism among young people in Great Britain’,
British Journal of Industrial Relations, 27: 111-32.
Riddell, C. (1993). ‘Unionisation in Canada and the United States: a tale of two countries.’ In D.
Card and R.B. Freeman (eds.) In Small Differences That Matter: Labor Markets and
Income Maintenance in Canada and the United States. Chicago: University of Chicago
Press.
Sutton, S. (1998). ‘Predicting and explaining intentions and behavior: how well are we doing?’,
Journal of Applied Social Psychology, 28: 1317-1338.
25

TABLE 1 Union Density in Canada by Age Group: 1990-2000 †
Age group
1990
1997
2000
% % % Total: 15+
35.2
31.1
29.9
Youth: 15-24 17.1 10.7 12.4 Adult: 25+ 38.7 35.7 33.6 25-44 36.7 31.8 30.3 45-54 44.9 44.1 41.5 55+ 40.4 35.7 34.4 ∆ [Adult-Youth] 21.6 25.0 22.0 Source: Calculated from data given in Perspectives on Labour and Income (various issues) Statistics Canada 75-001-XPE. 1990 data from the Spring 1996 volume; 1997 data from the Winter 1997 volume; and 2000 data found from the Autumn 2001 volume. † Since January 1997, data on union membership has been collected as part of the Labour Force Survey (LFS) and this is used for our 1997 and 2000 data. The 1990 data is drawn from the Labour Market Activity Survey (LMAS), which was undertaken as a supplement to the monthly LFS. The LMAS is based on a sample of approximately 30,000 Canadian households, and the LFS on approximately 50,000 households. For 1990, the youngest age group was 17.
26

TABLE 2 Variable Definitions Based on 1996 Angus Reid Survey Questionnaire
Dependent Variable Survey Question
Prefer union membership Independent Variables
All things considered, if you had a choice, would you personally prefer to belong to a labour union or not?
Social Capital (No union member in family) Does any other member of your family belong to a union - such as a spouse or your parents? Union member in family Do not know if union member in family
(Family and friends do not support unions) Most of my family and close friends don't like unions. [4pt scale: Strongly agree, Moderately agree, Moderately disagree, Strongly disagree]
Family and friends support unions Do not know whether family and friends oppose unions Attitudes to Traditional Union Policies (Negative attitude to pay standardization) Imagine two workers of the same age, with the same years of service with their employer, doing nearly Positive attitude to pay standarization the same job. One earns [X] a week more than the other. The better-paid worker is quicker and more Do not know attitude to pay standarization efficient at the job. In your opinion how fair or unfair is it that one of these workers is paid more than the other? [4pt scale: Very unfair, Somewhat unfair, Somewhat fair, Very fair]
(Negative view of worker political power) Workers should have more political power. [4pt scale: Strongly disagree, Moderately disagree, Moderately sagree, Strongly agree]
Positive view of worker political power Do not know attitude to worker political power (Layoffs based on merit only) All things being equal, should a company that has to lay off people do this on the basis of seniority or Layoffs based merit and seniority merit? [Select from categories indicating merit, merit and seniority or seniority only] Layoffs based on seniority only Do not know how layoffs should be based (Individual solution to work problems best) How would you prefer to solve a workplace problem of your own? Would you feel more comfortable Collective solution to work problem best dealing directly with management yourself, or would you feel comfortable having a group of your fellow Do not know which is better Employees help you deal with management? Perceptions of Working Conditions (Feels loyalty to employer) How loyal would you say you feel towards your employer? Feels no loyalty to employer [4pt scale: Very loyal, Fairly loyal, Not very Loyal, Not loyal at all] Does not know how loyal (Employees treated fairly) Job Rating: Treatment of employees by management [4pt scale: Very good, Good, Poor, Very poor] Employees treated unfairly Do not know how employees treated (Good advancement opportunities) Job Rating: Opportunities for advancement [4pt scale: Very good, Good, Poor, Very poor] Poor advancement opportunities Do not know opportunities for advancement (Not worried about layoffs) How worried are you that your company will be laying off or cutting jobs in the near future? Worried about layoffs Are you [4pt scale: Not worried at all, Not very worried, Somewhat worried, Very worried] Do not know whether will be laid off Union Voice Substitutes (No progressive HRM at work) Some companies are organizing workplace decision-making in new ways to get employees more Presence of progressive HRM at work involved – using things like self-directed work teams, total quality management, quality circles, or other Do not know whether HRM at work employee involvement programs. Is anything like this now being done by your employer? [YES…NO] (Employees protected by law) Do you feel that you are already protected by the law, against unfair treatment by your employer? Employees not protected by law [YES…NO] Do not know how protected employees are Individual Characteristics (Female) Male (Politically right of centre) How would you describe your political views? Would you say you lean Politically left of centre [Far to the righ, Moderately to the right, In the political centre, Moderately to the left, Far to the left] Centre of political spectrum Do not know (Non-union) Phrase in brackets ( ) for the independent variables of column 1 represents the excluded reference category in regression analysis as given in Table 5. To create single dummy variable response categories (and preserve degrees of freedom), scaled responses, like the 4 point scales of column 2, were combined into the independent variable categories of column 1, by grouping the first two scales (e.g., very loyal, fairly loyal) into the first category (e.g., feels loyalty to employer) and the last two scales into the second category.
27

Table 3
Comparison of Lipset-Meltz Survey and Census Means
Survey (%)
Census (%)
Region British Columbia 12.3 12.7 Alberta 9.3 9.3 Saskatchewan 3.6 3.5 Manitoba 4.1 3.9 Ontario 36.9 37.5 Quebec 25.2 24.9 New Brunswick 2.9 2.6 Nova Scotia 3.2 3.2 Prince Edward Island 0.6 0.5 Newfoundland 2.0 2.0 Gender Male 49.3 49.1 Female 50.7 50.9 Age 15-24 10.9 13.1 25-34 19.7 23.8 35-44 26.0 21.4 45-54 19.3 14.5 55-64 12.9 11.7 65+ 11.2 15.5 Employment status Full time 49.5 47.4 Part time 12.9 11.0 Not Employed 37.7 41.6 N 1497 24989
28
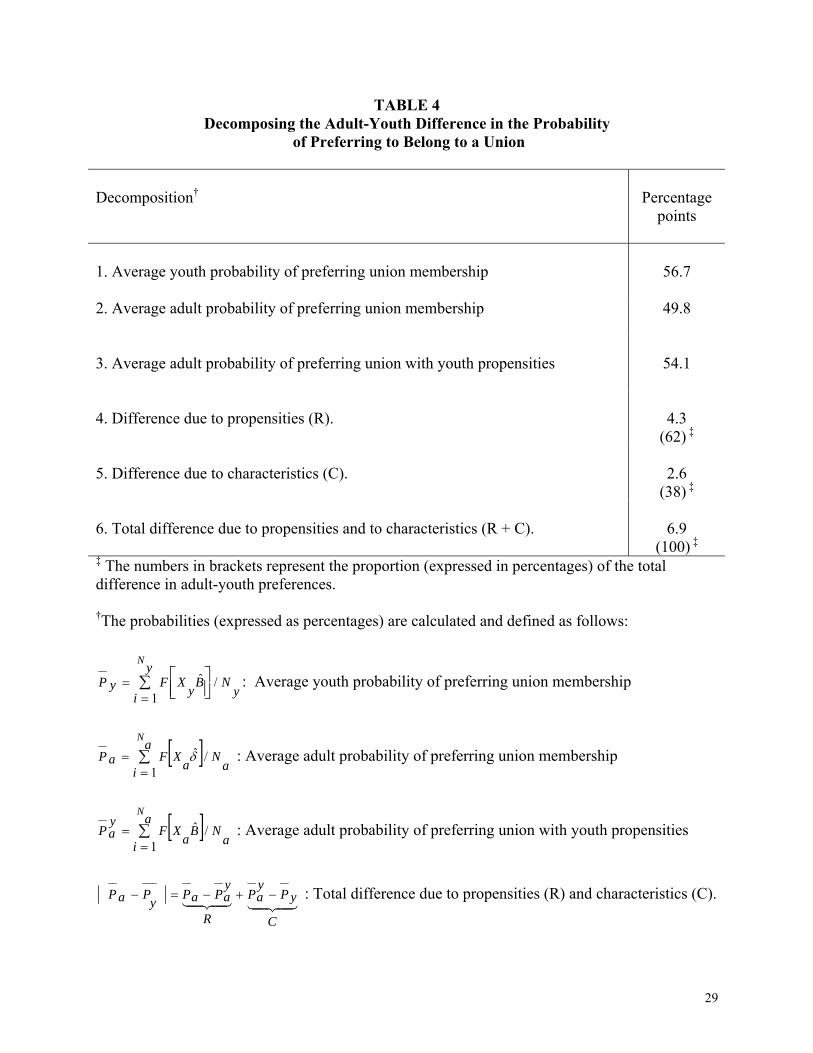
TABLE 4 Decomposing the Adult-Youth Difference in the Probability
of Preferring to Belong to a Union Decomposition†
Percentage
points
1. Average youth probability of preferring union membership
56.7
2. Average adult probability of preferring union membership 49.8
3. Average adult probability of preferring union with youth propensities
54.1
4. Difference due to propensities (R).
4.3
(62) ‡
5. Difference due to characteristics (C).
2.6
(38) ‡
6. Total difference due to propensities and to characteristics (R + C).
6.9
(100) ‡
‡ The numbers in brackets represent the proportion (expressed in percentages) of the total difference in adult-youth preferences. †The probabilities (expressed as percentages) are calculated and defined as follows:
yN
y
iByXFyP
N
/1
ˆ∑ ⎥⎦⎤
⎢⎣⎡
== : Average youth probability of preferring union membership
[ ]a
Na
i aXFaPN
/1
ˆ∑=
= δ : Average adult probability of preferring union membership
[ ]a
Na
iBaXF
yaP
N
/1
ˆ∑=
= : Average adult probability of preferring union with youth propensities
4342143421C
yPyaP
R
yaPaPyPaP −+−=− : Total difference due to propensities (R) and characteristics (C).
29

TABLE 5 – Factors Influencing Probability of Preferring to Belong to a Union, Youths - Adults, Canada, Youths (16-24) Adults (25-64) Means+ Logit Coef. ∆ Probability Sig. Level Means+ Logit Coef. ∆ Probability Sig. Level Independent variables (1) (2) (3) (4) (5) (6) (7) (8)Overall mean of dependent variable .567 .498 Social Capital (No union member in family) .343 .412 Union member in family .359 2.39 .368** 0.02 .319 0.46 .113** 0.00
(Family & friends oppose unions) .384 .449 Family & friends support unions .542 3.65 .414** 0.00 .506 1.32 .290** 0.00 Attitudes to Traditional Union Policies (Negative attitude to pay standarization) .789 .772Positive attitude to pay standarization .203 1.62 .302* 0.08 .223 0.75 .179** 0.00 (Negative view of worker political power) .213 .358Positive view of worker political power .771 1.96 .336** 0.02 .614 0.99 .229* 0.00 (Prefer layoffs based on merit only) .608 .537 Prefer layoffs based on merit & seniority .029 1.13 .235 0.47 .044 0.95 .219** 0.01Prefer layoff based on seniority only .363 0.26 .061 0.72 .419 0.85 .200** 0.00 (Individual solution to work problems best) .337 .327 Collective solution to work problems best .233 0.55 .127 0.61 .193 0.56 .139** 0.02 Perceptions of Working Conditions and Job (Feels loyalty to employer) .645 .641 Feels no loyalty to employer or unknown .355 -0.49 -.123 0.73 .359 0.65 .157 0.12 (Employees treated fairly at work) .213 .564 Employees treated unfairly at work .578 3.98 .419** 0.03 .133 .133 .071 .071 (Good or unknown opportunity to advance) .686 .684 Poor opportunity to advance at work .314 -1.02 -.246 0.27 .316 0.25 .063 0.24 (Not worried about layoffs or unknown) .812 .685 Worried about layoffs .188 3.80 .416** 0.02 .315 0.00 .001 0.98

Union Voice Substitutes (Have progressive HRM at job) .255 .387 No progressive HRM at job .407 4.92 .427** 0.00 .335 0.15 .036 0.49 (Feel protected by workplace law) .510 .511 Feel unprotected by workplace law .169 2.19 .354* 0.07 .172 0.12 .030 0.62 Individual Characteristics (Female) .472 .498Male .528 -1.09 -.262 0.11 .502 0.22 .055 0.19 (Non-union respondent) .790 .544Union respondent .210 2.19 .355** 0.03 .456 2.22 .404** 0.00 (Politically right of centre) .205 .197 Politically at centre .524 1.25 .254 0.22 .502 0.71 .170** 0.00Politically left of centre .188 1.29 .260 0.22 .183 1.04 .239** 0.00Sample Size 147 147 - - 1057 1057 - -
+ The means indicate the proportion of respondents in each category. If they do not sum to 1, differences reflect the “did not know” responses that were included in the regression but not reported here. Significance level: P< 0.05**; 0.10*. Excluded reference category for independent variable given in brackets ( ) in the independent variable column.
1