ls_presentation using ahp_final
TRANSCRIPT

Landslide Susceptibility Zonation
Using
Analytic Hierarchy Process – A case study from
Kalimpong-I C.D.Block, Darjeeling District, West
Bengal
Presented bySuchismita Mukherjee
Outline
Concept of landslide
Necessity of landslide susceptibility zonation
Analytic Hierarchy Process
Application of AHP into LSZ mapping
Conclusion

Concept of Landslide geological phenomenon which includes a wide range of ground movement.
can occur in offshore, coastal and onshore environments.
action of gravity is the primary driving force for a landslide to occur , -- other contributing factors affecting the original slope stability.
triggering factors -- oversteepening of slopes by erosion associated with rivers,
glaciers, or ocean waves; heavy snowmelt which saturates soil and rock; or
earthquakes that lead to the failure of weak slopes.
II
085
082
086
065
088090
064
067
026
069
066
074
080
079
047
071
073
055
084
042
070
081
049
072
050
062060
061
083
059
045
068078
054
048
058
057
046
053
063
041
051
040
028
075
052
077
089
091
087
076
88°42'30"E
88°40'0"E
88°40'0"E
88°37'30"E
88°37'30"E
88°35'0"E
88°35'0"E
88°32'30"E
88°32'30"E
88°30'0"E
88°30'0"E
88°27'30"E
88°27'30"E
88°25'0"E
88°25'0"E
88°22'30"E
88°22'30"E
88°20'0"E
88°20'0"E
27°7'30"N27°7'30"N
27°5'0"N27°5'0"N
27°2'30"N27°2'30"N
27°0'0"N27°0'0"N
26°57'30"N26°57'30"N
26°55'0"N26°55'0"N
26°52'30"N26°52'30"N
26°50'0"N26°50'0"N
1:214,675Scale0 4 8 12 162
Kilometers
±C.
LO
CK
AL
P
C.
D
.
BL
OC
K
GO
RU
BA
TH
AN
RI C T
JA
C.
.
BL
AN
GL
I
RA
NG
LO
C
S
AX
AL
BA
RI
JL. NO. MOUZA NAME JL. NO. MOUZA NAME040 KAFFIR FOREST 063 PEMLING FOREST059 SLOK BHIR KHAS MAHAL 061 LULAGAON KHAS MAHAL058 YOKPRINTAM KHAS MAHAL 064 PEMLING KHAS MAHAL087 CHUNA BHATIBAZAR D.I.F. 060 SAMAL BONG KHAS MAHAL089 UTTAR FULBARI KHAS MAHAL 071 TUNANG FOREST085 MANG PONG FOREST 062 LULAGAON FOREST086 LISH FOREST 074 RIYONG FOREST084 PANBU FOREST 041 KAFFIR KHAS MAHAL090 RAMTHI FOREST 073 RING KING PONG FOREST088 CHURANTHI FOREST 072 COMESI FOREST066 NOBGAON KHAS MAHAL 042 KANKE BONG KHAS MAHAL081 LISHCATCHMENT AREA FOREST 054 TASHIDING FOREST083 GULLING FOREST 057 BONG KHAS MAHAL082 YANG MAKUM KHAS MAHAL 052 TISTA BAZAR D.I.F.067 PARINGAR KHAS MAHAL 051 MANGBER FOREST091 SUNTALAYKHAS MAHAL 053 MANGWA FOREST076 RAMBI BAZAR D.I.F. 055 KALIMPONG KHAS MAHAL065 NIMBONG KHAS MAHAL II KALIMPONG (M)069 SAMETHERKHAS MAHAL 046 PUDUNG KHAS MAHAL068 SAMTHER FOREST 048 DUNGRA KHAS MAHAL080 SURUK KHAS MAHAL 047 SINDIBONG KHAS MAHAL078 BIRIK FOREST 045 ICHA KHAS MAHAL075 TURZAM FOREST 050 KALIMPONG DANSONG FOREST077 RIAYANG RAILWAY STATION 028 HOMES ST.AND GRAIHMS079 MAZEOK FOREST 049 BHALUKHOP KHAS MAHAL070 SINGI KHAS MAHAL 026 BHALUKHOP FOREST
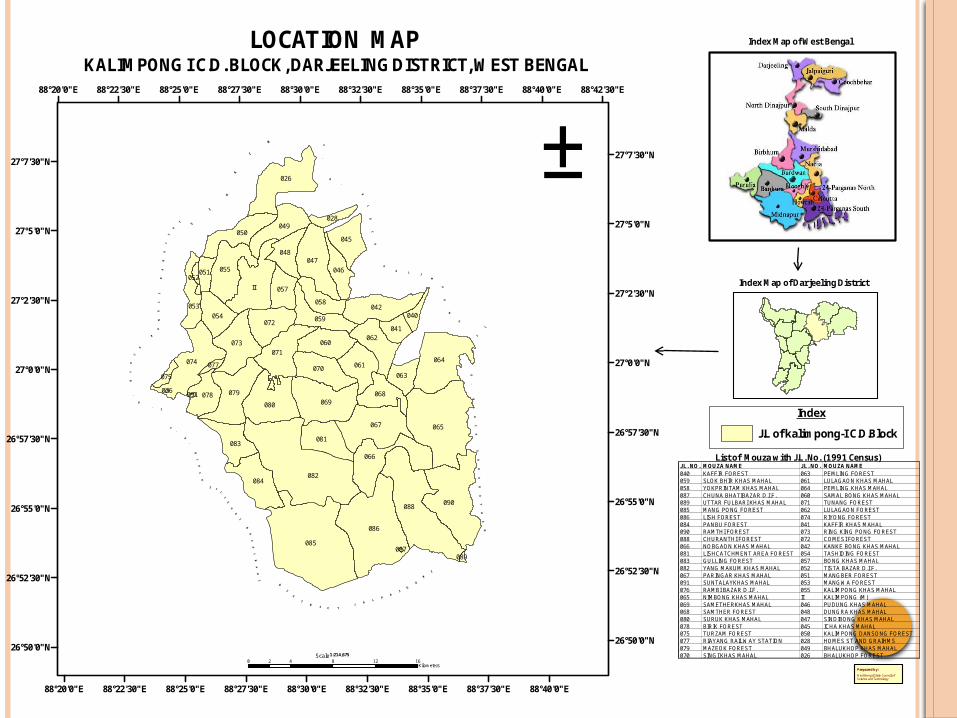
Index Map of Darjeeling District
List of Mouza with J.L. No. (1991 Census)
West Bengal State Council of Science and Technology
Prepared by:
Index
J.L of kalimpong-I C.D.Block
Index Map of West BengalLOCATION MAP KALIMPONG I C.D. BLOCK, DARJEELING DISTRICT, WEST BENGAL
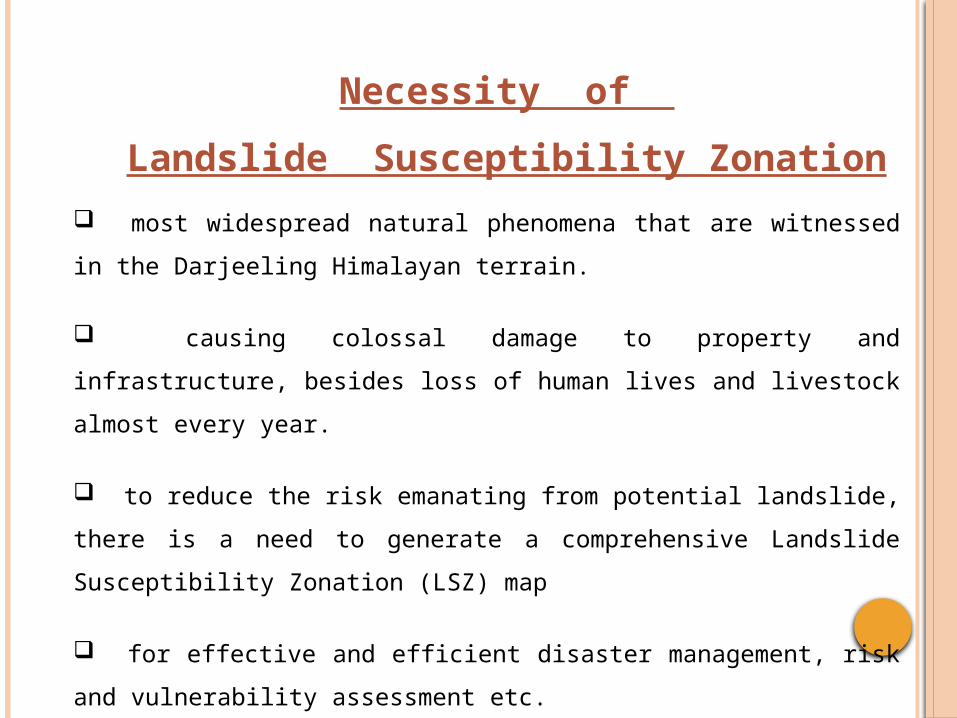
Necessity of
Landslide Susceptibility Zonation
most widespread natural phenomena that are witnessed in the Darjeeling
Himalayan terrain.
causing colossal damage to property and infrastructure, besides loss of
human lives and livestock almost every year.
to reduce the risk emanating from potential landslide, there is a need to
generate a comprehensive Landslide Susceptibility Zonation (LSZ) map
for effective and efficient disaster management, risk and vulnerability
assessment etc.

Methods of landslide susceptibility zonation :
Information Value method
Index Overlay
Weight of Evidence
fuzzy logic
Analytic Hierarchy Process
Artificial Neural Network
“ The Analytic Hierarchy Process (AHP) is a theory of measurement
through pairwise comparisons and relies on the judgements of
experts to derive priority scales .“
- Thomas L. Saaty

Analytic hierarchy process developed by Thomas L. Saaty in 1980.
popular and widely used method for multi-criteria decision making.
Allows the use of qualitative, as well as quantitative criteria in evaluation.
Problems are decomposed into a hierarchy of criteria and alternativesProblem
Criteria 1
Criteria 1.1
Criteria 1.2
….
Criteria 2
Criteria 2.1
Criteria 2.2
…..
Criteria 3 Criteria 4
……
Alternatives 2Alternatives 1 Alternatives 3
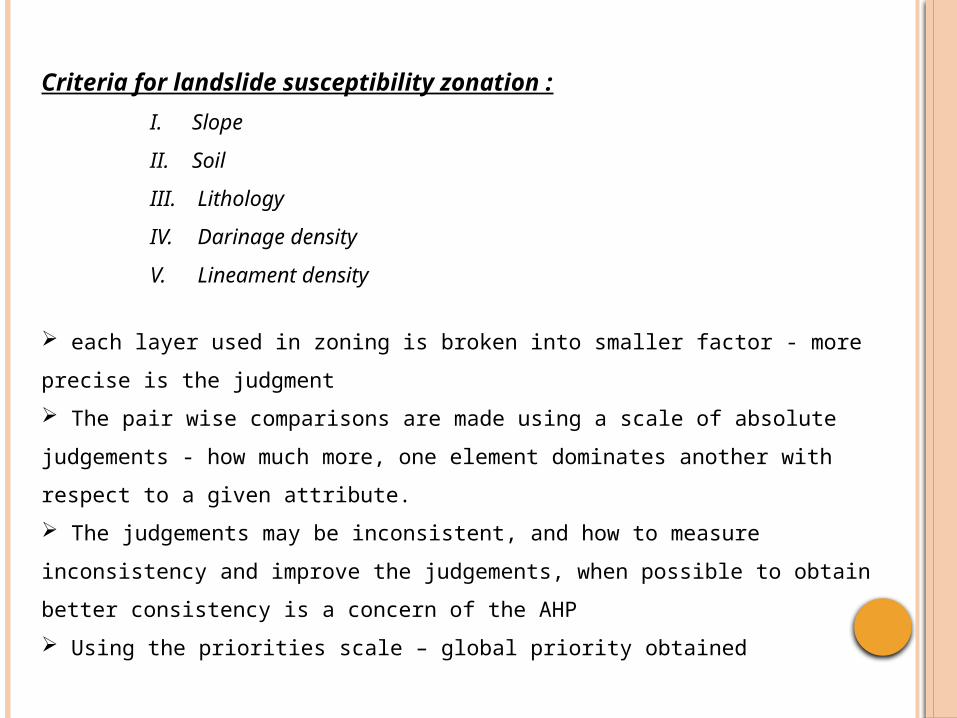
Criteria for landslide susceptibility zonation :
I. Slope
II. Soil
III. Lithology
IV. Darinage density
V. Lineament density
each layer used in zoning is broken into smaller factor - more precise is the
judgment
The pair wise comparisons are made using a scale of absolute judgements -
how much more, one element dominates another with respect to a given
attribute.
The judgements may be inconsistent, and how to measure inconsistency
and improve the judgements, when possible to obtain better consistency is a
concern of the AHP
Using the priorities scale – global priority obtained

Methodology of
Analytic Hierarchy Process
Step 1: Structure a hierarchy. Define the problem, determine the criteria and identify the alternatives.
Step 2: Make pairwise comparisons. Rate the relative importance between each pair of decision alternatives and criteria.
Step 3: Synthesize the results to determine the best alternative. Obtain the final results.
Step 4: Check for consistancy
Both qualitative and quantitative information can be compared using informed judgements to derive weights and priorities.

Landslide Susceptibility Zonation
using
Analytic Hierarchy Process
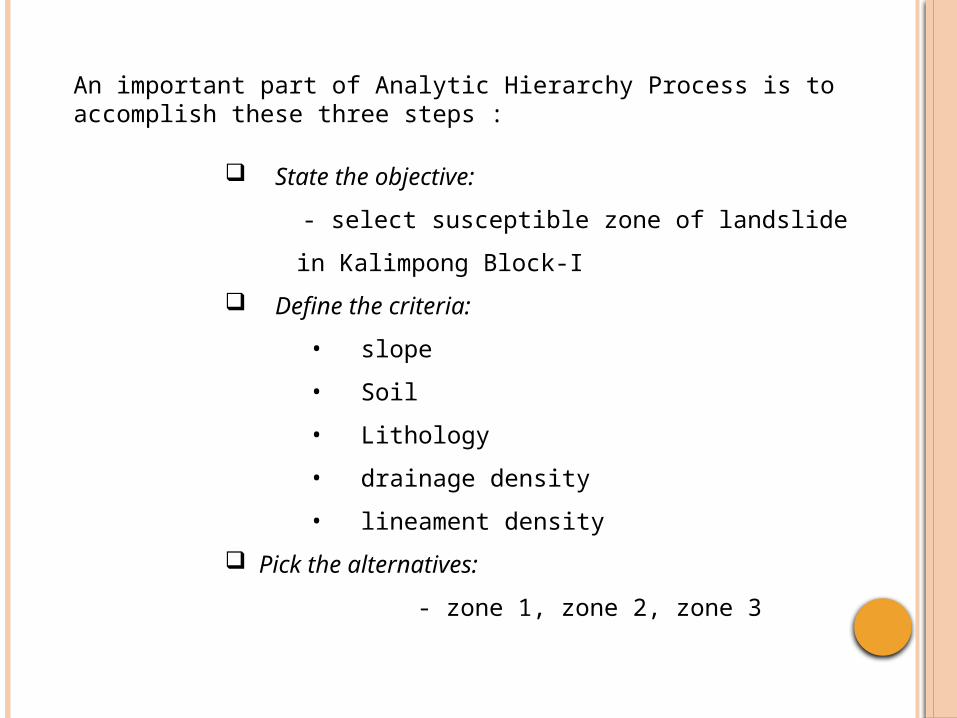
An important part of Analytic Hierarchy Process is to accomplish these three steps :
State the objective:
- select susceptible zone of landslide in
Kalimpong Block-I
Define the criteria:
• slope
• Soil
• Lithology
• drainage density
• lineament density
Pick the alternatives:
- zone 1, zone 2, zone 3

This information is then arranged in hierarchical tree
Select landslide susceptabile zones
Slope Soil Lithology
Lineament Density
Drainage Density
Objective
Criteria
Alternatives
Zone 1 Zone 2 Zone 3
the information is then synthesized to determine relative rankings of alternatives
both qualitative and quantitative criteria can be compared using informed judgments
to derive weights and priorities
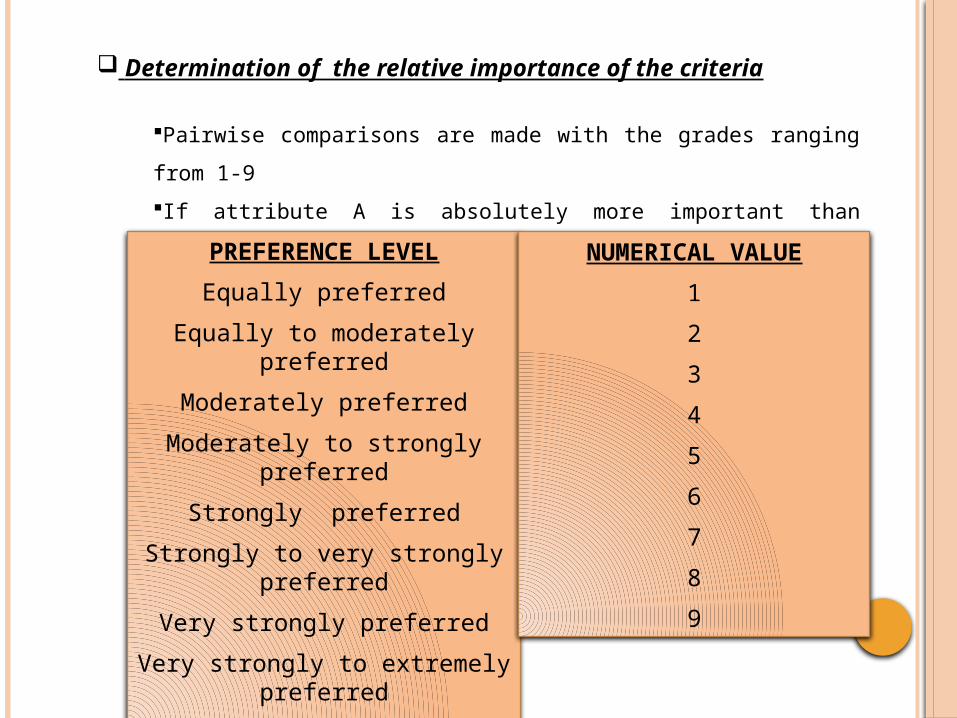
Determination of the relative importance of the criteria
Pairwise comparisons are made with the grades ranging from 1-9
If attribute A is absolutely more important than attribute B and is
rated at 9, then B must be absolutely less important than A and is
valued at 1/9.PREFERENCE LEVEL
Equally preferred
Equally to moderately preferred
Moderately preferred
Moderately to strongly preferred
Strongly preferred
Strongly to very strongly preferred
Very strongly preferred
Very strongly to extremely preferred
Extremely preferred
NUMERICAL VALUE
1
2
3
4
5
6
7
8
9

Getting a ranking of priorities from a pairwise matrix :
EIGENVECTOR
[ Dr. Thomas L. Saaty, currently with the university of pittsburgh,
demonstrated mathematically that the eigenvector solution was
the best ]
Reference : the analytic hierarchy process, 1990, Thomas L.
Saaty

Steps to obtain the eigenvector:
to obtain this ranking is to raise the pairwise matrix to
powers that are successively squared each time.
the row sums are then calculated and normalized.
The sum of priority criteria vector is one
The largest value in the priority weight is the most
important criterion
when the difference between these sums in two
consecutive calculations is smaller than a prescribed
value - calculation stop
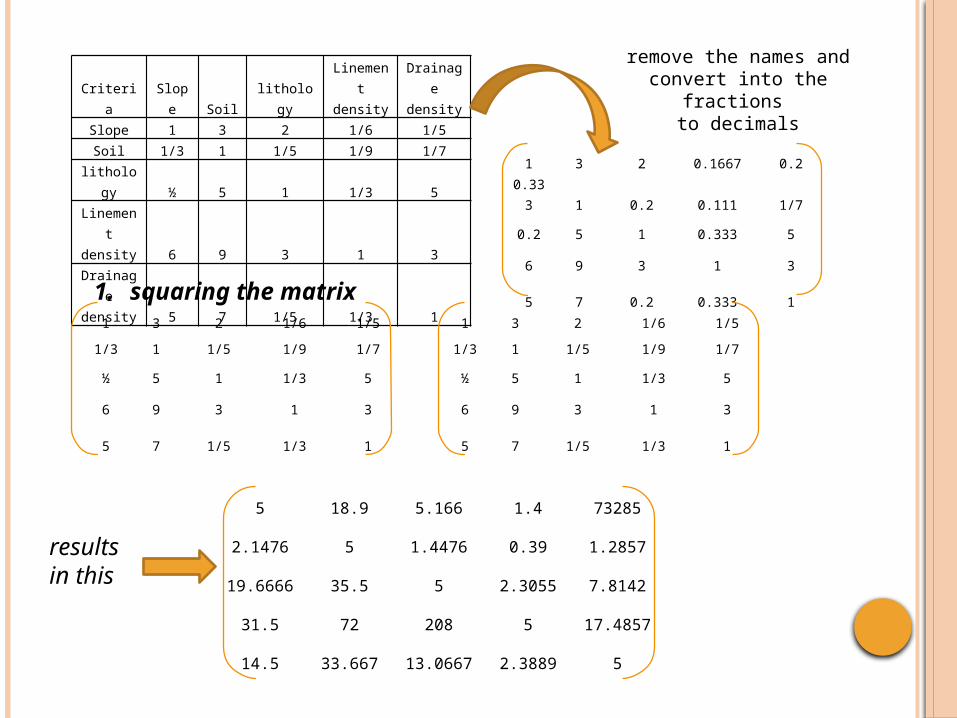
Criteria Slope Soil lithologyLinement
densityDrainage density
Slope 1 3 2 1/6 1/5
Soil 1/3 1 1/5 1/9 1/7
lithology ½ 5 1 1/3 5
Linement density 6 9 3 1 3
Drainage density 5 7 1/5 1/3 1
1 3 2 0.1667 0.2
0.333 1 0.2 0.111 1/7
0.2 5 1 0.333 5
6 9 3 1 3
5 7 0.2 0.333 1
remove the names andconvert into the
fractions to decimals
1 3 2 1/6 1/5
1/3 1 1/5 1/9 1/7
½ 5 1 1/3 5
6 9 3 1 3
5 7 1/5 1/3 1
1. squaring the matrix1 3 2 1/6 1/5
1/3 1 1/5 1/9 1/7
½ 5 1 1/3 5
6 9 3 1 3
5 7 1/5 1/3 1
resultsin this
5 18.9 5.166 1.4 73285
2.1476 5 1.4476 0.39 1.2857
19.6666 35.5 5 2.3055 7.8142
31.5 72 208 5 17.4857
14.5 33.667 13.0667 2.3889 5
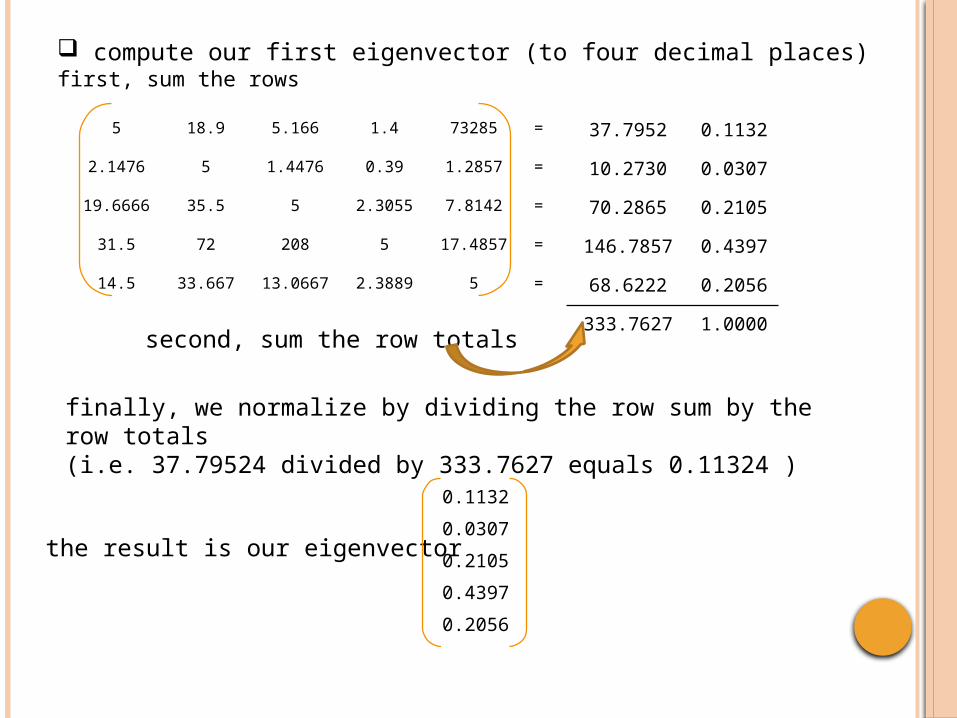
compute our first eigenvector (to four decimal places)first, sum the rows
5 18.9 5.166 1.4 73285
2.1476 5 1.4476 0.39 1.2857
19.6666 35.5 5 2.3055 7.8142
31.5 72 208 5 17.4857
14.5 33.667 13.0667 2.3889 5
= 37.7952 0.1132
= 10.2730 0.0307
= 70.2865 0.2105
= 146.7857 0.4397
= 68.6222 0.2056
333.7627 1.0000second, sum the row totals
finally, we normalize by dividing the row sum by the row totals(i.e. 37.79524 divided by 333.7627 equals 0.11324 )
the result is our eigenvector
0.1132
0.0307
0.2105
0.4397
0.2056
5 18.9 5.166 1.4 73285
2.1476 5 1.4476 0.39 1.2857
19.6666
35.5 5 2.3055 7.8142
31.5 72 208 5 17.4857
14.5 33.667 13.0667
2.3889 5
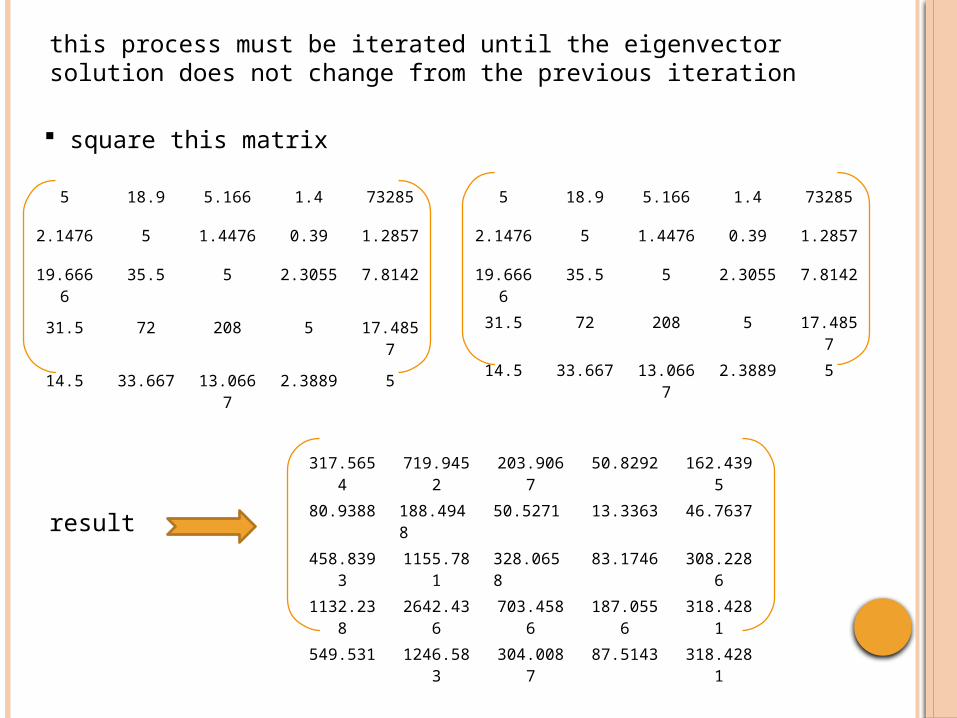
this process must be iterated until the eigenvector solution does not change from the previous iteration
5 18.9 5.166 1.4 73285
2.1476 5 1.4476 0.39 1.2857
19.6666
35.5 5 2.3055 7.8142
31.5 72 208 5 17.4857
14.5 33.667 13.0667
2.3889 5
square this matrix
317.5654
719.9452
203.9067
50.8292 162.4395
80.9388 188.4948
50.5271 13.3363 46.7637
458.8393
1155.781
328.0658
83.1746 308.2286
1132.238
2642.436
703.4586
187.0556
318.4281
549.531 1246.583
304.0087
87.5143 318.4281
result
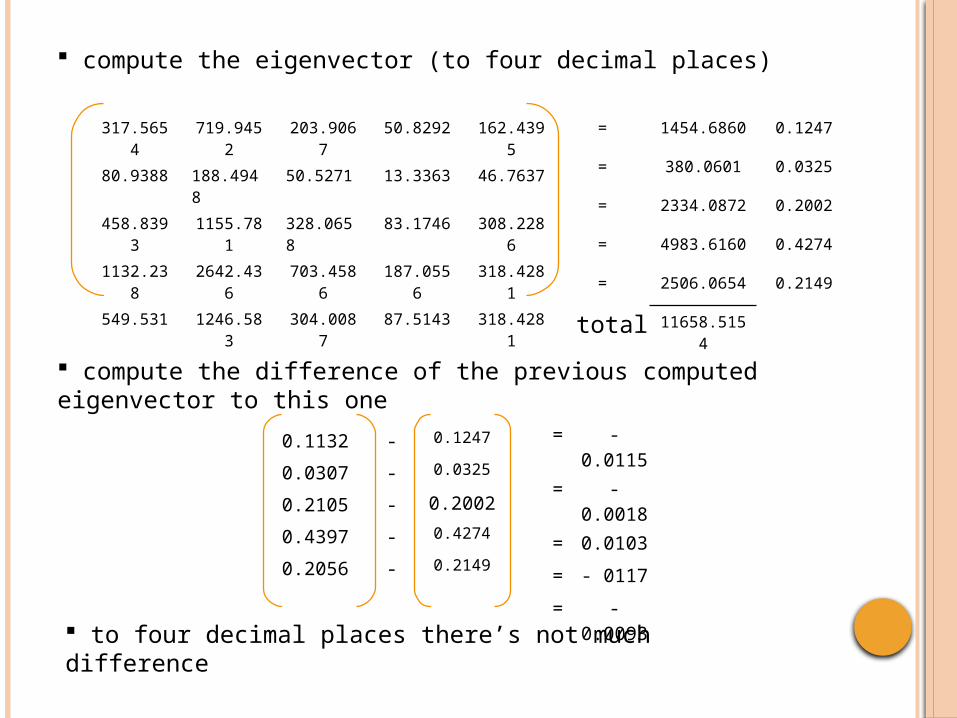
compute the eigenvector (to four decimal places)
317.5654
719.9452
203.9067
50.8292 162.4395
80.9388 188.4948
50.5271 13.3363 46.7637
458.8393
1155.781
328.0658
83.1746 308.2286
1132.238
2642.436
703.4586
187.0556
318.4281
549.531 1246.583
304.0087
87.5143 318.4281
= 1454.6860 0.1247
= 380.0601 0.0325
= 2334.0872 0.2002
= 4983.6160 0.4274
= 2506.0654 0.2149
11658.5154
total
compute the difference of the previous computed eigenvector to this one
0.1132 -
0.0307 -
0.2105 -
0.4397 -
0.2056 -
0.1247
0.0325
0.2002
0.4274
0.2149
= -0.0115
= - 0.0018
= 0.0103
= - 0117
= - 0.0093
to four decimal places there’s not much difference

Criteria Slope Soil lithologyLinement density
Drainage density
Slope 1 3 2 1/6 1/5
Soil 1/3 1 1/5 1/9 1/7
lithology ½ 5 1 1/3 5
Linement density 6 9 3 1 3
Drainage density 5 7 1/5 1/3 1
o computed eigenvector gives us the relative ranking of our criteria
Slope 0.1132
Soil 0.0307
lithology 0.2105
Linement density0.4397
Drainage density0.2056
the most important criterion
the least important criterion
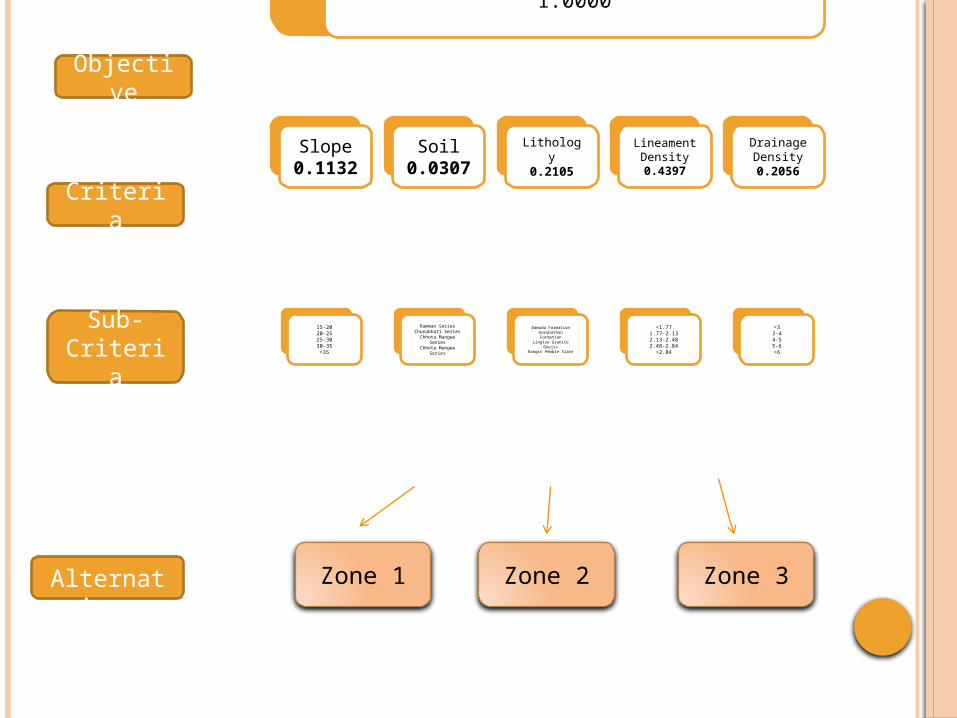
Select landslide susceptabile zones1.0000
Slope0.1132
15-2020-2525-3030-35>35
Soil0.0307
Ramman SeriesChunabhati Series
Chhota Mangwa SeriesChhota Mangwa Series
Lithology0.2105
Damuda FormationGorubathan Formation
Lingtse Granite GneissRangit Pebble Slate
Lineament Density0.4397
<1.771.77-2.132.13-2.482.48-2.84>2.84
Drainage Density0.2056
<33-44-55-6>6
Objective
Criteria
Alternatives
Sub- Criteria
Zone 1 Zone 2 Zone 3

In terms of sub-criteria, pairwise comparisons determines the preference of each alternative over another
15-20 20-25
25-30
30-35
>35
15-20 1 1/3 1/7 1/9 1/7
20-25 3 1 1/3 1/7 1/6
25-30 7 3 1 1/4 1/6
30-35 9 7 4 1 1/5
>35 7 6 6 5 1
SLOPE RANGE
Soil Series Ramman Chunabhat
i Chhota Mangwa Barbung
Ramman Series 1 1/3 1/6 1/8
Chunabhati Series 3 1 1/4 1/6
Chhota Mangwa Series 6 4 1 1/3
Barbung Series 8 6 3 1
SOIL
DRAINAGE DENSITY(km/sq
km) <3 3-4 4-5 5-6 >6
<3 1 1/3 1/5 1/9 1/7
3-4 3 1 1/5 1/7 1/5
4-5 5 5 1 1/3 1/5
5-6 9 7 3 1 1/3
>6 7 5 5 3 1
DRAINAGE DENSITY
LINEAMENT DENSITY
(km/sq km) <1.771.77-2.13
2.13-2.48 2.48-2.84 >2.84
<1.77 1 1/2 1/3 1/5 1/71.77-2.13 2 1 1/5 1/7 1/92.13-2.48 3 5 1 1/3 1/52.48-2.84 5 7 3 1 1/3
>2.84 7 9 5 3 1
LINEAMENT DENSITY
lithology Damuda Gorubathan Lingtse RangitDamuda Formation 1 3 9 3
Gorubathan Formation 1/3 1 7 ½Lingtse Granite Gneiss 1/9 1/7 1 1/7
Rangit Pebble Slate 1/3 2 7 1
LITHOLOGY
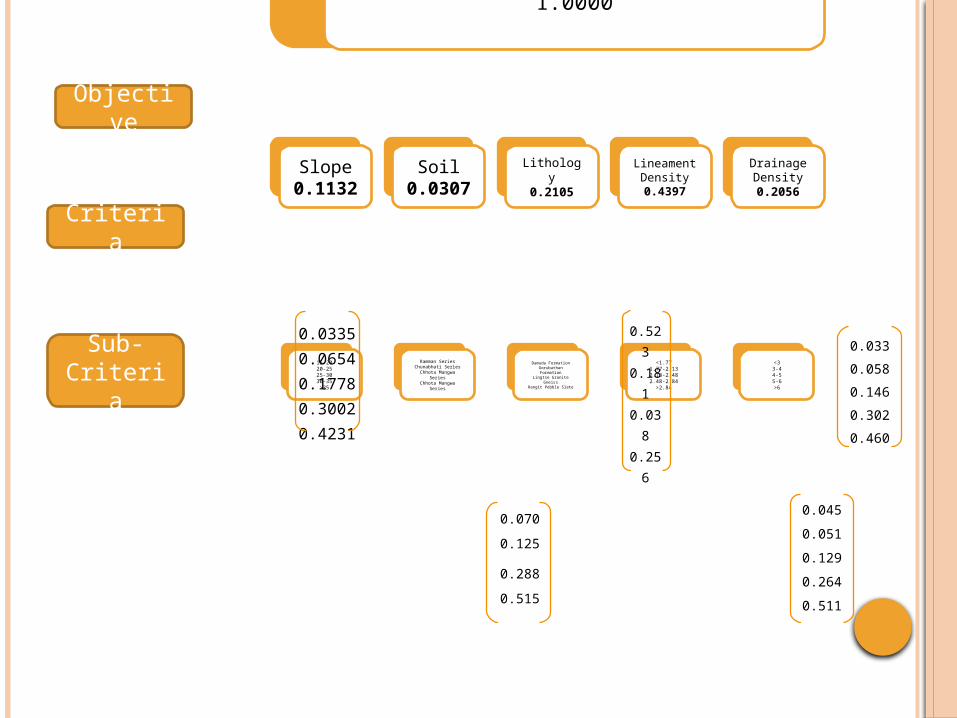
Select landslide susceptabile zones1.0000
Slope0.1132
15-2020-2525-3030-35>35
Soil0.0307
Ramman SeriesChunabhati Series
Chhota Mangwa SeriesChhota Mangwa Series
Lithology0.2105
Damuda FormationGorubathan Formation
Lingtse Granite GneissRangit Pebble Slate
Lineament Density0.4397
<1.771.77-2.132.13-2.482.48-2.84>2.84
Drainage Density0.2056
<33-44-55-6>6
Objective
Criteria
Sub- Criteria
0.03350.06540.17780.30020.4231
0.070
0.125
0.288
0.515
0.523
0.181
0.038
0.256
0.045
0.051
0.129
0.264
0.511
0.033
0.058
0.146
0.302
0.460

Step 3 – Checking for consistency
Consistency Index (CI) : The degree of logical consistency among pair-wise comparisons. CI =
Suppose, Ax = max x ; where x is the priority vector
1 3 2 1/6 1/5
1/3 1 1/5 1/9 1/7
½ 5 1 1/3 5
6 9 3 1 3
5 7 1/5 1/3 1
0.7207
0.0549
2.4277
9.6734
2.7824
= = λmax
0.0335
0.0654
0.1778
0.3002
0.4231
x
λmax=average{0.1745/0.0335, 0.3386/0.0654, 0.9201/0.1778, 1.6986/0.3002, 2.6062/0.4231 }=5.2426
Consistency index is found by CI=(λmax-n)/(n-1)=(5.2426-5)/(5-1)= 0.0606
0.1132
0.0307
0.2105
0.4397
0.2056

Consistency Ratio (CR) : indicates the amount of allowed inconsistency in the pair-wise comparison . CR =
CI = Consistency IndexRI= Random Index
Randon Index table :
• upper row is the order of the random matrix• lower is the corresponding index of consistency for random judgements.
An inconsistency of 10% or less implies that the adjustment is small compared to the actual values of the eigenvector entries. A CR as high as, say, 90% would mean that the pairwise judgements are just about random and are completely untrustworthy
CR = CI / 1.12 = 0.0606 / 1.12 = 0.0541 (value of Consistency Index is less than 0.1, so the evaluations are consistent)
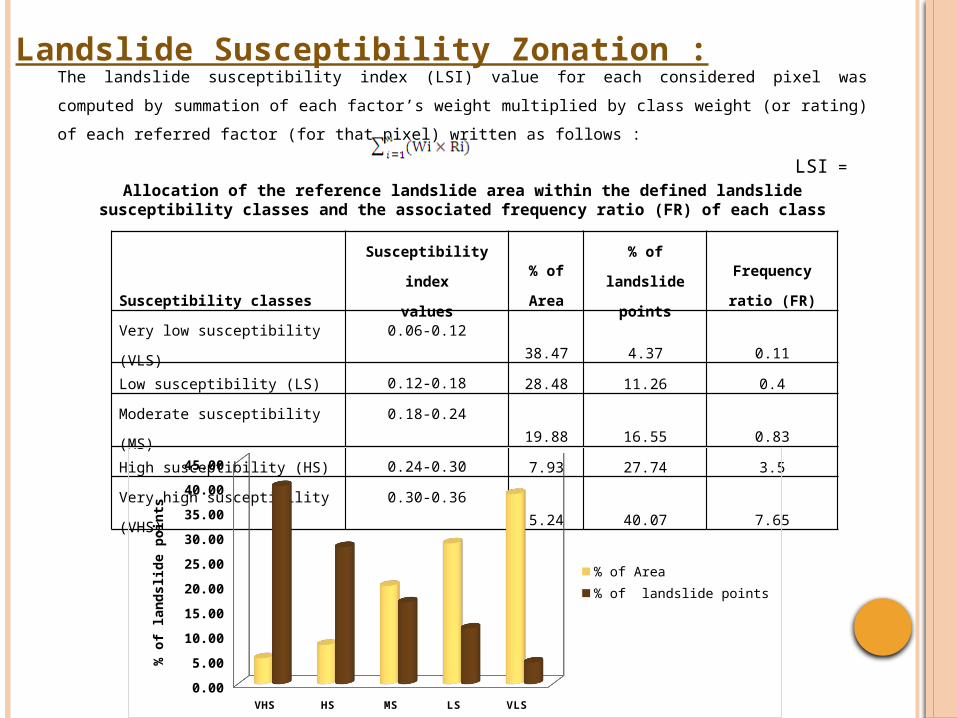
The landslide susceptibility index (LSI) value for each considered pixel was computed by summation of each factor ’s
weight multiplied by class weight (or rating) of each referred factor (for that pixel) written as follows :
LSI =
Susceptibility classes
Susceptibility index
values% of
Area
% of landslide
points
Frequency ratio
(FR)
Very low susceptibility (VLS) 0.06-0.12 38.47 4.37 0.11
Low susceptibility (LS) 0.12-0.18 28.48 11.26 0.4
Moderate susceptibility (MS) 0.18-0.24 19.88 16.55 0.83
High susceptibility (HS) 0.24-0.30 7.93 27.74 3.5
Very high susceptibility (VHS) 0.30-0.36 5.24 40.07 7.65
Landslide Susceptibility Zonation :
Allocation of the reference landslide area within the defined landslide susceptibility classes and the associated frequency ratio (FR) of each class
VHS HS MS LS VLS0.00
5.00
10.00
15.00
20.00
25.00
30.00
35.00
40.00
45.00
% of Area% of landslide points
% o
f la
ndslide p
oin
ts

88°40'30"E
88°40'30"E
88°37'30"E
88°37'30"E
88°34'30"E
88°34'30"E
88°31'30"E
88°31'30"E
88°28'30"E
88°28'30"E
88°25'30"E
88°25'30"E
88°22'30"E
88°22'30"E
27°7'30"N 27°7'30"N
27°6'0"N 27°6'0"N
27°4'30"N 27°4'30"N
27°3'0"N 27°3'0"N
27°1'30"N 27°1'30"N
27°0'0"N 27°0'0"N
26°58'30"N 26°58'30"N
26°57'0"N 26°57'0"N
26°55'30"N 26°55'30"N
26°54'0"N 26°54'0"N
26°52'30"N 26°52'30"N
LANDSLIDE SUSCEPTIBILITY ZONATIONUSING
ANALYTICAL HIERARCHY PROCESS
Landslide distribution map of Kalimpong-I Block,Darjeeling District
µ
0 3 6 91.5Kilometers
INDEXLandslide Susceptibility
zonation
Very Low
Low
Moderate
High
Very High
KALIMPONG -I C.D. BLOCK, DARJEELING DISTRICT, WEST BENGAL

Thank you