lss.fnal.gov...abstract a hybrid emulsion-spectrometer experiment (e531) was performed in the...
TRANSCRIPT
ABSTRACT
A hybrid emulsion-spectrometer experiment (E531) was
performed in the wide-band neutrino beam line at the Fermi
National Accelerator Laboratory in Batavia, Illinois, U.S.A. The
primary purpose of this experiment was to measure the lifetimes
of weakly decaying, charmed particles. 1248 neutrino and
antineutrino interactions were located of which 23 were
reconstructed as charged, charmed candidates. From these 23
events the lifetime of the o+ meson was determined to be
11.s~tfi x lo-13 s, of the F+ meson to be 1 9+1. 3 • -0.7 x lo-13 s, and
of the A6 baryon to be 2 3+1.0 • -0.7 x lo-13 s •
The mass of the F+ meson is measured to be 2057.±.39 MeV/c 2 •
r /\+ r* A+ +* + o Candidates for the decays L-c -> c7T, L-c -> ''c7T, D -> D 'TT,
and F* -> FY are also observed.

LIFETIME MEASUREMENTS OF THE
Dale Barbara Pitman
A Thesis submitted in conformity with the requirements
for the Degree of Doctor of Philosophy in the
University of Toronto
@) Dale Barbara Pitman
1982

ACKNOWLEDGEMENTS
I am grateful to the members of the collaboration
who have made the experiment the success it has been.
Anthony Kiang and Stephen Bracker, without whom the
Toronto group and the experiment as a whole could not
have managed, and John Martin and Steve Errede, who have
inspired me with their enthusiasm, are to be thanked.
To have known Jim Prentice as my professor and
friend has been my good fortune. I am grateful for the
many kindnesses he has shown me, his inspiration, and
his guidance.
David Bailey, my accomplice in whatever mischief
was brought to the experiment during the months of data
taking, who has more recently dispensed wisdom on a
kaleidoscope of topics, deserves special thanks.
To my parents, I am thankful for their support.
Lastly, there is Thomas, without whom I could not
have written this thesis.

List of Collaborators
N. Ushida. Department of Physics, Aichi University of Education, Igaya-cho, Kariya, Aichi 448, Japan.
T. Kondo. Fermi National Accelerator Laboratory, Batavia, Illinois 60510, U.S.A.
F. Fujioka, H. Fukushima, Y. Takahashi, s. Tatsumi, and C. Yokoyama. Physics Department, Kobe University, Rokkadai, Nada, Kobe 657, Japan.
Y. Homma and Y. Tsuzuki. Faculty of Arts, Kobe University, Tsurukabuto, Nada, Kobe 657, Japan.
s. Bahk, C. Kim, J. Park, and J. Song. Department of Physics, Korea University, Seoul 132, Korea.
D. Bailey, s. Conetti, J. Fischer, and J. Trischuk. Department of Physics, McGill University, Montreal, Quebec H3A 2T8, Canada.
H. Fuchi, K. Hoshino, M. Miyanishi, K. Niu, K. Niwa, H. Shibuya, and Y. Yanagisawa. Department of Physics, Nagoya University, Furo-Cho, Chikusa-Ku, Nagoya 464, Japan.
S. Errede, M. Gutzwiller, S. Kuramata, N. Reay, K. Reibel, T. Romanowski, R. Sidwell, and N. Stanton. Physics Department, The Ohio State University, Columbus, Ohio 43210, U.S.A.
K. Moriyama and H. Shibata. Physics Department, Okayama University, Okayama, Japan.
T. Hara, O. Kusumoto, Y. Noguchi, and M. Teranaka. Physics Department, Osaka City University, Sugimoto-Cho, Sumiyoshi-Ku, Osaka 558, Japan.

H. Okabe and J. Yokota. Science Education Institute of Osaka Prefecture, Kari ta-Cho 4, Sumiyoshi-Ku, Osaka 558, Japan.
J. Harnois, c. Hebert, J. Hebert, s. Lokanathan, and B. McLeod. Department of Physics, University of Ottawa, Ottawa, Ontario, Canada.
s. Tasaka. Institute for Cosmic Ray Research, University of Tokyo, Tokyo, Japan.
P. Davis, J. Martin, D. Pitman, J. Prentice, P. Sinervo, and T. Yoon. Physics Department, University of Toronto, Toronto, Ontario M5S lA 7 , Canada.
H. Kimura and Y. Maeda. Faculty of Education, Yokohama National University, Hodogaya-Ku, Yokohama, Japan.

TABLE OF CONTENTS
1. AN HISTORICAL PERSPECTIVE
2. THEORY
2.1 Production of Charm Quarks by Neutrinos 2.2 Decays of Charmed Particles (Low-lying States) 2.3 Decays of Charmed Particles (High Mass States)
3. EQUIPMENT
3.1 3.2 3.3 3.4 3.5
3.6 3.7 3.8 3.9 3.10
Neutrino Beam Line Emulsion Anti-coincidence Counter Time of Flight Drift Chambers 3.5.1 Upstream Chambers 3.5.2 Downstream Chambers 3.5.3 Drift Chamber Electronic Data Collection
System 3.5.4 Calibration of Drift Chambers Magnet and Momentum Measurements Lead Glass Hadron Calorimeter Muon Identification Counters
Data Acquisition
i
Page
1
11
16 20 27
28
31 34 41 42 46 46 50 52
53 54 56 60 62 65

4. RESULTS 69
4.1 Reconstructed and Calculated Neutrino Event Samples 70 4.2 Emulsion Processing 73
5. DATA ANALYSIS
5.1 Neutrino Event Reconstruction Programs 5.2 Search for Neutrino Events in the Emulsion 5.3 Search for Charged Decays
5.3.1 Horizontal Emulsion Modules 5.3.2 Vertical Emulsion Modules
5.4 Search for Neutral Decays 5.4.1 Horizontal Emulsion Modules 5.4.2 Vertical Emulsion Modules 5.4.3 Overall Scanning Efficiencies
5.5 Backgrounds to Charm Decays 5.6 Analysis of Events with Short Decays
6. LIFETIME AND MASS CALCULATIONS
6 .1 The F± 6. 2 The A; 6.3 The D 6.4 The Exotics 6.5 The Other Multi-prong ~vents
7. A SUMMARY
APPENDIX A. CHARM EVENTS
ii
76
76 80 85 85 85 88 88 90 91 95 98
111
112 119 126 134 135
137
140

FIGURE 1. FIGURE 2. FIGURE 3. FIGURE 4. FIGURE 5. FIGURE 6. FIGURE 7. FIGURE 8. FIGURE 9. FIGURE 10. FIGURE 11. FIGURE 12. FIGURE 13. FIGURE 14. FIGURE 15. FIGURE 16.
FIGURE 17. FIGURE 18. FIGURE 19. FIGURE 20. FIGURE 21. FIGURE 22.
FIGURE 23.
FIGURE 24.
FIGURE 25.
FIGURE 26. FIGURE 27. FIGURE 28. FIGURE 29. FIGURE 30.
FIGURE 31.
FIGURE 32.
LIST OF FIGURES
The Low-lying SU(4) hadrons. K0 -:K0 mixing. Emission of the W boson. Neutral Current Processes. Decay of the W boson. Muon Decay and Charm Decay. Spectator Charm Decay. Alternative Charm Decay Mechanisms. Side View of the E531 apparatus. The Fermilab Neutrino Beam Line. The Neutrino Energy Spectrum. Placement of the Emulsion in the Beam Line. The Emulsion. The Time of Flight I Counter. The Time of Flight II Counter. Placement of the Upstream Chambers in the Beam Line. Cross-section of a Drift Chamber Cell. The Lead Glass Array. The Hadron Calorimeter. The Muon Detector. The Relative Timing of the Triggers. The Distribution of the Number of Reconstructed Tracks per Event. Z Coordinates of Found Events in the Emulsion Target. Differences between Predicted and Found Vertex Coordinates. Track Following Efficiency for Tracks of Various Angles. Charged Scanning Efficiency. Neutral Scanning Efficiency. Mass Spectrum Observed by Time of Flight. Relative Ionization Loss in Emulsion. Photomicrographs of Charged and Neutral Charm Candidates. Gaussian Ideograms of the Masses of Fitted F± Decays. Gaussian Ideograms of the Masses of Cabibbof avoured F± Decay Modes.
iii
4 7
17 18 21 23 24 25 30 33 35 37 38 43 44 47
49 58 61 64 66 79
82
84
86
93 94
102 103 113
115
116

FIGURE 33. Gaussian Ideograms of the Invariant /\67T 122 Mass Combinations.
I\+ + FIGURE 34. Gaussian Ideograms of the Invariant c7T Mass 123 Combinations.
I\+ -FIGURE 35. Gaussian Ideograms of the Invariant c7T Mass 124 Combinations.
a Restricted Set of /\+7T FIGURE 36. Gaussian Ideograms of 125 Ihvariant Masses. c
FIGURE 37. The 2-Dimensional Maximum Likelihood Function. 130 FIGURE 38. A Contour Plot of the Likelihood Function. 131 FIGURE 39. * . 133 Gaussian Ideograms of the D ~ D1T Mass
Combinations.
iv
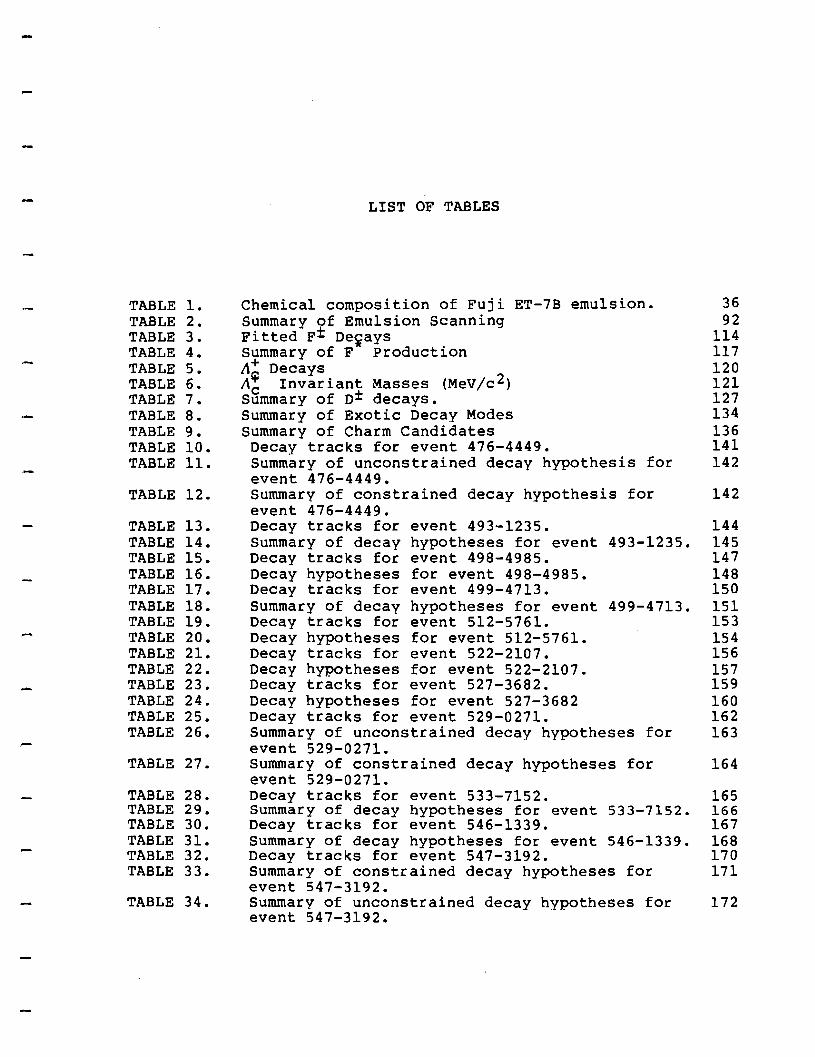
TABLE 1. TABLE 2. TABLE 3. TABLE 4. TABLE 5. TABLE 6. TABLE 7. TABLE 8. TABLE 9. TABLE 10. TABLE 11.
TABLE 12.
TABLE 13. TABLE 14. TABLE 15. TABLE 16. TABLE 17. TABLE 18. TABLE 19. TABLE 20. TABLE 21. TABLE 22. TABLE 23. TABLE 24. TABLE 25. TABLE 26.
TABLE 27.
TABLE 28. TABLE 29. TABLE 30. TABLE 31. TABLE 32. TABLE 33.
TABLE 34.
LIST OF TABLES
Chemical composition of Fuji ET-7B emulsion. 36 Summary of Emulsion Scanning 92 Fitted p± De~ays 114 summary of F Production 117 A+ Decays 120 A~ Invariant Masses (MeV/c2) 121 Summary of D± decays. 127 Summary of Exotic Decay Modes 134 summary of Charm Candidates 136
Decay tracks for event 476-4449. 141 Summary of unconstrained decay hypothesis for 142 event 476-4449. Summary of constrained decay hypothesis for 142 event 476-4449. Decay tracks for event 493-1235. 144 summary of decay hypotheses for event 493-1235. 145 Decay tracks for event 498-4985. 147 Decay hypotheses for event 498-4985. 148 Decay tracks for event 499-4713. 150 Summary of decay hypotheses for event 499-4713. 151 Decay tracks for event 512-5761. 153 Decay hypotheses for event 512-5761. 154 Decay tracks for event 522-2107. 156 Decay hypotheses for event 522-2107. 157 Decay tracks for event 527-3682. 159 Decay hypotheses for event 527-3682 160 Decay tracks for event 529-0271. 162 Summary of unconstrained decay hypotheses for 163 event 529-0271. Summary of constrained decay hypotheses for 164 event 529-0271. Decay tracks for event 533-7152. 165 summary of decay hypotheses for event 533-7152. 166 Decay tracks for event 546-1339. 167 Summary of decay hypotheses for event 546-1339. 168 Decay tracks for event 547-3192. 170 Summary of constrained decay hypotheses for 171 event 547-3192. Summary of unconstrained decay hypotheses for 172 event 547-3192.
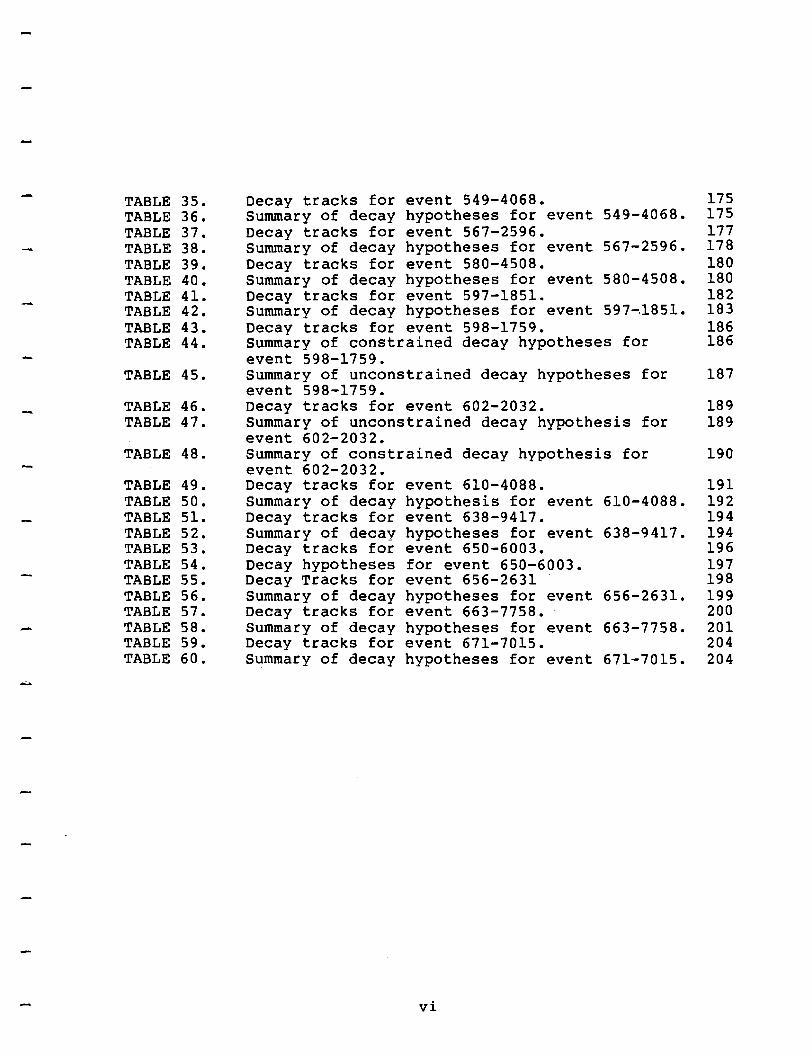
TABLE 35. Decay tracks for event 549-4068. 175 TABLE 36. Summary of decay hypotheses for event 549-4068. 175 TABLE 37. Decay tracks for event 567-2596. 177 TABLE 38. Summary of decay hypotheses for event 567-2596. 178 TABLE 39. Decay tracks for event 580-4508. 180 TABLE 40. Summary of decay hypotheses for event 580-4508. 180 TABLE 41. Decay tracks for event 597-1851. 182 TABLE 42. Summary of decay hypotheses for event 597-.1851. 183 TABLE 43. Decay tracks for event 598-1759. 186 TABLE 44. Summary of constrained decay hypotheses for 186
event 598-1759. TABLE 45. Summary of unconstrained decay hypotheses for 187
event 598-1759. TABLE 46. Decay tracks for event 602-2032. 189 TABLE 47. Summary of unconstrained decay hypothesis for 189
event 602-2032. TABLE 48. Summary of constrained decay hypothesis for 190
event 602-2032. TABLE 49. Decay tracks for event 610-4088. 191 TABLE so. Summary of decay hypothesis for event 610-4088. 192 TABLE 51. Decay tracks for event 638-9417. 194 TABLE 52. Summary of decay hypotheses for event 638-9417. 194 TABLE 53. Decay tracks for event 650-6003. 196 TABLE 54. Decay hypotheses for event 650-6003. 197 TABLE 55. Decay Tracks for event 656-2631 198 TABLE 56. Summary of decay hypotheses for event 656-2631. 199 TABLE 57. Decay tracks for event 663-7758. 200 - TABLE 58. Summary of decay hypotheses for event 663-7758. 201 TABLE 59. Decay tracks for event 671-7015. 204 TABLE 60. Summary of decay hypotheses for event 671-7015 • 204
...;;..
vi
1. AN HISTORICAL PERSPECTIVE
The experimental discovery in 1974 of the J/$, which
contains a charmed quark-antiquark pair, was in retrospect, the
first new evidence supporting the conclusions of many years of
theoretical work concerning the unification of the weak and
electromagnetic forces. Prior to 1961, it was believed that the
weak interactions were mediated by two charged, massive vector
bosons, the w+ and the w- and that the electromagnetic
interaction was mediated by a single vector boson, the photon.
Al though a unification of these two forces had been speculated
upon earlier, it was Glashow who first proposed the addition of a
neutral vector boson to the previously accepted triplet of
intermediate vector fields -- the w± and the photon -- by which
the theories could be unified [Glashow, 1961]. It was speculated
that a linear combination of the two neutral fields corresponded
to two physical particles: the photon, which accounted for
electromagnetic interactions, and a neutral intermediary which
coupled to a neutral lepton current.
Weinberg and Salam independently extended this model to
include a spin-zer~ Higgs doublet [Weinberg, 1967 and
Salam, 1968]. The model now involved the four vector fields,
-(the triplet, Wµ, , and a singlet, B), the Higgs doublet, four
1

-
leptons, (the electron, the muon, the electron neutrino and the
muon neutrino) and three quarks (now known as the u, d, and s
quarks) , which were the constituents of all the observable
hadrons known at that time. The introduction of this doublet
allowed the symmetry of the triplet and singlet to be
+ spontaneously broken, leaving two massive charged bosons (W-), a
massive neutral boson (Z 0 ), and a massless boson (the photon).
This spontaneous symmetry breaking, by which the particles are
given masses is known as the Higgs Mechanism [Higgs, 1964].
Although it was not known at the time whether the model was
renormalizable, it was later proven to be by t'Hooft and others
[t'Hooft, 1971].
The appearance of the z0 implied the existence of weak
strangeness-changing currents, which was not supported by
experimental evidence. In particular, in the Weinberg-Salam
model first order terms existed which would give a K1-K2 mass
+ splitting and contribute to unobserved decay modes such as K ->
rr+J,[, where fl is a lepton-antilepton pair. Experimental
evidence, however, implied that the K1-K 2 mass splitting should
arise from second order weak corrections.
To solve this difficulty, Glashow, Iliopoulos, and Maiani
proposed the addition of a fourth quark, c, which carried the
quantum number charm [Glashow, 1970]. (The concept of charm had
2

-
~-
been previously proposed in 1964 by Bjorken and Glashow
[Bjorken, 1964]. The authors presented the idea as a new quantum
number, violated by the weak interaction, in order to develop a
lepton-hadron symmetry.) The four-quark hadron sector could then
be constructed analogously to the lepton sector, which at that
time included the electron, the muon, and two neutrinos. The
weak current was then expressed as a combination of the lepton
and hadron currents.
In contrast to alternative _schemes being presented at that
time [Bars, 1972 and 1973 and deWit, 1974], the GIM model
appeared to be the simplest modification to the Weinberg-Salam
model and the most aesthetically pleasing. The observed
selection rules remained preserved, in contrast with the three-
quark model where a neutral current could not be introduced
without contradicting experimental observations. No induced
strangeness-changing couplings appeared in the neutral current.
Several consequences resulted from this speculation:
o The weak bosons must be massive, of order 100 GeV/c 2 , in order to have the electromagnetic and weak coupling constants of comparable magnitude:
o the weak neutral current would involve right-handed as well as left-handed terms: and
o The mass of the z0 would not be equal to the mass of the w±.
3

)
JP = 0 MESONS
Figure 1. The low-lying charm states. the C
0 as the
>
SU(4) hadrons, The ct is now
LC.
JP=~+ BARYONS
showing the predicted known as the A+ and c
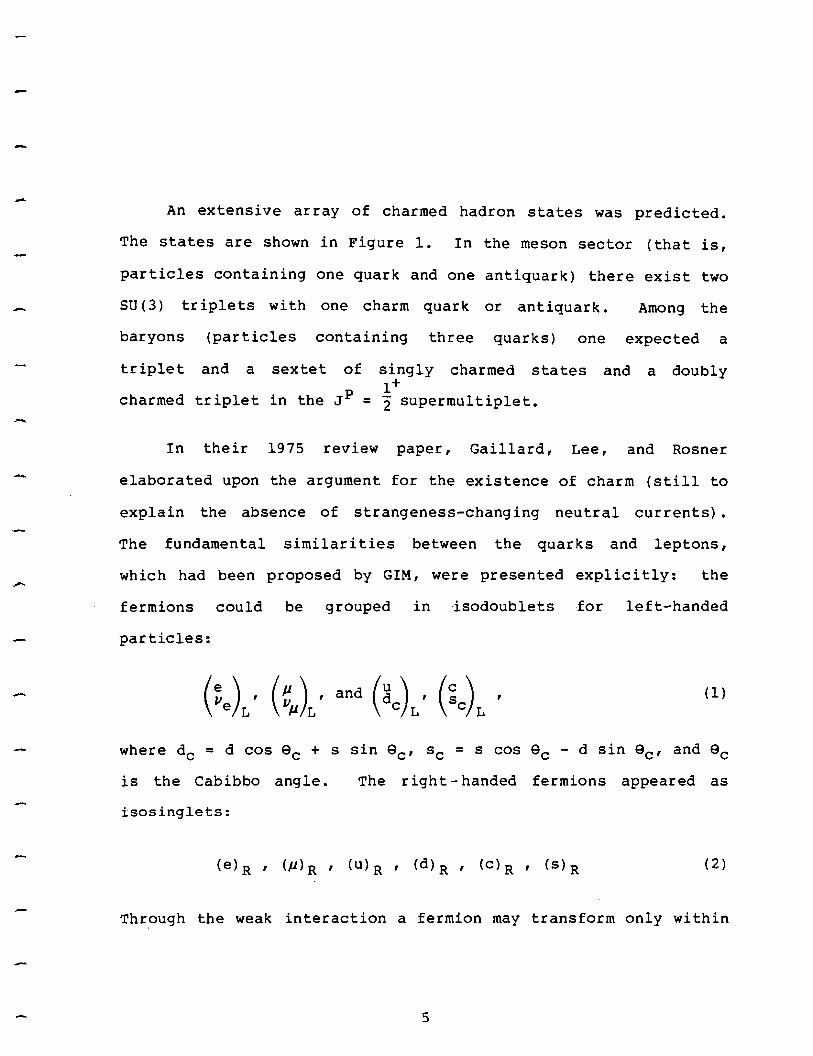
- An extensive array of charmed hadron states was predicted.
The states are shown in Figure 1. In the meson sector (that is,
particles containing one quark and one antiquark) there exist two
SU(3) triplets with one charm quark or antiquark. Among the
baryons (particles containing three quarks) one expected a
triplet and a sextet of singly charmed states and a doubly l+
charmed triplet in the JP = 2 supermultiplet.
In their 1975 review paper, Gaillard, Lee, and Rosner
elaborated upon the argument for the existence of charm (still to
explain the absence of strangeness-changing neutral currents).
The fundamental similarities between the quarks and leptons,
which had been proposed by GIM, were presented explicitly: the
fermions could be grouped in isodoublets for left-handed
particles:
(1)
is the Cabibbo angle. The right-handed fermions appeared as
isosinglets:
(e) R ' (µ) R ' (U) R ' (d) R ' (C) R ' (s) R ( 2)
Through the weak interaction a fermion may transform only within
5

-
-
its doublet. The charged vector bosons allow for transformations
of the type c -> sc. The z0 boson accounts for the transitions
u -> u, c -> c, de -> de, and sc -> sc. Thus the s quark always
appears in the neutral current in the combination
(3)
which does not involve a strangeness-changing part.
The mass of the charm quark could be predicted based on the
amplitudes for second-order effects. (If the mass of the charm
quark were equal to that of the up quark, there would be no
large, strangeness-changing, neutral current effects). The
magnitude of the second order effects is:
( 4)
As it happens, the process which one would think might give the
best prediction for the charm quark mass, K~ -> µ+µ-, occurs
independently of me, because the relevant diagrams cancel.
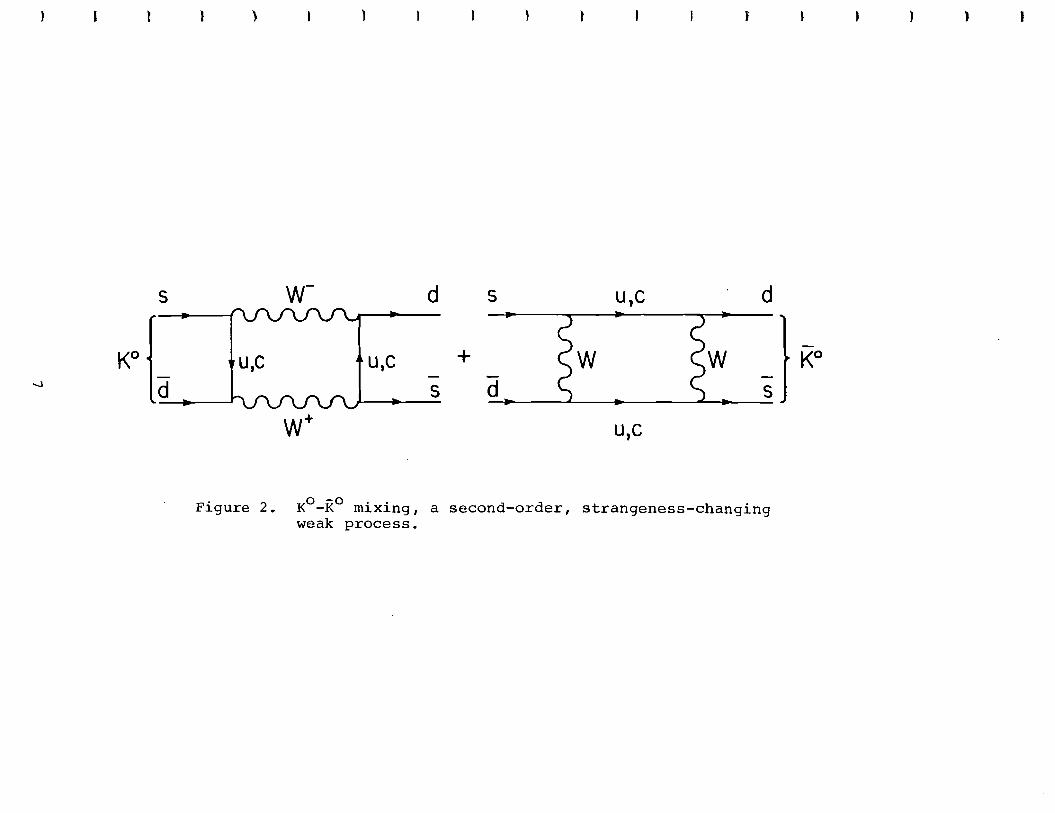
However, the K~-K~ mass difference (which is related to K0 -K0
mixing, the higher order process shown in Figure 2), was used by
the authors to successfully predict the mass of the charm quark.
It was at this time that two independent groups observed
what would come to be interpreted as the ground state vector
6
s
Ko d
l
d s u,c d
u,c u,c + w w s d s
UC '
Figure 2. K0 -R0 mixing, a second-order, strangeness-changing weak process.
)
Ko
-
-
meson which contained "hidden" charm, cc [Aubert, 1974 and
Augustin, 1974]. It is now known as the J/tj/ particle. Studying
the reaction
p + Be -> e+e- + anything (5)
Aubert, et al. at Brookhaven National Laboratory observed an
enhancement in the invariant mass of the e+e- pair at 3.1 GeV/c 2•
Using electron-positron colliding beams at SLAC, Augustin et al.
observed a resonant peak at the same mass. In addition, the SLAC
group observed a resonance at 3.7 GeV/c 2 (now interpreted as the
radially excited state).
With this data, Gaillard, Lee, and Rosner were able to
refine their predictions of the masses and lifetimes of charmed
particles. They predicted the masses of the ground state charmed
hadrons (for example: cu, cd, cs, and cud) to be 2 - 2.5 GeV/c 2
and the lifetimes to be about 10-13 seconds [Gaillard, 1975].
Conclusive evidence for the existence of charmed mesons was
presented in 1976 by an LBL-SLAC group working at SPEAR. Both
the charged and neutral D particles (cd and cu) were observed as
final states in the reaction e+e- -> hadrons. The mass of the o 0
was found to be 1865±15 GeV/c 2 [Goldhaber, 1976], while that of
the o+ was 1876+15 GeV/c2 [Peruzzi, 1976].
8

-
Evidence of the production and decay of charmed particles
was amassed prior to and after this time using nuclear emulsion.
As early as 1951 and 1956, events were found which could not be
explained at the time, but which were later found to be
consistent with the production of charm [Kaplon, 1952 and
Nishikawa, 1959]. A 1971 cosmic ray emulsion experiment
[Niu, 1971] observed an event which is now interpreted to be the
associated production and decay of a pair of charmed pa~ticles.
The observed decay times were 2.2 x 10⁻¹⁴ and 3.6 x 10⁻¹⁴
seconds. The masses were approximately 2 GeV/c 2•
Further visible evidence for the production and decay of
charmed particles came from experiments which exposed nuclear
emulsion in v beam lines at both Fermilab and CERN [Burhop, 1976;
Read, 1979]. In the CERN experiment a bubble chamber downstream
of the target was used as a spectrometer. One event was
kinematic ally reconstructed as a A6 (cud) -> p1T+K- [Angelini,
1979]. The parent mass was calculated to be 2295tl5 G~V/c 2 and
the proper decay time was 7.3 x lo-l3 seconds.
What was lacking in some of the early emulsion experiments,
however, was a satisfactory method of identifying and measuring
the momentum of the decay particles. Without such measurements,
the mass of the parent particle could not be accurately
determined, nor could the lifetime of the parent particle be
9
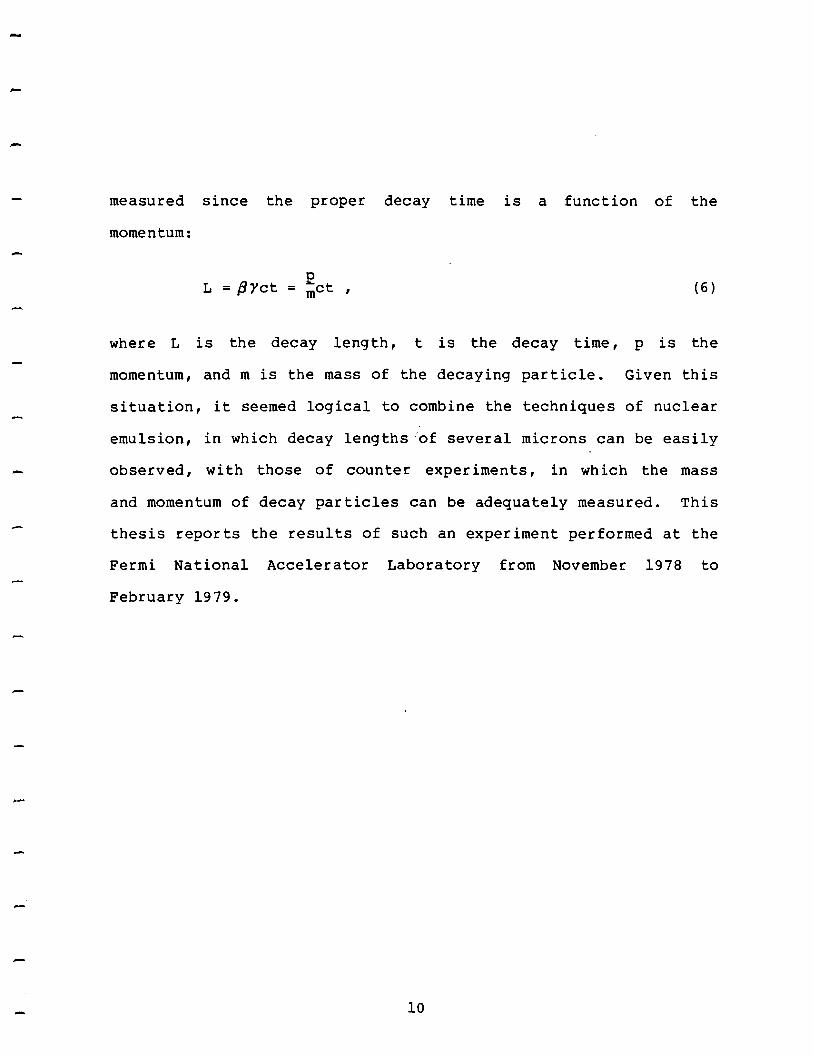
measured since the proper decay time is a function of the
momentum:
L = fJYct ( 6)
where L is the decay length, t is the decay time, p is the
momentum, and m is the mass of the decaying particle. Given this
situation, it seemed logical to combine the techniques of nuclear
emulsion, in which decay lengths :of several microns can be easily
observed, with those of counter experiments, in which the mass
and momentum of decay particles can be adequately measured. This
thesis reports the results of such an experiment performed at the
Fermi National Accelerator Laboratory from November 1978 to
February 1979.
10

-
2. THEORY
Current theory holds that all matter is composed of quarks
and leptons. Experimental evidence exists for five flavours of
quarks: up (u), down (d), strange (s), charm (c), and beauty
(b). In addition, a sixth quark, truth (t), is postulated. Each 1
quark, which is of spin 21 carries an electric and colour charge.
Quarks themselves may not be observable as isolated particles but
they are the constituents of the hadrons, for example the proton
and the neutron, which are detectable. Hadrons may be grouped
according to their quark content: Mesons are particles composed
of a quark and an antiquark (not necessarily of identical
flavour): baryons contain three quarks (again of any flavour).
Symmetrically, there are six leptons: the electron, the muon,
the tauon, and their respective neutrinos. Leptons are both
elementary and observable in unbound states.
The standard theory of the weak interaction groups the
quarks into left-handed doublets:
(~.) '(;.) '(~.)' L L L
where the d', s', and b', the eigenstates of the weak
interaction, are orthogonal linear combinations of the d, s, and
b quarks. These are often expressed generically as
11

--
-
(: .) 2 I
where the u is a quark of charge 3e and the d is a quark of 1
charge -3e. The right-handed quarks are singlets:
In this theory, the weak interactions are mediated by two
charged vector bosons w± and a neutral boson, z0 , which account
for charged and neutral current interactions. The weak
interaction Lagrangian is expressed as:
( 7)
where J 0 and J± are the weak interaction currents, and 9w is the
weak mixing angle which relates the physical fields A, the
photon, and z0 , the weak neutral boson, with the gauge fields w0,
the neutral member of the W triplet, and B, the U(l) singlet.
These relations are
A = w0 sin ew + B cos ew, ( 8)
and
12

z0 = w0 cos 9w - B sin 9w· (9)
For the hadron sector
(10)
Jli is the adjoint of J~, and
- 1 (1 - Ys> J~ = qd[-2 Ya 2
- 1 (1 - Ys) qu [2 ya 2 (11)
The qu and qd are the field operators where
qu = [ ~ ] and
respectively, The left-handed fields are projected by the 1
operator 2<1 - Ys> and the r ... ght-handed fields by the operator 1 2<1 + Y5 ). The 3 x 3 Kobayashi-Maskawa mixing matrix, CKM, which
- was developed as an extension for the four-quark scheme, is given
by:
13
-
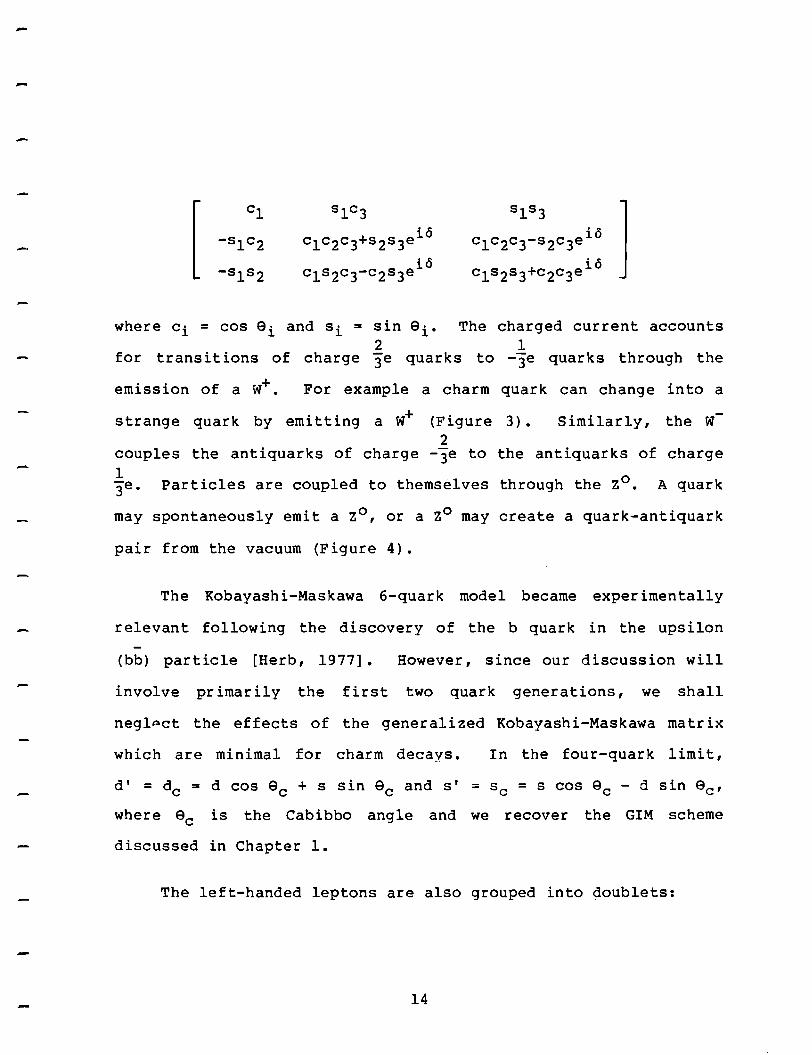
[ l where ci = cos ei and si = sin ei. The charged current accounts
2 1 for transitions of charge 3e quarks to -3e quarks through the
emission of a w+. For example a charm quark can change into a
strange quark by emitting a w+ (Figure 3). Similarly, the w-2
couples the antiquarks of charge -3e to the antiquarks of charge 1 3e. Particles are coupled to themselves through the z0 • A quark
may spontaneously emit a z0 , or a z0 may create a quark-antiquark
pair from the vacuum (Figure 4).
The Kobayashi-Maskawa 6-quark model became experimentally
relevant following the discovery of the b quark in the upsilon
(bb) particle [Herb, 1977]. However, since our discussion will
involve primarily the first two quark generations, we shall
negl~ct the effects of the generalized Kobayashi-Maskawa matrix
which are minimal for charm decays. In the four-quark limit,
d' = dC = d COS 0C + S sin 0C and S 1 = Sc = S COS 9C - d sin 9C,
where ec is the Cabibbo angle and we recover the GIM scheme
discussed in Chapter 1.
The left-handed leptons are also grouped into doublets:
14
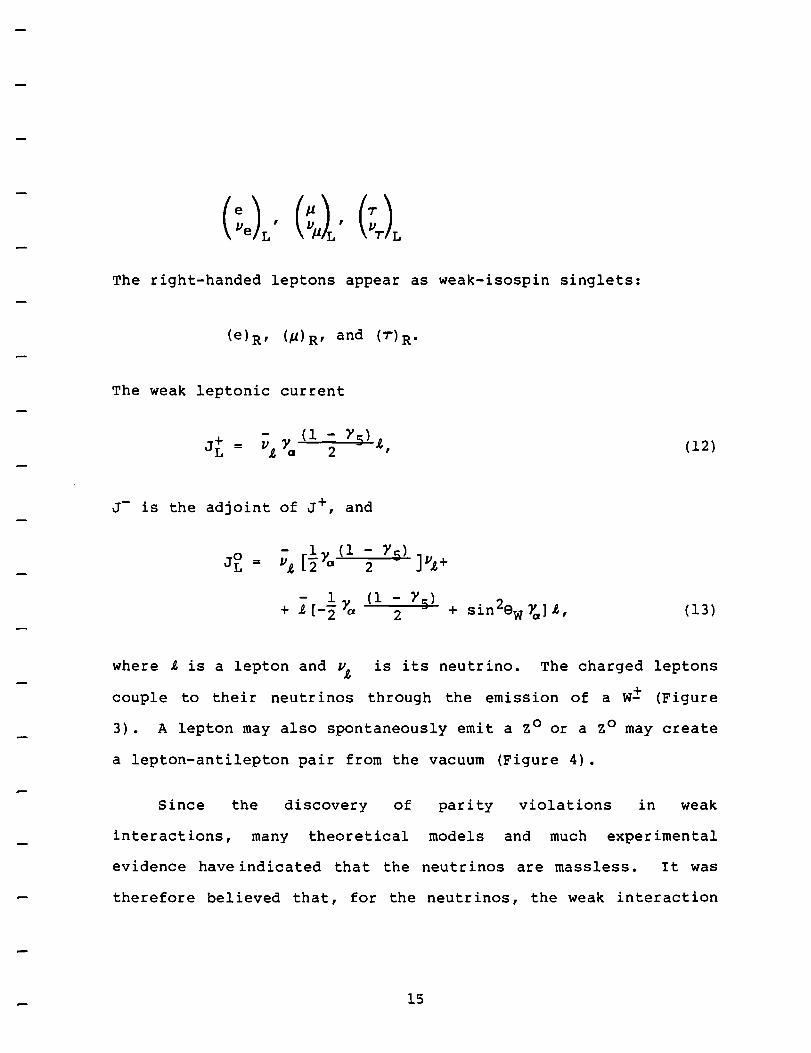
The right-handed leptons appear as weak-isospin singlets:
The weak leptonic current
(12)
J- is the adjoint of J+, and
- 1 (1 - Y5) VJ, ( 2 Ya 2 J VJ,+
- 1 (1 - y ) + J, [ - 2 Ya 2
9 + sin 2ew ~] J, , (13)
where J, is a lepton and vi, is its neutrino. The charged leptons
couple to their neutrinos through the emission of a w± (Figure
3). A lepton may also spontaneously emit a z0 or a z0 may create
a lepton-antilepton pair from the vacuum (Figure 4).
Since the discovery of parity violations in weak
interactions, many theoretical models and much experimental
evidence haveindicated that the neutrinos are massless. It was
therefore believed that, for the neutrinos, the weak interaction
15

eigenstates were the same as the mass eigenstates. Recently,
considerable interest, both theoretical and experimental, has
focused on the topic of massive neutrinos and neutrino mixing
[Lubimov, 1980; Reines, 1980; Ushida, 1981].
2.1 Production of Charm Quarks by Neutrinos
Charm quarks may be produced by neutrinos in the presence of
a nucleon by several processes. The most likely process will be
that in which the neutrino changes into a lepton through the
emission of a w+, which then interacts with a d valence quark of
the nucleus or with an s quark from the quark-antiquark sea to
produce a charm quark. Another less likely process will be the
neutral current reaction in which a z0 , emitted by the neutrino,
pulls a cc pair from the sea surrounding the nucleon.
process gives rise to associated production.
This
The charm quark, once created, combines with other quarks to
produce detectable hadrons. Thus the states most easily produced
using a neutrino beam will be those containing a single charm
quark in combination with other quarks. These are called charmed
particles in contrast to particles possessing hidden charm (a cc
pair) .
quark
The least massive of these states containing
are the mesons with JP = These are the
16
a charm
(D+, D0 )

!
Figure 3. Emission of a W boson by a quark and by a lepton.
17

q q
l, ZI ! 'ZI
Figure 4. Neutral Current Processes.
18

isodoublet of quark content (cd, cu}. Slightly more massive is
the p+ singlet (c~}. The most easily produced baryon state will l+
be the A6 (cud} , which has JP =2
The antiparticles of the above states, that is those
containing a charm antiquark will be produced by an antineutrino
emitting a w-, which then interacts with the nucleon. Since
there are no valence antiquarks in the nucleon, anticharm
production will occur only through a d or s, which are part of
the sea of quark-antiquark pairs.
There exist other more massive charmed states. In
particular, the D and F mesons have related states having
= These, the o±*, p±*,
excitations of the o- states.
and o0 * and - * Do ' are spin
There are also more massive weakly decaying baryons:
A+ (cus} and A0 (eds}. Production of baryon states containing
strange and charm quarks will presumably be less probable because
the nucleon does not contain a strange valence quark and the
ms-ma mass difference inhibits the production of ss pairs,
relative to dd and uu pairs, during fragmentation. Many high
mass charmed baryon states are predicted and are expected to
decay to the A6 through the strong interaction. The least p l+ * p 1+
massive of these are the triplets Le (J = 2} and Le (J = 2 }.
19

The Le triplet consists of the L~+ (cuu), the L~ (cud), and the
£~ (cdd). The L6+* (cuu), the £6* (cud), and the £~* (cdd) make
* up the Le triplet.
2.2 Decays of Charmed Particles (Low-lying States)
Charm is conserved by both the strong and the
electromagnetic interactions. Thus the low-1 ying hadrons, the
o±, o0 , o0, F±, and ~6, must decay through the weak interaction,
in a manner similar to that in which they were created. The
charm quark may emit a w+ boson and change to a d or s quark with
amplitudes proportional to sin ec and cos ec respectively. The
w+ will then "decay" to any one of the doublets to which it
couples and for which enough energy is present, that is, a lepton
and its antineutrino or a quark and an antiquark (for example ud)
as shown in Figure 5. Relative to the lepton-neutrino couplings,
the quark-antiquark couplings are modified by the strengths
This model, in which the charm quark decays independently of
the other quarks of the parent particle, is called the spectator
quark model. Using this model, one would expect the lifetimes of
all the charmed particles to be approximately the same. This
lifetime can be calculated using the same formula as that for
20

-
- Figure 5. + Decay of the W to leptons and to quarks, with the relative coupling strengths.
21

--
-
-
muon decay, since the processes are quite similar, as shown in
Figure 6. The rate for a charm quark decaving to a lepton and
its neutrino is:
r. ( C > X n v ) - 19 2 1GF2mc5 , total - ,t; J, rr- ( 14)
where me is the mass of the charm quark and GF is the coupling
constant. A naive calculation for the total charm decay rate
would be one which included all the decay diagrams shown in
Figure 7, and the fact that the quark-antiquark pairs come in
three colours. However, there are strong corrections to the non-
leptonic decay modes, involving the radiation of gluons by the
quarks, which increase the hadronic decay rates by approximately
a factor of two [Leveille, 1981]. An inferred mass of 1.5 GeV/c 2
for the c quark, based on the KL -Ks mass difference
[Gaillard, 1975], gives for the lifetime of a weakly decaying
charmed particle
'T' = 1 r total
= 1
- 5 x lo- 13 seconds. (15) -------1. 9 x 101 2
Initially, spectator decay was thought to be the only
important process in charm decay. However, current experimental
data lends support to more complicated mechanisms shown by the
Feynman diagrams in Figure 8. In the annihilation process the
22

a)
b) !
c s,d c s,d
Figure 6. a) Muon decay. b) Decay of the charm quark.
23

u u
C cos8 s C cos8 s
C cos8 s C cos8 s
u
d s
c sin8 d c sin8 d
j/y· µ.•
llµ.
c sin8 d c sin 8 d
Figure 7. Spectator decays of the charm quark.
24

s,d d,s s,d
Amihilation Process
c c
u d,s d u
Exchange Process
Figure 8. Alternative charm decay mechanisms.
25

charm quark along with an s or d antiquark annihilate to form a
w+, which then decays to leptons or noncharmed quarks. The
exchange process is that in which a w± is exchanged between two
quarks, both of which change their flavour in the process.
The annihilation process will enter into our discussion of
the o± and F± lifetimes. However, for both the o0 and the A °t, -
there is no d or s with which the charm quark can annihilate.
The exchange diagram can be applied to the decays of A6 and D0•
In comparing the decay rates of different charmed particles, one
must also consider the effects of quark mixing. Processes which
occur with strength cos ec will be enhanced or "Cabibbo-favoured"
relative to those which occur with strength sin 9c which will be
"Cabibbo-suppressed". Summing up the effects of these
alternative diagrams, the D0 , F±, and A~ may all decay through
Cabibbo-favoured exchange or annihilation diagrams. + For the o-
on the other hand, the annihilation process is a Cabibbo
sup.i:'ressed decay, so the o± should decay primarily through the
spectator quark model.
The alternative processes of annihilation and exchange are
not quite as simple as stated above. Strong corrections are
necessary. In particular, one must include in the annihilation
diagram the effect of gluons which may be radiated by the quark
26
in the same manner as an electron radiates a photon. Inclusion
of these removes the inhibition that would otherwise be caused by
a combination of angular momentum conservation and the left
handed weak charged current.
2.3 Decays of Charmed Particles (High Mass States)
The higher mass states, the o+*, the F+*, and the Lc and L~
will first undergo strong or electromagnetic decay. (Strong
processes occur approximately 1012 times and electromagnetic
processes approximately 1010 times more quickly than weak
processes at these energies.) These occur through the emission
of a pion or photon, leading to the ground states, o+, F+, and
A6, which then decay weakly in the manner discussed above.
In terms of observing charm decays with techniques such as
nuclear emulsion, this means that the decay of the higher mass
charmed particle occurs at (or extremely close to) the primary
(production) vertex, and the observed decay length is that of the
weakly decaying ground state.
27

3. EQUIPMENT
The predicted charmed particle lifetimes of approximately
lo-13 seconds correspond to decay lengths from a few to several
thousand microns. At the time this experiment was being designed
(1976), the only detector capable of achieving this resolution
was nuclear emulsion. 1 Any charged particle passing through
nuclear emulsion will leave a visible track. Neutral particles do
not leave any visible tracks. Although this implies that the
emulsion is 100% efficient in detecting charged particles, it
also allows the emulsion to become quickly blackened with tracks
of irrelevant particles. To avoid this problem the emulsion was
placed in a neutrino beam. Only the charged particles related to
events in which a neutrino has reacted in the emulsion, the beam
associated background, and cosmic ray particles will produce
visible tracks. In addition, previous experimental evidence
[Benvenuti, 1975] suggested that approximately 10% of all
neutrino interactions would produce charmed particles.
All of the charged decay particles can be observed in the
emulsion, and the decay lengths of both the charged and neutral
1Recent developments in bubble and solid-state detectors have produced resolution [Bellini, 1982].
28
streamer chambers and in detectors of comparable

parent particles can be measured. However, scanning the entire
emulsion volume for interactions becomes prohibitively expensive
and time consuming. In addition, the emulsion provides particle
identification only for slow particles with {:3 appreciably less
than 1. Therefore a downstream electronic detector
(spectrometer) was used in conjunction with the emulsion. The
detector is shown schematically in Figure 9. Tracks of charged
particles were reconstructed which enabled prediction o~ the
neutrino interaction vertex. The detector was required to cover
a large solid angle (high acceptance) and successfully track
almost all particles entering it (high efficiency). Two sets of
drift chambers on either side of a wide-aperture magnet measured
the three-momenta of charged particles.
A plastic sheet covered on both sides by thin layers of
emulsion was placed on the downstream face of the emulsion
target. This fiducial sheet, which was changed every two to
three days during the experiment, served as a high-resolution,
low-background detector, to link the spectrometer tracks to the
main emulsion tracks. Tracks reconstructed from the spectrometer
could be easily found in the fiducial sheet and then followed
back into the emulsion target. This increased the efficiency of
vertex finding by approximately 50% as compared to that for
simple volume scanning, and was also of great value in the charm
decay search.
29

w 0
VETO . . .
.
.. .
EMULSION
\
UP OCH
TOFI. '-J -
SCM-104 MAGNET
[f1j
~·
DN OCH
GRANITE BLOCK
2.5 m
CALORIMETER
LEAD I GLASS
---
-1, TOFll
MUON STEEL
'
- £. -
MuF MuB 'MUON Al'
HODOS COPES
Figure 9. Side view of the E531 apparatus.

To completely reconstruct a decay vertex and identify the
decaying charmed particle it is necessary to identify all of the
decay particle·s and measure their momenta. Charged particles
were tracked by the drift chambers in conjunction with the
magnetic field of the wide-aperture magnet. The identification
of some of the charged hadrons was accomplished through the time
of-f light system. Electrons were identified by the lead glass
system and -muons by their penetration of a steel absorber. The
existence of neutral secondaries was inferred using the lead
glass array and the hadron calorimeter.
Knowledge of the position of the downstream spectrometer
relative to the emulsion was crucial in order to locate the
events in the emulsion. An extensive optical survey of the
apparatus was done before and after the taking of data. In
addition, position and temperature sensors were attached to the
apparatus at numerous points to calibrate the effects of thermal
expansion.
3.1 Neutrino Beam Line
The protons were extracted in a fast spill mode at the end
of each 7 second machine cycle and transported to the neutrino
production target by a conventional magnetic beam line.
31

Approximately 1.5 x 10¹³ protons per spill were incident upon the
neutrino production target, a 30 cm long (one.interaction length)
piece of beryllium oxide, located 954 m upstream of Experiment
531 (Figure 10) • Charged pions and kaons are among the particles
produced when the protons hit the BeO target.
kaons decay primarily through the processes
and rr+ -> µ+v µ
These pions and
in the 410 m long decay space following the target. A single
pulsed magnetic horn located 30 m into the decay space was used
to focus positively charged particles which had production angles
greater than 1.8 mrad and thus increase the neutrino flux.
(During 2.5% of the data-taking period, the polarity of the horn
was reversed to obtain an antineutrino beam.)
For this experiment (in order to avoid blackening of the
emulsion) it was necessary to minimize the flux of background
muons. The closeness of the experiment ~J the neutrino
production target and the lack of sufficient steel shielding
meant that intolerably high muon fluxes, 6000 µ/m 2 /pulse, were
recorded when the protons were accelerated to 400 GeV (the usual
operating energy of the accelerator). By decreasing the proton
energy to 350 GeV, the muon flux was reduced to approximately
500 µ/m 2/pulse, while the neutrino event rate decreased by only
about 26%.
32

410m DEC~Y PIPE 20m CONCRETE IOOm Fe 80m Fe
350GeV VJ Proton~ VJ
HORN EARTHEN SPOILER 130m 130m WONDER TARGET BERM TOROIDS EARTH EARTH BUILDING
r 949m ~
Figure 10. The Fermilab neutrino beam line.
After one month of taking data, 18.3 m of additional
concrete shielding was installed, further reducing the muon flux
by a factor of two. A system of toroidal sweeping magnets (the
muon spoiler system) , which had been installed upstream of
experiment 531, was not used until very late into the running
period because it greatly increased the muon flux at the 15-foot
bubble chamber, situated 512 m downstream of experiment 531,
which was taking data simultaneously.
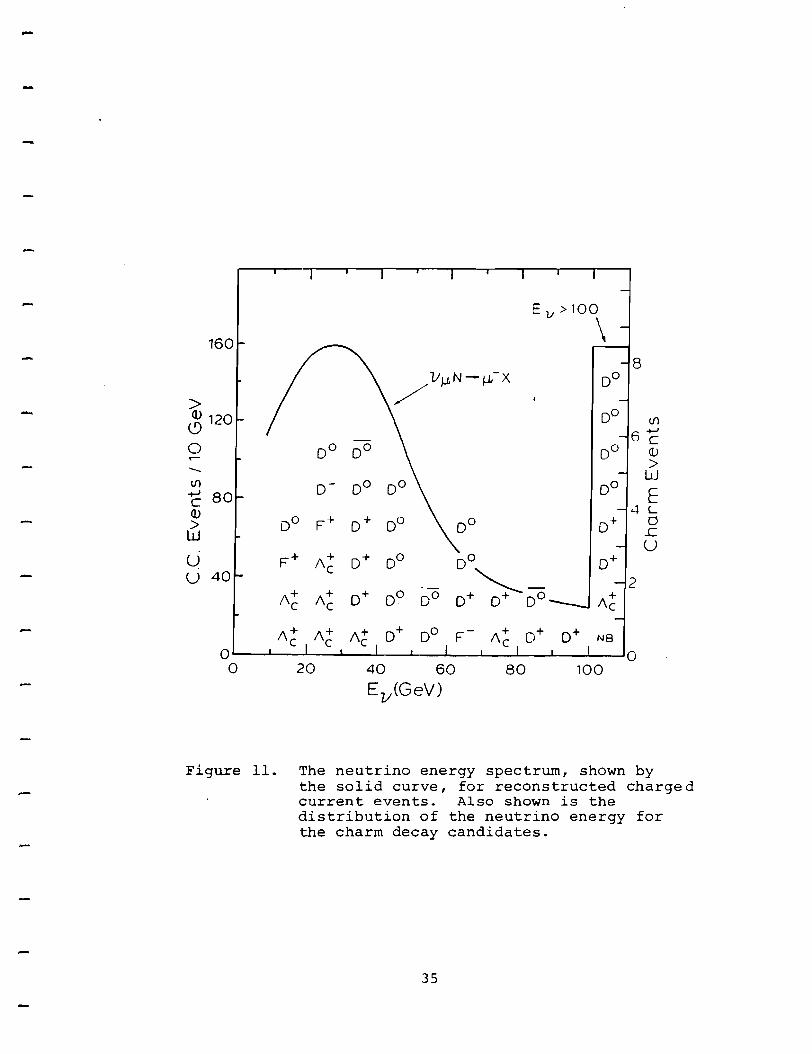
The energy spectrum of reconstructed v interactions is shown
in Figure 11. The peak energy is at 25 GeV. This spectrum was
obtained by unfolding the effects of the acceptance and
resolution of experiment 531 from the observed energy spectrum of
2022 neutrino-induced interactions. The energy of the incident
neutrino is calculated by summing the energy of the muon, the
energy of the charged particles, and the energy of the lead glass
system and the calorimeter, which cannot be attributed to charged
particles.
3.2 Emulsion
The emulsion target was composed of 23.6 liters of Fuji ET-
78 nuclear emulsion, which had been melted, poured and cut into
very thin sheets or pellicles. The emulsion sheets were packaged
34
Ev>100
160 \ 8
Vµ.N-µ,-X Do
> / ()) 120 Do (/) (9 fie 0 Do Do Do Q) - > w (/) D- Do Do +-' 80 E c ()) '4 L
> Do F+ D+ Do D+ 0 w £.
u w F+ /\.+ D+ Do Do D+ u 40 c
~- 2 /\.+ /\ + o+ Do Do o+ D+ D0
/\~ c c
/\ + c /\ + c /\+ c D+ Do F /\ + c o+ o+ NB
0 0 0 20 40 60 80 100
Ev(GeV)
Figure 11. The neutrino energy spectrum, shown by the solid curve, for reconstructed charged current events. Also shown is the distribution of the neutrino energy for the charm decay candidates.
35

TABLE 1. Chemical composition of Fuji ET-7B emulsion.
Element Percentage ~ Weight
Iodine Silver Bromine Sulfur Oxygen Nitrogen Carbon Hydrogen
1.31 46.5 33.7
0.4 4.3 2.7 7.4 0. 9 2
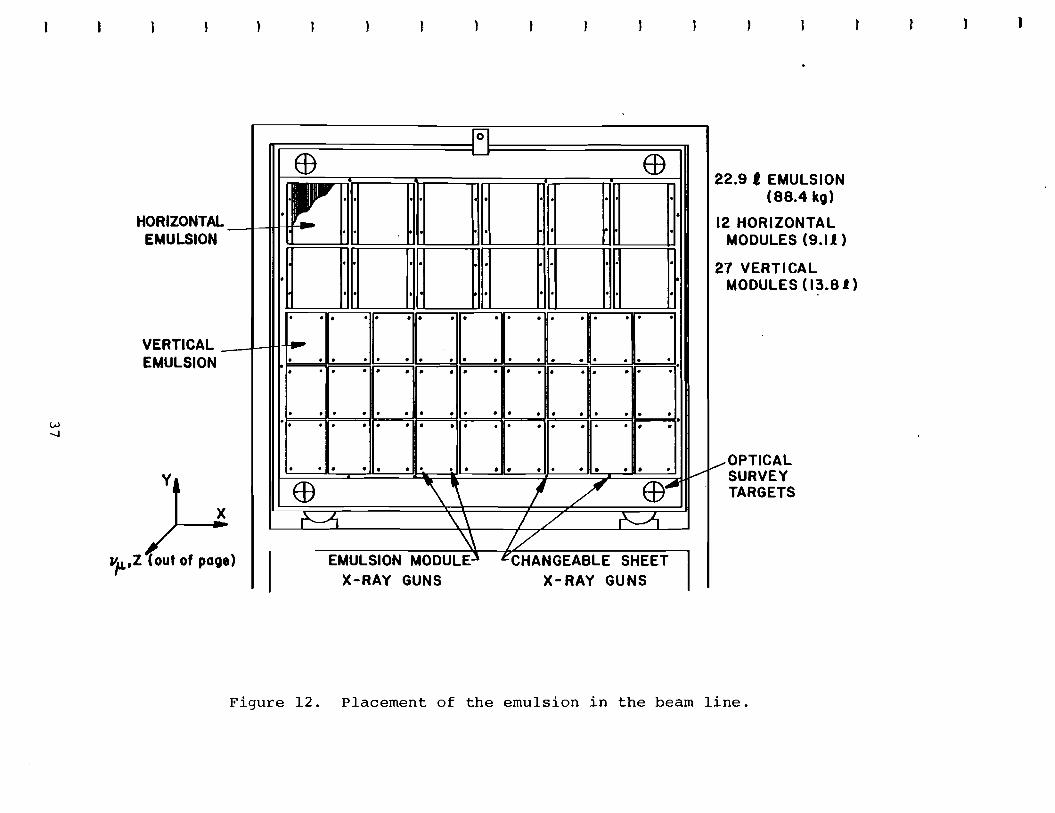
into modules which were placed on an aluminium and hexcell
support frame (Figure 12). The sheets of emulsion were placed in
the beam line with two different orientations: vertical and
horizontal. Each vertical emulsion module contained 68 sheets.
Each sheet was composed of a 12 cm x 9. 5 cm x 70 µ polystyrene
base coated on both sides with 330µ of emulsion. The plane of
the emulsion sheets was perpendicular to the beam direction. The
horizontal emulsion modules were placed so that the beam line was
incident parallel to the emulsion sheets. These ~cllicles were
5 cm x 14 cm x 600 µ sheets of solid emulsion. There were 188
sheets in each of the horizontal modules. (Figure 13). A total
of 29 vertical modules and 13 horizontal modules were exposed
during the data-taking period, although only 27 vertical and 12
horizontal modules were in place at any one time. (Three modules
were removed· midway through the data-taking period for
36
w -...J
HORIZONTAL EMULSION
VERTICAL EMULSION
-
e) ~
llp.,Z (out of paQ
ol
$ - E0
-~·o· oo·o· 1 - . . ' . . . . .
·DDDDDD . . . . . . . . . . . . . . . . . . . . . . . . . . . -. . . . . . . . . . . . . . . . . . . . . . . . . . . • • .. . . . . .. . . . . . . . . . . . . . . . . . . . . . . . . . . • • • • . . . . . . . . ..
. . . • • . . . . • • . . • • • • . E0 \ '\ } / EB~
~ \\ I/ ~ ~ //
EMULSION MODULE.l ecHANGEABLE SHEET X-RAY GUNS X-RAY GUNS
~
2 2.9 f EMULSION ( 88.4 kQ)
I 2 HORIZONTAL MODULES (9.1.l)
2 7 VERTICAL MODULES ( 13.8 J)
v OPTICAL SURVEY TARGETS
Figure 12. Placement of the emulsion in the beam line.

w 00
}
Hexcel Plate
Emulsion Film (68 total)~
..._l---5cm •
Emulsion Pellicles (parallel to plane
of drawing) Fiducial Sheet
--~~
Polystyrene
Fiducia I Sheet
Figure 13. The emulsion. Top: horizontal emulsion module. Bottom: vertical emulsion module.
examination and replaced with new modules.) The emulsion modules
were wrapped in polylaminated paper and mounted on four posts,
the external portions of which were used to mount the modules
onto the precision aluminium frame.
The fiducial sheet was immediately downstream of the target.
This sheet consisted of a 91. 5 cm x 80 cm x 800 µ luci te base
coated on both sides with 75 µ of emulsion. The fiducial sheet
was used to couple tracks reconstructed by the spectrometer with
those in the emulsion target. It was changed every two to three
days during the taking of data. The position of the target
emulsion relative to that of the fiducial sheet was determined
through the use of small, collimated 55Fe X-ray sources embedded
in the posts of the emulsion modules. The tracks reconstructed
by the spectrometer were first located in the fiducial sheet then
followed back into the vertical emulsion sheets with an
efficiency of 0.96 ± 0.02. This method of following tracks back
into the emulsion is technically more difficult with the
horizontal modules, owing to the distortion near the edges of the
pellicles that occurs during drying, and was therefore used only
sparingly.
A set of small individually wrapped pellicles, identical in
construction to the fiducial sheets, was placed on the upstream
face of the emulsion target frame. These were removed one at a
39
-
time, at regular intervals during the data-taking period, and
processed immediately. These integrating emulsion pellicles
enabled a reliable check of the muon flux through the emulsion
target.
The emulsion modules were supported by an
machined solid aluminium and aluminium hexcell frame.
provided adequate support strength and at the
accurately
The frame
same time
represented minimal additional matter in which neutrinos could
interact. This frame was attached to aluminium supports which
allowed the frame and the emulsion to be temporarily displaced
during the installation and removal of the fiducial sheet. One
corner of the frame was fixed while the others were free to move
in case of expansions and contractions. Such motion was
monitored by a system of linear variable differential transformer
(LVDT} monitors which were mounted to the frame. The LVDT
monitors had a spatial resolution of 15 µ.
The temperature of the emulsion was maintained at l0~2°c by
a closed circuit air conditioning system. The frame for the
emulsion and the support frames of the upstream and downstream
drift chambers were placed on a solid 3.5 ton granite optical
bench in order to minimize the shifting of the emulsion with
respect to
successful
emulsion.
the drift chambers, which could
search for the neu tr inc-induced
40
have prevented a
events in the

-
3.3 Anti-coincidence Counter
An array of scintillators, the anti-coincidence counter, was
placed 1.3 m upstream of the emulsion target. This counter was
used to prevent data collection resulting from incident charged
particles, for instance muons, in the beam line. The array
consisted of 7 scintillation counters, each 25.4 cm x 178 cm,
placed horizontally such that the area in the beam was 3 .1 2 m •
An Amperex 56AVP phototube was placed on each end of the seven
scintillators. The efficiency of the anti-counter was 0.89~0.0l.
The timing of the anti-counter relative to TOF I was
extremely critical on account of the proximity of the two.
Charged particles emitted in the backward direction from a
neutrino interaction vertex could trigger the anti-coincidence
counter thereby vetoing the event (backscatter). Using time
spectra accumulated for neutrino interactions, it was determined
that 15 % of the neutrino triggers would have been vetoed, had
the timing of the anti-counter been poorly adjusted. A Lecroy
824 octal mean timer was used to remove time jitter resulting
from the variable position of the hits in the anti-counter.
41
-
-
3.4 Time of Flight
The Time of Flight (TOF} system had two purposes: It was
used to trigger data collection and in the identification of
particles by measuring the flight times of charged particles.
TOF I was a single piece of Pilot F scintillator 92 cm x
74 cm x 0.95 cm, located 7.6 cm from the downstream face of the
emulsion target. The light was transmitted through curved light
guides to 12 RCA 8575 phototubes (Figure 14}.
TOF II consisted of 16 narrow counters (7.0 cm x 150.0 cm x
2.5 cm} and 14 wide counters (10.2 cm x 150.0 cm x 2.5 cm
arranged in a vertical hodoscope with the wider counters further
from the centre of the beam (Figure 15}. The array was 2.84 m
downstream of the emulsion target. The narrow counters were
overlapped by 0.6 cm and the wide counters by 0.2 cm. All
counters were constructed with Pilot F scintillator, which has an
attenuat:'.on length of 1 m, and were viewed at both ends by
Amperex XP-2230 phototubes.
The signals from the time-of-flight counters were split so 4
that 5 was discriminated and input to Lecroy 2228A TDC units set 1
at 50 ps/count. The remaining 5 of the signal was input to
Lecroy 2249A ADC units which were set at 0.25 pC/count. High
42

TOF I scinti I la tor (0.7m 2
)
Pilot -F
/light guide
W. ' 1nston vcones
diagramatic representation
.... -tube (RCA 8575)
\ . Winstbn cone light guide
11 .... _Jxory
z
- -emulsion Pilot - F
--+-+---scintillator ( 1.0 cm thick)
tube
cut-away view
~
Figure 14. Time of Flight I c ounter.

Tube
7 ---------Tube (Amperex 2230)
p: r p ~ ~ P,,.,.,..,..,.~~= ~ ~ n Q p ~~-Winston cone
Dt[tbbb -----2.25m
14 WIDE COUNTERS 150.0x10.2 x 2.5 cm
_ _.__ __ Scinti Ila tor c H x w x 0 >
1.50 m
16 NARROW COUNTERS 150.0 x 7.0 x 2.5 cm
(HxWxD)
Aatten = 1.0 m
v Beam into page
Figure 15. Time of Flight II Counter.
voltage to the tubes was supplied by Lecroy R24 H4032 units which
constrained the drift in the voltage on each tube to less than
1 v. During the data collection portion of this experiment the
voltages of all counters were maintained constant to this
precision.
The stability of the time-of-flight counters was moni tared
through the use of a nitrogen laser system. The ultraviolet
laser light was focused on a block of scintillator, which
reemitted visible light that was transmitted through a system of
fibre optics to the centre of each TOF II paddle and to the TOF I
light guides.
The time-of-flight system was calibrated using data for 2 x
10 5 muon tracks which were accumulated during the data-taking
period. The muon trigger system required that the pulse height
from TOF I be equivalent to at least one minimum ionizing
particle and that there be at most one particle detected by TOF
II. For calibration purposes, the muon trigger data was reduced
to satisfy the requirements that there be only a single
reconstructed track and that the TOF I pulse height be restricted
to one minimum ionizing particle.
The time resolution obtained for TOF I was 350 ps for
neutrino-induced events using a fitted start time. The time
45

resolution of TOF II was 100 ps for the narrow counters and
150 ps for the wide counters. Several factors contributed to the
poor resolution of the TOF I counter: inefficient light
collection by the phototubes and the size (5 cm in diameter) of
track clusters associated with neutrino interactions, which
corresponds to a time jitter of 300 ps.
3.5 Drift Chambers
The purpose of the drift chambers was to track charged
particles emanating from the neutrino interaction vertex and to
measure the deflection of these particles by the magnetic field.
Two sets of drift chambers were used, one group upstream of the
large aperture magnet, the other group immediately downstream of
the magnet.
3.5.1 Upstream Chambers
The twelve identical upstream chambers were grouped in four
sets of three. Each set measured an x, u, and v coordinate for
an individual track, where the u chambers were rotated clockwise
60° (looking downstream) with respect to the x chambers and the v
chambers 60° counterclockwise (Figure 16). In order to resolve
the left-right ambiguity inherent in drift chambers, the
46
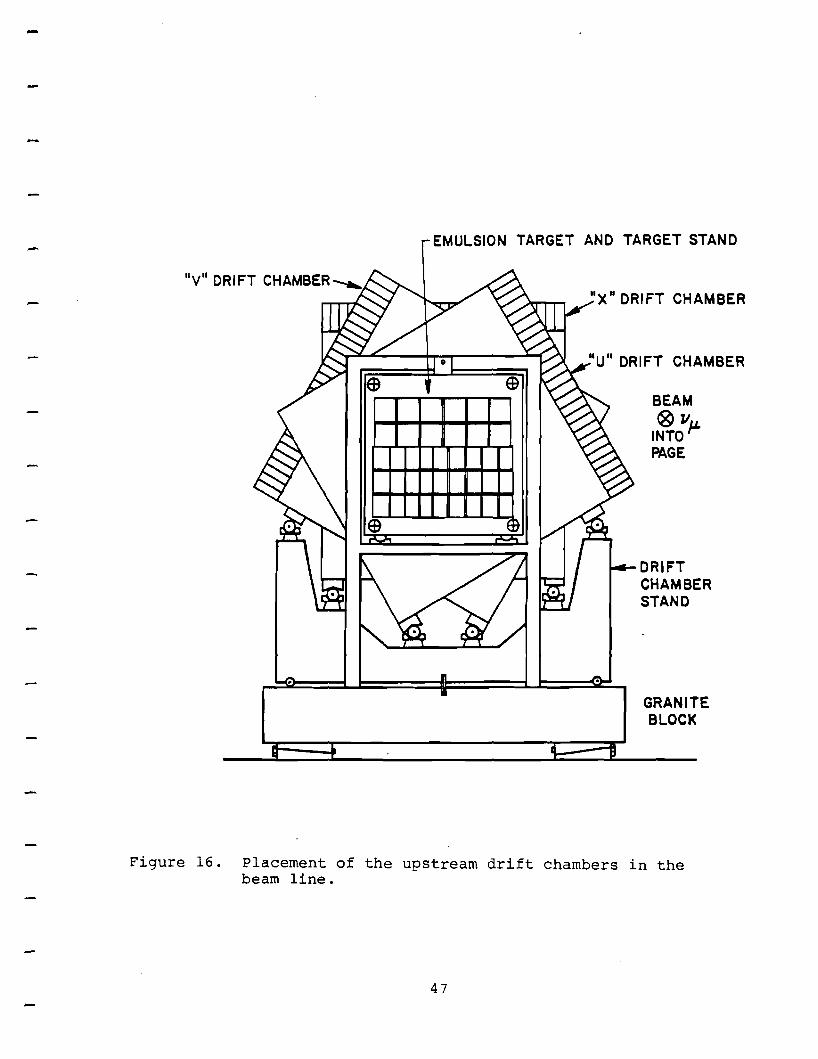
- EMULSION TARGET AND TARGET STAND
11X 11 DRIFT CHAMBER
"U" DRIFT CHAMBER
BEAM ® 11
INTOµ. PAGE
DRIFT CHAMBER STAND
GRANITE BLOCK
Figure 16. Placement of the upstream drift chambers in the beam line.
47

alternate sets of chambers had the position of their sense wires
shifted by one half of a cell size. The judicious choice of
arrangement and orientation maximized the information obtained
for individual tracks. The first chamber was positioned 15 cm
from the downstream face of the emulsion target.
between chambers was 4.66t0.02 cm.
The distance
Each chamber contained 32 gold-plated, 20 µ diameter,
tungsten sense wires at a tension of 50 g. The sense wires were
maintained at zero voltage. The cell size of the chambers was
4 cm. The cells were divided with field-shaping wires (Figure
17) • These wires and the cathode plane wires were 75 µ diameter
copper-plated beryllium strung with 200 g tension. The
separation between the cathode planes was 6.35 mm and the spacing
between neighbouring cathode wires was 2 mm. The active area of
each chamber was 128 cm x 132 cm.
The frames were constructed of G-10 (fil;>reglass).
Aluminized mylar windows (25 µ aluminium on 50 µ mylar) on the
exterior of the chambers served both to shield the chamber from
RF noise and to contain the gas. The gas used was a 50% argon -
50% ethane mixture.
An electric field of 700 V/cm was provided with the normal
operating voltages of -3100 V ( Vmaxl on the drift wires and the
48

\:.) ..
0 0i -
equipotential line
sense wire field shaping wire
Figure 17. One drift cell in cross-section. The equ~potentials are marked with solid lines. Cell size is 5.08 cm and cathode to cathode spacing is 6mm.

-
-
cathode wires furthest from the sense wires, and -1700 V ( Vmin)
on the cathode wires adjacent to the sense wires. A voltage
divider board (simply a chain of resistors) provided intermediate
voltages to the remaining cathode wires.
3.5.2 Downstream Chambers
Eight large drift chambers were positioned in sets of four
downstream of the magnet. These were arranged as: x, v, u, x'
and x, v' , u' , x' , where the prime (' ) denotes that the sense
wires have been shifted by one half of a cell size. As opposed
to the upstream chambers which received their orientation simply
by rota ting the entire chamber, the downstream chambers were
constructed with inherent orientations. The u chambers had wires
rotated 10.6° clockwise from the vertical and the wires of the v
chambers were rotated 10.6° counterclockwise.
neighbouring chambers was 5 cm except for
chambers which were separated by 16 cm.
The separation of
the two innermost
The x chambers each contained 40 sense wires of 25 µ
diameter, gold-plated tungsten wire spaced 5.08 cm apart.
Between the sense wires lay field shaping wires of 75 µ diameter
copper-plated beryllium. The sense wires were strung at a
tension of 60 g and the field shaping wires at a tension of
120 g. The cathode planes were constructed of mylar foil 62.5 µ
50

in thickness upon which flattened 125 µ diameter copper wire had
been laminated. The resulting copper strips were 400µ wide and
25 µ thick. The frames were constructed of G-10 • The chambers
were covered with aluminized mylar gas windows. A brass u
channel around the perimeter of the chamber completed the RF
shielding.
The u and v chambers were the same as the.x chambers in all
respects except that these chambers contained 43 and 44 sense
wires respectively. The perpendicular distance between
neighbouring sense wires was again 5.08 cm. The position of the
sense wires in all of the downstream chambers was within 25 µ
during the construction of the chamb~rs. The active area (X x Y)
for all of the downstream chambers was 203.2 cm x 118.1 cm.
The sense wires were maintained at 0 V, separated from
ground by 10 K.Q resistors. The nominal operating voltages for
the downstream chambers were Vmax = -3700 V and Vmin = -1800 V,
which provided a drift voltage of 750 V/cm. A cross-section of a
drift chamber cell is shown in Figure 17.
During the course of the experiment however, internal
electrical problems developed on some of the chambers
necessitating lower operating voltages. The same argon-ethane
mixture as that for the upstream chambers was used.
51
Extensive tests of prototypes for the downstream chambers
were carried out in the Fermilab test beam [Pitman, 1979].
several topics were studied:
o The feasibility of the new technique of using copperclad mylar foils as cathode planes;
o The relative merits of various gases;
o suppressio~ of cross-talk between neighbouring sense wires; and
o The dependence of pulse height on the direction of the track.
3.5.3 Drift Chamber Electronic Data Collection System
The amplifiers and the drift chamber data collection system
were designed at the Ohio State University. Attached to each
drift chamber sense wire was a fast amplifier and discriminator
which amplified the signals by a factor of 100, while shaping the
signal pulses to eliminate the ringing at the tail end of the
pulses.- This was necessary to optimize track resolution and to
.avoid cross-talk between wires. Pulses were then discriminated
and converted to standard NIM levels (700 mV) with a variable
threshold discriminator. During the experiment the threshold was
set to 15 mV. Typical pulse heights for minimum-ionizing
particles were 100 mV at the input of the discriminator and pulse
widths varied from 20 to 40 ns. The NIM level pulses were input
52
-
-
-
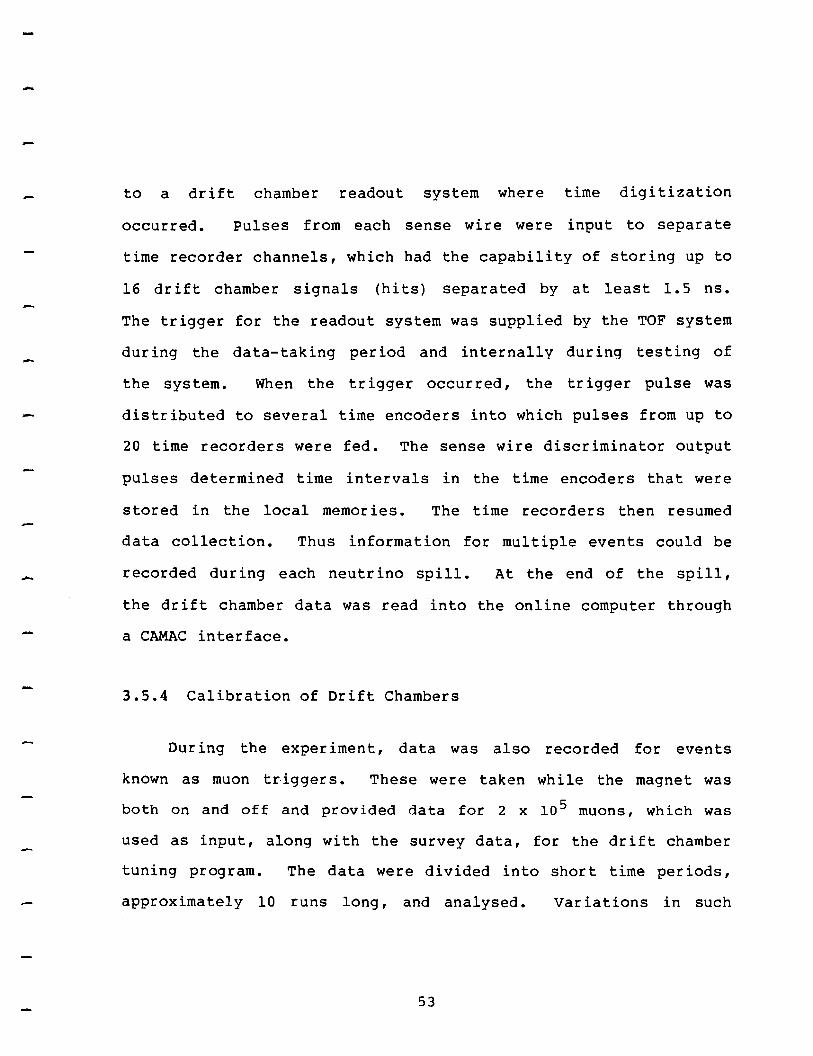
to a drift chamber readout system where time digitization
occurred. Pulses from each sense wire were input to separate
time recorder channels, which had the capability of storing up to
16 drift chamber signals (hits) separated by at least 1.5 ns.
The trigger for the readout system was supplied by the TOF system
during the data-taking period and internally during testing of
the system. When the trigger occurred, the trigger pulse was
distributed to several time encoders into which pulses from up to
20 time recorders were fed. The sense wire discriminator output
pulses determined time intervals in the time encoders that were
stored in the local memories. The time recorders then resumed
data collection. Thus information for multiple events could be
recorded during each neutrino spill. At the end of the spill,
the drift chamber data was read into the online computer through
a CAMAC interface.
3.5.4 Calibration of Drift Chambers
During the experiment, data was also recorded for events
known as muon triggers. These were taken while the magnet was
both on and off and provided data for 2 x io 5 muons, which was
used as input, along with the survey data, for the drift chamber
tuning program. The data were divided into short time periods,
approximately 10 runs long, and analysed. variations in such
53

-
-
-
parameters as wire positions and the drift velocity of electrons
in the. argon-ethane gas were studied. Inadvertent rotations or
translations of a chamber with respect to the others could be
diagnosed. (The amount of movement of the chambers was found to
be less than 125 µ, which agreed with that monitored by the LVDT
system.)
The spatial resolution of the drift chamber system based on
data from the entire run was 125 µ • The resolution with which
two adjacent tracks through the same drift chamber cell could be
separated was 1.8±0.3 mm. This resolution was calculated based
on time correlation studies of tracks from neutrino events.
3.6 Magnet and Momentum Measurements
Placed between the two groups of drift chambers was a wide
aperture SCM-104 magnet, which in conjunction with the drift
chambers was used to determine the momenta of charged particles.
The dimensions of the interior aperture were 2 .1 m x 1. 02 m x
0. 8 m. Since the magnetic field was highly non-uniform, the
measurement of an extensive field map representing 43, 000 data
points taken between the two pole faces was imperative. The
central magnetic field was 5 KG. Throughout the experiment the
current supplied to the magnet was 2400±12 A.
54

-
-
The bending of charged tracks in the magnetic field, made
possible the calculation of the momenta of the charged particles.
The bend angle,
o. o{s-d1 e == p (16)
where p is the component of the momentum perpendicular to B, the
magnetic field. At a current of 2400 A, 1B·dl> == 6.2 KG·m.
The momentum resolution for charged particles passing through the
magnet can be calculated using the equation, derived from (16),
.42 p.19 p ::: 0.186 , (17)
where 0 is measured in radians and p is measured in GeV/c. The
spatial resolution of 125 µ in the drift chambers yields an
angular resolution of 0.6 mrad, giving .1p/p == 0.005p. However,
to properly calculate the momentum resolution one must include
the effects of multiple scattering which occurs in all materials
such as mylar, aluminium, and air, traversed by the particles in
the spectrometer. In order to minimize this effect, a bag of
helium was placed in the aperture of the magnet during the data
taking run. The resolution for the 20 chamber system becomes:
.42 p
::: /co • o o 9 ) 2 + c o • o o 5 P) 2 (18)
55

The momentum resolution was considerably worse for tracks which
were at such wide angles that they did not pass through the
magnetic field and reach the downstream chambers.
tracks whose angles were less than 300 mrad,
4£ p = 0.35p •
For tracks with angles between 300 and 600 mrad,
4E p = o.s .
Finally, for tracks with angles greater than 600 mrad,
4£ p = 0.75 •
For those
(19)
(20)
(21)
The momentum for these upstream only tracks was calculated from
their bending in the fringe field of the magnet.
3.7 Lead Glass
The function of the lead glass blocks was to measure
electromagnetic energy by collection of Cerenkov radiation
produced by the charged particles of electromagnetic showers
produced by electrons, positrons or photons which showered in the
blocks. Using pulse heights from the photomultiplier tubes
56

coupled to the lead glass blocks, the presence of cor related
pairs of photons resulting from rr 0 decay could be inferred.
Sixty-eight lead glass blocks, all 19 x 19 cm 2 in cross
section, were arranged in a rectangular array nine blocks wide
and eight blocks high with the four corners missing (Figure 18).
Positioned in the centre of the array were the eight "long"
blocks, 35.6 cm (12.5 radiation lengths) long, which were
composed of SF2 lead glass. The remainder of the array was
filled with "short" blocks, 30.5 cm (10.5 radiation lengths),
made of F2 lead glass. A 12.7 cm diameter EMI 9815 phototube was
glued to the end of each block.
The signals from the lead glass blocks were first amplified
by a factor of 10 and then split in the ratio 1:13. The smaller
fraction of the signal was input to an ADC unit set at 0. 25
pc/channel, which was used to measure electromagnetic shower
energy of neutrino events. The larger part of the signal was
input to another ADC unit, set dC 1.0 pC/channel, which recorded
the pulse height for relativistic, non-interacting particles (in
this case, muons). The energy attributed to photons and
electrons is equal to the total energy detected minus the energy
due to charged non-interacting particles.
The gains of the phototubes were initially set equal through
57

-
[_ ~54 m
Beam (Z)
into page
, ..
D ~
~
1.74 m
Short block
Long block
Concrete spacer
Figure 18. The lead glass array.
58
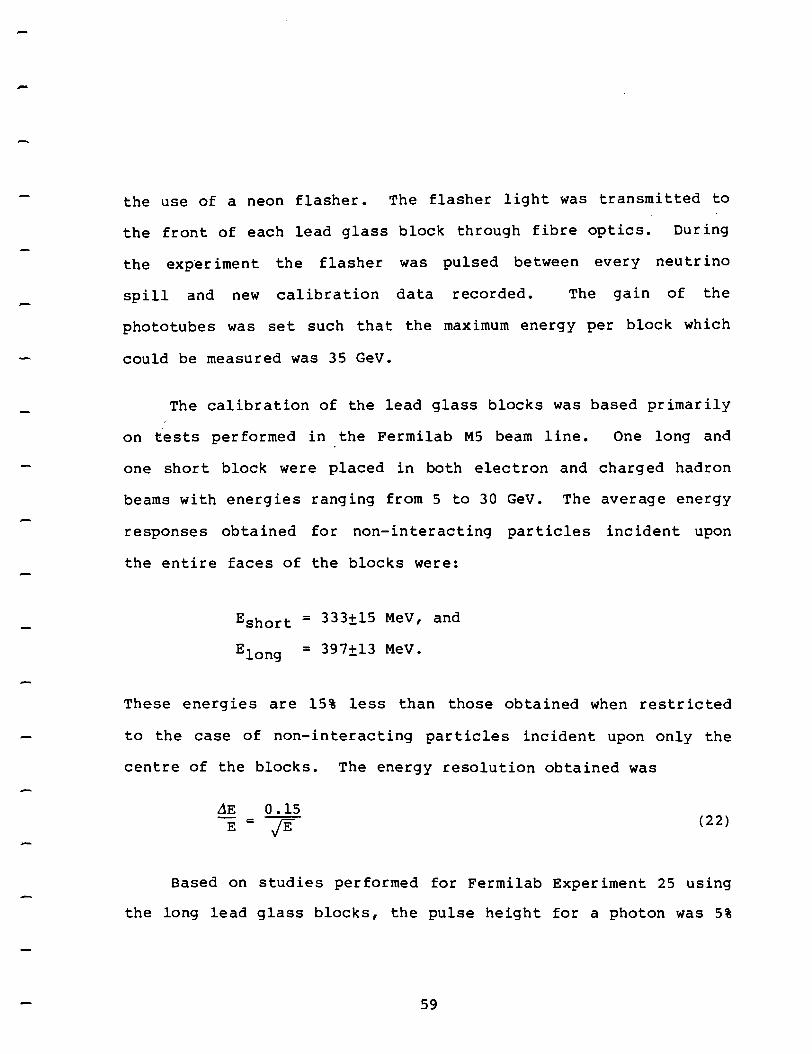
the use of a neon flasher. The flasher light was transmitted to
the front of each lead glass block through fibre optics. During
the experiment the flasher was pulsed between every neutrino
spill and new calibration data recorded. The gain of the
phototubes was set such that the maximum energy per block which
could be measured was 35 GeV.
The calibration of the lead glass blocks was based primarily
on tests performed in the Fermilab MS beam line. One long and
one short block were placed in both electron and charged hadron
beams with energies ranging from 5 to 30 GeV. The average energy
responses obtained for non-interacting particles incident upon
the entire faces of the blocks were:
Eshort = 333±15 MeV, and
E1ong = 397±13 MeV.
These energies are 15% less than those obtained when restricted
to the case of non-interacting particles incident upon only the
centre of the blocks. The energy resolution obtained was
JE 0.15 E = jE (22}
Based on studies performed for Fermilab Experiment 25 using
the long lead glass blocks, the pulse height for a photon was 5%
59

less than that of an electron of equal energy [Egloff, 1979].
For 1To with energy less than 4 GeV, the probability of both
photons entering the same lead glass block was only 1%. The
probability of both photons entering the same block increased to
30% for 1To with energy approximately 10 GeV.
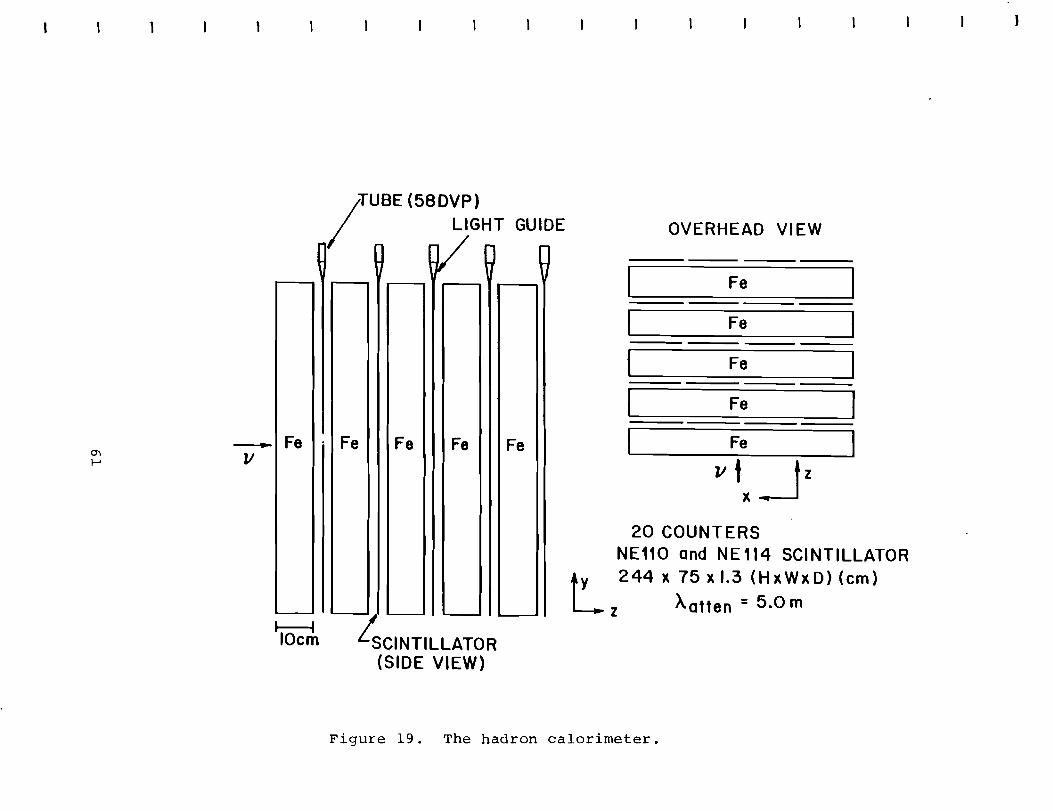
3.8 Hadron Calorimeter
The hadron calorimeter was designed to provide a crude
measurement of hadronic energy associated with neutrino-induced
events. The calorimeter consisted of five planes of scintillator
counters interleaved with planes. of 10 cm thick steel (Figure
19) • The cross-sectional area of the planes was 3 m x 2. 44 m.
Each plane consisted of 4 counters, 1. 3 cm thick of NEllO or
NE114 scintillator. Attached to the top of each scintillator was
a light guide, a Winston cone, and an Amperex 58DVP phototube.
The signals from the calorimeter were split in the ratio
1:7. Similarly to the lead glass system, the smaller fraction of
the signal was used to record hadronic energy for neutrino
interactions and the larger portion was used to measure the pulse
height of minimum-ionizing particles. Both components were input
to 1024 channel ADC units set at 0.25 pC/channel.
Since the calibration of the calorimeter in the neutrino
60
1
---JI
/
;rUBE (58DVP)
LIGHT GUIDE
Fe · Fe Fe Fe
~ IOcm lsclNTILLATOR
(SIDE VIEW)
Fe
OVERHEAD VIEW
Fe
I Fe
I Fe
I Fe
I Fe
II f x _Jz 20 COUNTERS
NE110 and NE114 SCINTILLATOR
tY z244x75x1.3 (HxWxD) (cm)
L Aatten = 5.0 m
Figure 19. The hadron calorimeter.

beam was not possible, we used the previously obtained result
from a similar calorimeter [Bodek, 1975],
dE 1.1 E = JE (23)
The mean energy deposited by each minimum ionizing track in
the calorimeter was equivalent to 2. 08 GeV of hadronic energy.
The maximum energy which could be measured by an individual
calorimeter paddle was 13.7 GeV.
3.9 Muon Identification Counters
The purpose of the muon counters was to identify muons by
range. This was achieved using two planes of scintillators,
shown in Figure 20, which were embedded in steel after 1.2 m and
2.3 m respectively, corresponding to muon energies of 1.9 and 3.4
GeV. The front plane of counters consisted of two vertical
columns Pach containing 18 scintillators oriented horizontally.
The dimensions of the 10 innermost counters were 10.2 cm x 1.52 m
x 1.27 cm, those of the next four were 20.3 cm x 1.52 m x
1.27 cm, while the outermost four counters had dimensions 27.9 cm
x 1. 5 2 m x 1. 2 7 cm. On the outside ends were light guides,
Winston cones, and Amperex 56 AVP phototubes. The second plane
contained 40 scintillators, similar to the ones in the first
62

plane, but oriented vertically in two horizontal rows. At the
tops of the scintillators were the light guides, Winston cones,
and Amperex 56 AVP phototubes. The signals from the muon 2 3
counters were split such that 5 was input to an ADC unit and 5 to
a TDC unit.
Calibration of the muon counters was achieved using the 2 x
10 5 muon triggers for which a single track was reconstructed in
the drift chambers and for which only one TOF I I paddle had
fired. From these data we calculated the relationship between
the position along the counter and the time of arrival of the
photomultiplier pulse to obtain a spatial resolution of 12.9 cm.
The X-Y position of muon candidates in the muon counters was
predicted by the downstream drift chambers. A candidate was
identified as a muon if its position was within 2. 5 standard
deviations of the predicted location. The most credible muons
were those which were detected by both the front and the back
muon planes.
The efficiency with which muons were detected in both banks
of counters was 89%. The detection efficiencies for the single
planes were 95±1% (front) and 94±1% (back). Part of the
inefficiency results from geometry and the fact that small gaps
existed in the scintillator planes.
63

l
Muon Detector
I /Tube (56 AVP)
3.0m
Fe Fe 11 3.55m ...
' ' \ J ...._ ____ 3.50m -----4~
I . • Sc1nt1llator _/
..... 4m•... 1.1m •
xLz MUB
SIDE VIEW FRONT VIEW Figure 20. The muon detector.

The detection of muons is important for several reasons:
o To determine whether the neutrino interaction was a neutral or charged current interaction;
o To differentiate between µ- and µ+ and thus determine whether the incoming particle was a neutrino or an antineutrino;
o To detect muons from the semi-leptonic decay of charmed particles.
Vµ We measured the ratio of charged current interactions to Vµ
be 0.066 + 0.020.
3.10 Data Acquisition
Throughout the experiment, four triggers were used to enable
the logging of data: the neutrino trigger and three calibration
triggers the muon, flasher/laser and sensor triggers.
The requirements for the neutrino trigger were that there be
no charged particle passing through the veto counter, that the
pulse height of TOF I be greater than or equal to that of two
minimum ionizing particles and that there be at least two tracks
passing through TOF II. In addition it was required that the
neutrino trigger occur during the fast beam spill, which was
achieved by a gate timed to include the beam spill. This gate was
triggered by the background muons associated with the neutrino
65

l
FAST SPILL (-1 msec FWB)
Horn /Bdt
/µ.'s signal from muon counters
Gv neutrino gate
__ j Gµ. muon gate
triggers
l/TRIGGER /LTRIGGER
Figure 21. The relative timing of the triggers.

beam. This method of gating the electronics was preferred to one
using timing signals of the accelerator, since the latter
fluctuated intolerably. The relative timing of the neutrino
spill and the various triggers is shown in Figure 21.
The data was read into the computer once per neutrino spill.
This process of reading and clearing the ADC units took
approximately 5 ms, compared to the neutrino spill length which
was 1 ms long. Thus, if two triggers occurred during the same
spill, for instance two neutrino triggers or a muon trigger
followed by a neutrino trigger, the counter information (except
for that of the drift chambers, which was stored in the local
drift chamber readout memory) for only the first trigger would be
recorded. To maximize the number of neutrino triggers recorded,
muon triggers were accepted only in the last 0.05 of the neutrino
spill. Since the muon flux was relatively high, ample muon
triggers were still recorded. The other requirements of the muon
trigger were that the pulse height of TOF I be equivalent to that
of one or more minimum-ionizing particles and that there be one
and only one track passing through TOF II.
In order to record lead glass .pulses from several muon
triggers per spill, a separate "sub-trigger" was used involving
individual TOF II counters and columns of calorimeter paddles.
This was done to ensure that all parts of the apparatus would
67
--
-
--
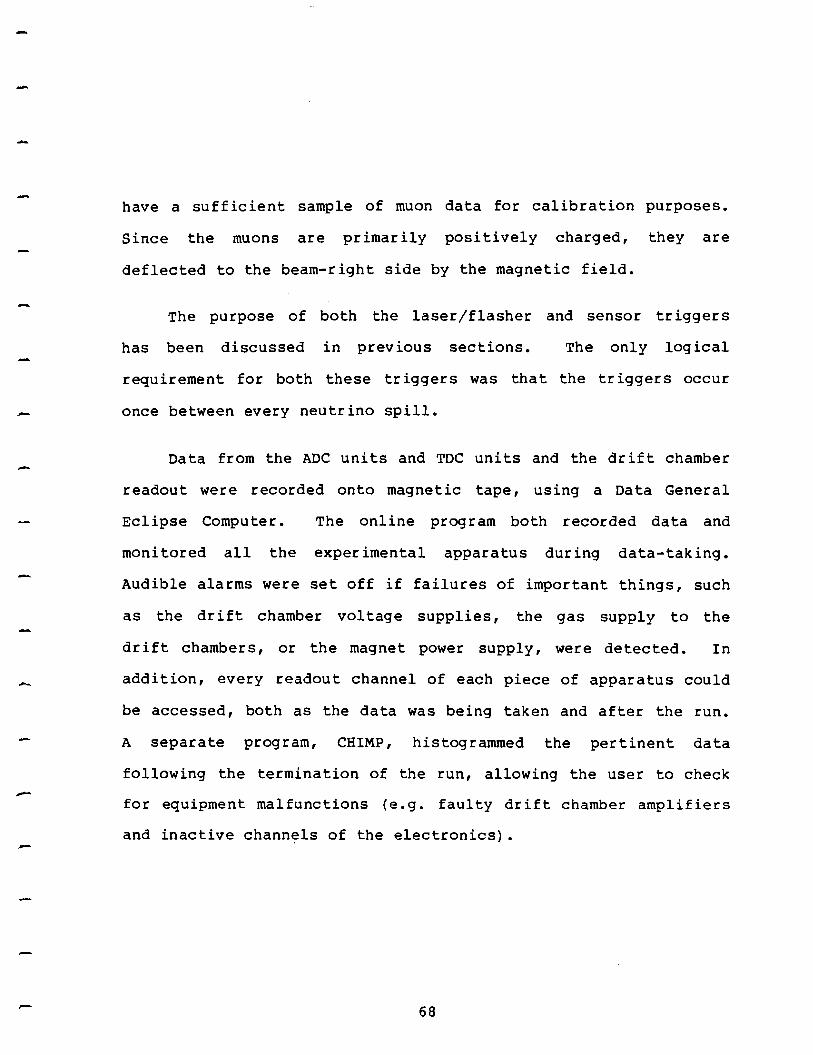
have a sufficient sample of muon data for calibration purposes.
Since the muons are primarily positively charged, they are
deflected to the beam-right side by the magnetic field.
The purpose of both the laser/flasher and sensor triggers
has been discussed in previous sections. The only logical
requirement for both these triggers was that the triggers occur
once between every neutrino spill.
Data from the ADC units and TDC units and the drift chamber
readout were recorded onto magnetic tape, using a Data General
Eclipse Computer. The online program both recorded data and
monitored all the experimental apparatus during data-taking.
Audible alarms were set off if failures of important things, such
as the drift chamber voltage supplies, the gas supply to the
drift chambers, or the magnet power supply, were detected. In
addition, every readout channel of each piece of apparatus could
be accessed, both as the data was being taken and after the run.
A separate program, CHIMP, histogrammed the pertinent data
following the termination of the run, allowing the user to check
for equipment malfunctions {e.g. faulty drift chamber amplifiers
and inactive channels of the electronics) •
68
-
-
-
4. RESULTS
Data-taking for experiment 531 took place from 18 November
1978 until 7 February 1979. During the 1250 hours of running
time, 183 magnetic tapes were recorded. The events were produced
by an integrated flux of 7.33 x 10 14 neutrinos passing through
the emulsion target (1. 7 x 10 15 v /m 2), which resulted from a
total of 7.2 x 10 18 protons incident on the neutrino beam
production target.
The data included approximately 68,000 neutrino triggers,
140 antineutrino triggers, 9 x 10 5 muon triggers for calibration,
and the flasher/laser and sensor triggers. Th us about one
neutrino trigger per seven machine cycles ( v spill) and -2 muon
triggers/spill were taken. The cycle time of the accelerator was
7 seconds long for most of the run.
Due to the inefficiency of the anticounter (11±1%), most of
the events recorded as neutrino triggers resulted from charged
particles, mainly muons, incident upon the apparatus.
Approximately 1/30 of the neutrino triggers resulted from
neutrino interactions in the emulsion target and support plate.
The mean live time of the neutrino trigger was 79%,
resulting from a 73% live time during the beginning of the run
69

when the muon flux was extremely high, a 79% live time following
the installation of additional shielding in the berm, and an 82%
live time towards the end of the experiment when the toroidal
sweeping magnets were in use.
4.1 Reconstructed and Calculated Neutrino Event Samples
Two methods were used to calculate the expected number of
neutrino interactions to be observed in the emulsion volume. The
first method extrapolated the number of neutrino interactions
found by experiment 545, which took data during the early part of
the same running period. This experiment used the Fermilab
fifteen-foot bubble chamber, filled with deuterium and with a
target mass of 2184 Kg. After corrections of about 20%, the
experiment reported - 12,000 charged current neutrino events
[Hanlon, 1981], based on an integrated flux of 2.9 x 10 18 protons
on the neutrino target. The number of events expected for
experiment 531 may then be calculated:
= m531 (n >531 flux531 N 531 P N 545 .(l.32}• (1.05} (24}
m545 <np}545 flux545
where N is the number of events; mE 531 , the mass of the emulsion
target, is 122±5 Kg; np is the number of protons incident on the
18 flux531 neutrino target, which for E531 was 7.2 x 10 ; and ~---~, the
flux 545 ratio of the neutrino flux per incident proton at the Wonder
70
-
Building to that at the bubble chamber was a factor of 2.4~0.24.
The factor of 1.32 represents the inclusion in E531 of neutrino
induced neutral current events. The factor 1.05 accounts for the
additional events induced by antineutrinos.
several factors contribute to losses in the number of events
expected to be observed on the emulsion. There were short
periods for which data-taking was disabled although the
accelerator was running: during the changing of the fiducial
sheet and during the changing of magnetic tapes, in between runs.
Also for a very small portion of the running time, the neutrino
horn was focused, intentionally, such that the majority of beam
particles were antineutrinos. The cross-section for
antineutr inos on nucleons is a factor of two less than that for
neutrinos. It is estimated that these factors decrease the
expected number of events by 10%.
Based on Monte Carlo studies, the reconstruction efficiency
of the spectrometer is approximately 65%. The spectrometer is
particularly inefficient at low energies (E < 10 GeV) since at
these energies there are not always at least two tracks through
the downstream drift chambers, as required by the neutrino
trigger and by the reconstruction programs to calculate the
vertex locations. Thus the number of events expected using this
method of calculation is 2549±500.
71
-
--
The second method of calculating the expected event yield
used a Monte Carlo simulation. Input to this was the energy
spectrum for the Fermilab wide band neutrino beam, which has been
calculated by S. Mori [Mori, 1979]. However, there are severe
discrepancies between the Mori calculated spectrum and the
observed neutrino spectrum, in particular at low energies
[Hanlon, 1980] • A neutrino energy spectrum, 511
(E), which has
been modified to agree with the data of E545 was used in the
integration:
N !350
= m O O' 11
( E ) S 11
( E ) dE , (25)
where N is the number of neutrino events, m is the target mass,
and the cross sections for neutrino and antineutrino scattering
are given by
a11
(E) = 0.63 x E x lo- 38 cm2/nucleon/GeV and
av(E) = 0.3 x E x lo- 38 cm2/nucleon/GeV.
(26)
(27)
We obtain 1927±480 as the predicted number of neutrino and
antineutrino events in the emulsion.
The reconstruction of neutrino interactions occurring in the
emulsion was achieved by reconstructing trac~s using the
information from the drift chambers. A discussion of the various
72

--
-
-
vertex reconstruction programs is given in section 5. The final,
most complete pass through the data yielded 2285 candidates for
neutrino interactions in the target reg ion. This sample was
reduced to 2022 candidates, after elimination of predictions
outside the fiducial emulsion volume.
4.2 Emulsion Processing
The processing of the emulsion modules took place at the
University of Ottawa over a three month period after the data
taking run. The fiducial sheet and the integrating sheets were
processed at Fermilab during the data-taking period. The
processing procedures were different for the vertical and
horizontal modules and for the integrating and fiducial sheets
[Ushida, 1983].
The vertical modules could be processed immediately as the
emulsion was already mounted on luci te backing. Before the
horizontal emulsion could be processed, it was necessary to stick
the pellicles to gelatin-coated lucite. Four per cent of the
emulsion was rendered unusable due to blistering during this
process. The thickness of both the vertical and the horizontal
emulsion sheets shrank by a factor of 2 during processing.
To facilitate the measurement of tracks, the emulsion was
73

I_
-
-
marked in several ways to obtain both local and relative
coordinates. The sides of the sheets in the horizontal modules
were marked with an X-ray gun at Argonne National Laboratory
prior to processing. The horizontal sheets were imprinted with a
500 µ x 500 µ optical grid which had been stuck to the lucite.
During the construction of the vertical emulsion modules the
emulsion-coated sheets had four holes punched near the corners.
The holes were used for mounting the sheets during exposure and
also later to determine a local coordinate system. The position
of the fiducial sheet relative to the emulsion target was
determined by small 55Fe sources, embedded in the support posts
of the emulsion modules, which produced marks on the fiducial
sheets.
The grain density, a measure of the emulsion quality, was
excellent:
28. 4±0. 7 /100 µ horizontal emulsion modules, 31.3±1.2/100 µ vertical emulsion modules, 32.3±1.2/100 µ fiducial sheets.
The grain density of freshly-poured emulsion is 40/100µ. Grain
density is usually determined by following charged tracks through
the emulsion and counting the number of exposed silver granules,
which appear as black dots. The above measurements were made by
following electrons which resulted from the decays of stopping
74

muons. Measurements were also made to study the effects of
fading of the exposed silver grain over the period prior to
processing. For the target modules the amount of fading was 10%
for the three month period the modules were in the beamline. The
variations from one pellicle to another were less than 3%.

5. DATA ANALYSIS
5.1 Neutrino Event Reconstruction Programs
Two independent neutrino event reconstruction programs were
used to predict the locations of neutrino-induced interactions,
which were later searched for in the emulsion. A program was
developed at the University of Toronto, which was used in the
early stages of the data analysis. Later the emulsion was scanned
chiefly using predictions of a program written at the Ohio State
University.
Toronto Program
The first step in this program was to obtain an estimate of
the vertex location. This was accomplished by making histograms
of the x, u, and v intercepts at the point z = O, which
corresponds physically to the upstream face of the emulsion, of
line segments which had been .. econstructed using any two drift
chamber hits from a particular view. The following step was the
reconstruction of up-to-down tracks, which began with the fitting
of downstream segments. The technique employed was to first
require 3 or 4 collinear hits in the downstream x chambers then
to search for consistent u and v chamber hi ts. The downstream
segments thus constructed were projected to the centre of the
76
-
magnet. Upstream segments were searched for with the constraints
that the segment lie within 2.5 cm of the vertex and within
0.65 cm of the point at the magnet mid-plane. The line segments
were reconstructed by requiring 3 or 4 hits in a particular view
and then combining these with hits from the other two views.
Acceptance of upstream track segment candidates was based on the
chi-squared per degree of freedom (CHISQ/DF) of the track and the
number of hits used.
More than one upstream track segment were retained for a
given downstream segment. To obtain the up-to-down tracks,
quintic spline fits were executed in which five track parameters
were fitted: dx/dz and dy/dz, the x and y intercepts at z=O, and
the inverse of the momentum. By taking a least squares fit to a
common vertex for all of the reconstructed tracks, the estimate
of the vertex location was refined.
Ohio State Program
The most important feature of the Ohio State program was
that two "passes" were made on every event, the first being
primarily to reconstruct the track of the muon or an energetic
hadron. Muons could be identified by penetration of the first or
both of the planes of muon counters. Tracks were reconstructed
in a manner similar to that of Toronto program. The downstream
77

,......
and upstream segments were reconstructed individually and then
joined. A trial vertex was obtained by taking the intersection
point of high momentum tracks with that of the muon. Other tracks
were searched for, including those which bent in the fringe field
of the magnet, although no upstream-only tracks were
reconstructed. If no other tracks than that of the muon or
energetic hadron could be found, the process was repeated. The
start time of the event and one or more vertices were then fitted
using the reconstructed tracks, weighting them according to the
momentum, the chi-squared, the number of hits used and the muon
identification.
The approach of the second pass was similar to that of the
first, the differences being that the fitted start time and
vertex location(s} were used as input data. Tracks which had been
reconstructed the first time were retained with the possibility
of ameliorating such tracks.
Figure 2 2 shows the distribution of the number of tracks
reconstructed in the events. The mean number of tracks
reconstructed in an interaction was 4. 8. For all the charged
current interactions, it was estimated using Monte Carlo
techniques that 71% of the interactions were reconstructed. For
neutrino energies greater than 10 GeV, 80±10% of the events were
reconstructed and for neutrino energies greater than 20 GeV, this
78

l
(/) -+-' c G.> >
300
200
All events
/
(Nr)::;f..8 tracks
w 100
1 3 5 7 9 11
Figure 22. Number of tracks reconstructed per event by the event reconstruction program. The shaded area represents those events which have an identified muon.
~13
number increased to 90±10%. These efficiencies include the
trigger efficiencies along with the program reconstruction
efficiencies, evident from the dependence of the efficiency upon
the energy of the neutrino. (The program reconstruction
efficiency is estimated to be greater than 95%.) For low energy
events, the particles are emitted at wide angles and there are
not always two up-to-down tracks, necessary for reconstruction of
the event.
5.2 Search for Neutrino Events in the Emulsion
For both the horizontal and the vertical modules, fiducial
cuts were made to exclude regions which were plagued by
distortions. This included a margin near the edges and around
the post holes of 3 mm for the horizontal modules and 2.5 mm for
the vertical modules. Additional cuts were made for the
horizontal modules to exclude regions of G-10. These cuts in the
volume to be searched reduced the number of predicted events by
12% for the horizontal modules and 13% for the vertical modules.
Two techniques were used in the search for events predicted
to occur in the emulsion target: volume scanning and track
followback. The vertical emulsion pellicles were scanned using
only the track followback technique. The horizontal emulsion
80

pellicles were primarily volume scanned although some attempts
were made to use the followback technique. The conventional
technique, volume scanning, involves the scanning of a volume of
emulsion centred around the predicted vertex.
A volume 320 mm 3 (4 mm x 4 mm x 20 mm) surrounding the
predicted vertex in the horizontal emulsion was scanned. This
method was 51±2% efficient at finding events. The method of
volume scanning was less efficient for events occurring in the
upstream and downstream portions of the horizontal modules since
these are regions of distortion. Due to multiple scattering, the
resolution decreases for tracks originating at the upstream face
of the emulsion. This effect is more pronounced for low momentum
events.
Another disadvantage of volume scanning is that events with
black tracks resulting from recoil nuclear fragments are found
more easily than white stars. (events which have no dark tracks),
thus creating a scanning bias.
The followback technique was used primarily for the vertical
emulsion modules. Tracks which were reconstructed by the
downstream spectrometer were initially searched for in the
fiducial emulsion sheet. Due primarily to the low background in
the fiducial sheet these tracks were found 96±2% of the time.
81

....
120·
100
80 Nv 60
40
20
140
120
100
FOUND EVENTS-VOLUME SCANNING METHOD
HORIZONTAL EMULSION (368 events)
-12.7 0 · 12.7 25.4 38.I 50.8 Z (mm)
FOUND EVENTS -TRACK FOLLOW I NG METHOD
VERTICAL EMULSION
(720 events)
. 80 Nv 60 'IIµ.,,..
40
20
-12.7 0 12.7 25.4 38.1 50.8 Z (mm)
Figure 23. z-coordinates of found events in the emulsion target.
82
-·
The "fiducial sheet" tracks were then followed back into the
emulsion modules with an efficiency of 90t2%. The efficiency for
finding vertices was thus 87±2%. The number of found events as a
function of the position in the emulsion target is shown in
Figure 23.
Discrepancies between the counter predictions and the
location of actual events found in the emulsion are larger than
those differences which can be attributed to the surveying
resolution. These differences which are not fully understood
are:
<Ax > = 235 µ; < Ay > = 645 µ, and < Az > = -75 µ.
The distributions of the predicted and actual coordinates
are shown in Figure 24. These distributions are for all vertical
and horizontal events, independent of the method in which the
events were searched for. The widths of the distributions are:
~x = 370 µ, ~y = 290 µ, and ~z = 1.4 mm.
83
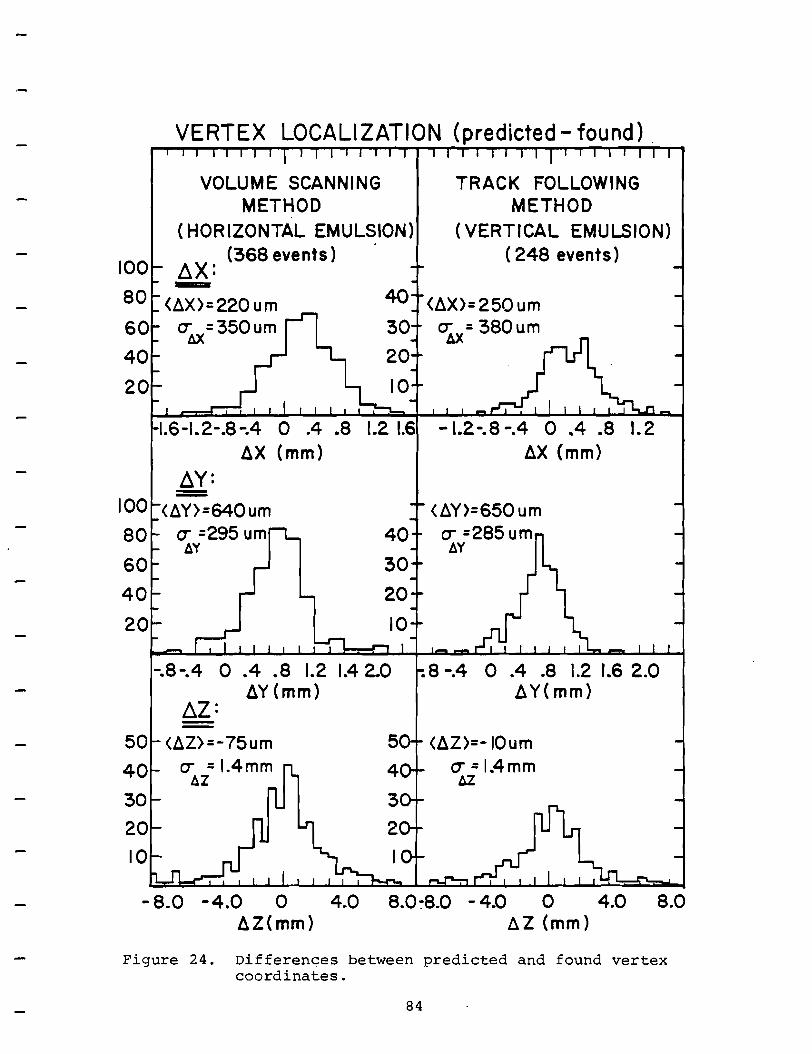
100
VERTEX LOCALIZATION (predicted-found).
VOLUME SCANNING METHOD
(HORIZONTAL EMULSION) (368 events)
~x:
TRACK FOLLOWING METHOD
(VERTICAL EMULSION) ( 248 events)
80 <~X>=220 um 60 Cit.X=350um
40 <~X>=250um 30 o-tJC= 380 um
40
20
20
10
1.6-1.2-.8-.4 0 .4 .8 l.2 l.6 - l.2-.8-.4 0 .4 .8 1.2 ~X (mm) ~X (mm)
~y: --100 <~Y>=640um <~Y>=650um
O"" =285 um 80 CT =295 um 40
30
20
60
40
20
50
40
30
20
10
~y ~y
-.8-.4 0 .4 .8 1.2 1.4 2.0 .8 -.4 0 .4 .8 1.2 1.6 2.0 ~Y (mm) ~ Y( mm)
<~Z>=-75um 5 <~Z>=- IOum
4 CT= l.4mm ~
3
2
-8.0 -4.0 0 4.0 8.0:-8.0 - 4.0 0 4.0 8.0 ~Z(mm) ~Z (mm)
Figure 24. Differen~es between predicted and found vertex coordinates.
84

5.3 Search for Charged Decays
5.3.l Horizontal Emulsion Modules
Decays of charged particles were searched for by following
tracks which satisfied certain criteria for at least 6 mm or
until the track left the emulsion module. The criteria were that dx
both the x and y slopes relative to the beam direction (dz and
~i) be less than 365 mr, the differences in the slopes measured
in the emulsion and those measured in the spectrometer be less
than 15 mr, and the relative ionization of the track be less than
4. The efficiency for finding charged decays at a given distance
was calculated by taking the number of tracks followed for that
distance divided by the number of charged tracks followed.
Figure 25 shows the efficiency for following charged tracks with
various angles as a function of the distance followed.
5.3.2 Vertical Emulsion Modules
For the vertical emulsion modules two methods were used to
search for decays of charged particles: the track following
method and the scanback method. The track following method
involved following charged tracks for at least 6 mm with certain dx dy
criteria imposed: that dz and dz be less than 200 mr, and that
the differences between the slopes measured in the emulsion and
85

00 O'I
HORIZONTAL EMULSION CHARGED TRACK FOLLOWING EFFI Cl ENCY
€ O/o
100~~~~~--~1
1. 0 ... 50 mrad 2. 50-100 3. 100-150
BO
70
60
40
30
20
10
4. 150-200 5.200-250 6. 250-300 7. 350-500 a. 500-000 9. >800
1
0 2 3 4 5 6 7 8 9 10 11 12 13 14 15 16 17 18 19 20 FOLLOW LENGTH (mm)
Figure 25. Track following efficiency as a function of the distance followed for tracks of various angles.

the slopes measured by the spectrometer be less than 15 mr. The
scanback method was identical to the track followback method used
to locate the primary vertex. (For the same reason the scanback
method was not implemented for the horizontal emulsion modules.)
Tracks reconstructed by the spectrometer, which had momenta
greater than 700 MeV/c, whose projections lay within 2.0 mm of
the primary vertex, and which had not been initially located in
the emulsion, were searched for in the fiducial sheet. The
tracks were then scanned back to their points of origin, which
was often the site of a gamma conversion or nuclear interaction.
For distances less than 6 mm the scanning efficiency for
charged decays in the vertical emulsion modules was the same as
that for the horizontal emulsion modules, since the same
technique, track following, was used.
The efficiency for the scanback technique could be
determined from the knowledge of the number of charged tracks
which had been reconstructed by the spectrometer. For a single
charged track, the efficiency for finding the track on the
fiducial sheet was Ecs = 96±2%. The efficiency for finding the
decay could then be expressed as
(28)
87

where N = L:nk and nk is the number of events of a particular
geometry with k reconstructed tracks. For charged decays the
only decay geometry considered was that of three charged decay
particles (trident). There were significant differences in the
scanning efficiencies dependent on the energy of the event. For
event energies less than 10 GeV, the decay tracks were less
likely to be reconstructed by the spectrometer since the
particles were emitted at wide angles. Using equation 28, the
efficiencies obtained were
E = o.10:8:l8 (Pcharm < 10 GeV/c) and (29)
~ = 0 999+0.00 2 ( > 10 G V/ ) ~ • -0.030 Pcharm e c , (30)
which averaged to
E charged scanback = 0 • 8±0 .1. (31)
5.4 Search for Neutral Decays
5.4.1 Horizontal Emulsion Modules
Only the volume scanning method was used to search for
decays of neutral particles in the horizontal emulsion modules.
88
The volume scanned was a cylinder of radius 200 µ and length
1000 µ downstream of the production vertex.
The efficiency for volume scanning was deduced from the
efficiency for volume scanning of e+e- pairs produced in neutrino
interactions. The number of e+e- pairs found may be compared to
the number expected from the conversion of 1To in the emulsion,
which is approximately 2 per neutrino interaction. This
efficiency was expressed as
f(Z) = 0.7 - 0.0006z ( 3 2)
where z, the distance between the gamma conversion point and the
primary vertex, is between 10 and 1000 µ •
Al though the process of volume scanning for neutral charm
+ - . + -decays is identical to that for an e e pair, the e e pair
should be more visible since the two tracks initially lie on top
of each other to effectively create a 2x minimum-ionizing track.
In contrast the divergent tracks from the charm decay vertex will
only be those of minimum-ionizing particles. Thus the efficiency
for finding e+e- pairs is an upper limit to the efficiency for
finding charm decays.
89

5.4.2 Vertical Emulsion Modules
Decays of neutral particles in the vertical emulsion modules
were searched for by the methods of volume scanning and scanback.
The volume scanning method involved the scanning of a volume
600 µ x 600 µ x 1000 µ •
The scanback method was the same as that used for the
charged decays. This method was particularly useful for events
in which the decay vertex had been found first and mistakenly
identified as a primary production vertex having no black recoil
tracks. Using the scanback technique the primary vertex could be
located. The method of determining the scanning efficiency for
the volume scanning technique was the same as that for the
horizontal emulsion modules, that is, a calculation based on
locating the points of e+e- conversions.
The scanning efficiency for finding neutral decays by the
scanback method could be calculated using equation 28. Three
charged particle geometries were observed for the neutral decays:
two-prong, four-prong, and six-prong. The overall efficiency for
the finding of neutral decays by scanback, which was obtained by
taking a weighted average of the efficiencies for two-, four-,
and six-prong decays, was E = 93. 8%. In general the charm decay
candidates which were produced with low momentum were the
90

baryons. Apart from one event which is consistent with a neutral
baryon hypothesis [Errede, 1981], all of the neutral decays
resulted from the decay of a charmed meson whose momentum was
generally greater than 10 GeV/c. Thus for the neutral scanback
technique there is no dependence upon the parent momentum.
5.4.3 Overall Scanning Efficiencies
The scanning efficiency at each distance was obtained by
combining the efficiencies for each of the scanning techniques
used at that distance, weighted by the number of events found by
each technique. Although the emulsion scanned at the University
of Ottawa and Korea University was of the vertical type, it was
not scanned by the scanback technique and it is therefore
included in the average of the scanning efficiencies for
horizontal modules at distances greater than 30 µ.
For the horizontal emulsion modules both the charged and
neutral scanning efficiencies were simply the volume scanning
efficiency in each region. The charged scanning efficiency for
the vertical modules included efficiencies for both the track
following and scanback techniques. The neutral scanning
efficiency for the vertical emulsion modules encompassed the
efficiency for volume scanning and for the scanback technique.
The charged and neutral scanning efficiencies are shown in
91

TABLE 2. Summary of Emulsion Scanning
Computer predictions of v events
II events found
Scanning efficiency
Charged track followed (including muons)
Nuclear interactions found
Single-prong events
e+e- pairs
Vees (strange particles)
Neutral charm candidates
Charged, multi-prong, charm candidates
Charged, single-prong, charm candidates
92
2022
1248
69%
34.8 m
89
48
199
4
21
22
5

CHARGED DECAY SCANNING EFFICIENCY
100
90
80
70
60 E(0/o)
50
--- -- --- - - --- --p/IO~V/c
\.0 w
40 --------- - -- - -p<IOGeV/c c
30
20
10
1µ.m 10µ.m 100µ.m 1mm 1cm 10cm FLIGHT LENGTH
Figure 26. Charged Scanning Efficiency as a function of the Flight Length.

NEUTRAL DECAY SCANNING EFFICIENCY
100
90
80
70
60 E (0/o)
\0 50 ""'
40
30
20
10
0 1µ.m 10µ.m 10011.:m 1mm
FLIGHT LENGTH 1cm IOcm
Figure 27. Neutral Scanning Efficiency as a function of the Flight Length.

-Figures 26 and 27. The scanning efficiency is not a constant
over the entire length of the emulsion. At short distances the
efficiency is quite low because of nearby tracks obscuring
decays. The efficiency depends upon the diameter of the primary
vertex which is given by
D = 0.25(Nh + Ns/2) + 1.80, for D ~ 3 µ, ( 33)
where Ns is the number of minimum ionizing tracks and Nh is the
number of black recoil tracks. For distances less than 3 µ , two
tracks cannot be resolved.
At large distances, the efficiency is also low because the
scanback technique was possible only for the vertical emulsion
modules.
5.5 Backgrounds to Charm Decays
The background to the multi-:~ong charm decays can be
calculated using the number of nuclear interactions which are
observed. Of the 89 nuclear interactions, 5 events do not have
black recoil tracks, but are identified as nuclear interactions
because they are not charge-conserving. (In four of the events
one minimum-ionizing track becomes two tracks, while in the fifth
event a minimum-ionizing track appears from nowhere.) Since the
95

emulsion is betweeen 0.9 and 1.4 percent hydrogen, one expects to
find 2.3±1.8 events which are hydrogen interactions, which always
appear as non-charge-conserving. Thus there are 2. 7 events,
which result from a charged or neutral particle interacting with
a bound proton in the emulsion. The number of protons and
neutrons in the emulsion is roughly equal. Thus one would expect
the same number of interactions occurring with neutrons, which,
in contrast, appear as charge-conserving.
Using the data of 79 of the nuclear interactions, the
relative number of events, N, as a function of the number of
minimum-ionizing particles in the event, ns, is [Bailey, 1983]:
dN a e -0. 48ns dns
( 3 4)
The fraction of multi-prong interactions (ns ~ 2) is 0.4~8:I·
The number of background, multi-prong interactions is 0.4 x 2.7 =
1.1~8: ~ events for all energies. If one considers only events
with momentum greater than 4 GeV/c, the expected number of
background events is 2 0.2. This is calculated using the
empirically derived (from all hadrons with momentum greater than
1 GeV/c) relation
2All but one of the charged, charmed, multi-prong events (549-4068) have momentum greater than 4 GeV/c.
96

(35)
where n is the number of hadrons with momentum p.
The number of single prong or kink events found in the
emulsion is 47, of which 40 are not charm events [Ushida, 198l].
Using primarily a transverse momentum cut, the number of events
which would simulate charm decay is estimated to be 0.3.
Of the 4 7 kink events, 4 are fitted as decays of charmed
particles. Of the 43 remaining events, two-thirds arise from
incident positively charged hadrons, which we use to estimate a
background to the number of charmed decays. 3 The number of single
prong events as a function of the transverse momentum at the kink
vertex is
dn a e-9p.l. dp (36)
If one considers only single prong events which have transverse
momentum greater than 0.5 GeV/c, the number of expected
3The charmed decays are primarily positively charged. An estimate of the total number of single prong background events is obtained by correcting the positive-only number, on the basis of the v flux.
97

background events is 0.3 events. 4
5.6 Analysis of Events with Short Decays
Events which contained multi-prong decays and single tracks
which were observed to kink were analysed using computer programs
at Fermilab and the University of Toronto. For these events, the
scanning of the emulsion provided the decay lengths, the slopes
(dx/dz and dy/dz) for all observed charged primary and secondary
tracks, and the slopes of the decaying parent. It was also
possible to obtain ionization and p/J measurements for charged
tracks found in the emulsion, although this was not routinely
done.
The analysis of charm decay candidates proceeded in two
stages. The initial step was the reconstruction and momentum
analysis of the event. Once this had been accomplished, the
kinematic fitting of the events, in which the identity of the
decaying particle was searched for, was possible.
At the University of Toronto, the analysis of the charm
candidates was performed using a VAX 11/780 computer system. The
4one of the five single-prong, charm events (671-7015) has transverse momentum less than 0.5 GeV/c.
98

reconstruction of the tracks of charged particles using the drift
chamber hits and the general visual analysis of the data
contained by the lead glass system and the hadron calorimeter was
done using the program PSANAL2. Reconstruction 0 of tr s was
accomplished with the program PIGAM and, if necessary, the
kinematic fitting program TESTKIN. The overall kinematic fitting
of the event in which a particular decay hypothesis was assumed
was done using TESTKIN in the case of constrained fits. For fits
which could not be constrained, that is, events containing
unobserved neutral decay particles (neutrinos and tr0 and K0 which
missed the lead glass or calorimeter), zero-constraint
calculations were performed using the program ZEROC.
Several data files were used as input for the charged track
fitting program PSANAL2. All of the emulsion data (dx/dz and
dy /dz for all of the decay and production tracks, the decay
length, and dx/dz and dy/dz for the decaying parent) were
manually transferred to the file CHARMINGl.DAT after being
received from Japan via TELEX. The spectrometer data for each
charm candidate event was transferred from the magnetic tape
recorded during the data-taking run to a disk file CHARMALL.DAT
by a program which selected events by their run and record
number. Data files containing the measurements of the magnetic
field and the results of the drift chamber tuning program, which
99

provided drift chamber tuning parameters {most importantly the
drift velocity as a function of time), were also used.
PSANAL2 was capable of running in both non-interactive
{automatic) and interactive modes. In general, the program was
first used in the automatic mode to search for tracks. The
method used was to first reconstruct downstream track segments
using the drift chamber hits. such segments could be found
easily since only about half of the charged tracks for any
particular event reached the downstream chambers. Also, because
the downstream tracks were usually well-separated, few spurious
permutations were possible. In contrast, the upstream drift
chambers were usually filled with many closely-spaced hits,
making it difficult to disentangle overlapping tracks. Once the
downstream segment had been reconstructed, it was projected
through the magnet gap to the emulsion vertex. Drift chamber
hi ts in the upstream chambers within 2. 54 cm of the projection
were searched for and if found were combined with the downstream
hits in a refit of the entire track. Fits for tracks which had a
CHISQ/DF larger than 6. 0 were discarded. The results of the
attempted and successful track reconstructions {both the up-to
down and downstream-only) were compiled in the output file
PRINT.DAT.
At this point the results of the track reconstruction were
100

manually compared with the emulsion data. The information for
tracks whose angles corresponded well with those in the emulsion
were retained for later sessions with PSANAL2.
In the interactive mode it was possible to select various
hits in an attempt to find up-to-down or up-only tracks, guided
by the visual appearance of the hi ts and the slopes of the
emulsion tracks. It was not possible to interactively fit
downstream-only track segments nor did an interactive routine
exist for the kinematic fitting of Vees, that is, neutral
particles which decayed in the drift chambers or in the magnet
gap. Along with the upstream and downstream drift chambers in
all three views, visual displays of the TOF II counters, the
calorimeter counters which contained signals, and of the entire
lead glass array could be made on both a Tektronix scope terminal
and on paper copies.
The identification of the charged particles was done by
several means. The identification of a charged particle as a
muon was done within the PSANAL2 program, using the criterion
that a signal be
standard deviations
drift chamber track.
observed in the muon counters within 2.5
of the point predicted by the downstream
Every charged track was examined to see if
it satisfied this criterion.
101

I .
20
1200
K-l
800 400 0
MASS (MeV)
400 800
Figure 28. The mass spectrum found using time-of-flight.
1200

1.8
1.6 I -Io
1.4
I-' 0 w
1.2
1.0
0.8
0.1
IONIZATION LOSS IN EMULSION
0.2 0.4 0.6 1.0 2.0 4.0 P{3 (GeV/c)
10.0
Figure 29. Relative ionization loss in emulsion as a function of pp for various particles.

The identification of a charged particle as an electron or
positron was done manually after the examination of the lead
glass system. Particles which deposited energy in a lead glass
block approximately equal to their momentum measured using the
drift chambers, were considered to be electrons. {In fact the
measurement of the energy deposited in the lead glass should be
the more accurate since it included the energy of the photons
radiated by the electron or positron through the bremsstrahlung
process.)
Charged particles not identified as a muon or as an electron
were considered to be hadrons. For particles with momenta
greater than 700 MeV/c and less than 5 Gev/c hadron
identification was possible using TOF and emulsion measurements.
Pions could be distinguished from kaons up to 2.5 GeV/c and kaons
could be separated from protons up to 5 GeV/c at the 90%
confidence level. Figure 28 shows the mass spectrum observed
using TOF. The relative ionization loss in the emulsion versus
pp for several charged particles is shown in Figure 29.
The next stage in the process involved an analysis of the
lead glass system. Paper copies of the outpu_t of the program
PSANAL2 were manually examined. The invariant masses of
candidates for
per mutations of
were calculated
the lead glass blocks
104
using all
in which was
possible
deposited
energy not associated with incident charged particles. Candidates
within one standard deviation of the rr 0 mass were retained for
later kinematic fitting. Isolated blocks which could not be used
to form rr0 s were later used in the invariant mass calculations of
* * the systems F -> Fi' and D -> Di'.
The hadron calorimeter was also examined manually. Energy
deposited in the calorimeter which could not be attributed to
that of incident charged hadrons was considered as evidence of
neutral hadrons. In this regard, it was useful to refer back to
the drift chambers for evidence of a K0• It was not usually
possible to measure the angles and momenta of K0 although such
was possible if the hadron shower started in the lead glass
array, which had much finer angular resolution.
Having reconstructed charged and neutral particles from both
the primary and secondary vertices, the overall kinematic fit of
the decay could be accomplished. The hadronic masses used in the
kinematic fit were based on TOF identifications when these were
available. When a particle was not identified at the 90%
confidence level (because it was too energetic or it did not pass
through the TOF II padd_les) separate calculations were performed
for every possible hadron particle identification. If several of
the decay particles were unidentified, the analysis of the event
became much more tedious because of the additional hypotheses.
105
Two programs were used in the kinematic fitting -- TESTKIN and
ZEROC.
TESTKIN was used for constrained fits, that is, in cases
where the number of independent equations describing the decay
exceeded the number of unknown parameters. For a kinematic fit
performed on one decay vertex, all of the variables are linked by
4 independent equations of momentum and energy conservation. The
program, TESTKIN, was also capable of simultaneously fitting two
vertices, in which case there are eight independent equations of
momentum and energy conservation.
In order to perform a constrained fit it was necessary to
know the angles (dx/dz and dy/dz}, the momentum, and the mass for
each decay particle. These parameters could either be constants,
as is the case with the masses, or measured parameters which
could be shifted slightly during the fitting. In general the
Initially, a 2-constrained fitting proceeded in two steps.
constraint fit was performed in which the mass and the momentum
of the parent were calculated. Then a 3-constraint fit was
carried out in which the only quantity to be fitted by the
;Program was the momentum of the parent. The mass of the parent
was assumed to be that of a Do (1863 MeV/c 2}, o± (1868 MeV/c 2},
F± (2030 MeV/c 2}, or A+ c (2285 MeV/c 2}. usually Cabibbo-
suppressed decay modes were not used in the 3-constraint fits.
106
The confidence level for the 3-constraint fit indicated how well
the event could be kinematically fitted when a particular parent
and decay mode were forced upon it. Only those hypotheses for
which the 3-constraint confidence level was greater than 1% were
retained.
ZEROC performed zero-constraint calculations of momentum and
mass for events containing unobserved neutral secondaries
(neutrinos, neutrons, and 1To, which could not be
reconstructed) . In this case the four independent equations of
momentum and energy conservation are balanced by four unknown
quantities the momentum of the decaying particle and the
momentum, dx/dz and dy/dz of the unobserved neutral particle. A
particular parent mass must be assumed in order to solve the
equations. ZEROC also allowed one to step through a range of
parent masses from which one could generate a parabola-shaped,
-1-constraint curve of the mass of the particle versus its
momentum. This curve was used to indicate the minimum mass which
the decaying particle could have for a particular decay mode. In
general there are two momentum solutions for the zero-constraint
calculation (the two points at which a horizontal line crosses
the parabola) . For events for which the minimum of the
-1-constraint curve is at the mass of the assumed parent, there
is only one solution. For some events, in particular those with
107
missing rr0 or K0, it was possible to eliminate one of the
solutions because the angles and momentum predicted for the Ko or
rr0 were ruled out by the spectrometer.
If the decay contained a muon or electron, the existence of
a neutrino was necessary for lepton conservation. In addition,
the neutrino could be used to balance the transverse momentum at
the decay vertex. For these events, the only possible method of
analysis was with ZEROC, since the neutrino was never observed.
Other events were initially analysed for charged only decay
modes. Transverse momentum imbalance at the decay vertex and a
fitted mass far below that of the known charmed particles, yet
too high for a strange particle, usually necessitated the
addition of at least one neutral secondary. {Four of the neutral
decay candidates were in fact consistent with the decay of
strange particles.) This neutral secondary could be 0
a 'Tr ,
reconstructed using the lead glass, or a K0 or n, inferred from
the hadron calorimeter.
For those events containing rr0 candidates, constrained
kinematic fits for the decay could often be made, since the
angles and the momentum of the rr0 had usually been calculated.
Each fit using TESTKIN assumed a particular decay hypothesis. If
the event contained more than one 7To candidate, separate two-
108
-
vertex fits (the charm decay and the rr 0 decay) were performed
using the different possibilities in order to minimize the chi-
squared of the fit.
Constrained fits could not be made immediately for events
which contained K0 and n, since the coarseness of the hadron
calorimeter was so great that it was useful mainly as an
indicator of the presence of neutral hadrons rather than as a
detector which measured angles and momenta. Zero-constraint
calculations were made for all possible decay modes. The results
of these calculations, in particular the predicted angles and
momentum of the missing K0 could then be compared to the
spectrometer data. Often a K0 decay in the drift chambers could
be manually reconstructed or at least pieced together if evidence
in the form of downstream segments existed. Or, the hadron
shower could have begun prematurely in the lead glass since the
blocks were 2/3 of an interaction length. Thus, angles and
~nmenta for the K0 could be estimated and then used as input for
a constrained fit for the charm decay.
Several other calculations were made in order to improve the
interpretations of the events. The existence of excited states
+* +* ""' ""'* D- , F- , and ~c and ~c was systematically searched for in each
event using energy observed in the lead glass (which had not
already been used in the fit of the ground state charmed
109
-
-
particle) to construct rr 0 and Y. The invariant masses of pairs
of the charged and neutral decay particles were calculated in
order to observe evidence of resonant states such as K* and ~.
Associated with each decay hypothesis is the proper decay
time of the event, which is calculated using the formula
L t = {3Yc
= Lm _, pc
(37)
where L is the decay length, p is the momentum, m is the mass and
c is the speed of light.
The interpretations of events as either 116 or F± could be
easily made. A proton or 11° in the decay products signified a
baryon parent hypothesis. In the case of the F±, the minimum
mass of each of the events, that is, an all-pion hypothesis is
too high to be consistent with the mass of the o+. For these
reasons the charged particle data sample has been divided into
three categories -- Ab, F±, and o±/ambiguous -- for the purpose
of the lifetime calculations.
110

-
6. LIFETIME AND MASS CALCULATIONS
The method of maximum likelihood [Frodesen, 1982] may be
used to estimate an unknown parameter u, from a set of n
Given the probability density function
f(xilu), the likelihood function
~ (u)
n = nf(xilu),
i=l (38)
where ;e (u) represents the joint probability of the observations
for a fixed u. The best estimate for the parameter u is that
which maximizes -l(u).
For a particle decaying with lifetime, 1, and an exponential
decay distribution, the probability density function, assuming
all measurements of the decay time, ti, are equally likely, is
given by
(39)
If the detection efficiency, f(li)' for the decay lengths, li, is
not constant, the density function becomes
( 40)
where Ai(/) is a normalization factor given by
111
( 41)
The normalization factor, Ai(T), is necessary to insure that
( 42)
The likelihood function is thus given by
~ (T) N
= n f (till) ( 43) i=l
N -t·/1 1 e 1
= TI E(li)T Ai (1) • i=l
{ 44)
The best estimate of the lifetime, 1, is that which maximizes
£ (T) <£max) • The one . standard deviation ( 6 8 • 3 % confidence
level) limits on the lifetime may be calculated by finding the
values of / for which ~ (1) = e-0 • 5Lmax· The two standard
deviation (95.4% confidence level) limits are those I values for
which o"t(1) = e-2,t'max·
6.1 The F±
The four events shown in Table 3 were fitted as decays of
the F±. A photomicrograph of one of the events appears in Figure
30. The minimum masses exclude o± interpretations for the first
112

a)
b)
0
0 SOµm ...__.....__..._....._ __ _ RUN.609 REC.1768
.. - . ~--. . ·a. .. :-·· •• .-- .' ~· . ' ~. .. .•. , .. · ..
; • - *':A,:.:.... . .. •. . . . ;. . : .~ .. --· ... ~:- . ;.:( .
' . . -~-. ,.. .•. ' . ... .. ... . : -· .. ' ....... _ .
' "~---. . -·- ... ....
~· • ,. . . . ..
• i-· . ... \. ·.
t---300µm--til w ,,.._ ____________ 443 JJm _.....;. _ ___;~;......-..;...__ ____ ~.,
SOµm RUN.527 REC.3682
.! --·
. ·- ... i · •
r ~-.:.-~:---· ... ... ;:.· . ' . . ·'· ;_ -~·~··
.. ·' ... -, .. ' ·. .f
670µm
Figure 30. a) A photomicrograph for a neutral charm decay. b) A photomicrograph for event 527-3682, an F
decay candidate.
113
~- .
'! .:
. ·· .

-
three events. The events are discussed individually in the
Appendix.
Using the method of maximum likelihood, the F± lifetime is
determined to be 1.9~5:~ x lo-13 s. The average F± mass, 2057±38
MeV/c 2 , was found by fitting a Gaussian distribution to the
+ Gaussian ideograms of the masses of the four F- events, as shown
in Figure 31. The solid line represents the sum (normalized) of
the four individual Gaussian ideograms. The dashed line is the
Gaussian fit to the data. The lifetime changes to 2.0 x l0-13
seconds if the last, low momentum event is not considered.
TABLE 3. Fitted F± Decays
Event Decay Decay 2-C Pcharm Decay Number Length Hypothesis Mass Tim~13
(µ) (MeV/c 2> (GeV/c) (10 S)
527-3682 670±4 F -> 1T - - + 0
1T 1T 1T 2021±60 12.4±0.3 3.65±0.09
597-1851 130±11 F+ -> K+rr-rr+Ko 2082±71 8.8±0.2 1. 00±0. 09
638-9417 153±8 F+ -> K+K-rr+rr0 2077±51 6.1±0.1 1.69±0.09
671-7015 65±5 F+ -> K+Ko 2048±112 2.9±0.1 1. 57±0 .10
Figure 32 shows the Gaussian ideograms for the masses of all
events for which Cabibbo-favoured F± decay modes we.re possible.
These are the decay modes K+K-(n~), K+K0 (n~), K-K0 (nrr), and (nrr),
where (nrr) stands for any number of charged and neutral pions.
114

I-' I-' Ul
l
.... CS> csi
co CS> CS> csi
1600.B 1800.B 1900.e 2000.0 2100.e 2200.0
Mess IMeV/c••21
l l
2300.0 2't00.0 2500.0
Figure 31. Gau~~ian ideograms for the four fitted F± events, shown by dotted lines. The solid curve is the sum (normalized) of the four dotted lines. The dashed line is the Gauss~an fit to the four entries, whi2h has a mean of 2057 MeV/c , a standard deviation of 39 MeV/c
2and a CHISQ of 0.64. The peak of the solid
curve is at 2064 MeV/c .
>

-15) cs)
co 15) CSI
>- Gi .. .0 Cl ID D & 0 ~
Q_ Gl
16ee.e
.. ... ..
···. •' ~
l )
Figure 32. Gaussian ideograms±of the 2-C masses for all events with Cabibbo-favoured F decay modes. The solid curve is equal to a constant times ~he sum of dotted entries. The peak occurs at 2037 MeV/c .
Ill
I m

-
-
Most of these events, which have multi?le acceptable decay
hypotheses, are discussed later as part of the o± sample. The
solid line in the figure represents the normalized sum of the 13
individual ideograms. The peak of this distribution appears at
2039 MeV/c2. There is also a less pronounced peak occurring at
approximately 1850 MeV/c 2 • This may be interpreted as the mass
of the o± for its Cabibbo-suppressed decay modes.
p* Production
TABLE 4. Summary of p* Production
* o2 Event F Mass ---(MeV/c 2) (GeV2)
527-3682 2163±21 2.69±0.11
597-1851 no candidate 6±3.5
638-9417 2136±23 9.57±0.82 2124±23
671-7015 2155±35 0.10±0.03
* Table 4 gives the F -> FY candidate masses, where the mass
of the F has been constrained to be 2030 MeV/c 2 , and the 02
* values for the four F events. The average F mass is 2151±14
MeV/c 2 . o2 is the standard scaling variable for lepton
reactions:
117
- (p -p I) 2 J, J,
where P;, is the 4-momenta of the incident lepton, in our case the
and p ' - J.
charged
is the 4-momenta of the final state lepton, the µ-
current interactions. 5 For charged current
interactions, o2 is a measure of the momentum transferred through
the w+, which is emitted by the vµ, to the target nucleus which
the~ becomes part of the final hadronic system.
Along with the usual mechanism for neutrino charm production
in which the w+ interacts with a valence or sea quark of the
target nucleus to produce charm, it is expected [Gaillard, 1975]
that diffractive production of charm should contribute
* significantly to the rate for F production. In this mechanism,
the w+ itself "decays" into a cs pair, to which it couples with
strength cos ec. The cs, which is produced with JP= i-, is an
F* which decays electromagnetically to FY. For such a process,
th~ momentum transferred to the hadronic system, o2 , should be
small, since the target quarks are not struck by thew+.
Based on the small sample size, it is difficult to conclude
how significant the contribution of diffractive production is to
5For event 597-1851, the o2 value is an estimate, since the µ is not observed.
118
F* production. * . 2 Two of the F events have relatively low Q ,
although the interpretation of event 671-7015 as the decay of a
charmed particle is subject to some doubt because of its low
momentum. * The ratio of F:F production (at the primary vertex}
is expected to be 1:3 on the basis of spin counting. The data is
in agreement with this ratio -- three of the four F events are
consistent with the decay F* -> FY.
6.2 The A~
The eight decay candidates shown in Table 5 have been
identified as A6. Each of these events, which are discussed
individually in the Appendix, has an identified baryon in the
decay products.
The lifetime of the /\b obtained by the maximum likelihood
method is 2.3~6:~ x lo-13 s.
The invariant masses of all possible A67T' combinations are.
shown in Table 6 and plotted using Gaussian ideograms in Figure
33. Most events contribute more than one ideogram, since each
event can have several rr± or rr0 • Both the A6rr+ (Figure 34} and
the A6rr- (Figure 35} plots show two-peak structures which
contribute to the two prominent peaks of Figure 33. These plots
do not change significantly if the data is restricted to only
119

TABLE 5. 116 Decays
Event Decay Decay Fitted Pcharm Decay Number Length Hypothesis Mass T'
(µ) (MeVic 2) (GeV/c) (10_:~3 S)
476-4449 27.7±2.8 11+ -> + - 0 o-c 4.65 0.45±0.05 c 7T7TP(K)
498-4985 180±5 11+ c -> Ao1T+1T-1T+ 2274±44 8.30 1. 65±0. 05
499-4713 366±6 11+ c -> .Eo1T+ 2220±25 3.97 6.99±0.14
549-4068 20.6±2.0 11+ -> p7r+K- (7To) o-c 1.7 0.92±0.09 c 2.6 0.60±0.06
602-2032 283±5 11+ -> p1T-1T+ (Ko) o-c 3.3 6.51±0.12 c 6.4 3.36±0.06
(4. 48±1. 4)
610-4088 221±4 11+ c -> 1T+1T+1T- (/\0) o-c 6.4 2.62±0.05
650-6003 40.6±2.0 11+ c -> 1T+1T+1T- (/\0) 2135±75 5.77 0.53±0.30
567-2596 175±5 "+ c -> p (Ko) o-c 6.2 2.1±0.1
pions which have up-to-down tracks. However, for both the /\67T+
and 1167T- plots, it is possible to eliminate one of the peaks by
excluding, in each case, one of the events. 6 Figure 36 shows the
invariant mass plot for this subset (4 events) of the data.
Several theoretical papers [de Rujula, 1975: Lee, 1977;
Copley, 1979] have addressed the topic of charmed baryon masses.
6For the 11+7T+ case this is accomplished by eliminating the 2446±5 entry:cfor the A67T- case, the entries for event 567-2596.
120
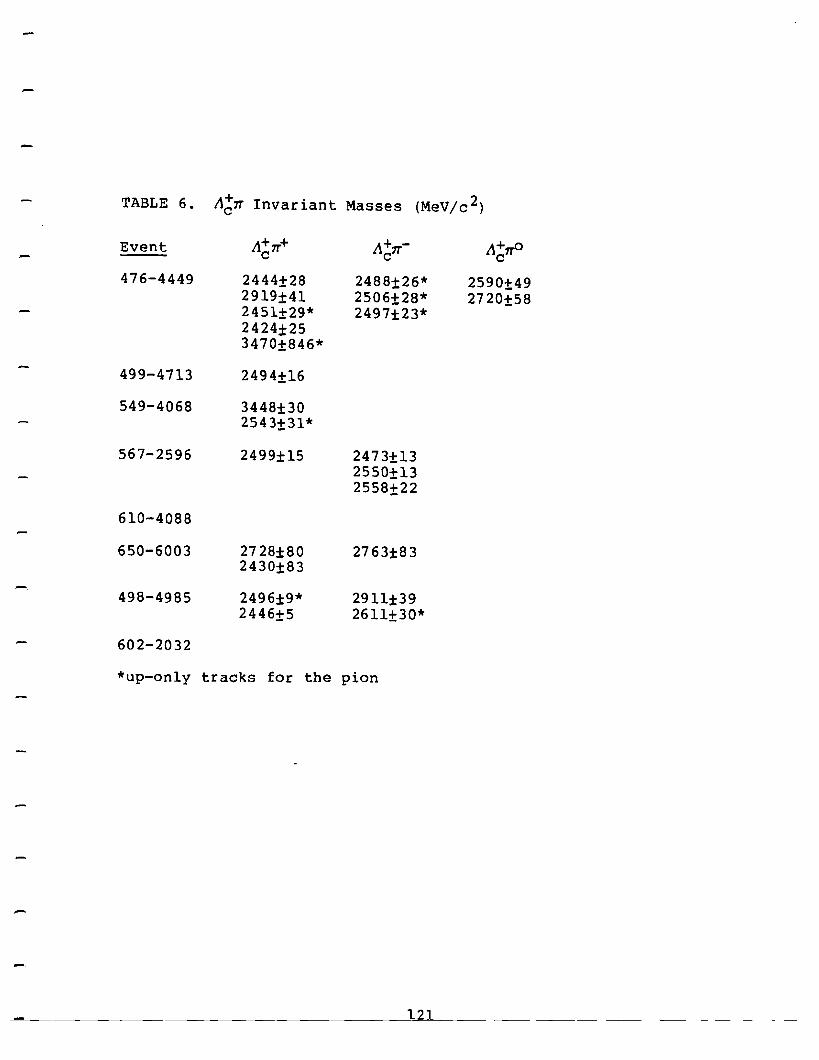
TABLE 6. A67T Invariant Masses (MeV/c 2)
Event n+7T+ A+ - L\+,r> c c7T c 476-4449 2444±28 2488±26* 2590±49
2919±41 2506±28* 2720±58 2451±29* 2497±23* 2424±25 3470±846*
499-4713 2494±16
549-4068 3448±30 2543±31*
567-2596 2499±15 2473±13 2550±13 2558±22
610-4088
650-6003 27 28±80 2763±83 2430±83
498-4985 2496±9* 2911±39 2446±5 2611±30*
602-2032
*up-only tracks for the pion
121

ID ISi csi
>-.. ii «> .a ~
I-' 0 CS! N .... ISi N a.
2200.0
Figure 33.
.. : : .. .. : : .. .. . .
". ·······
Mass lMeV/c .. 2J 2ee0.0 2900.e 3000.0
Gaussian ideograms for the invariant masses of all A+ ~ combinations. Each A+ may contribute more than one c entry. The solid ling is equal to a constant times the sum of the dotted entries.
"' ... ISi a)
... CS! ISi
ID ISi ISi m
ID ISi IS! ISi
~ ISi ISi csi
1\1 ISi ISi csi
ISi
3100.B a)

>-+>
. .0 ~
....... D 0
N ... w Q.
IO <SI csi
;t m csi
1\1 CSI ai
i I , •' •' .. ,· .. •' .. .. .. •' .. ·: .. •' " " .. . . . . : :
. "
I• .•. .. . :: :·
.. \
. l
~ L..~_........,.·~··E··=":":":C.·~·:~f_;_!~f~~tJ~f~'.~~<~r~\~·:~::~:~::ii:i;===::==··~··="="="=··=··=·=··~·~··~·t;::;~~··~"-··....::::::;~-.-----...._-..J<SI <SI csi zzee.e 2300.e Z'tee.e 2s00.0 2see.e 21ee.e 2see.e 2see.e 3eee.e 3100.e
Figure 34.
Moss (MeV /c .. 21
Gaussian ideograms for the invariant masses of all A+ combinations. c
+ 1T

.... CSI csi
rr-~~--.~~~"""T~~~-.~~--T"'""--~---,r------r--~~-r-------""T""'-------r---~--. ~ CSI csi
.. .. .. .. .. .. . . .. . . . . . . . . . .
... ... . .. ... . .. : :: ... . ..
: ·< ~ :~: :.r .... : , .. i~ ·.
.. .. . . 'I ,•o .. . . . . . . ..
. ff\.\/~ ... : .. :} ·.:<:\ \ ....
.··· ..
..·········
l\J -CS> csi
:r CSI CS> csi
CS> --~~---'-~-----'---~--......,..a..;_~_..~··~.;~·~···~~-~·~~~·w·-·=:-·~--...;.a..------...a.;.------~--.;.:..:..,...;;i....,. ____ ...JCS>
t,ae.e 22ee.a z3ee.e 2'iea.e 2see.e 26ea.e 210a.e 2e00.e 290e.e J000.e csi Mass (MeV/cu2J
Figure 35. Gaussian ideograms for the invariant masses of all A+ ~ combinations. c

I-' N l11
>-., ii C) .0 0 ....
Q.
~ & &
M GI &
1\1 GI csi
... GI csi
CSl ... .... ...
...
(
.. .. .. .. ..
:
... : . .
... . . . ·· .. ·: . . .
. . . .
... GI csi
. . . . . .. . . . • . . . . . . . • CSl
m 2200.0 2300.0 2'fee.e 2s00.0 2se0.e 2100.0 2e00.0 2900.e 3000.0 3100.e m
Figure 36.
Mess IMeV/c .. 21
Gaussian ideograms for the masses of a restricted set of combinations. The data plotted represents entries for four A+ events. The peak is at 2495 MeV/c2.
c

* These predict the masses of the Le triplet and the Le triplet to
be separated by about 60 MeV/c 2 and to be approximately 2500
MeV/c 2• Both the Ee and the E~ are expected to decay to the A6
by emission of a pion.
The evidence for the existence of these two charmed baryon
states is not compelling, given that one of the invariant mass
peaks can be made to disappear by a small restriction to a subset
of the data. The existence of at least one charmed baryon with
mass -2495 MeV/c 2 and which decays strongly to the A~ is evident.
Six of the A~ events are consistent with there being such a
higher-mass baryon state, which is to be expected, since on the
basis of spin counting the ratios of primary production of
A6:Lc:L~ are 1:3:6 [Campbell, 1980]. Since the latter two decay
to the A6, only 1 A6 of every 10 observed should not be the decay
product of a higher-mass charmed baryon.
6.3 The o±
The p± and A6 candidates in the charged decay sample are
well identified, either by the presence of a baryon in the decay
+ products, or because the minimum mass of the parent excludes a D-
hypothesis. The remaining 11 charged charm candidates have
multiple decay hypotheses. These events are shown in Table 7 and
126
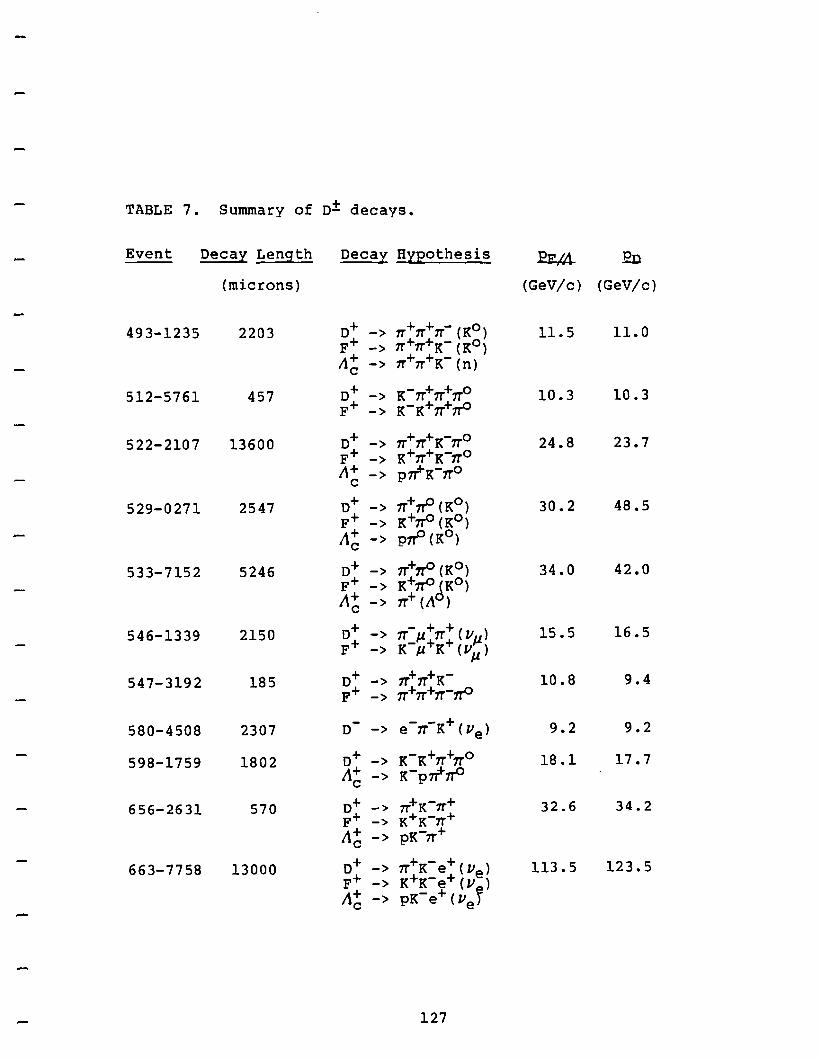
TABLE 7. Summary of D± decays.
Event Decay Length Decay Hypothesis EE'.,/A. .Eo
{microns) {GeV/c) {GeV/c)
493-1235 2203 D+ -> 1T+1T+1T- {Ko) 11.5 11.0 F+ -> 1T+1T'+K-{K0 ) 11+ -> 1T+1T+K- {n) c
512-5761 457 D+ -> K-1T+1T+1To 10.3 10.3 F+ -> K-K+tr+rrO
522-2107 13600 D+ -> 1T+1T+K-1To 24.8 23.7 F+ -> K+1T+K-1To .(\+
c -> p1T+K-1To
529-0271 2547 o+ -> rr+rr° {K0 ) 30.2 48.5 F+ -> K+tr° {Ko) /\+ -> prr° {Ko) c
533-7152 5246 D+ -> 1T+.,f) {Ko) 34.0 42.0 F+ -> K+tr° {Ko) .t\+ -> tr+{Ao) c
546-1339 2150 o+ - + + 15.5 16.5 -> 1T_µ+1T+ (Vµ) F+ -> K µ K (Vµ)
547-3192 185 D+ -> 1T+1T+K- 10.8 9.4 F+ -> 1T+1T+1T-tr°
580-4508 2307 D - e-tr-K+{Ve) 9.2 9.2 ->
598-1759 1802 o+ -> K-K+1T+1To 18.1 17.7 /\+ -> K-p7f"rr0 c
656-2631 570 o+ -> 1T+K-1T+ 32.6 34.2 F+ -> K+K-7T+ /\+ -> pK-1T+ c
663-7758 13000 o+ -> 1T+K-e+ { V ) 113.5 123.5 F+ -> K+K-e+ {Ve) 11+ -> pK-e+ { vef c
127

discussed individually in the Appendix. Since a large fraction
of this sample is expected to be o:!: decays, a 2-dimensional
maximum likelihood calculation was performed on this sample in
order to extract both the lifetime of + the D-, 1 0 , and the
fraction of the sample which is o:!:, f 0 .
The sample is considered to be of two parts: A significant
fraction should be o± with the corresponding lifetime 1 0 and a
contaminant part containing F± and A6 decays with the respective
lifetimes 2.0 and 2.3 x lo-13 s. This type of analysis can be
performed because the o± lifetime is different from the lifetimes
of the F± and A6.7
The 2-dimensional likelihood function is given by
~ (1,f)
+
m0 1. - 1
p'Oc;ff ( li) e 1 +
A~ (I)
_mxli
] x
(1-f)E(li)e Pi Ci"X
e x Ai('x)
-(t---x>2
0'2 x dt,
( 45)
7This was expected since the usual maximum likelihood method yields a lifetime of 12.0 x 10⁻¹³ s for this sample. The usual method does not, however, address whether the sample is consistent with one parent species.
128

where nlo = 1868 MeV/c 2 , is the mass of the o±; mx = 2160 MeV/c2,
is the average of the masses of the F± and ~6; li is the decay
length for event i; p? is the momentum of event i when
interpreted as a + D-; p~ is the momentum of event i when
interpreted as an F± or A6; 'x = 2.15 x lo-13 s, is the average
of the measured F± and A+c lifetimes; ax = 1.8 x la-l3 s, is the
error in the measured F± and '16 lifetimes; and the Ai are the
normalization constants given by
AQ =J:~ -t'/T
( zo') e D dt' and ( 46) 1
D
A}$: 1 = J~~x
-t'/1 ( zx') e x dt' • ( 4 7)
The integration in Equation 45 is performed in order to take into
account the fact that the F± and Ab lifetimes are measured
quantities and as such have errors associated with them. It is
assumed that the spread in the measured F± and A6 lifetimes is
Gaussian.
The possible decay hypotheses and averages of the momenta
for D and F/A interpretations for each of the 11 events are given
in Table 7. Using these data the likelihood function, o(; (1,f)
was calculated. A plot of the surface is shown in Figure 37. A
contour plot of the surface is shown in Figure 38. The maximum,
129

4-1 .. ...
~
\ ..
s::: 0
·.-l .µ u s::: :j
4-1
"O 0 0
I .c ·.-l r-1 Q) ~ ·.-l r-1
r-1 .... ca
j s::: 0
•.-l (I]
c Q)
E ·.-l "O I 0 3: .µ
Q)
.c 8
!""' M
Q) !-< ;::l 01
•.-l
""'
130

I-' w I-'
(/)
(Y) ~
I
Q)
(S) ~
x
Q)
E -+> Q) ---..
0
(S)
Lf) (\J
(S)
Lf) .....-
CSl Lf)
0.9 0.7
Fraction e.s 0.3
Figure 38. A contour plot of the likelihood function, ot(r,f).
-al max, of the 2-dimensional like! ihood function occurs at / D =
11.5 x io-13 s and fD = 1.0. The first contour ~ = e-o.5..,e ' max'
represents the traditional la error, provided that only one
variable is under consideration while the other remains fixed.a
By taking the tangents to this contour the errors are obtained:
'D = 11.5~~:8 and fD = 1 0+0.00 • -0.15·
The lifetime of the D± is found to be approximately 5 times
longer than that of the p±, the A~, and the Do [Ushida, 1982];
This may be due to the additional annihilation and exchange decay
mechanisms which are Cabibbo-favoured for the p±, A6, and the D0 ,
but which are suppressed for the D±. The longer lifetime of the
D± agrees with that measured by a solid-state detector experiment
which reports / + = 9.5 x io-13 s [Albini, 1982]. D-
Figure 39 is a plot of the invariant masses of the D+rro
combinations. A second smaller peak occurs which is due to the
small sample size and which can be made to disappear by
eliminating the entries for one event (547-3192).
found to be 2028±19 MeV/c 2 •
* The D mass is
8rf one considers the join5 ~robabilty for / and f to be within the contour given by cK:, = e- • .,(;, ax' then since this probability is the product of the 2 singfe variable probabilities, the contour does not represent the usual 68% confidence level associated with one standard deviation. Rather the area contained within this contour represents a 46.4% confidence level.
132

t-' w w
in 1\1 CSI csi
N lli)
csi
>-~
Ill ii
.,.. CSI
D csi .0 0 ... ct
.... & csi
1900.0
.. .. ; ~ ; .r: .... . ·.· .... . ... . ·.· : : :: .... . . .. .. •' •I •' ....... ,.. .... .... .. ... . .. .... . .. .. •, . .. ... i/Y • l ••• • I •, ' . : ... ........ .... ... ......... ........ ... · ... ... . .. ... · ... ... . .. ...
, .. .. .... .. .
2000.0
.
... . .. .... . ... .... . ... .... . .. . . .. .
2100.0
}
2200.0 2300.0 Mou (MeV /cu2J
······· ..
' I ~ o
.. :· .. ·;··· ..... ··· ..
.. ··
2'fee.0 2500.8 2se0.e 2100.e
Figure 39. Gaussian ideograms for the invariant masses of all o± ~o combinations. The peak of the solid curve, which is equal to a constant times the sum of the dotted curves, occurs at 2028 MeV/c2.
-CSI csi
"' CSI CSI csi

TABLE 8. Summary of Exotic Decay Modes
Event Decay Mode Fitted Mass
(MeV/c 2 )
Mesons
527-3682 K-1T-1T+1To 2145±57
638-9417 K+K-K+ 2375±34
656-2631 K+K-K+ 3200±201
Baryons
498-4985 K+1T-1T+!\o 2412±43 1l+1T-K+;\ o 2860±24
602-2032 pK-K+ 2257±12
650-6003 1T+K+1T-/\ o 2335±41
6.4 The Exotics
Exotic decay hypotheses were possible for some of the
charmed decays. 9 The masses ~or the fitted decay modes are shown
in Table 8. Clearly, there is insufficient data to determine a
mass for any exotic charm candidate. However, several of the
9These are deca+ modes which are not usually associated with the o±, F±, or /\c, but which might be consistent with 4-quark (meson) or 5-quark (baryon) bound states, for example csds or cudds.
134
hypotheses have masses which are low enough to be those of bound
states. Thus, although the data for the charged charm candidates
is explained in terms of the decays of the o±, p±, and A6, it
does not contradict the possibilty of there being a few charmed
exotic hadron decays.
6.5 The Other Multi-prong Events
Four of the multi-prong charm decay candidates were excluded
from the lifetime analysis. One of the events occurs in the
lucite base and it is therefore impossible to observe the vertex
to determine if the event is a nuclear interaction. The other
three events, none of which has a constrained fit, are eliminated
primarily because the parent momenta are all below 4 GeV/c.
Other factors such as low transverse momentum of the decay
particles, doubly-Cabibbo-suppressed hypotheses, and extremely
long calculated lifetimes, also made these events suspect.
135

TABLE 9. Summary of Charm Candidates
Parent Particle Number of Events
/\+ c 8
F± 4
o± 11
Other 4
Total 27
136
7. A SUMMARY
The lifetimes of the weakly decaying charmed hadrons have
been measured using a hybrid emulsion-spectrometer. The lifetime
of the o± is found to be 11.5 x lo-13 s, a factor of 5 greater
than that of the F±, which is 1.9 x lo-13 s, and that of the A6, which is 2.3 x lo-13s. The mass of the F± is measured to be
2057±39 MeV/c2.
Originally, it was believed that the decav of the weakly
decaying charmed particles could be explained in terms of the
spectator decay mechanism [Gaillard, 1975], that is, one in which
the charm quark decays independently of the other quarks in the
decaying parent. This model predicts equal lifetimes for all the
low-lying charmed particles. Recently, other models have been
proposed which could significantly affect the relative lifetimes.
Many of these attribute the shorter lifetime to the additional
contributions of annihilation and exchange diagrams, which are
Cabibbo-favoured for the o 0 , F+, and A~, but which are Cabibbo
suppressed for the o+. Other models attribute the relative
lifetime differences to hard gluon-enhanced amplitudes which
interfere destructively for the o+ [Leveille, 1981].
Although the results of this experiment do not favour either
of these two classes, it is interesting to note that one of the
137

decay candidates for the F± has an all-pion decay mode, which
does not contain a substantial ss component, and which would lend
support to the importance of the annihilation mechanism. Since
the two classes of models have quite different predictions for
the branching ratios of the F±, the resolution of which model
best describes charm decays, awaits the measurement of these
branching ratios.
The existence of spin and orbital excitations of the low-
lying states was examined by plotting the invariant mass
+ 0 + A+ f +* combinations of the D-rr , F-Y, and •1crr· The mass o the D ->
o+rr0 was found to be 2028±19 MeV/c 2 , where the mass of the o+ was
constrained to be 1868 MeV/c 2 •
In taking the invariant masses of the F±r combinations, the
mass of the F± was constrained to be 2030 MeV/c 2 • The mass of
the F+* -> F±r is 2151±14 MeV/c 2 , which gives the mass
difference, ~* - mF, 121±14 MeV/c 2 •
The invariant masses of all the A6 rr combinations were
examined. Both the A6rr+ and the A6rr- plots show two peaks which
appear to be an artifact of limited statistics. When these
effects are removed from the data, a distinctive peak at
approximately 2495 MeV/c2 is observed in the A6rr+ and A6rr-
channels. * This may be associated with the Le tri?let, which has
138

3+ J P -= 2. Such an interpretation would be consistent with previous
experimental evidence for the Ec [Baltay, 1979]. The masses of
the Ec and the E~ are predicted to be separated by about 60
MeV/c 2 and to be approximately 2500 MeV/c 2 • Six of the eight A~
events are consistent with the decay of a higher-mass, strongly-
decaying charmed baryon state, which is expected theoretically.
139
-
APPENDIX A CHARM EVENTS
A description of the analysis of each of the 23 charged,
charm decays is presented below.
140
476-4449
Event 476-4449
In this event 12 particles are produced at the primary
vertex. One of these decays to 3 charged particles after 27.7:
2. 8 µ • Of the 3 charged particles one is reconstructed by the
spectrometer as a proton with momentum 2.44 GeV/c. The two other
particles have up-only tracks. Thus p/J and ionization
measurements, which favour pion interpretations for both
particles, were made. The transverse momentum imbalance at the
decay vertex, before any neutral decay particles are assumed, is
235 MeV/c. An excess of approximately 8 GeV of hadronic energy is
observed in the calorimeter and at least three different rr 0 can
be reconstructed using the lead glass data.
TABLE 10. Decay tracks for event 476-4449.
~x/dz dy/dz Momentum !~ fGeV/c)
p 0.100±0.018 0.094±0.018
Dl 1. 513±0. 017 -0.092±0.017 1. 30±0. 04 0.180±0.049
02 -0.306±0.010 -0.806±0.010 1.05±0.03 0.260±0.068
03 0.159±0.004 0.224±0.004 2.44±0.02
None of the reconstructed rr 0 can be used to balance
transverse momentum in the kinematic fit of a charmed baryon
141

476-4449
TABLE 11. summary of unconstrained decay hypothesis for event 476-4449.
!!i:Eothesis Minimum Mass Momentum Decay time Excited ------ StaEes
(MeV/c 2 ) (GeV/c) (lo-13 s) (MeV/c 2 )
/\b -> 1T+1T-P (Ko) 2182±58 4.65 0.45±0.05
TABLE 12. summary of constrained decay hypothesis for event 476-4449.
!!i:eothesis Mass Decai 2-C 2-C Excited Time Momentum C.L. States
(MeV/c 2 ) (10-13 s) (GeV/c) (MeV/c 2 )
/\6 -> 7T+rr-pKO 2365±256 0.36±0.04 5.9±0.2 0.88 2444±28 2488±26 2590±45
decay. A a-constraint calculation for the hypothesis A°6 ->
1T+1T-p (K 0 ) was made to predict the position and momentum of the
K0 • The low solution is excluded because it gives non-physical
values to the various kinematic variables, such as Feynman x. If
one uses the angles of lead glass block 39, which contains 1.67
GeV of energy and into which no charged particles are incident,
as the angles of the K0 , it is possible to obtain a 2-constraint
fit to the decay A6 -> 1T+1T-pK0 , which has a confidence level of
0.88. A 3-constraint fit is not possible since the momentum of
. 142

476-4449
the K0 is unknown. The invariant masses of all the At~ systems
were calculated. Several candidates for the Ee were found and
are given in Table 12.
143

-
-
493-1235
Event 493-1235 o+/ambiguous
In this event a charged particle decays to three charged
particles after 2203±10 µ. One of the decay particles interacts
in the emulsion. Although the other two decay particles are
reconstructed as up-to-down tracks in the spectrometer, time-of-
flight information is not available for either particle. There
is a substantial amount of energy deposited in the hadron
calorimeter, 25.7 GeV, which supports the existence of at least
one neutral hadron. 21.0 G~V of electromagnetic energy is
deposited in the lead glass array, about half of which is due to
a reconstructed e+e- pair. Two independent 7f'o candidates are
reconstructed. The transverse momentum imbalance at the decay
vertex if a neutral decay particle is not assumed is 653 MeV/c.
TABLE 13. Decay tracks for event 493-1235.
~x/dz dy/dz Momentum {GeV/c)
I/Ia E/!_
p -0.193±0.011 -0.060±0.005
Dl 0.058±0.011 -0.149±0.005 1.01±0.05 0.555±0.095
02 -0.304±0.013 0.035±0.006 0.72±0.01 0.96±0.06
D3 -0.120±0.010 -0.017±0.004 -4.01±0.08 1.01±0.07
Several 0-constraint decay hypotheses are possible and are
144

-
-
493-1235
TABLE 14. Summary of decay hypotheses for event 493-1235.
!!ipothesis Minimum Mass Momentum Qecay time Excited States----
(MeV/c 2 ) (GeV/c) (lo-13 s) (MeV/c 2 )
o+ -> 1T+1T+1T- (Ko) 1983±171 11.0 12.5±0.5 2053±162
o+ -> rr+rr+K- (rr0 ) 1975±180 9.9 13.9±0.7 2040±134
F+ -> rr+rr+K- (K0 ) 2131±165 10.5 14.1±0.7 2189±108
F+ -> 1T+1T+1T- (n°) 1827±186 7.8 19.0±1.2 2160±67 16.3 9.1±0.3
F+ -> K+rr+K- (rr0 ) 2274±146 9.3 16.0±0.9 2176±88
!\+ c -> 1T+1T+1T- (n) 2306±147 13.1 12.7±0.5
"+ c -> 1T+1T+K- ( n) 2454±142 12.3 13.6±0.6
given in Table 14. It seems unlikely that the decay is that of a
A~· since the hypotheses involving a secondary proton are too
massive, although zero-constraint calculations exist for
hypotheses involving q missing neutron. The data supports both
o+ and F+ decay hypotheses. The angles and momentum predicted for
the missing K0 agree with the location and amount of excess
energy in the calorimeter. For the hypotheses involving a missing
rr0 , the angles predicted for the rr 0 , are not within the
boundaries of the lead glass array. Thus such hypotheses can not
be eliminated. None of the reconstructed rr0 can be used to
balance transverse momentum at the decay vertex.
145
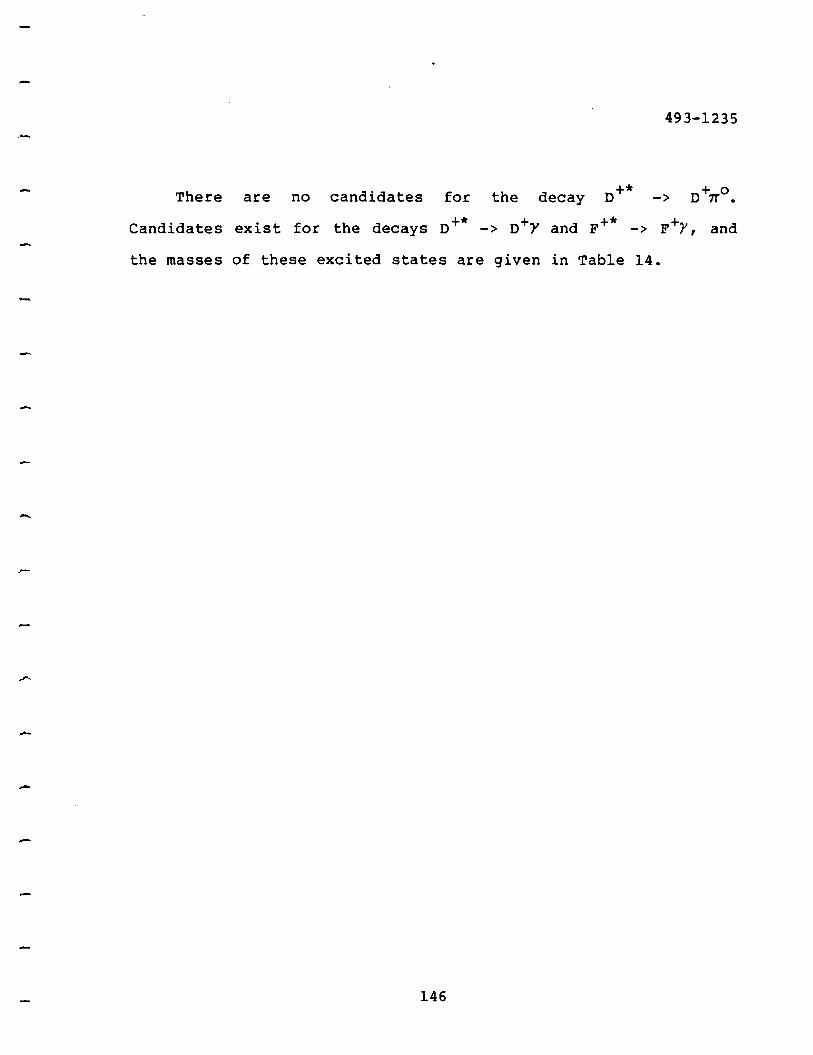
-
There are no candidates for the decay +* D
493-1235
-> D+ 0 7T •
Candidates exist for the decays o+* -> o+y and F+* -> F+Y, and
the masses of these excited states are given in Table 14.
146

498-4985
Event 498-4985
In this event a charged particle is observed to decay to
three charged particles after 180t5 µ • The three charged
particles are reconstructed in the spectrometer, two as up-to-
down tracks and one as an up-only track. By TOF measurements and
ionization measurements made in the emulsion, all three decay
particles are favoured to be charged pions. A vee is observed in
the upstream drift chambers. The positively charged decay
particle from this vee is reconstructed as an up-to-down track
and is identified by TOF as a proton, thus supporting the
existence of a rr0• The second decay particle is emitted at a
wide angle and therefore has an up-only track.
- TABLE 15. Decay tracks for event 498-4985.
S!x/dz dy/dz Momentum I/I 0 pf! - (GeV/c)
p -0.014±0.018 0.132±0.009 - Dl -0.105±0.011 0.158±0.005 3.15±0.03
D2 - 0.011±0.010 0.119±0.004 -1.66±0.01 1.02±0.04
03 -0.188±0.016 -0.357±0.007 0.59±0.10 0.86±0.04
147

--
-
-
498-4985
TABLE 16. Decay hypotheses for event 498-4985.
!!:fPOthesis 4-C Mass ~:cay 5-C 5-C Excited -- --- Momentum C.L. Ti.me States
(MeV/c 2 ) (10-13 s) (GeV/c) (MeV/c 2 )
11+ -> 11011"+11"-11"+ 2274±44 1. 65±0. 05 8.30±0.07 0.56 2496±09 c
L> p1T-2446±05 2911±39 2611±30
-> l\oK+1T-1T+ 2412±43
L> p11"-
-> 11°11"+11"-K+
L> p1T-
2860±24
It is not possible to reconstruct a 11"0 using the lead glass
data -- only one block contains energy which is not due to an
incident charged particle, nor does the energy deposited in the
calorimeter lend support to the existence of any additional
neutral hadrons. The transverse momentum imbalance at the decay
vertex is 395 MeV/c, if a neutral decay particle is not added.
Two-vertex constrained fits were performed for the decay
I\+-> 11"+11"-11"+11° with 11° -> prr-. The momentum of the latter 11"- ·(in c
addition to those of the 11 b and 11°) was left as an unmeasured
parameter to be fitted since it had an up-only track. These fits
are shown in Table 16. The existence of higher mass states was
148
498-4985
examined by calculating the invariant masses of the nbrr+ and n6rrsystems. Also examined were two exotic baryon states.
149

-
-
-
499-4713
Event 499-4713
A charged particle decays to a single charged particle after
366±6µ. The transverse momentum imbalance at the kink vertex is
627 MeV/c. The charged decay particle is reconstructed in the
I AO ' spectrometer and has momentum 2.55 GeV c. The decay of a 11 is
observed in the upstream chambers. AO The proton from the 11 is
reconstructed in an up-to-down track with momentum 1.67 GeV/c.
The 'Tr- has an up-only track of momentum 0.274 GeV/c. No excess
energy is observed in the lead glass array. The hadron
calorimeter contains 16.3 GeV, which supports the existence of a
neutral hadron.
TABLE.17. Decay tracks for event 499-4713.
~x/dz dy/dz Momentum \GeV/c)
I/Ia £{!_
p -0.165±0.016 0.086±0.009
D -0.331±0.005 -0.115±0.005 2.55±0.02
150

499-4713
TABLE 18. Summary of decay hypotheses for event 499-4713.
!!i12othesis Mass Deca:l 3-C 3-C Excited Time Momentum C.L. States
(MeV/c 2 } (10-13 S} (GeV/c 2} (MeV/c 2 }
A+ -> c Aorr+ 2157±17 6.53±0.12 4.25±0.03 0.125
L> prr-
A+ -> ..Eorr+ 2220±25 6.99±0.14 3.97±0.05 0.505 2494±16 c
L> A0 Y
L> prr
Multiple vertex constrained fits were performed for the
decay hypotheses:
and
The results are shown in Table 18. The decay mode containing a
E0 is favoured according to the confidence levels. The predicted
angles of the Y from the ..E 0 do not lie within the boundaries of
the lead glass array. The results of the a-constraint
calculations for the decay modes 1T+ (K 0} and K+ (K0
} exclude the
possibility of the decay being that of a meson. (The high
solutions are incompatible with spectrometer data and the low
151

499-4713
solutions are below the nominal momentum cutoff (4 GeV/c) for
charmed particles.) + The decay is clearly that of a Ac.
152

512-5761
Event 512-5761 o+/Ambiguous
This decay of a charged particle to three charged
secondaries occurs in the vertical emulsion after 457i:.5 µ. One
of the decay particles is identified at the 90% confidence level
as a rr+. The two other charged decay particles are excluded as
protons but are ambiguous to pion and kaon interpretations. The
event cannot be fitted using only the three charged decay
particles. The transverse momentum imbalance at the decay
vertex, if the existence of a neutral decay particle is not
assumed, is 483 MeV/c.
TABLE 19. Decay tracks for event 512-5761.
~x/dz dy/dz Momentum 1GeV/c)
I/Ia Pi!.
p 0.026±0.004 -0.028±0.004
Dl 0.053±0.003 0.085±0.003 -2.68±0.03
D2 0.071±0.003 -0.133±0.003 3.31±0.04
03 0.071±0.004 -O.J06±0.004 1.92±0.01
There are 11 lead glass blocks in which energy is deposited
and at least 10 different (although not independent) rr0 can be
reconstructed, further complicating the interpretation of the
event. Several of the decay hypotheses, selected on the basis of
153

512-5761
TABLE 20. Decay hypotheses for event 512-5761.
HyEothesis Mass Decay 3-C 3-C Excited Time Momentum C.L. States
(MeV/c2} (lo-13 S} (GeV/c} (MeV/c 2}
D+ -> K-1T+1T+1To 1 1835±38 2.95±0.05 9.65±0.14 0.009 2006±29
p+ -> K-K+1T+1To 2006±36 3.20±0.06 9.63±0.13 0.106 2172±28 1 2099±22
D+ -> K-1T+1T+1To 2 1844±37 2.85±0.05 9.97±0.15 0.097
p+ -> K-K+1T+1To 2 2020±35 3.10±0.06 9.94±0.14 0.111 2097±13
D+ -> K-1T+1T+1To 3 1841±36 2.76±0.06 10.30±0.16 0.164
p+ -> K-K- + o .,,. 1T 3 2023±34 3.00±0.06 10.26±0.15 0.212
D+ -> K-1T+1T+1T~ 1827±36 2.82±0.05 10.08±0.15 0.011
p+ -> K-K+1T+1To 4 2006±34 3.07±0.06 10.04±0.15 0.016
11'0 1 uses lead glass blocks 16 and 22
0 uses lead glass blocks 16 and 23 ,, 2
11'0 3 uses lead glass blocks 16 and 23, 32
11'0 4 uses lead glass blocks 16 and 22, 23
154
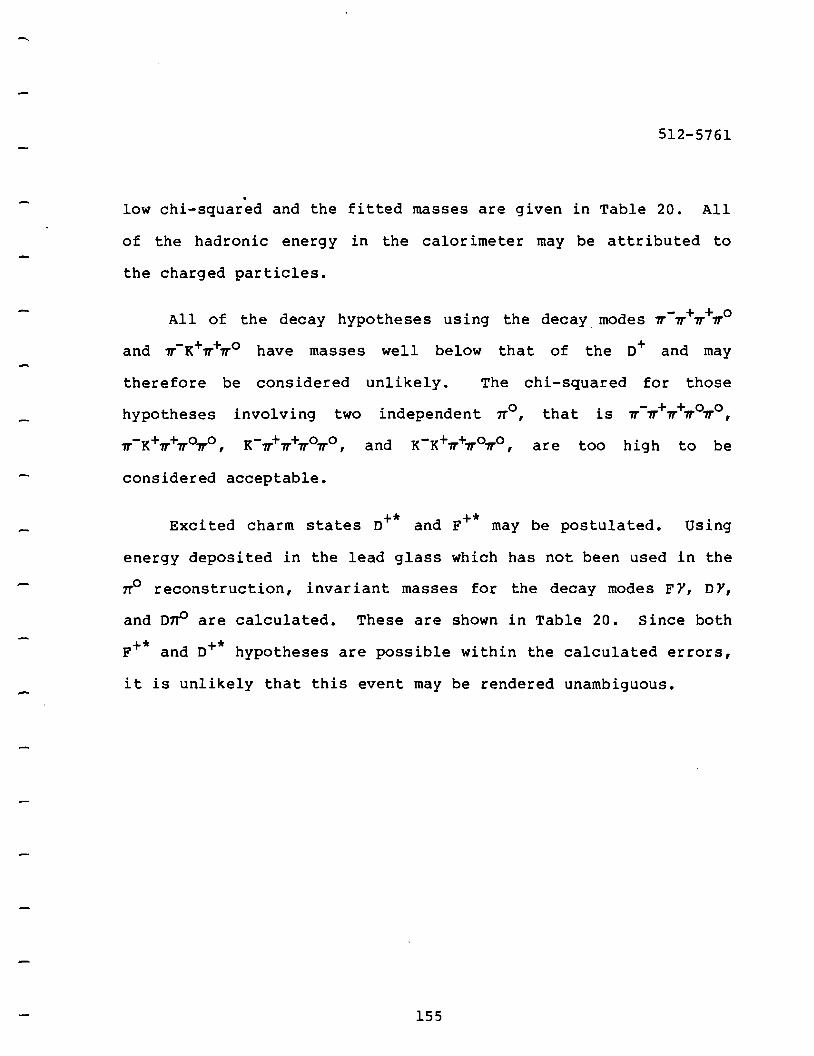
512-5761
. low chi-squared and the fitted masses are given in Table 20. All
of the hadronic energy in the calorimeter may be attributed to
the charged particles.
All of the decay hypotheses using the decay modes v-v+v+vo
and v-K+v+v0 have masses well below that of the o+ and may
therefore be considered unlikely. The chi-squared for those
hypotheses involving two independent rr0, that is v-v+v+v0 v 0
,
v-K+v+v0 7T0 , K-v+v+v0 v 0 , and K-K+v+v0 v 0 , are too high to be
considered acceptable.
Excited charm states o+* and F+* may be postulated. Using
energy deposited in the lead glass which has not been used in the
rr0 reconstruction, invariant masses for the decay modes FY, DY,
and on-0 are calculated. These are shown in Table 20. Since both
+* +* F and D hypotheses are possible within the calculated errors,
it is unlikely that this event may be rendered unambiguous.
155

522-2107
Event 522-2107 o+/Ambiguous
A positively charged particle decays to three charged
particles after 13600±100 µ • All three charged decay particles
are reconstructed in the spectrometer, but only one is of low
enough momentum, 1.02 GeV/c, to be identified + as a 7T • The
momenta of the two other particles are 15.8 and 4.4 GeV/c. The
transverse momentum imbalance at the decay vertex is 410 MeV/c,
if a neutral decay particle is not assumed. The calorimeter
contains 27. 3 GeV of hadronic energy. A total of 20 • 9 GeV of
energy is deposited in 13 lead glass blocks, from which it is
possible to reconstruct more than twenty separate but not
independent 7To candidates.
TABLE 21. Decay tracks for event 522-2107.
dx/dz dy/dz Momentum (GeV/c)
I/I 0 ~
p 0.003±0.006 0.122±0.003
Dl -0.002±0.010 0.136±0.005 15.77±0.90
D2 -0.012±0.009 0.072±0.004 1. 0 2±0. 01
03 -0.065±0.009 0.057±0.004 -4.43±0.07
156
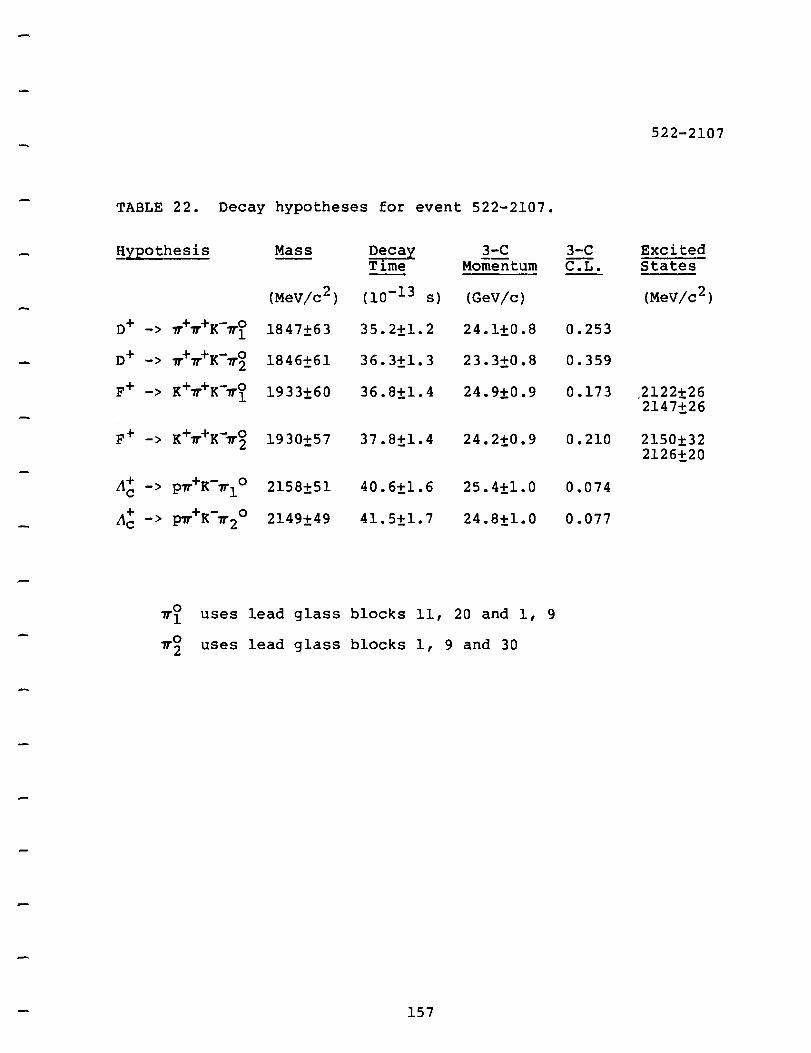
TABLE 22. Decay hypotheses for event 522-2107.
H;:iEOthesis Mass Deca::i 3-C Time Momentum
(MeV/c2 ) c10-13 S) (GeV/c)
o+ -> '7T+7T+K-7T~ 1847±63 35.2±1.2 24.1±0.8
o+ -> 'JT+ 7T+K-7T~ 1846±61 36.3±1.3 23.3±0.8
F+ -> K+7T+K-7To 1 1933±60 36.8±1.4 24.9±0.9
F+ -> K+7T+K-7To 2 1930±57 37.8±1.4 24.2±0.9
A+ c -> P'1T+K-'1T10 2158±51 40.6±1.6 25.4±1.0
A6 -> P'7T +K-'7T 2 o 2149±49 41. 5±1. 7 24.8±1.0
uses lead glass blocks 11, 20 and 1, 9
uses lead glass blocks 1, 9 and 30
157
522-2107
3-C Excited C.L. States
(MeV/c2 )
0.253
0.359
0.173 .2122±26 2147±26
0.210 2150±32 2126±20
0.074
0.077
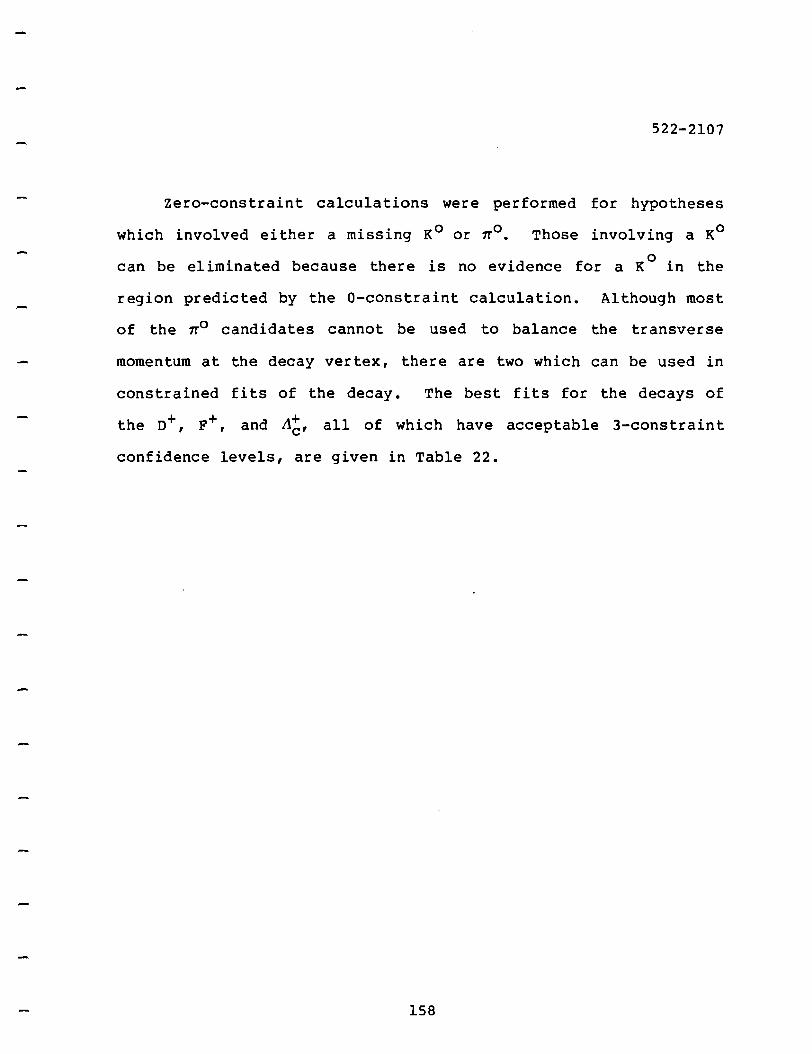
522-2107
zero-constraint calculations were performed for hypotheses
which involved either a missing K0 or ~0 • Those involving a K0
can be eliminated because there is no evidence for a K0
in the
region predicted by the a-constraint calculation. Although most
of the ~o candidates cannot be used to balance the transverse
momentum at the decay vertex, there are two which can be used in
constrained fits of the decay. The best fits for the decays of
the o+, p+, and A~, all of which have acceptable 3-constraint
confidence levels, are given in Table 22.
158

527-3682
Event 527-3682 F
A charged particle is observed to decay to three charged
particles after 670±4 µ in a vertical emulsion module. Two of
the decay particles, of momenta -1.51 and 1.11 GeV/c, are
identified as a rr and a rr+ respectively. Since the momentum of
the third particle is -5.42 GeV/c, it can be a rr- or K- but not a
p. Energy is deposited in eight lead glass blocks, three of
which have incident charged particles. There is 22 GeV of
hadronic energy deposited in the calorimeter. The chi-squared
for a fit to an exclusive charged particle decay is unacceptable
and the transverse momentum imbalance at the decay vertex is 400
MeV/c.
TABLE 23. Decay tracks for event 527-3682.
dx/dz dy/dz Momentum U!o (GeV/c}
p 0.012±0.008 -0.500±0.005
Dl -0.041±0.010 -0.114±0.005 -5.42±0.11
D2 0.345±0.015 -0.076±0.007 -1.51±0.01
03 -0.240±0.013 -0.058±0.006 1.11±0.0l
159
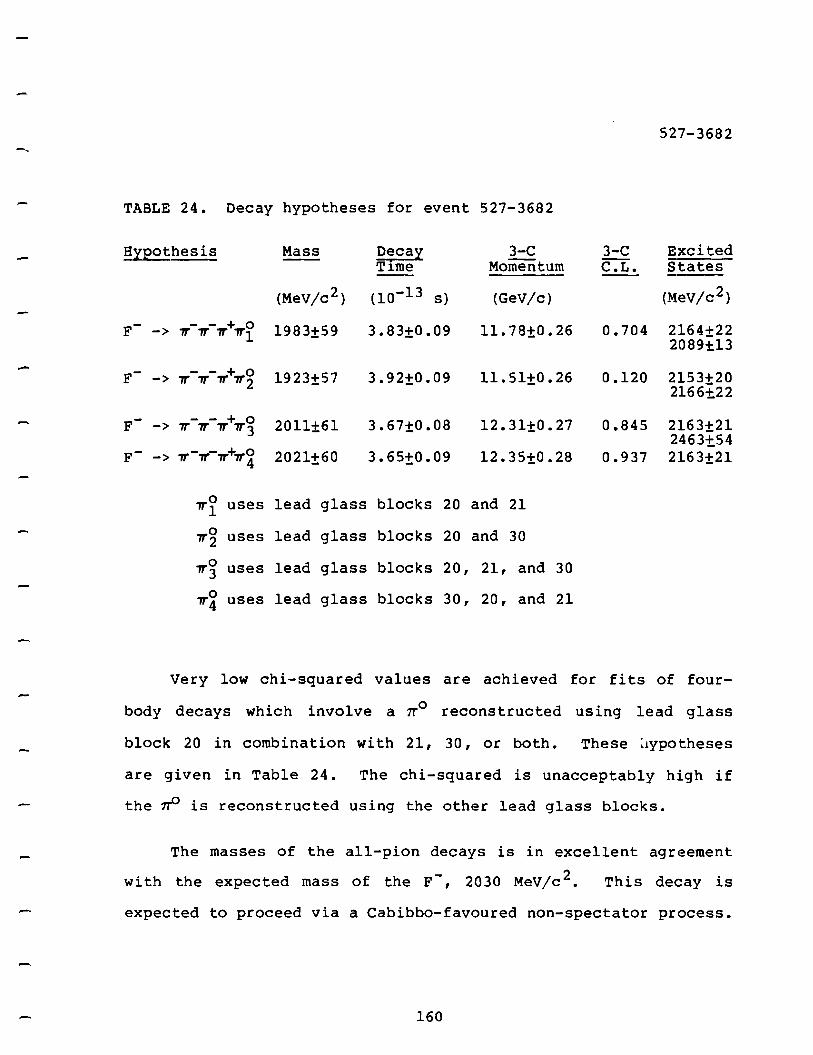
-. 527-3682
TABLE 24. Decay hypotheses for event 527-3682
!!~thesis Mass Dec a~ 3-C 3-C Excited Time Momentum C.L. States
(MeV/c 2 ) (10-13 s) (GeV/c) (MeV/c 2)
F - .,,-.,,-.,, + .,,o 1983±59 3.83±0.09 11.78±0.26 0.704 2164±22 -> 1 2089±13
F- -> .,,-.,,-.,,+.,,o 1923±57 3.92±0.09 11.51±0.26 0.120 2153±20 2 2166±22
F - .,,-.,,-.,,+.,,~ 2011±61 3.67±0.08 12.31±0.27 0.845 2163±21 -> 2463t54
F- -> .,,-.,,-.,,+.,,o 4 2021±60 3.65±0.09 12.35±0.28 0.937 2163±21
.,,o 1 uses lead glass blocks 20 and 21
.,,o 2 uses lead glass blocks 20 and 30
.,,o 3 uses lead glass blocks 20, 21, and 30
.,,o 4 uses lead glass blocks 30, 20, and 21
Very low chi-squared values are achieved for fits of four
body decays which involve a rr0 reconstructed using lead glass
block 20 in combination with 21, 30, or both. These :1ypotheses
are given in Table 24. The chi-squared is unacceptably high if
the 7P is reconstructed using the other lead glass blocks.
The masses of the all-pion decays is in excellent agreement
with the expected mass of the F-, 2030 MeV /c 2• This decay is
expected to proceed via a Cabibbo-favoured non-spectator process.
160
527-3682
Also calculated were the masses of the K-~-~+~o system, (not a
Cabibbo-favoured decay mode of the D-), which could be a Cabibbo
favoured decay mode of an exotic meson (for example csds). The
energy deposited in the remaining lead glass blocks is used to
calculate possible F+* states, which are shown in Table 24.
There is some evidence for a K~ in the calorimeter since the
hadronic energy is approximately 5 GeV greater than the sum of
the energies of the charged tracks. However this can not come
from the decay vertex alone, or in combination with any of the ~o
candidates, since it would not balance the transverse momentum at
the decay.
161

529-0271
Event 529-0271 o+/Ambiguous
In this event a charged particle decays to a single charged
particle after 2547±30 µ of vertical emulsion. The transverse
momentum imbalance at the kink vertex, before any neutral
secondaries have been assumed, is 494 MeV/c. Approximately 25
GeV of excess energy is observed in the hadron calorimeter. The
lead glass array contains 11 GeV of energy from which two non
independent ~o candidates can be reconstructed. One lead glass
block (48) contains 8.40 GeV, which is due either to an incident
photon or to an interacting hadron.
TABLE 25. Decay tracks for event 529-0271.
~x/dz dy/dz Momentum !/Io \GeV/c)
p -0.028±0.002 -0.058±0.002
Dl -0.087±0.002 -0.005±0.002 6.04±0.16
Several zero-constraint Cabibbo-favoured calculations for
o+, F+, and 116 parent hypotheses are acceptable. The high
momentum solution for then+ -> ~+(K0 ) hypothesis can be excluded
since the predicted energy of the K0 , 65 GeV, is clearly
inconsistent with that deposited in the calorimeter. The low
momentum solutions for all of the n+, F+, and A6 hypotheses
162

529-0271
TABLE 26. Summary' of unconstrained decay hypotheses for event 529-0271.
Hypothesis Minimum Mass Momentum Decay Time Excited E;tates
(MeV/c 2 ) (GeV/c) (lo-13 s) (MeV/c 2)
o+ -> 1T+(Ko) 1214±33 7.3 26.7±0.3
F+ -> K+(K0 ) 1399±28 7.1 24.2±0.3 46 3.7±0.1
"+ -> p (Ko) 1762±22 7.0 27.7±0.3 c 25 7.8±0.l
o+ -> 1T'+~ (Ko) 1357±32 8.6 18.4±0.2 48 3.3±0.l
o+ -> 1T'+m? (Ko) 1391±36 9.5 16.7±0.2 . 2 51 3.1±0.l
F+ -> K+nf (Ko) 1532±28 8.4 20.4±0.2 36.5 4.7±0.1
F+ -> K+~ (K0 ) 1578±30 9.4 18.2±0.2 37 4.6-tO.l
t\+ -> pnf (Ko) 1896±23 8.4 23.1±0.3 c 22.5 8.6±0.1
p~(Ko) 1963±26 9.1 21.2±0.3 22 8.8±0.1
dx 9_y contain a K0 emitted at a wide angle (dz > 0.25, dz > 0.25), and
with momentum about 1 GeV/c. Thus none of the low momentum
solutions can be excluded. Using the angles of the lead glass
block 48, which match almost exactly those predicted by the zero-
constraint calculation for the high-momentum solutions, it was
possible to perform constrained fits for the decays. The results
of these calculations are shown in Table 27.
163

529-0271
TABLE 27. Summary of constrained decay hypotheses for event 529-0271.
Hi12othesis Decay 2-C 2-C Excited Time Momentum C.L. States
(10-13 s) (GeV/c) (MeV/c 2)
o+ -> rr+7f>KO 3.27±0.24 48.5±3.5 0.92
F+ -> K+7ToKo 4.74±0.20 36.2±1.5 0.93
A+ c -> pn°Ko 8.46±0.25 22.9±0.6 0.54
"+ c -> pKo 7.63±0.21 25.4±0.6 0.70
164

533-7152
Event 533-7152 n+/Ambiguous
This decay of a charged particle to a single charged
particle occurs after 5246±50 µ • The transverse momentum
imbalance at the decay vertex is 564 MeV/c. An excess of 23.5
GeV of hadronic energy is observed in the calorimeter and 10
adjacent lead glass blocks in the forward direction contain a
total of aproximately 10 GeV of electromagnetic energy. The
reconstruction of rr0 candidates was hampered by the fact that all
of the lead glass blocks were adjacent.
TABLE 28. Decay tracks for event 533-7152.
~x/dz dy/dz Momentum \GeV/c)
I/Io
p 0.019±0.002 0.010±0.002
Dl -0.023±0.002 -0.084±0.002 5.49±0.1
Many a-constraint, CabiL~o-favoured, hypotheses were
examined and found to be acceptable. None of the low momentum
solutions was excluded by experimental evidence. Some of the
high momentum solutions could be eliminated, since the calculated
energy of the missing neutral clearly exceeded that deposited in
the lead glass of the calorimeter. The energy deposited in the
lead glass could not balance the transverse momentum at the decay
vertex.
165
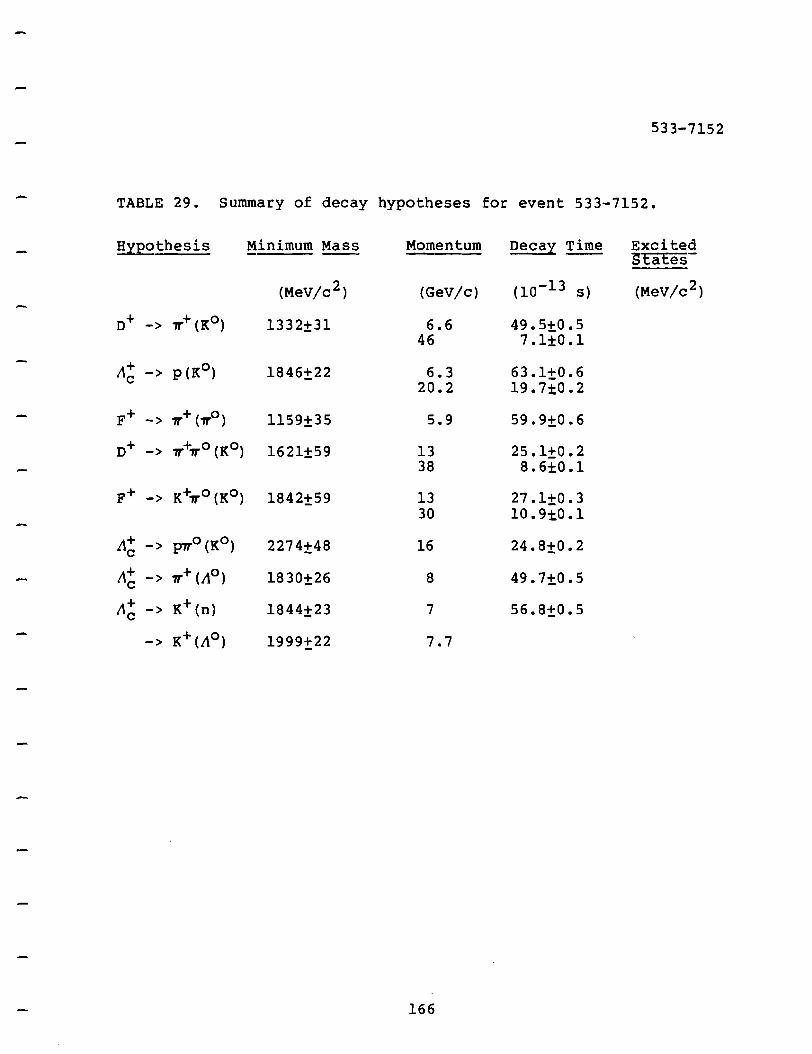
533-7152
TABLE 29. Summary of decay hypotheses for event 533-7152.
~thesis Minimum Mass Momentum Decay Time Excited 'States ---
(MeV/c 2) (GeV/c) ( 10-13 s) (MeV/c 2)
o+ -> ,,.+(Ko) 1332±31 6.6 49.5±0.5 46 7.1±0.1
I\+ -> p (Ko) 1846±22 6.3 63.1±0.6 c 20.2 19.7±0.2
F+ -> ,,. + ( ,,.o ) 1159±35 5.9 59.9±0.6
o+ -> ,,.+,,.o (Ko) 1621±59 13 25.1±0.2 38 8.6±0.1
F+ -> K+,,.o (Ko) 1842±59 13 27.1±0.3 30 10.9±0.1
L\+ c -> pvo(Ko) 2274±48 16 24.8±0.2
I\+ c -> ,,.+(Ao) 1830±26 8 49.7±0.5
I\+ c -> K+ (n) 1844±23 7 56.8±0.5
-> K+(L\o) 1999±22 7.7
166

546-1339
Event 546-1339 o+;ambiguous
A charged particle decays in a horizontal emulsion module to
three charge particles after 2150±50 µ • One of the decay
particles is identified as a µ+ since it passes through both
planes of the muon scintillation counters. The two other charged
particles (-3.92 and +3.22 GeV/c) may be either pions or kaons.
There is one lead glass block, 40, which contains 2.44~0.23 GeV
of energy, and 11.5 GeV of energy is deposited in the
calorimeter. The transverse momentum imbalance at the decay
vertex, without the addition of a neutral decay particle, is 530
MeV/c.
TABLE 30. Decay tracks for event 546-1339.
dx/dz dy/dz Momentum !L!a (Gev/c)
p -0.029±0.008 -0.052±0.005
Dl -0.043±0.011 -0.160±0.005 -3.92±0.08 0.10±0.04
02 0.004±0.008 -0.042±0.004 4.67±0.11 1. 08±0. 04
03 0.079±0.009 -0.032±0.004 3.22±0.05 1.03±0.04
The emulsion and computer calculated angles for the
reconstructed tracks differ significantly in dx/dz. The
difference is systematic and may be attributed to a rotation of
167

546-1339
TABLE 31. Summary of decay hypotheses for event 546-1339.
Hypothesis Minimum Mass Momentum Decay Time Excited SEaEes
(MeV/c 2 } (GeV/c} (lo-13 s} (MeV/c 2 }
o+ -> rr-µ+rr+ (v } 1622±93 29.9 4.5±0.1 µ 13.5 9.9±0.2
F+ -> 1T'-µ+rr+ (vµ} 1622±93 36.6 4.0±0.l 2100±46 13.0 11.1±0.3
F+ -> 1r-µ+K+(v } 1949±87 20.2 7.2±0.2 µ 14.1 10.3±0.2
o+ -> K-µ+7f+ ( v } µ 1897±85 16.5 8.1±0.2 2003±16
F+ -> K-µ+K+ (V } µ 2171±83 15.5 9.3±0.2
16 mr in dx/dz and O mr in dy /dz. Therefore, in fitting the
event, such a rotation was assumed and the computer-calculated
dx/dz measurements were used as the input to the fitting
programs. Because of the existence of the unobserved vµ,
constrained fits were not possible. The results of the 0-
constraint calculations are shown in Table 31. All of t~~ energy
in the calorimeter may be attributed to incident charged hadrons.
If one assumes the presence of a Y in lead glass block 41,
the invariant masses of the F+ and o+ can be calculated and are
also shown in Table 31. These masses are consistent respectively
with that of the F+* and the o+*. The branching ratio of F+* ->
168

L
546-1339
FY is not known although several theoretical predictions place it
at 100%. For the o+* -> DY, the branching ratio is 7t8%.
169
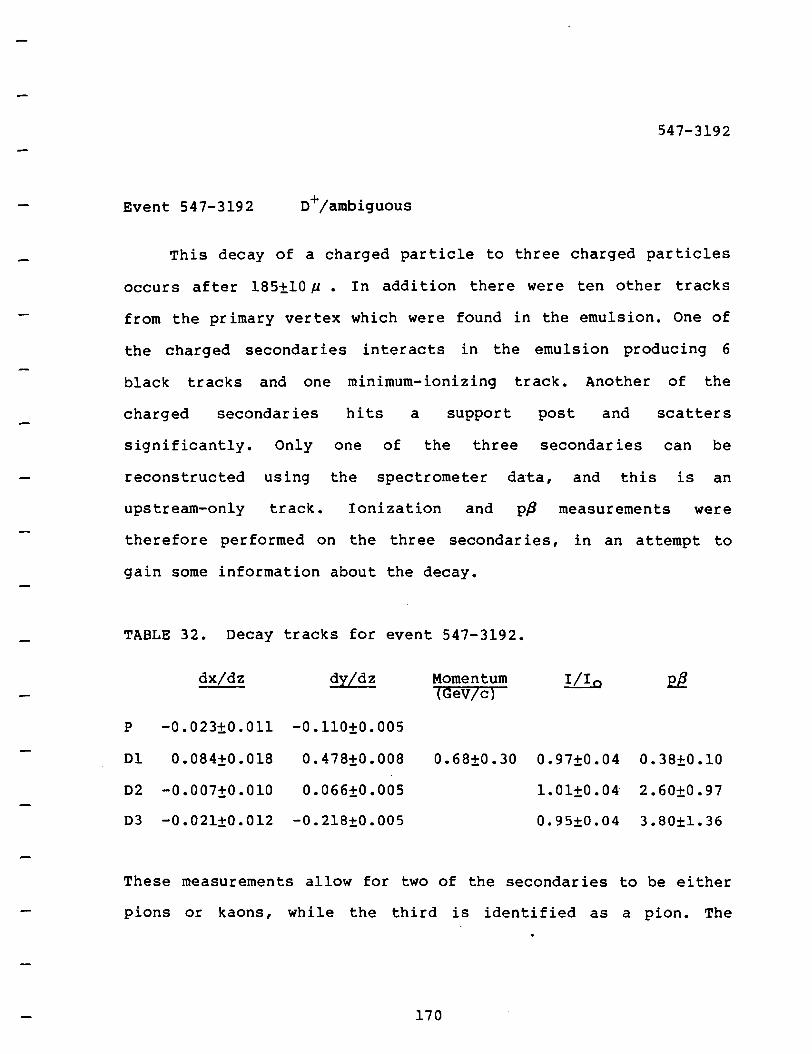
547-3192
Event 547-3192 o+/ambiguous
This decay of a charged particle to three charged particles
occurs after 185±10 µ • In addition there were ten other tracks
from the primary vertex which were found in the emulsion. One of
the charged secondaries interacts in the emulsion producing 6
black tracks and one minimum-ionizing track. Another of the
charged secondaries hits a support post and scatters
significantly. Only one of the three secondaries can be
reconstructed using the spectrometer da·ta, and this is an
upstream-only track. Ionization and p/3 measurements were
therefore performed on the three secondaries, in an attempt to
gain some information about the decay.
TABLE 32. Decay tracks for event 547-3192.
dx/dz dy/dz Momentum I/I 0 (GeV/c)
p -0.023±0.011 -0.110±0.005
Dl 0.084±0.018 0.478±0.008 0.68±0.30 0.97±0.04 0.38±0.10
D2 -0.007±0.010 0.066±0.005 1.01±0.04 2.60±0.97
03 -0.021±0.012 -0.218±0.005 0.95±0.04 3. 80±1. 36
These measurements allow for two of the secondaries to be either
pions or kaons, while the third is identified as a pion. The
170
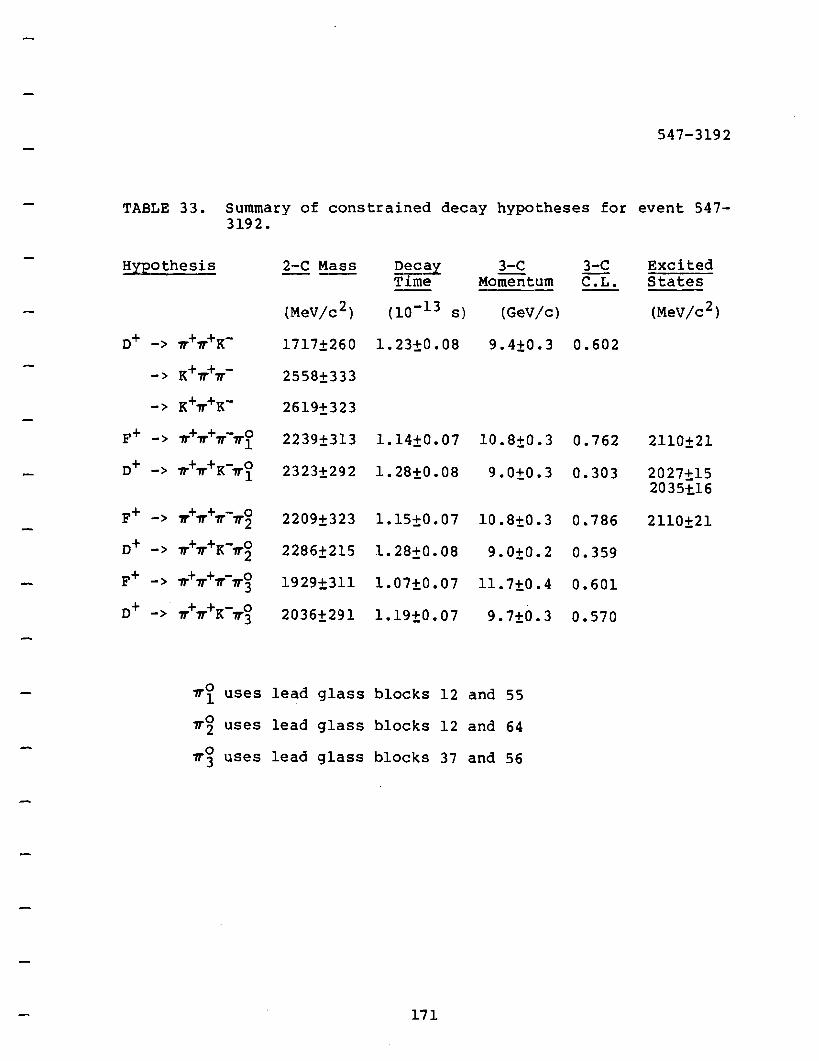
547-3192
TABLE 33. Summary of constrained decay hypotheses for event 547-3192.
!!lPOthesis 2-C Mass Decai 3-C 3-C Excited --- Time Momentum C.L. States
(MeV/c 2) (10-13 s) (GeV/c) (MeV/c 2)
o+ -> 1T+1T+K- 1717±260 1.23±0.08 9.4±0.3 0.602
-> K+1T+1T- 2558±333
-> K+7T+K- 2619±323
p+ -> 1T+ 1T+ 1T-1To 1 2239±313 1.14±0.07 10.8±0.3 0.762 2110±21
o+ -> 1T+1T+K-1To 1 2323±292 1.28±0.08 9.0±0.3 0.303 2027±15
2035±.16
p+ -> .,,.+1T+1T-1T~ 2209±323 1.15±0.07 10.8±0.3 0.786 2110±21
o+ -> 1T+1T+K-1To 2 2286±215 1.28±0.08 9.0±0.2 0.359
p+ -> 1T+1T+1T-1To 3 1929±311 1.07±0.07 ll.7t0.4 0.601
o+ -> 1T+ 1T +K-1T~ 2036±291 1.19±0.07 9.7±0.3 0.570
1To 1 uses lead glass blocks 12 and 55
1To 2 uses lead glass blocks 12 and 64
1To 3 uses lead glass blocks 37 and 56
171
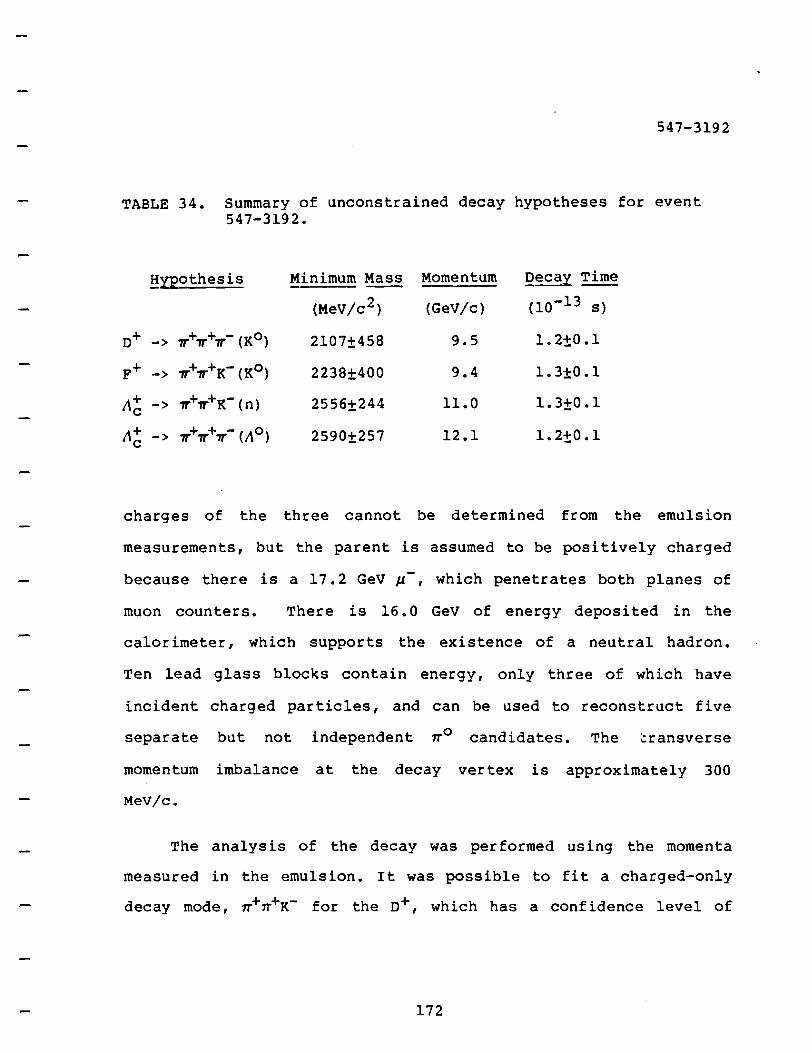
547-3192
TABLE 34. Summary of unconstrained decay hypotheses for event 547-3192.
!!YEothesis Minimum Mass Momentum Q_ecay Time
(MeV/c 2) (GeV/c) (10-l 3 S)
o+ -> ,,.+,,.+,,.- (Ko) 2107±458 9.5 1. 2±0 .1
F+ -> ,,.+,,.+K- (K0 ) 2238±400 9.4 1. 3±0 .1
i\+ c -> ,,.+,,.+K- (n) 2556±244 11.0 1. 3±0 .1
i\+ c -> ,,.+,,.+,,.- (;\o) 2590±257 12.1 1. 2±0 .1
charges of the three cannot be determined from the emulsion
measurements, but the parent is assumed to be positively charged
because there is a 17.2 GeV µ-, which penetrates both planes of
muon counters. There is 16.0 GeV of energy deposited in the
calorimeter, which supports the existence of a neutral hadron.
Ten lead glass blocks contain energy, only three of which have
incident charged particles, and can be used to reconstruct five
separate but not independent rr0 candidates. The cransverse
momentum imbalance at the decay vertex is approximately 300
MeV/c.
The analysis of the decay was performed using the momenta
measured in the emulsion. It was possible to fit a charged-only
decay mode, rr+rr+K- for the o+, which has a confidence level of
172

0.602. There are also several
547:..3192
+ acceptable hypotheses of D ->
Zero-constraint hypotheses involving missing neutrals are also
possible and are shown in Table 34. These are o+ -> v+v+v-(K0 ),
F+ -> v+v+K-(K0 ), A6 -> v+v+v-(v0 ), and A6 -> v+v+K-(n). Several
downstream track segments and excess hadronic energy support the
existence of such neutrals, whose angles and momenta were
calculated.
Using the energy deposited in·the lead glass, candidates for
both the o+* and F+* were found assuming the decay modes o+* ->
o+"o and F+* -> F+Y. The masses of the o+* and F+* candidates do
not change significantly when the momentum of the D+ and F+ are
varied slightly, as happens when different ~o are used in the o+
or F+ decay hypothesis.
Since the charges of none of the decay particles can be
determined, the interpretation of this event is uncertain.
173

Event 549-4068 I\+ or Non-charm c
549-4068
A charged particle is observed to decay to three charged
particles after 20.6±2.0 µ One of the three particles is
reconstructed as a positively charged, 1 GeV/c, up-only track by
the spectrometer. It is identified using p/J and ionization
measurements as a proton. A second decay particle, which was
emitted backward in the laboratory frame, is identified as a 47
MeV/c rr+, by observation in the emulsion of the decay chain
The p/J and ionization measurements for the third decay particle,
which was not reconstructed from spectrometer data, cannot
resolve the ambiguity between kaon and proton interpretations
although the latter is favoured. Two lead glass blocks contain
energy due to incident charged particles from the primary vertex.
The calorimeter contains 15 GeV of hadronic energy, which
supports the existence of a neutral hadron. Transverse momentum
imbalance at the decay vertex is 287 MeV/c.
The interpretation of this event as the decay of a charmed
particle (as opposed to a nuclear interaction) can be made only
if the third decay particle is assumed to be a K-. Using this
174
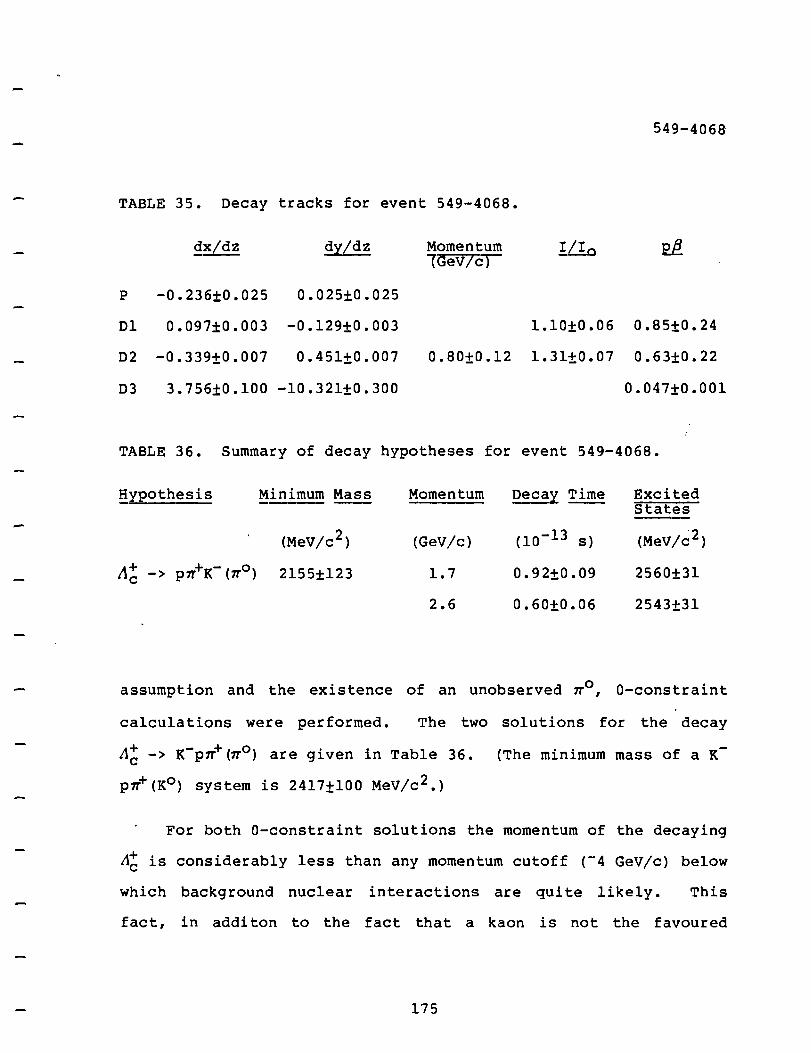
549-4a68·
TABLE 35. Decay tracks for event 549-4a68.
dx/dz dy/dz Momentum I/I 0 1GeV/c)
p -a.236±a.a25 a.a25±a.a25
Dl a.a97±a.aa3 -a.129ta.aa3 l.lata.a6 a.85±a.24
D2 -a.339±a.aa7 a.45l±a.aa7 a.8a±a.12 l.3l±a.a7 a.63±a.22
D3 3.756±a.1aa -la.32l±a.3aa a.a47±a.aa1
TABLE 36. Summary of decay hypotheses for event 549-4a68.
Hypothesis Minimum Mass Momentum Decay Time Excited States
(MeV/c2) (GeV/c) (la-l3 S) (MeV/c 2)
11+ -> c p1T+K- (1To) 2155±123 1. 7 a.92±a.a9 256a±31
2.6 a.6ata.a6 2543±31
assumption and the existence of an unobserved 1To, a-constraint
calculations were performed. The two solutions for the decay
Ab-> K-prr+(rr0 ) are given in Table 36. (The minimum mass of a K
p1T+(K0) system is 2417±laa MeV/c2.)
For both a-constraint solutions the momentum of the decaying
A6 is considerably less than any momentum cutoff (-4 GeV/c) below
which background nuclear interactions are quite likely. This
fact, in addi ton to the fact that a kaon is not the favoured
175
549-4068
identification for the third decay particle, render the
interpretation of the event as a charmed particle decay somewhat
doubtful.
176
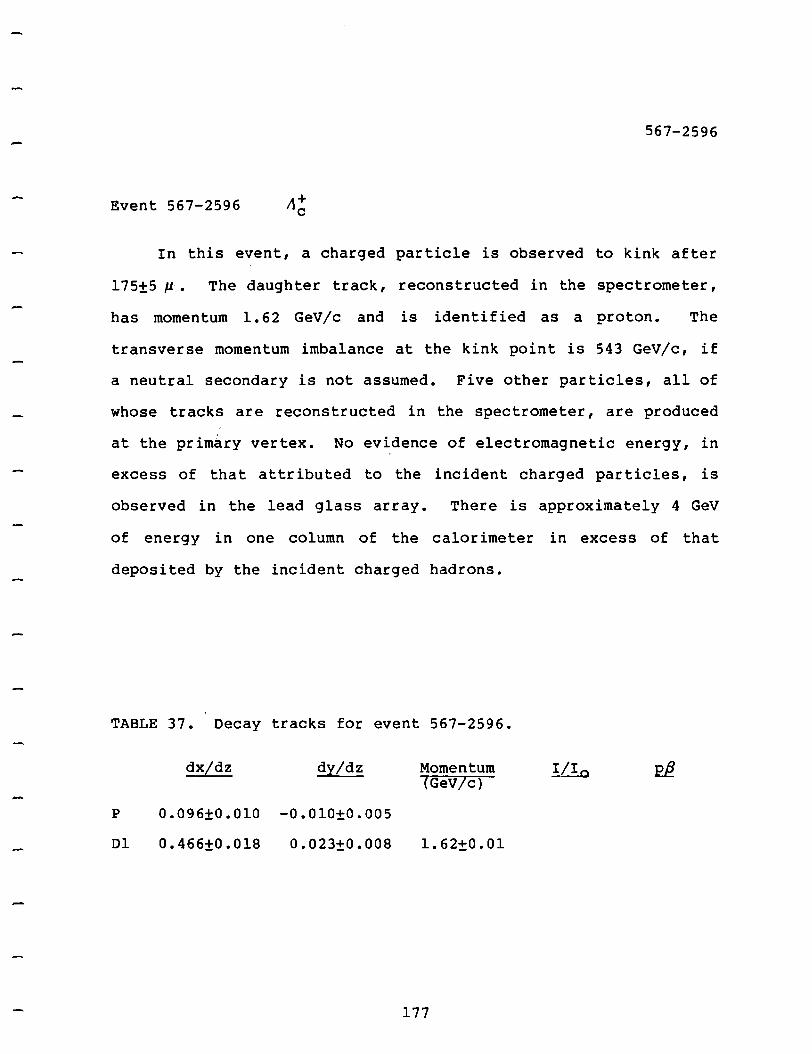
567-2596
Event 567-2596
In this event, a charged particle is observed to kink after
175±5 µ. The daughter track, reconstructed in the spectrometer,
has momentum 1.62 GeV/c and is identified as a proton. The
transverse momentum imbalance at the kink point is 543 GeV/c, if
a neutral secondary is not assumed. Five other particles, all of
whose tracks are reconstructed in the spectrometer, are produced
at the prim~ry vertex. No evidence of electromagnetic energy, in
excess of that attributed to the incident charged particles, is
observed in the lead glass array. There is approximately 4 GeV
of energy in one column of the calorimeter in excess of that
deposited by the incident charged hadrons.
TABLE 37. Decay tracks for event 567-2596.
dx/dz dy/dz Momentum !/Ia \GeV/c)
p 0.096±0.010 -0.010±0.005
Dl 0.466±0.018 0.023±0.008 1. 62±0. 01
177

-
567-2596
TABLE 38. Summary of decay hypotheses for event 567~2596.
!!::iPothesis Minimum Mass Momentum Decay Time Excited 'States
(MeV/c 2 ) (GeV/c) (lo-13 s) (MeV/c 2 )
1821±22 1.33 10.0±0.3 6.20 2.1±0.1 2473±13
2499±15 2550±13 2558±22
A 0-constraint calculation for the decay hypothesis ;1~ ->
p(K0 ) was performed to predict the position and energy of the K0•
These were in good agreement with the observations of the
calorimeter. The existence of strongly-decaying resonant states
was examined by calculating the invariant masses of the A~ with
the pions produced at the primary vertex. These invariant ma~ses
are summarized in Table 38.
178
580-4508
Event 580-4508 o-
In this event a negatively charged particle decays to three
charged secondaries after . +
2307±50 µ • A 6.4 GeV/c µ from the
primary vertex is identified by both planes of muon counters.
There is 14.6 GeV of energy deposited in the hadron calorimeter.
Of the three charged decay particles two have been reconstructed
as up-to-down tracks with momenta 1. 52 and -4. 28 GeV /c and the
third is an up-only track of momentum -0.85 GeV/c and is
therefore not identified. The 1.52 GeV/c track is identified as a
K+ by TOF. The -4.28 GeV/c track enters a lead glass block, in
which is deposited 5.70 GeV of energy, and it is therefore
identified as an electron. No other particles either from the
primary or secondary vertex enter this block. Since the electron
is expected to radiate photons by the bremsstrahlung process as
it traverses the emulsion, the energy of the lead glass system
should be a more reliable measurement of the energy of the
electron. Including the energy of an adjacent block, into which
no charged particles are incident, the energy of the electron
is 5.79±0.36 GeV. Evidence for the existence of a neutral hadron
is observed in one column of the calorimeter, which measured 8.6
GeV of hadronic energy, and into which a K+ of energy 1. 52 GeV
was incident.
-Because of the missing ve, the analysis of this event was
179

580-4508
TABLE 39. Decay tracks for event 580-4508.
~x/dz dy/dz Momentum !L!a Efj_ \GeV/c)
p -0.003±0.003 -0.049±0.003
Dl 0.062±0.002 -0.038±0.002 -4.28±0.28
D2 0.075±0.004 -0.213±0.004 -0.85±0.28
D3 -0.267±0.004 -0.027±0.004 1.52±0.01
TABLE 40. Summary of decay hypotheses for event 580-4508.
Hypothesis Minimum Mass
(MeV/c 2 )
1716±173
2252±152
Momentum
(GeV/c)
8.12 10.36
Decay Time
( lo-13 s)
17.7±0.4 13.9±0.3
limited to zero-constraint calculations, which favour the
interpretation D- -> e-1T-K+ (iie>. The minimum mass of the decay
mode e-K-K+(iie) is 1.5 st~ndard deviations above the mass of the
F-, 2030 MeV/c 2 • If one includes a K0 or i 0 as one of the decay
products, using a dx/dz consistent with the the measurements of
the calorimeter and a dy/dz which would minimize the parent mass,
then for minimal values for the momentum, 1 GeV/c, the parent
mass precludes an F- interpretation~ The minimum parent mass is
180

580-4508
2590 MeV/c 2 for the e-~-K+(ve}K0 system. In any case it would be
unlikely for the neutral hadron to have momentum of only 1 GeV/c
when 7. 6 GeV of energy is unaccounted for. One would have to
conclude that the neutral hadron originated at the primary
vertex. Although there is one isolated lead glass block which
contains 350 MeV of energy, there is not a o-* candidate.
181

597-1851
Event 597-1851 F+
In this event, a charged particle decays to three charged
particles after 130±11 µ • The momentum of all three decay
particles is less than 3 GeV/c, enabling hadron particle
identification by TOF. The transverse momentum imbalance at the
decay vertex is 629 MeV/c if a neutral decay particle is not
assumed. Two lead glass blocks (38 and 51) contain small amounts
of energy (0.14 and 0.09 GeV) which cannot be attributed to
incident charged particles. However, the invariant mass
calculated using the energy of these blocks, is far below that of
a 7r0• The amount of energy in the hadron calorimeter is 10. 3
GeV. There is no muon identified in this event as none of the
charged particles penetrate the muon steel. The existence of a
muon cannot be excluded though, since there are several wide-
angle tracks which do not pass through the magnet gap.
TABLE 41. Decay tracks for event 597-1851.
~x/dz dy/dz Momentum 1Gev/c}
!/Ia El!.
p -0.105±0.018 -0.002±0.013
01 -0.091±0.003 -0.078±0.003 2.19±0.01
02 -0.070±0.002 0.027±0.002 -1.60±0.01
03 0.089±0.003 0.114±0.003 2.69±0.03
182

597-1851
TABLE 42. Summary of decay hypotheses for event 597-1851.
!!l2othesis Mass Deca::i 3-C 3-C Excited Time Momentum C.L. States
(MeV/c2 ) (10-13 S) (GeV/c) (MeV/c 2 )
F+ -> K+v-v+Ko 2082±71 1. 00±0. 09 8.79±0.23 0.47
Two decay hypotheses were examined using zero-constraint
calculations: K+v-v+v0 and K+v-v+K0 • The hypothesis, K+v-v+vo is
a Cabibbo-suppressed decay mode of the F+ and is not a decay mode
of the o+. One of the kinematic solutions of F+ -> K+v-v+vo can
be excluded because there is no evidence for the n° in the lead
glass array in the direction calculated by the zero-constraint
program. For the second solution, the direction of the rr 0 , as
calculated by the program falls just barely beyond the boundaries
of the lead glass array.
+ - + 0 The minimum mass for the decay hypothesis K vvv is 1991±
161 MeV/c 2 1 for the hypothesis K+v-v+Ko the minimum mass is 2150±
140 MeV/c2 , which excludes the Cabibbo-suppressed n+ hypothesis.
There is only one kinematic solution for the F+ -> K+v-v+Ko
hypothesis, at the minimum of the -!-constraint curve. At this
point, the calculated energy of the missing K0 is in good
agreement with the information of the calorimeter. The predicted
angles agree with those of lead glass block 51. Since the
183
597-1851
interaction length of the lead glass is 40 cm, it is quite
plausible for a hadron to interact in the lead glass, leaving
traces of its energy. Using the angles of the lead glass, a
constrained fit for the F+ decay was obtained and is shown in
Table 42. No p+* candidates were found.
In summary, the decay cannot be that of a A6 or a D+, and is
explained by the hypothesis F+ -> K+rr-rr+Ko.
184
-
598-1759
Event 598-1759 D/ambiguous
In this event a charged particles decays to three charged
particles after 1802±15 µ • One of the charged particles is
identified by TOF as a 1T'+. The other two, however, are too
energetic (6.4 and 8.1 GeV/c) to be identified. The transverse
momentum imbalance at the decay vertex is 174 MeV/c. There are
nine lead glass blocks in which energy is deposited. Al though
the upstream drift chambers contain no hits in addition to those
used for the fitted tracks, there appear to be downstream-only
track segments. That these segments are due to charged particles
is supported by information of the TOF II counters. It appears
that a neutral particle (K0) may have decayed within the magnet
gap. The energy deposited in the calorimeter is 21 GeV of which
18 GeV may be attributed to the three charged decay particles and
the muon from the primary vertex. (No other charged particles are
observed in this event.)
The addition of a neutral secondary at the decay vertex is
not warranted by the transverse momentum imbalance. However, none
of the three-body decay modes has a parent mass within 4 standard
deviations of the appropriate charmed particle. Therefore several
hypotheses were examined: those which involved a missing rr0 and
those involving a K0 • All of the rr0 which could be reconstructed
using the lead glass data were cycled through using two-vertex
185
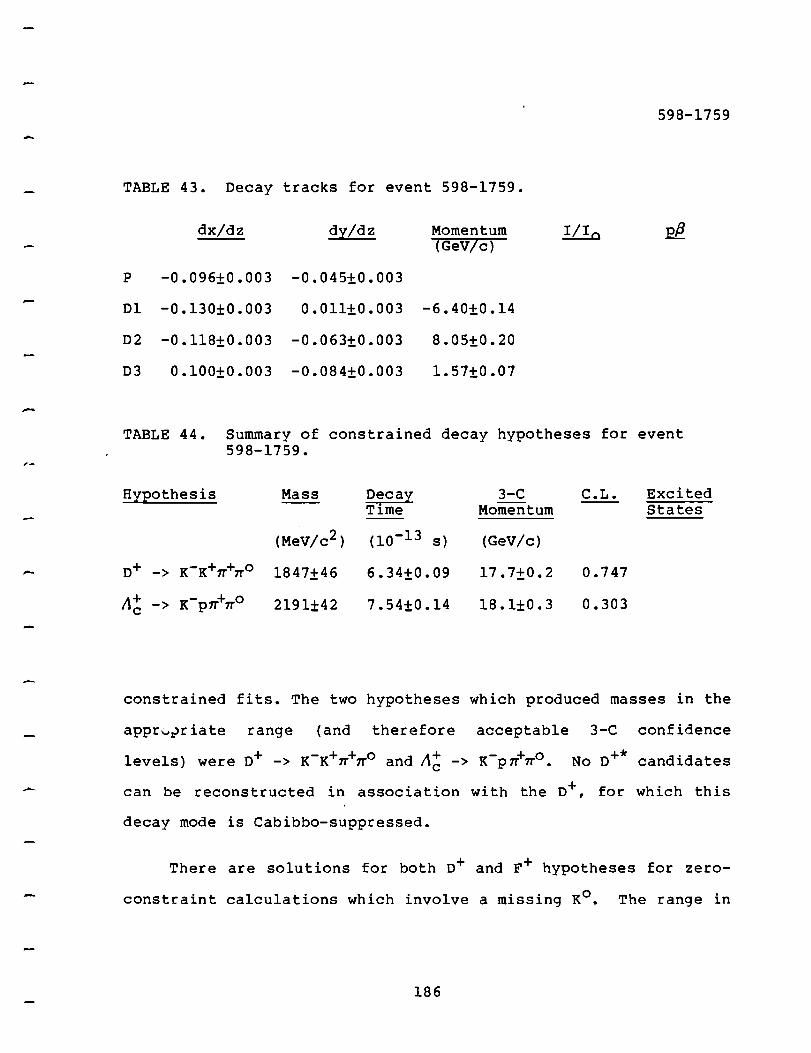
-,_
-
598-1759
TABLE 43. Decay tracks for event 598-1759.
dx/dz dy/dz Momentum I/I 0 El!. (GeV/c)
p -0.096±0.003 -0.045±0.003
Dl -0.130±0.003 0.011±0.003 -6.40±0.14
D2 -0.118±0.003 -0.063±0.003 8.05±0.20
D3 0.100±0.003 -0.084±0.003 1.57±0.07
TABLE 44. Summary of constrained decay hypotheses for event 598-1759.
Hypothesis Mass Decay 3-C Time Momentum
C.L. Excited States
(MeV/c2 ) (10-13 s) (GeV/c)
D+ -> K-K+7T+7To 1847±46 6.34±0.09 17.7±0.2 0.747
/\+ c -> K-p7T+7To 2191±42 7.54±0.14 18.1±0.3 0.303
constrained fits. The two hypotheses which produced masses in the
appr0~riate range (and therefore acceptable 3-C confidence
levels) were D+ -> K-K+7T+7To and A6 -> K-p7T+7To. No D+* candidates
can be reconstructed in association with the o+, for which this
decay mode is Cabibbo-suppressed.
There are solutions for both o+ and F+ hypotheses for zero
constraint calculations which involve a missing K0 • The range in
186
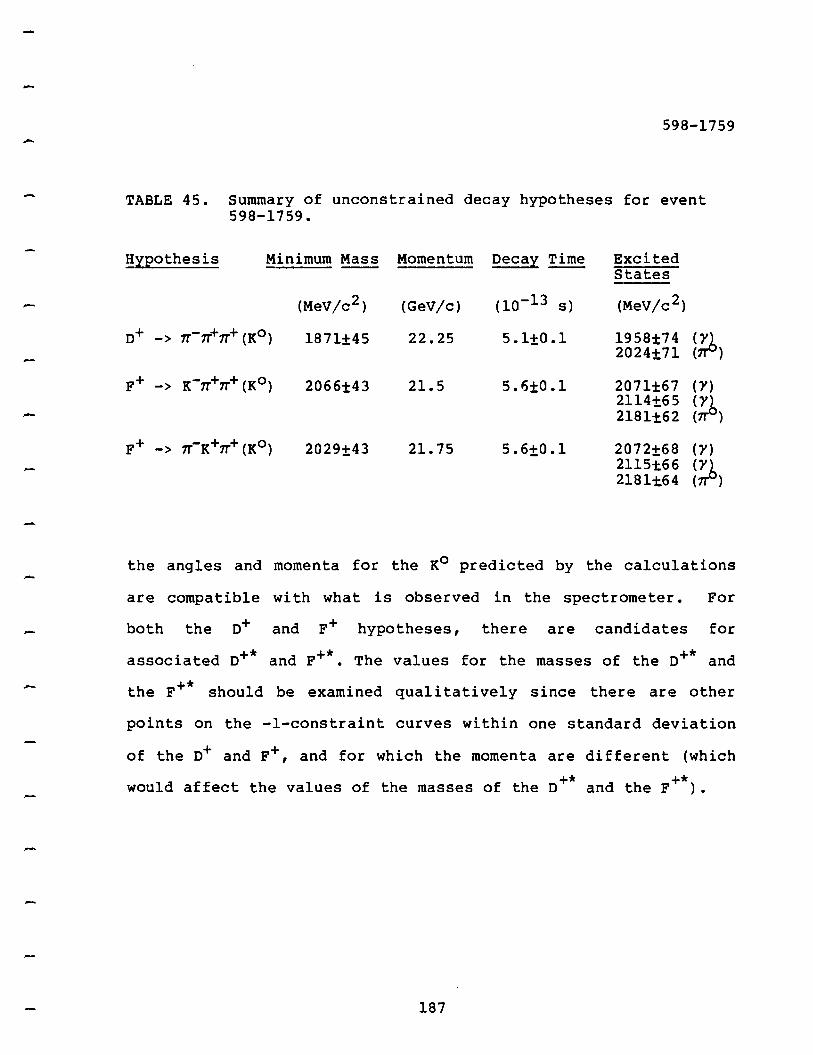
-
-
598-1759
TABLE 45. Summary of unconstrained decay hypotheses for event 598-1759.
H:tpothesis Minimum Mass Momentum Deca:t Time Excited States
(MeV/c 2 ) (GeV/c) (10-l 3 S) (MeV/c 2 )
o+ -> 1T-1T+1T+ (Ko) 1871±45 22.25 5.1±0.1 1958±74 (;;b 2024±71 ( )
F+ -> K-1T+1T+ (K0 ) 2066±43 21.5 5.6±0.1 2071±67 (Y) 2114±65 (J') 2181±62 (rro)
F+ -> 7T-K+rr+(K0 ) 2029±43 21.75 5.6±0.1 2072±68 (J') 2115t66 (Yb 21Blt64 (1T )
the angles and momenta for the K0 predicted by the calculations
are compatible with what is observed in the spectrometer. For
both the o+ and F+ hypotheses, there are candidates for
associated o+* and F+*. The values for the masses of the o+* and
the F+* should be examined qualitatively since there are other
points on the -!-constraint curves within one standard deviation
of the o+ and F+, and for which the momenta are different (which
+* +* would affect the values of the masses of the D and the F ) •
187
-
-
-
602-2032
Event 602-2032
In this event a charged particle decays to three charged
particles after 10 282.5±5.0µ. One of the decay particles
scatters in the emulsion and is then observed in the spectrometer
as an up-to-down track of momentum l.88t0.02 GeV/c. It is
identified as a proton. The two other decay particles are
reconstructed as up-only tracks with extremely poorly measured
momenta. Two downstream track segments are reconstructed which
do not appear to be part of any of the tracks observed in the
emulsion.
chambers.
There is also a multitude of hi ts in the upstream
The lead glass array contains no evidence for a rr0
•
The energy in the hadron calorimeter exceeds that of the incident
charged hadrons by a few GeV.
The analysis of this event was limited because the momenta
of two of the decay tracks were so poorly measured and since
ionization and pfJ measurements were not available {except to
confirm that the two particles were minimum ioni:G.i.ng) • It was
assumed, however, that the decay was that of a charmed baryon
because of the identification of one of the decay particles as a
proton.
lOrn addition a nuclear interaction is observed in the emulsion.
188

,.._
-
602-2032
TABLE 46. Decay tracks for event 602-2032.
dx/dz dy/dz Momentum (GeV/c)
I/Ia pP_
p 0.016±0.002 -0.099±0.002
Dl -0.048±0.005 0.106±0.005 1.88±0.02
Dlk -0.107±0.003 0.166±0.003 1. 88±0. 02
D2 0.271±0.005 -0.188±0.005 -2.16±3.58
D3 -0.125±0.008 -0.594±0.008 1. 90±1. 26
TABLE 47. Summary of unconstrained decay hypothesis for event 602-2032.
!!1Eothesis Minimum Mass Momentum _Qecay time Excited States
(MeV/c 2 } (GeV/c} (10-l 3 S} (MeV/c 2 }
/\6 -> p7T-1T+ (Ko} 2041±78 3.3 6.51±0.12 6.4 3.36±0.06
The only constrained hypothesis which had an acceptable
confidence level was the Cabibbo unfavoured A6 -> pK-K+, shown in
Table 48. 0-constraint hypotheses for /\b -> p1T-7T+ (Ko} were
examined using different momenta for the pions. The upper and
lower bounds for the momentum of the A6, 6.4 Gev/c and 3.3 GeV/c,
are obtained by assuming both pions have momentum equal to 0. 5
GeV/c. (Any increase in the momentum of the two pions will move
189

-
--
-
-
602-2032
TABLE 48. Summary of constrained decay hypothesis for event 602-2032.
!!i:Eothesis Mass Decay 2-C 2-C Excited Time Momentum C.L. States
(MeV/c 2 ) c10-13 S) (GeV/c) (MeV/c 2)
A+ c -> P1T-1T+ 1764±24
11+ c -> pK-1T+ 2007±18
A+ c -> pK-K+ 2257±12 5.40±0.11 3.98±0.04 0.06
the minimum and maximum closer together.) For the purposes of
the A6 lifetime calculation, the decay time for this event was
taken to be 4.48±1.4 x lo-l3 s.
190
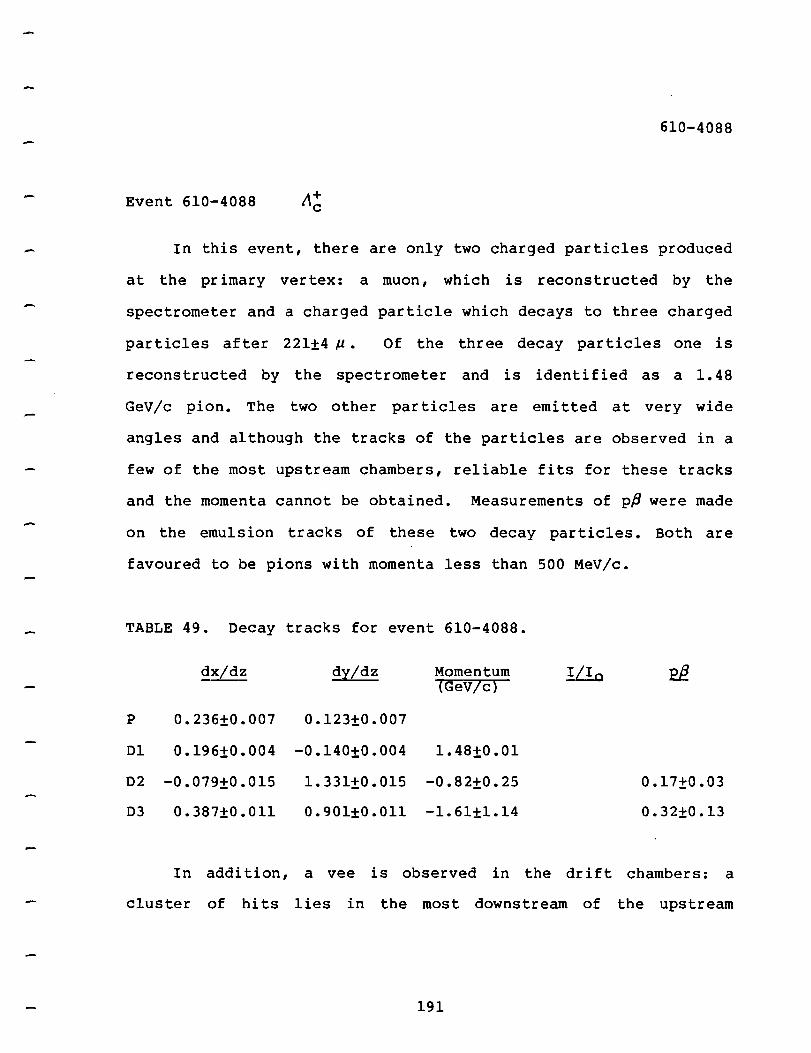
-
610-4088
Event 610-4088
In this event, there are only two charged particles produced
at the primary vertex: a muon, which is reconstructed by the
spectrometer and a charged particle which decays to three charged
particles after 221±4 µ • Of the three decay particles one is
reconstructed by the spectrometer and is identified as a 1. 48
GeV/c pion. The two other particles are emitted at very wide
angles and although the tracks of the particles are observed in a
few of the most upstream chambers, reliable fits for these tracks
and the momenta cannot be obtained. Measurements of pp were made
on the emulsion tracks of these two decay particles. Both are
favoured to be pions with momenta less than 500 MeV/c.
TABLE 49. Decay tracks for event 610-4088.
dx/dz dy/dz Momentum !/Ia l'GeV/c)
p 0.236±0.007 0.123±0.007
Dl 0.196±0.004 -0.140±0.004 1.48±0.01
02 -0.079±0.015 1. 331±0. 015 -0.82±0.25 0.17±0.03
03 0.387±0.011 0.901±0.011 -1. 61±1.14 0.32±0.13
In addition, a vee is observed in the drift chambers: a
cluster of hi ts lies in the most downstream of the upstream
191

--
610-4088
TABLE 50. Summary of decay hypothesis for event 610-4088.
Hypothesis Minimum Mass Momentum Decay time Excited States
(MeV/c2) (GeV/c) (lo-13 s) (MeV/c 2)
.11+ -> c 1T+1T+1T- (110) 2127±49 6.39 2.62
chambers, and there are two track segments in the downstream
chambers, one of which passes through the TOF II array, while the
other is at too wide an angle. Quite fortunately, it is the
positively charged particle from the vee which enters a TOF II
counter. Since the decay point of the vee particle is known, it
is determined to be a .11° -> p7T-, based on the TOF information
which supports the hypothesis that the positive decay particle is
a proton. The vee cannot be that of a Ko-> 1T-1T+.
All of the energy deposited in the lead glass is due to the
three incident charged particles. No excess energy is observed in
the hadron calorimeter.
The charm decay cannot be fitted using a charged-only decay
mode. The predictions of the zero-constraint calculation for the
angles and momenta of the A0 of the decay A~-> 1T+1T+1T-(A0 > are in
excellent agreement with the observations of the spectrometer.
192

638-9417
Event 638-9417 F+
In this event a positively charged particle decays to three
particles after 153±8 µ • Two of the three decay particles have
TOF identification: one is identified as a K+ and the second is -
ambiguous as to K- and p interpretations, but can be excluded as
a 'Tl'-. The probability of there being a p is extremely small,
since the emulsion is not composed of valence antiquarks. The
third decay particle has an upstream-only track and therefore
cannot be identified by TOF. In addition, a gamma conversion to
an electron-positron pair occurs in the emulsion and the
electromagnetic shower continues into the upstream chambers. The
energy deposited in the calorimeter is 6.1 GeV. Energy is
deposited in nine lead glass blocks, (including that due to
incident charged particles) , from which several rr0 candidates may
be reconstructed. Transverse momentum imbalance at the decay
vertex if a neutral decay particle is not assumed, is 635 MeV/c 2•
None of the reconstructed rr0 candidates are in the direction
which would balance transverse momentum at the decay vertex. Nor
can a K0 be inferred from the calorimeter since the measured
hadronic energy may be attributed in total to the charged
hadrons. It is possible however to reconstruct a rr0 using the
emulsion information regarding the gamma conversion, and an
additional upstream-only track, which one could assume to be an
193
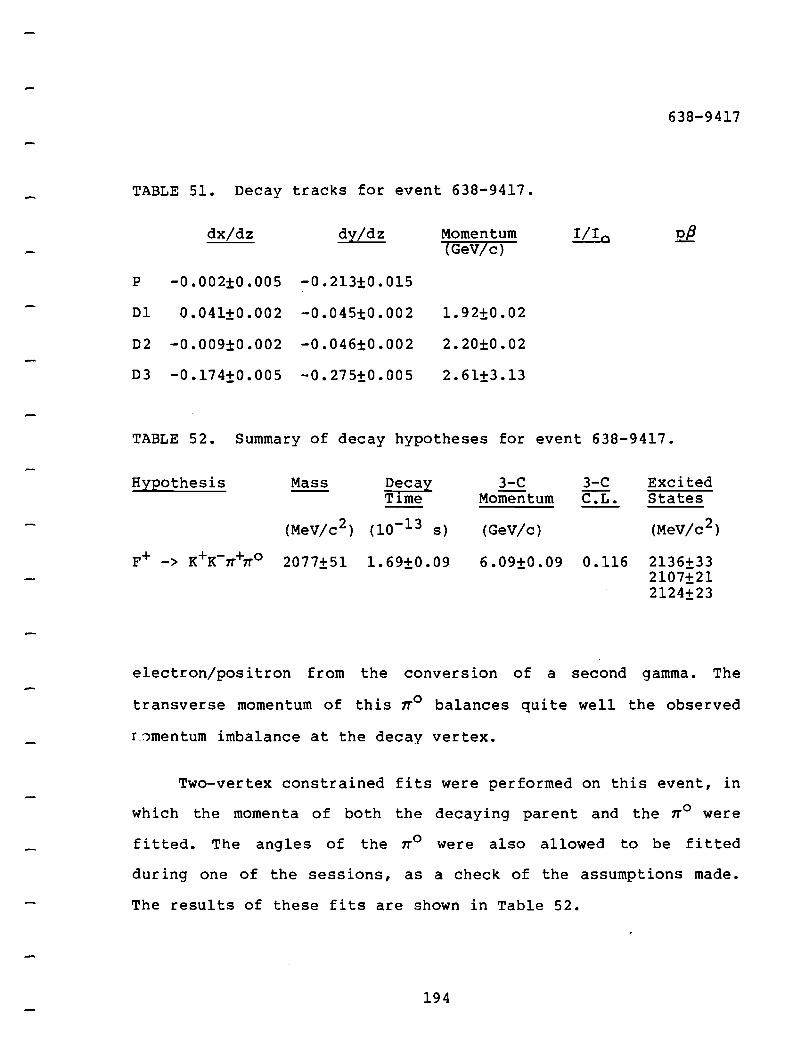
638-9417
TABLE 51. Decay tracks for event 638-9417.
dx/dz dy/dz Momentum I/I 0 El!. (GeV/c}
p -0.002±0.005 -0.213±0.015
Dl 0.041±0.002 -0.045±0.002 1. 92±0. 02
D2 -0.009±0.002 -0.046±0.002 2.20±0.02
D3 -0.174±0.005 -0.275±0.005 2.61±3.13
TABLE 52. Summary of decay hypotheses for event 638-9417.
HyEothesis Mass Decay 3-C 3-C Excited Time Momentum C.L. States
(MeV/c 2} cio-13 s} (GeV/c} (MeV/c 2}
F+ -> K+K-7T.+7To 2077±51 1.69±0.09 6.09±0.09 0.116 2136±33 2107±21 2124±23
electron/positron from the conversion of a second gamma. The
transverse momentum of this rr0 balances quite well the observed
L'.)mentum imbalance at the decay vertex.
Two-vertex constrained fits were performed on this event, in
which the momenta of both the decaying parent and the 7T0 were
fitted. The angles of the 7To were also allowed to be fitted
during one of the sessions, as a check of the assumptions made.
The results of these fits are shown in Table 52.
194

638-9417
Clearly the only acceptable interpretation for this event is
that it is a decay of a F+ meson. The fitted baryon mass is above
that of the A~, and there are no hypotheses consistent with the
decay of the o+.
Even if the ~0 seems dubious, it is interesting to note that
the results of the zero-constraint calculations support the
conclusions made concerning the parent particle species. The
minimum masses for the zero-constraint calculations are rather
high for the o+ and A~ for their appropriate decay modes, yet are
quite consistent with the mass of.the F+ for the decay F+ -> K+K
~+~o. There are two independent candidates for the F+*, assuming
the decay mode F+* -> F+Y.
195

--
650-6003
Event 650-6003
In this event, a charged particle decays in a vertical
emulsion module to three charged particles after 40.6-1:.2.0 µ. Two
of the decay particles are reconstructed in the spectrometer.
One particle is seen in both the upstream and the downstream
chambers and is identified as a 1.21 GeV/c rr+; the second is seen
in only the upstream chambers and has a momentum of -0.44 GeV/c.
Ionization and pp measurements performed in the emulsion
identified the second particle as a rr • The third particle,
which is not reconstructed in the spectrometer, and which is
assumed to be positively charged, is most probably a pion on the
basis of emulsion measurements. The transverse momentum
imbalance at the decay vertex is 381 MeV/c. There is no evidence
for a neutral hadron in the calorimeter nor can a rr0
be
reconstructed using the lead glass.
TABLE 53. Decay tracks for event 650-6003.
~x/dz dy/dz Momentum (GeV/c)
!il.D Pi!_
p -0.167±0.038 -0.038±0.015
Dl -0.397±0.006 -0.121±0.006 1. 21±0. 01
02 -0.220±0.005 -0.256±0.005 0.80±0.05 0.800±0.365
03 -0.387±0.007 -0.308±0.007 -0.44±0.13 0.89±0.05 0.380±0.137
196
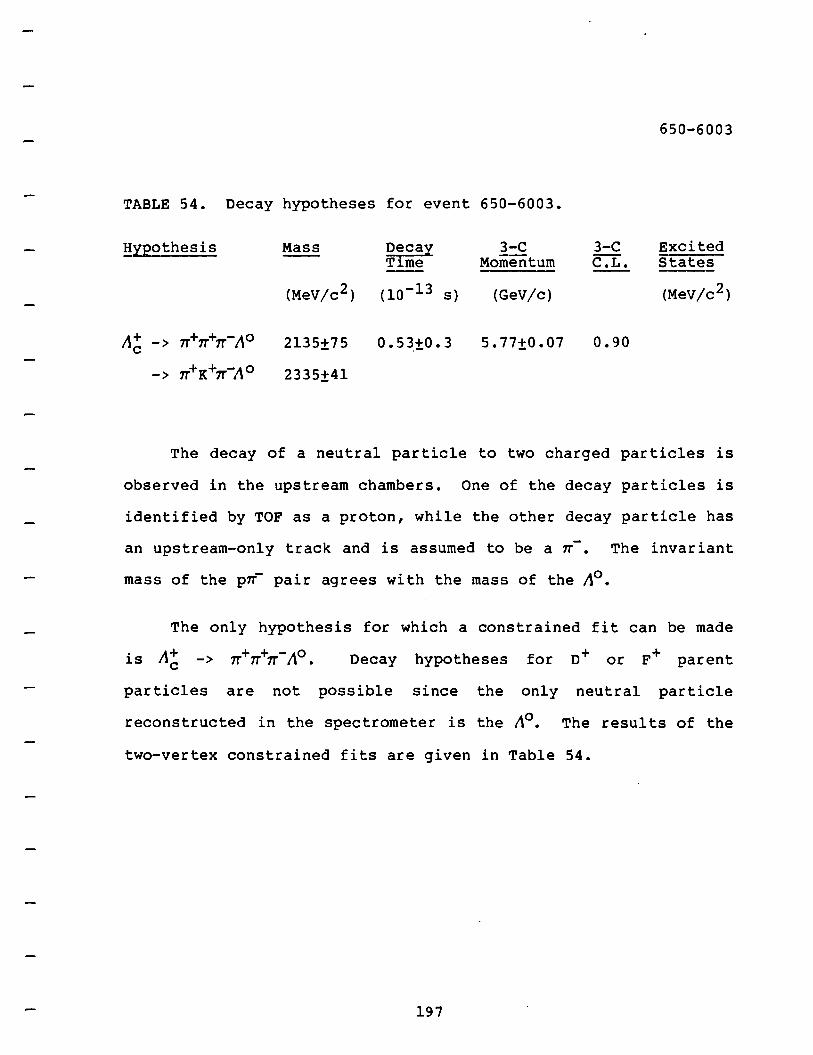
650-6003
TABLE 54. Decay hypotheses for event 650-6003.
!!:LPOthesis Mass Decal 3-C 3-C Excited Time Momentum C.L. States
(MeV/c2) (lo-13 s) (GeV/c) (MeV/c 2)
11+ -> 7T+1T+1T-l\o 2135±75 0.53+0.3 5.77±0.07 0.90 c ,-
-> 1T+K+7T-I\ o 2335±41
The decay of a neutral particle to two charged particles is
observed in the upstream chambers. One of the decay particles is
identified by TOF as a proton, while the other decay particle has
an upstream-only track and is assumed to be a 7T • The invariant
mass of the p7T- pair agrees with the mass of the 11°.
The only hypothesis for which a constrained fit can be made
Decay hypotheses for D+ or F+ parent
particles are not possible since the only neutral particle
reconstructed in the spectrometer is the /\0 • The results of the
two-vertex constrained fits are given in Table 54.
197
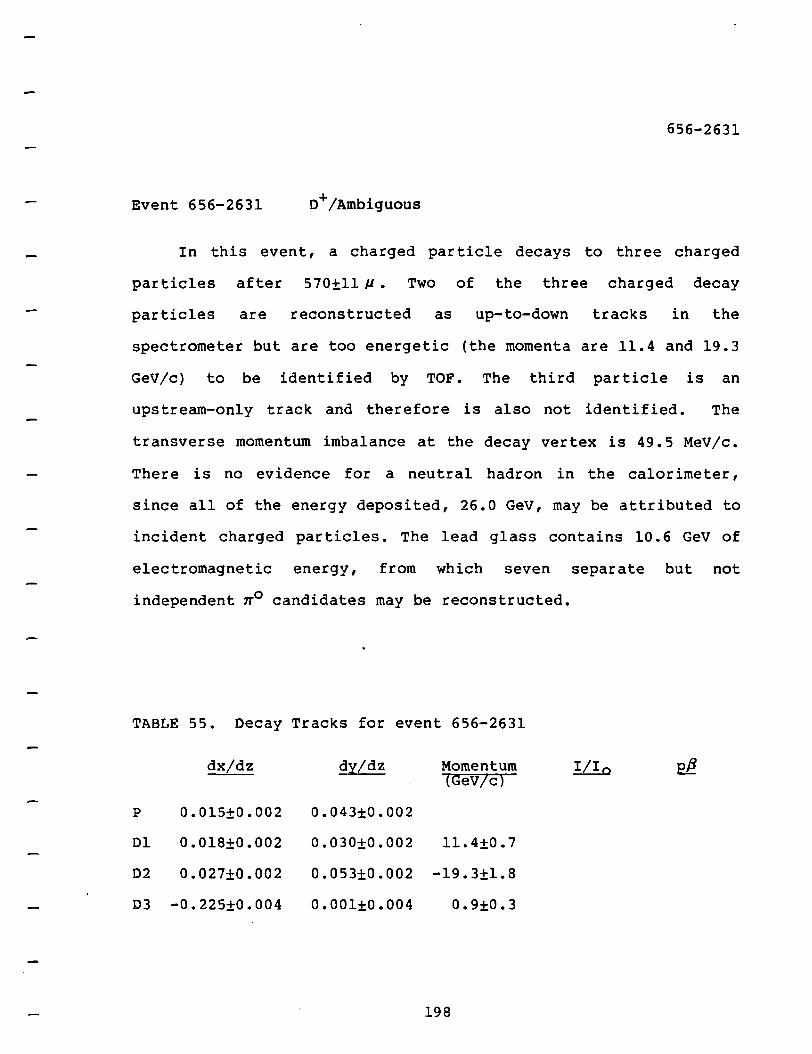
656-2631
Event 656-2631 o+/Ambiguous
In this event, a charged particle decays to three charged
particles after 570±11 µ • Two of the three charged decay
particles are reconstructed as up-to-down tracks in the
spectrometer but are too energetic (the momenta are 11.4 and 19.3
GeV/c) to be identified by TOF. The third particle is an
upstream-only track and therefore is also not identified. The
transverse momentum imbalance at the decay vertex is 49.5 MeV/c.
There is no evidence for a neutral hadron in the calorimeter,
since all of the energy deposited, 26.0 GeV, may be attributed to
incident charged particles. The lead glass contains 10.6 GeV of
electromagnetic energy, from which seven separate but not
independent ~0 candidates may be reconstructed.
TABLE 55. Decay Tracks for event 656-2631
dx/dz ~y/dz Momentum I/Ia pf}_ 1GeV/c)
p 0.015±0.002 0.043±0.002
Dl 0.018±0.002 0.030±0.002 11. 4±0. 7
02 0.027±0.002 0.053±0.002 -19.3±1.8
D3 -0.225±0.004 0.001±0.004 0.9±0.3
198

656-2631
TABLE 56. Summary of decay hypotheses for event 656-2631.
!!.2::r2othesis Mass DecaY: 3-C 3-C Excited Time Momentum C.L. States
(MeV/c2 ) c10-13 s) (GeV/c) (MeV/c2)
o+ -> v+K-v+ 1759±256 1. 09±0. 06 32.5±1.5 0.847 2022±20
F+ -> K+K-1r+ 1928±248 1.19±0. 06 32.4±1.5 0.876
I\+ c -> pK-,,.+ 2340±24 1.42±0.06 30.5±1.2 0.883
o+ -> 7T+K-v +7To 1888±89 0.99±0.04 35. 9±1. 4 0.997 2029±23
F+ -> K+K-v +vo 2069±87 1.34±0.05 35. 2±1. 2 0.987
I\+ c -> pK-v+vo 2498±99 1. 51±0. 05 28.7±0.8 0.210
F+ -> '7T + '7T - '7T + '7T 0'7TO 2098±112 1.06±0.04 36.2±1.2 0.746
Several decay hypotheses for the o+, F+ and A6 may be fitted
with acceptable confidence levels. There are the charged-only
decay modes D+ -> v+K-v+, F+ -> K+K-v+ and Ab-> pK-v+, as well
as decay modes which involve a 1T0 • Different 7To candidates can be
used in these fits, although only the best fits for the parent
o+, F+ and A6 are shown in Table 56. It was also possible to fit
the decay F+ ->v+v-v+v0v 0 , using two independent 7To candidates.
No evidence for the decay F+* -> F+Y was found. Several
candidates for the decay o*+ -> D+1To were found and are shown in
Table 56.
199

663-7758
Event 663-7758 o+/Ambiguous
A charged particle decays to 3 charged particles in the
vertical emulsion after 13000±50 µ • The three decay particles
have momenta +14.59, +22.06, and -39.5 GeV/c, and are thus too
energetic for TOF identification. The particles all enter the
same lead glass block, 41, in which 19. 92 GeV of energy is
deposited. Adjacent to this block are two blocks each containing
approximately 2 GeV of energy. Three other blocks, not in the
immediate vicinity of the charged tracks, have energy deposited
in them. The transverse momentum imbalance at the decay vertex,
if a neutral secondary is not assumed, is 681 MeV/c. There is 55
GeV of hadronic energy in the calorimeter.
TABLE 57. Decay tracks for event 663-7758.
dx/dz dy/dz Momentum (GeV/c)
I/I 0 E!!. p -0.004±0.002 -0.003±0.002
Dl 0.000±0.002 -0.008±0.002 22.06±2.38
02 -0.018±0.002 -0.009±0.002 39.50±8.22
D3 -0.016±0.002 0.001±0.002 14. 59±1. 06
The large amount of energy in block 41 indicates the
existence of an electron or positron. The most likely
interpretation is that the 14. 59 GeV/c particle is a positron.
200

663-7758
TABLE 58. Summary of decay hypotheses for event 663-7758.
!!XPOthesis Minimum Mass Momentum Decay Time Excited SEaEes
(MeV /c2) (GeV/c) (1 0-13 S) (MeV /c 2)
o+ -> 1T+1T-e+ {Ve) 1713±367 97.49 8.3 2403±85 195.13 4.1
F+ -> 1T+1T-e+ (V ) 1712±367 91.03 9.7 2445±97 e 2052±32 2062±34
246.9 3.6
o+ -> 7T+K-e+ ( v ) e 1907±322 123.5 6.6 2520±105
F+ -> K+7T-e+Cve) 2037±354 115.0 7.6 2875±100 2158±26 2140±26
F+ -> K+K-e+ ( v ) 2190±316 113.5 7.8 2532±118 e 2057±50 2066±52
A+ c -> p1T-e + ( ve) 2690±341 103.5 9.6
.t\+ c -> pK-e+ ( ve) 2795±327 102.0 9.7
F+ -> e+1T-1T+ (Ve) 1729±369 91.3 9.6 238.6 3.7
F+ -> e+7T-K+(v ) e 2189±339 113.0 7.8
o+ -> e+K-7T+(ve) 1919±327 121.0 6.7
F+ -> e+K-K+ ( v ) e 2370±257 124.5 7.1
"+ c -> e+7T-P ( ve) 3109±250 112.0 8.8
"+ c -> e+K-p(ve) 3135±330 98.5 10.0
.-
201

663-7758
The remainder of the electromagnetic energy in this block and its
two neighbours would be attributed to that deposited by the other
incident charged, minimum-ionizing particles and the energy due
to photons radiated by the e+ through the bremsstrahlung process.
(In addition two tracks from the primary vertex enter this
block.) The possible decay hypotheses using this assumption are
shown in Table 58. It is also possible that the 22.06 GeV/c
particle is a positron. However, one would have to assume that
some of the electromagnetic energy has not been contained by the
lead glass. Decay hypotheses for this assumption are shown in
Table 58. In both cases, the energy in the calorimeter, may be
attributed to incident charged hadrons, and thus there is no
evidence for the existence of a K0 or neutron. An electron
neutrino has been included for lepton conservation which also
serves to balance the transverse momentum.
All of the decay hypotheses containing a proton have masses
well beyond that of the A6 baryon (2285 MeV/c 2), thus eliminating
that particle from consideration as the parent. The three lead
glass blocks which do not have incident charged particles were
used in the calculation of o+* and F+* candidates. It was
assumed that the F+* decays exclusively to FY while the o+* may
decay to DY or orr°. The findings for the excited charm states
unfortunately do not resolve the ambiguity between a D+ and a F+
interpretation for the event.
202

671-7015
Event 671-7015 F+
In this event a charged particle decays to a single charged
particle after 65.0±5 µ. The decay particle is reconstructed in
the spectrometer as an up-only track with momentum 0. 49-1:.0. 25
GeV/c. By ionization and pp measurements made in the emulsion,
the particle is favoured to be a K+. The transverse momentum
imbalance at the kink vertex is 350 MeV /c. Three lead glass
blocks contain energy. The energy in one is accounted for by an
incident charged particles while the two other blocks, 15 (0. 51
GeV) and 22 (0.34 GeV), have no incident charged particles.
There are two vee candidates in the drift chambers. The first
vee has one reconstructed up-to-down track with momentum 0. 25
GeV/c, which cannot originate at the production or decay vertex.
Because of its wide angle it misses the TOF array. The second
track in this vee candidate is not reconstructed although several
hits (<6) exist in the first few upstream chambers at wide
angles. The second vee candidate has one up-to-down track with
momentum 1.30±0.05 GeV/c and a second up-only track with momentum
-0.45±0.05 GeV/c.
MeV/c 2 •
The invariant mass of this pair is 451±33
0-constraint calculations were performed for the decay
hypotheses K+(rr0 ) and K+(K0 ). The low-momentum solution for the
K+(rr0 ) hypothesis cannot be excluded since the predicted angles
203
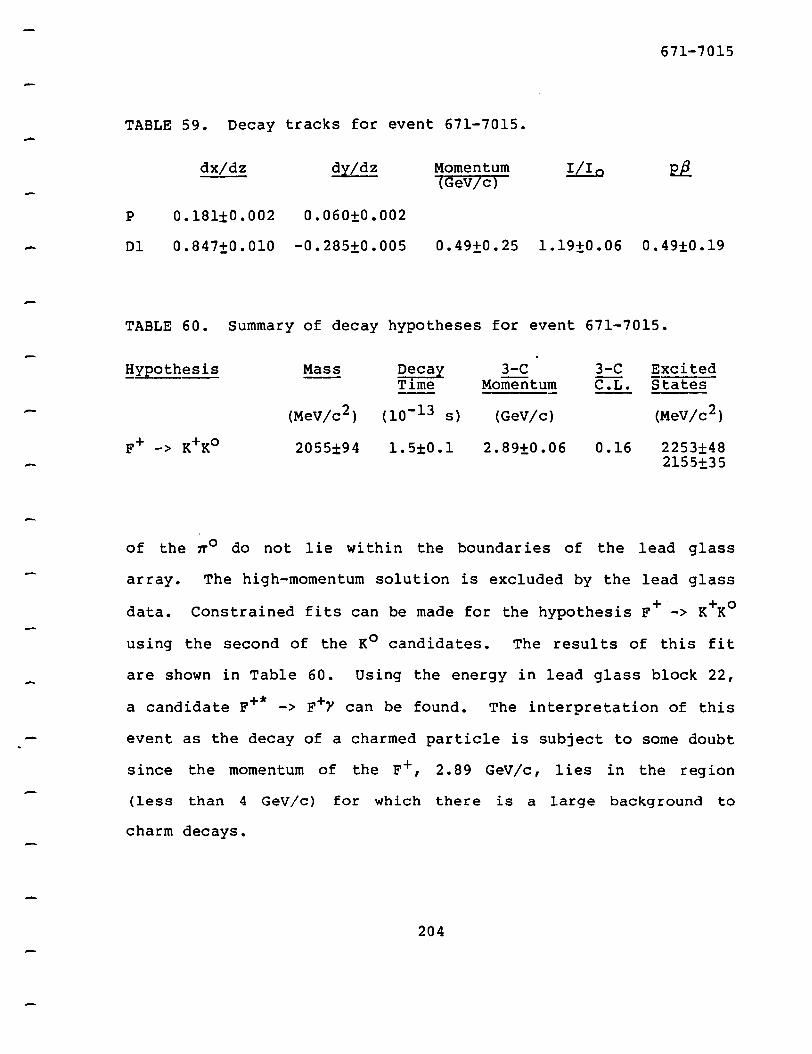
-
671-7015
TABLE 59. Decay tracks for event 671-7015.
dx/dz dy/dz Momentum I/I 0 1Gev/c)
p 0.181±0.002 0.060±0.002
Dl 0.847±0.010 -0.285±0.005 0.49±0.25 1.19±0.06 0.49±0.19
TABLE 60. Summary of decay hypotheses for event 671-7015.
Hy:eothesis Mass Decay 3-C 3-C Excited Time Momentum C.L. States
(MeV/c2 ) (lo-13 s) (GeV/c) (MeV/c 2 )
F+ -> K+Ko 2055±94 1.5±0.1 2.89±0.06 0.16 2253±48 2155±35
of the 1To do not lie within the boundaries of the lead glass
array. The high-momentum solution is excluded by the lead glass
data. Constrained fits can be made for the hypothesis F+ -> K+Ko
using the second of the K0 candidates. The results of this fit
are shown in Table 60. Using the energy in lead glass block 22,
a candidate F+* -> F+Y can be found. The interpretation of this
event as the decay of a charmed particle is subject to some doubt
since the momentum of the F+, 2.89 GeV/c, lies in the region
(less than 4 GeV/c) for which there is a large background to
charm decays.
204

REFERENCES
H. Abramowicz et al., Phys. Lett. 109B (1982) 115.
E. Albini et al., Phys. Lett. llOB (1982) 339.
D. Allasia et al., Nuclear Physics B 176 (1980) 13.
R. D. Ammar et al., Phys. Lett. 94B (1980) 118.
C. ~ngelini et al., Phys. Lett. SOB (1979) 428.
C. Angelini et al., Phys. Lett. 84B (1979b) 150.
J. J. Aubert et al., Phys. Rev. Lett. 33 (1974) 1404.
J.-E. Augustin et al., Phys. Rev. Lett. 33 (1974) 1406.
David c. Bailey, Neutrino Charm Production and a Limit to Neutrino Oscillations, Ph.D. Thesis, McGill University, 1983.
C. Baltay et al., Phys. Rev. Lett. 42 (1979) 1721.
I• Bars et al., Phys. Rev. Lett. 29 (1972) 969.
I• Bars et al., Phys. Rev. D 7 (1973) 1233.
G. Bellini et al., Phys. Rep. 83 (1982 )' 1.
A. Benvenuti et al., Phys. Rev. Lett. 35 (1975) 1199.
B. J. Bjorken and S. L. Glashow, Phys. Lett. 11 (1964) 255.
A. Bodek, Proceedings of the Calorimeter Workshop (M. Atac, Fermilab) (1975) 229.
E. H. S. Burhop et al., Phys. Lett. 65B (1976) 299.
Bruce A. Campbell, Current Induced Interactions in Quantum Chromodynamics, Ph.D. Thesis, McGill University, 1980.
205

L. A. Copley, Nathan Isgur and Gabriel Karl, Phys. Rev. D 20 (1979) 768.
A. de Rujula, Howard Georgi and S.L. Glashow, Phys. Rev. D 12 (1975) 147.
B. de Wit et al., Nucl. Phys. B57 (1973) 237.
Roland M. Egloff, Measurements of Elastic Rho, Omega and Phi Meson Photoproduction CrosS-Sections on Protons from 30 to 180 GeV, Ph.D. Thesis, Un1vers1ty of Toronto, 19~ ~
Steven M. Errede, Measurement of the Lifetimes of the Charmed D+, F+ Mesons and the~ Charmed-"Baryon, Ph.D.'fhes'Is, The Oh"'[Q'""" State University, 1981.
A. G. Frodesen, o. Skjeggestad, and H. Tofte, Probability and Statistics in Particle Physics, Bergen, Un1vers1tetSforlaget, 1979.
M. K. Gaillard, B.W. Lee and J. Rosner, Rev. Mod. Phys. 47 (1975) 277.
M. K. Gaillard, S.A. Jackson and D.V. Nanopoulos, Nucl. Phys. B 102 (1976) 326~ Nucl. Phys. B 112 (1976) 545.
Sheldon L~ Glashow, Nucl. Phys. 22 (1961) 579.
s. L. Glashow, J. Iliopoulos and L. Maiani, Phys. Rev. D 2 (1970) 1285.
G. Goldhaber et al., Phys. Rev. Lett. 37 (1976), 255.
Michael Gutzwiller, The Lifetime of the D° Charmed Meson, Ph.D. Thesis, The Ohio State University, 1981.
J. Hanlon et al., Phys. Rev. Lett. 45 (1980) 1817.
J. Hanlon, private communication, 1981.
Toshio Hara, Ph.D. Thesis, Osaka City University, 1982.
S. W. Herb et al., Phys. Rev. Lett. 39 (1977) 252.
Peter w. Higgs, ~hys. Rev. Lett. 13 (1964), 508.
M. Kaplon, B. Peters and D. Ritson, Phys. Rev. 85 (1952) 900.
206

T. Kafka et al., Phys. Rev. Lett. 48 (1982) 910.
M. Kobayashi and T. Maskawa, Prog. Theor. Phys. 49 (1973) 652.
Benjamin w. Lee, c. Quigg and Jonathan L. Rosner, Phys. Rev. D 15 (1977) 157.
Jacques P. Leveille, University of Michigan preprint UMHE 81-18.
v. A. Lubimov et al., Phys. Lett. 94B (1980) 266.
K. Maltman and N. Isgur, Phys. Rev. D 22 (1980) 1701.
s. Mori, Fermilab technical publication TM 888 1979, unpublished.
K. Nishikawa et al., Phys. Soc. Ja:ean Journal 14 (1959) 880.
K. Niu, E. Mikumo and Y. Maeda, Prog:. Theor. Phys. 46 (1971) 1644.
I• Peruzzi et al. Phys. Rev. Lett. 37 (1976) 569.
M. Piccolo et al., Phys. Rev. Lett. 39 (1977) 1503.
Dale Pitman, Construction, Testing and Use of Large Scale Drift Chambers in Fermilab Ex:eeriment 531, M. Sc. Thesis, University of Toronto, 1979.
A. L. Read et al., Phys. Rev. D 19 (1979) 1287.
F. Reines, H. W. Sobel, and E. Pasierb, Phys. Rev. Lett. 45 (1980) 1307.
A. Sal~m, Proceedings of the Eighth Nobel sym:eosium (Almqvist and W1ksells, Stockholm), 1968.
Hiroshi Shibuya, Ph.D. Thesis, Nagoya Universtiy, 1982.
D. Son et al., Phys. Rev. Lett. 49 (1982) 1128.
George H. Trilling, Phys. Re:e. 75 (1981) 57.
G. t'Hooft, Nucl. Phys. B33 (1971) 173.
N. Ushida et al., Phys. Rev. Lett. 45 (1980) 1049.
N. Ushida et al., Phys. Rev. Lett. 45 (1980) 1053.
207

N. Ushida et al., Phys. Rev. Lett. 47 (1981) 1694.
N. Ushida et al.' Phys. Rev. Lett. 48 (1982) 844.
- N. Ushida et al., to be submitted to Nuclear Instruments and Methods (1983).
Steven Weinberg, Phys. Rev. Lett. 19 (1967) 1264.
208