lte fixed to mobile subscribers qoe evaluation · pdf filelte fixed to mobile subscribers qoe...
TRANSCRIPT
LTE Fixed to Mobile Subscribers QoE evaluation
João Manuel Queirós Estrela Pires
Instituto Superior Técnico
University of Lisbon
Lisbon, Portugal
Luís M. Correia
Instituto Superior Técnico / INOV-INESC
University of Lisbon
Lisbon, Portugal
Abstract— The main problem addressed in this thesis is the
analysis of the LTE cells performance in order to assess the quality
of the data services provided by them. Taking that into account,
two simulators were developed in order to characterise and
analyse a sample of experimental measurements. Knowing the
measurements performance one can find the cells in which the
users who are connected to them cannot have an acceptable quality
of service (so called pessimistic cells). That cells are defined by
having more than 30% of pessimistic measurements in a sample
with, at least, a total of 20 measurements. It is important to
highlight that, during the off-peak hours, the LTE 1 800 MHz
frequency band has not any cell with a pessimistic performance.
Considering only the measurements reported during the off-peak
hours, one can realise that the performance is essentially limited
by the network coverage. On the other hand, during the on-
peak/busy hours, the cell capacity has a direct influence on the
quality of the data services which are provided to the users. In
order to provide better services, some improvements in the cells
capacity and in the receiver conditions can be implemented by the
mobile operators. For example, an external antenna can be placed
outdoors and connected to the user equipment’s in order to
remove the extra attenuation that comes from the indoor
penetration. Considering the LTE 800 MHz band, theoretical data
rate can increase from 4.64 to 49.17 Mbit/s when an outdoors
antenna is added.
Keywords- LTE, Indoor Scenarios, Quality of Experience, Data
Services, Data Rates, Penetration Attenuation
I. INTRODUCTION
In the past few years, not only the number of mobile subscribers has increased massively, but also mobile communications have known great technological developments that had a great impact at social and economic levels. In the past, mobile phones were used mainly for voice communication, however, currently they are used to access a wide range of services, and to do tasks that were previously only performed by computers. This implies that data services have, nowadays, the main role in mobile communications. Due to the growing need for better users experience and higher data speeds for mobile users, new and more efficient mobile communications systems were developed over the last years. Third Generation Partnership Project (3GPP) has played an important role, being involved in the development of the latest releases concerning mobile communication technologies: Universal Mobile Telecommunications System (UMTS), also known as 3rd Generation (3G), and Long Term Evolution (LTE), so called 4th Generation (4G). Since its commercial release in 2010, the
number of LTE subscriptions is growing rapidly, and has reached around 350 million.
LTE is optimised for data services and although being a mobile system it can be used to provide “fixed” services (e.g., wireless data connections) to users when they are at home. However, in urban areas fixed data connections provided by Fibre-to-the-Home (FTTH) are already a reality for almost all users. In terms of Quality of Service (QoS), cellular networks cannot compete with the optical fibre, but the usage of LTE to provide “fixed” services can be a good solution in rural areas, where it is more unsustainable to provide FTTH solutions. When an LTE network is designed or optimised to provide “fixed” data services, there are many matters that must be taken into account, e.g., the choice of frequency bands, the location of the base stations, and the characterisation of coverage in indoor environments. On the other hand, some performance parameters, like the QoS and the Quality of Experience (QoE), need to be evaluated in order to assess this possibility. This paper addresses this problem, aiming at providing an assessment for several scenarios, and eventual guidelines for implementation. Thus, one of the main objectives of this work is the evaluation of LTE cells performance in order to assess the quality of data services. This analysis is based on the results obtained from two different models (developed from scratch) and taking a sample of more than 80 000 experimental measurements into account.
The paper is organized as follows. Section I – Introduction; Section II – State of the art of the problem under study; Section III – Theoretical development and implementation of the models and simulators; Section IV – Analysis of results; Section V –Conclusions.
II. STATE OF THE ART
With the quickly development of mobile Internet and the popularity of mobile devices, wireless data usage are growing exponentially. Meanwhile, multimedia data services require a higher rate and transmission quality of the wireless network. Operators have been forced to invest and develop new solutions to increase the capacity they can offer to their subscribers.
New generations of cellular technologies, like LTE, are mainly focused on the provision of broadband mobile services with the highest spectral efficiency. However, in indoors the through the walls propagation losses put additional difficulties on the provisioning of mobile services with enough quality. In [1], a new approach is proposed to improve LTE Frequency Division Duplex (FDD) indoor coverage in LTE 2 600 MHz
band from a macro cell. According to the authors, the method takes advantage of the legacy coaxial TV cable transport infrastructure, deployed in buildings. This infrastructure is defined on frequency bands up to 2 150 MHz, and can distribute and broadcast Frequency Modulation (FM) radio, Digital Video Broadcasting Terrestrial (DVB-T), analogue terrestrial TV and other possible existing technologies for digitally modulated data transmission. It has been assessed that TV coaxial infrastructure can carry 2 600 MHz LTE band with only a moderate increment on power losses in respect of lower frequencies signals. This new method allows an improvement on LTE coverage in indoors, increasing indoors LTE range and user data rates, due to the improvement of users’ received signal. The approach only needs to add a few new elements without introducing any modifications in buildings coaxial TV networks. So, it simplifies traditional mobile networks deployments using an inexpensive solution.
LTE indoor small cell solutions are an important part of the heterogeneous network ecosystem. The benefits of this coverage solution are mainly due to spectral re-use over small distances, giving significant capacity and coverage improvements. In [2], the coverage and capacity gain achievable from two types of LTE indoor small cell product (2×21 dBm and 2×24 dBm) are investigated. In [2], simulation results show that significant coverage gains up to 25% can be achieved on the high power product compared to the lower one. Furthermore, the results also indicate that capacity gains up to 26% can be achieved on the 2×24 dBm, due to higher order modulation and coding. The gain results are sensitive to propagation assumptions, such as models and path loss exponents.
Fixed wireless systems are candidate solutions to connect billions of users not yet connected to the Internet. In [4], the capabilities of High Speed Packet Access (HSPA) and LTE fixed wireless systems in terms of coverage, data rates, and capacity are discussed and evaluated. Some results indicate that in an Indian rural scenario with an inter site distance of 40 km, monthly data volumes of 430 MB per user, together with a cell edge data rate of 5 Mbit/s in downlink (DL) and 2 Mbit/s in uplink (UL) are reached in LTE. A key enabler is the use of directional rooftop terminal antennas. LTE is designed to support full mobility, so scenarios with fixed terminals are obviously supported. Many of the techniques used to reach high performance in mobile scenarios also improve performance in a fixed scenario, which has slower channel variations. In order to assess the fixed wireless capabilities of HSPA and LTE, in [4], the systems are evaluated in the Rural Indian Open Area scenario, which is based on radio propagation measurements and geographical and demographical characteristics of rural India. With the more advanced LTE configuration, supporting Multiple-Input Multiple-Output (MIMO), it is possible to achieve higher data rates and cell throughputs, when comparing with HSPA. With the usage of directional antennas, average data rates of 50 Mbit/s are achieved at low load. Furthermore, some results shows that even at the highest loads (15 Mbit/s sector throughput), several Mbit/s are achieved at the cell edge. Results indicate that significant gains in data rates, coverage, and capacity can be obtained by the use of outdoor directional terminal antennas.
A new approach to network performance and app coverage was proposed by Ericsson in [5]. From a user’s perspective, app coverage is defined as the probability that the network will deliver sufficient performance to run a particular app at an acceptable quality level and from the operator’s perspective, it deals with cell edge performance. In order to illustrate app coverage in a realistic environment, a traffic profile of 500 MB per subscriber per month was applied, which includes the usage of particular applications types (streaming music, streaming video, and video telephony) as well as circuit switched voice. The coverage area and indoor penetration was predicted for each of the application types, using the radio characteristics of a UMTS/HSPA network (with 5 MHz bandwidth in the 2.1 GHz band). Three scenarios were explored focusing on a 4 km2 area: base case (11 three sector macro sites), tuning and optimisation (site count unchanged) and macro densification (add 10 macro sites for a total of 21 three sector sites).
III. MODELS AND SIMULATOR DESCRIPTION
A. Model Development
In order to analyse the scenarios considered in this work, it is important to compare some experimental data rates with their respective theoretical values. Theoretical data rates, in DL, can be obtained as a function of the Reference Signal Received Power (RSRP), however, it is not possible to relate them in one simple equation. First of all it is necessary to compute the total path loss associated with an RSRP value:
𝐿𝑝,𝑡𝑜𝑡[dB] = 𝑃𝑇𝑥,𝑅𝐸[dBm] − 𝑃𝑅𝑆𝑅𝑃[dBm] + 𝐺𝑡[dBi] − 𝐿𝑐[dB] −𝑀𝑐[dB] (1)
where:
𝑃𝑇𝑥,𝑅𝐸: transmitter output power per RE;
𝑃𝑅𝑆𝑅𝑃: reference signal received power;
𝐺𝑡: gain of the transmitting antenna;
𝐿𝑐: losses in the cable between the transmitter and the antenna;
𝑀𝑐: correction margin.
Knowing the value of the path loss, one can compute the
Signal to Interference plus Noise Ratio (SINR), which,
according to [6], is given by:
𝜌𝐼𝑁[dB] = 10 log10
(
1
[𝜌𝐶𝐶𝐻 + (1 − 𝜌𝐶𝐶𝐻)𝑄𝑃𝐷𝑆𝐶𝐻]𝐹𝑖 +𝑃𝑁,𝑅𝐸,𝐷𝐿[mW] 𝐿𝑝,𝑡𝑜𝑡
𝑃𝑇𝑥,𝑅𝐸[mW] )
(2)
where:
𝜌𝐶𝐶𝐻: fraction of Physical Downlink Shared Channel (PDSCH)
resources interfered by control channels;
𝑄𝑃𝐷𝑆𝐶𝐻: fraction of the PDSCH resources carrying user data;
𝐹𝑖: 𝐹 value in ring 𝑖; 𝑃𝑁,𝑅𝐸,𝐷𝐿: thermal noise per resource element in DL.
Finally, in order to establish a relationship between the SINR and the data rate per Resource Element (RE), (3) and (4) are presented [6]:
𝑅𝑏,𝑅𝐸[bit s⁄ ] = 𝑎3[bit s⁄ ] + (𝑎0[bit s⁄ ] − 𝑎3[kbit s⁄ ]) 𝑒−ln(2)(
𝜌𝐼𝑁[dB]−𝑎1[dB]𝑎2[dB]
)𝑎4
,
𝜌𝐼𝑁[dB] < 𝑎1[dB]
(3)
𝑅𝑏,𝑅𝐸[bit s⁄ ] = 𝑎0[bit s⁄ ] , 𝜌𝐼𝑁[dB] ≥ 𝑎1[dB] (4)
where:
𝑎0, 𝑎1, 𝑎2, 𝑎3, 𝑎4: fitted coefficients.
In DL, 𝑎0 and 𝑎3 have to be adjusted according to:
𝑎𝑖[bit/s] = 𝑎𝑖,𝑚𝑎𝑥[bit/s] (1 −𝑁𝑃𝐷𝐶𝐶𝐻14
−𝑁𝐶𝑅𝑆168
−48 −𝑁𝑎𝑛𝑡,𝐷𝐿140 𝑁𝑅𝐸
) (5)
where:
𝑎𝑖,𝑚𝑎𝑥: maximum value of coefficient 𝑖, which are obtained without
control channels;
𝑁𝑃𝐷𝐶𝐶𝐻: number of allocated symbols for Physical Downlink
Control Channel (PDCCH);
𝑁𝐶𝑅𝑆: number of cell-specific reference signals multiplexed with
PDSCH per RB;
𝑁𝑎𝑛𝑡,𝐷𝐿: number of configured antenna ports;
𝑁𝑅𝐸: number of REs.
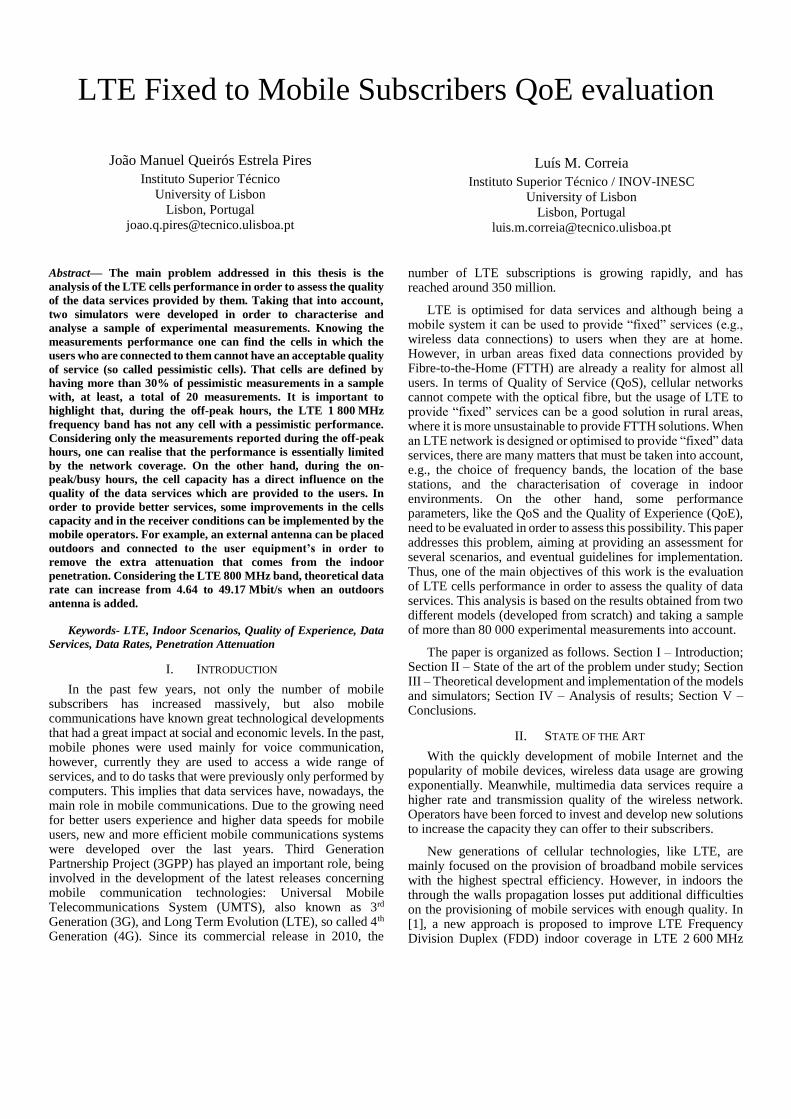
To obtain the total data rate per frame, it is necessary to multiply the results obtained in the previous equations by the number of REs. It is important to notice that, in this work, only the 10 and 20 MHz bandwidths are considered, which correspond to the LTE 800 and 1 800 MHz frequency bands (LTE800 and LTE1800), respectively. Taking that into account, a graphical representation of this relationship is presented in Figure 1. All the values used to compute the presented curves with the previous equations are detailed in [7].
Figure 1. Variation of theoretical data rates with the RSRP for both LTE800
and LTE1800.
In order to have a better comparison of the data rates
obtained from experimental measurements with their respective theoretical values, one should define a confidence interval associated to the theoretical data rates, taking a confidence level into account.
When a network is designed or optimised to provide “fixed” data services, the choice of the frequency bands to be used is one of the most important matters that must be taken into account. LTE800 is better at travelling over long distances, which means users can get the signal even when they are a long way from the site, thus this band is one of the most used for the LTE deployment. However, it has a comparatively low capacity, which means that it cannot always deal with a high number of users trying to connect at once, particularly if they are carrying out demanding services, such as streaming High Definition (HD) video. So, even in places with good radio channel conditions, LTE800 may not always deliver reliable data rates, especially in areas where there is likely to be a lot of data traffic. Thus, mobile operators can add a cell with a higher frequency band in the sites that have capacity problems. As it was already detailed, in this work only the 800 and the 1 800 MHz bands are considered, since these are the frequencies for which measurements were collected. So, only LTE1800 carriers are considered to improve the capacity of the LTE800 cells with
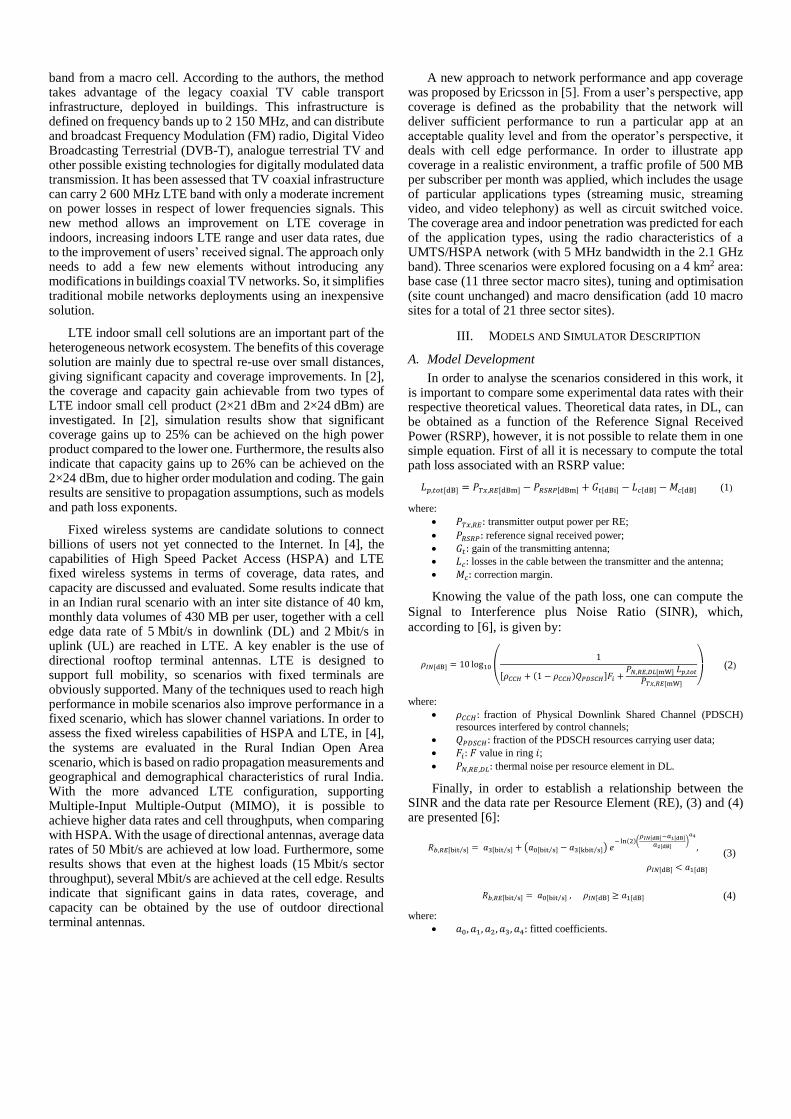
capacity issues. According to the specifications implemented in the network, when the User Equipment (UE) are in idle mode (i.e. they are not engaged in traffic) and have completed the cell selection/reselection process, they stay camped on the cell with the higher frequency band. Thus, when a new LTE1800 carrier is added to a site, it is assumed that all UEs start to be camped on this new cell. However, the cells with the lower frequency band have a higher coverage, thus, some UEs that are in the LTE800 cell edge will stay camped in that lower band cell, since they are not covered by the LTE1800 cell, as it can be seen in Figure 2.
Figure 2. UEs cell selection when a 1 800 MHz carrier is added to a site which
already has an 800 MHz cell.
In order to evaluate the capacity of the LTE frequency
bands, it is important to analyse the average number of users
who are connected to a single cell for each band. Assuming that
SINR is a non-limiting factor and that each user requires the
same throughput, one can define the average number of users
connected to a single cell by:
𝑁𝑢̅̅̅̅ = ⌊𝑅𝑏,𝑝𝑒𝑎𝑘 [Mbit/s]
𝑅𝑏 [Mbit/s]𝑢̅̅ ̅̅ ̅̅ ̅̅ ̅̅ ̅̅
⌋ (6)
where:
𝑅𝑏,𝑝𝑒𝑎𝑘: DL peak data rates;
𝑅𝑏𝑢̅̅̅̅ : average DL data rate per user.
Assuming that all users require, on average, a data rate of 5 Mbit/s, and taking the DL peak data rates specified in [7] into account, it is possible to compute the average number of users who are connected to a single cell, for different frequency bands and UEs specifications, using (6). The obtained values, for both LTE800 and LTE1800, are presented in Table I. Table I. Average number of users connected to a single cell, for both LTE800
and LTE1800, taking an average data rate per user of 5 Mbit/s into account.
UEs specifications Number of users
Modulation and Coding MIMO usage LTE800 LTE1800
QPSK 1/2
–
1 3
16-QAM 1/2 3 6
16-QAM 3/4 5 10
64-QAM 3/4 7 15
64-QAM 1/1 10 20
64-QAM 3/4 2×2 MIMO
15 30
64-QAM 1/1 20 40
64-QAM 1/1 4×4 MIMO 40 80
B. Model Implementation
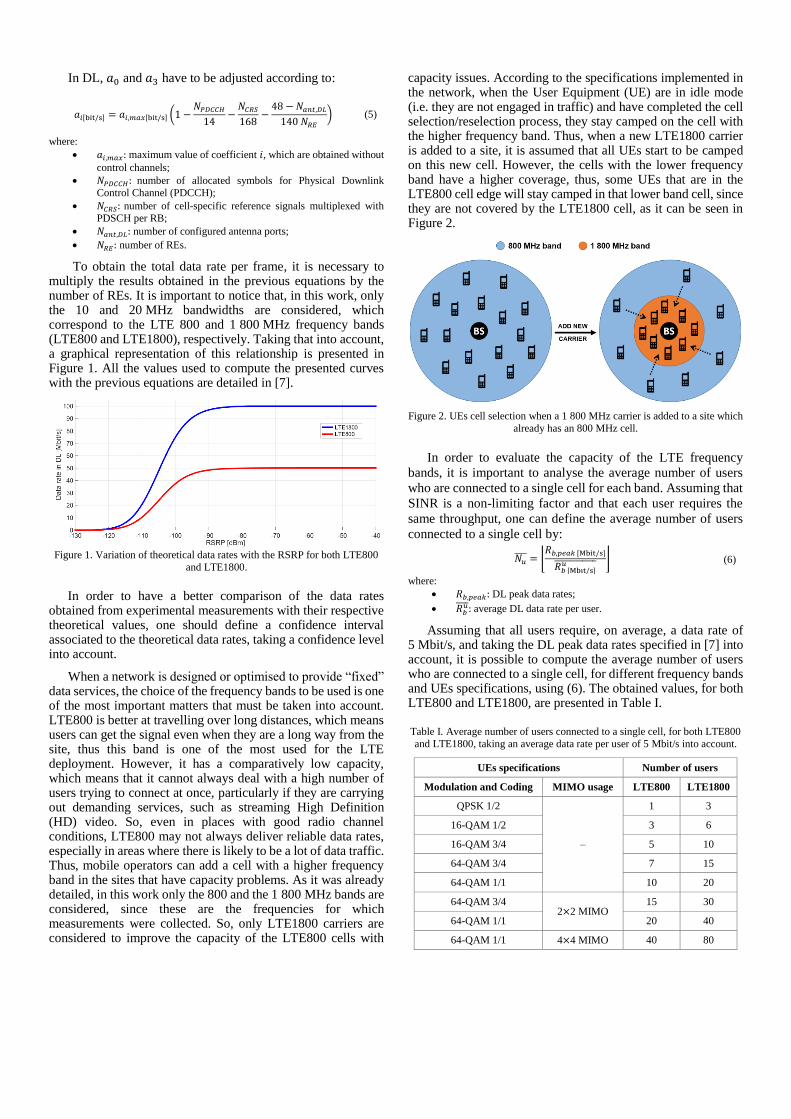
One of the main problems addressed in this work concerns the analysis of LTE cells performance, in order to assess the quality of the data services provided by those specific cells. Taking it into account, two simulators with distinct threshold approaches were developed (with the MATLAB programming language) in order to characterise some measurements collected in a real network. The first simulator uses a relative threshold approach and it is composed of some different algorithms. Its main structure is presented in Figure 3.
Figure 3. Simulator main structure for a relative threshold approach.
The only input file needed in this first simulator is an Excel
file that contains information about the sample of collected experimental measurements. Each measurement contains information about a data service provided to a specific customer. It is important to notice that a single customer can have more than one measurement, which can be reported by the UE in distinct moments. This file is the main source of data that is treated in this work and is read by the simulator using the MATLAB xlsread command, which reads the first worksheet in the Excel spreadsheet workbook and returns the data in a numeric matrix, using as argument a string with the complete file directory. This string is an input value, and is one of the most important ones, because it allows the simulator to correctly read and import the Excel file. After reading the input file and importing all of its data to a matrix, the simulator organises and selects the measurements, taking the following parameters into account: frequency band; commercial tariff plan of the measurement which defines the maximum value of data rate; and time interval in which the measurements were collected. These parameters are also input values and need to be defined by the user before running the simulator, as well as the confidence level, which will be used to compute the confidence interval. Some assessments were applied to the input parameters in order to guarantee the models’ correct implementation.
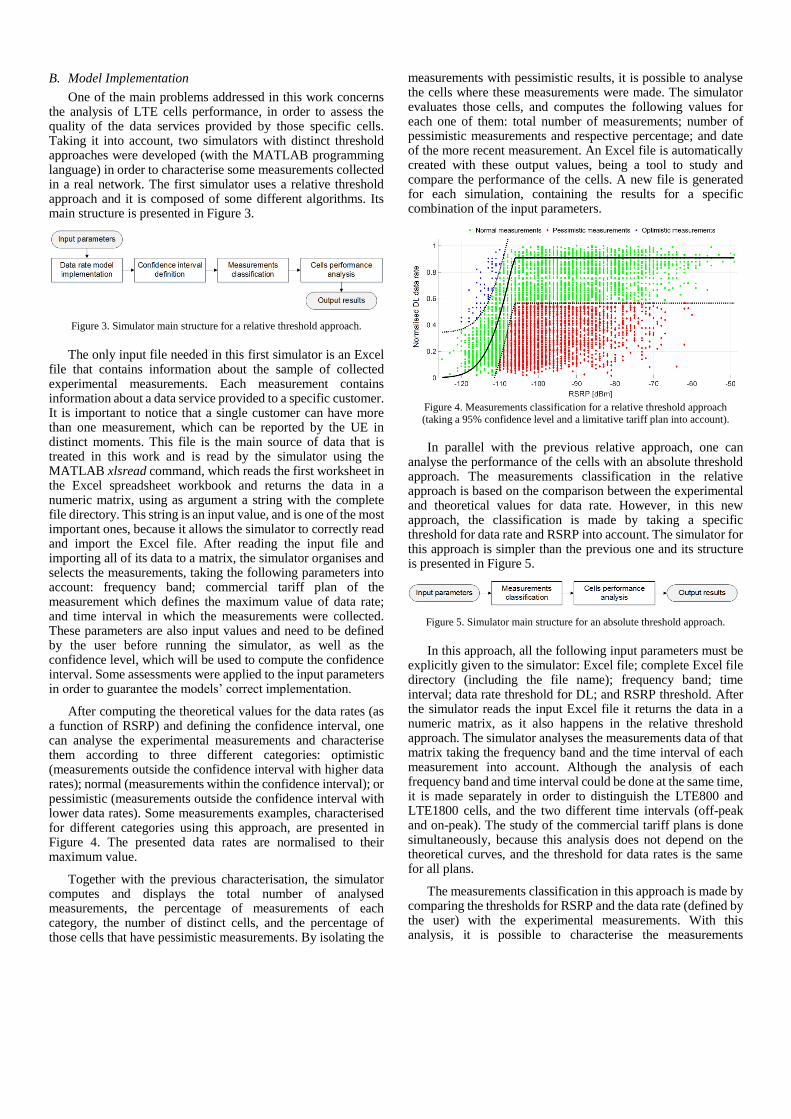
After computing the theoretical values for the data rates (as a function of RSRP) and defining the confidence interval, one can analyse the experimental measurements and characterise them according to three different categories: optimistic (measurements outside the confidence interval with higher data rates); normal (measurements within the confidence interval); or pessimistic (measurements outside the confidence interval with lower data rates). Some measurements examples, characterised for different categories using this approach, are presented in Figure 4. The presented data rates are normalised to their maximum value.
Together with the previous characterisation, the simulator computes and displays the total number of analysed measurements, the percentage of measurements of each category, the number of distinct cells, and the percentage of those cells that have pessimistic measurements. By isolating the
measurements with pessimistic results, it is possible to analyse the cells where these measurements were made. The simulator evaluates those cells, and computes the following values for each one of them: total number of measurements; number of pessimistic measurements and respective percentage; and date of the more recent measurement. An Excel file is automatically created with these output values, being a tool to study and compare the performance of the cells. A new file is generated for each simulation, containing the results for a specific combination of the input parameters.
Figure 4. Measurements classification for a relative threshold approach (taking a 95% confidence level and a limitative tariff plan into account).
In parallel with the previous relative approach, one can
analyse the performance of the cells with an absolute threshold approach. The measurements classification in the relative approach is based on the comparison between the experimental and theoretical values for data rate. However, in this new approach, the classification is made by taking a specific threshold for data rate and RSRP into account. The simulator for this approach is simpler than the previous one and its structure is presented in Figure 5.
Figure 5. Simulator main structure for an absolute threshold approach.
In this approach, all the following input parameters must be
explicitly given to the simulator: Excel file; complete Excel file directory (including the file name); frequency band; time interval; data rate threshold for DL; and RSRP threshold. After the simulator reads the input Excel file it returns the data in a numeric matrix, as it also happens in the relative threshold approach. The simulator analyses the measurements data of that matrix taking the frequency band and the time interval of each measurement into account. Although the analysis of each frequency band and time interval could be done at the same time, it is made separately in order to distinguish the LTE800 and LTE1800 cells, and the two different time intervals (off-peak and on-peak). The study of the commercial tariff plans is done simultaneously, because this analysis does not depend on the theoretical curves, and the threshold for data rates is the same for all plans.
The measurements classification in this approach is made by comparing the thresholds for RSRP and the data rate (defined by the user) with the experimental measurements. With this analysis, it is possible to characterise the measurements
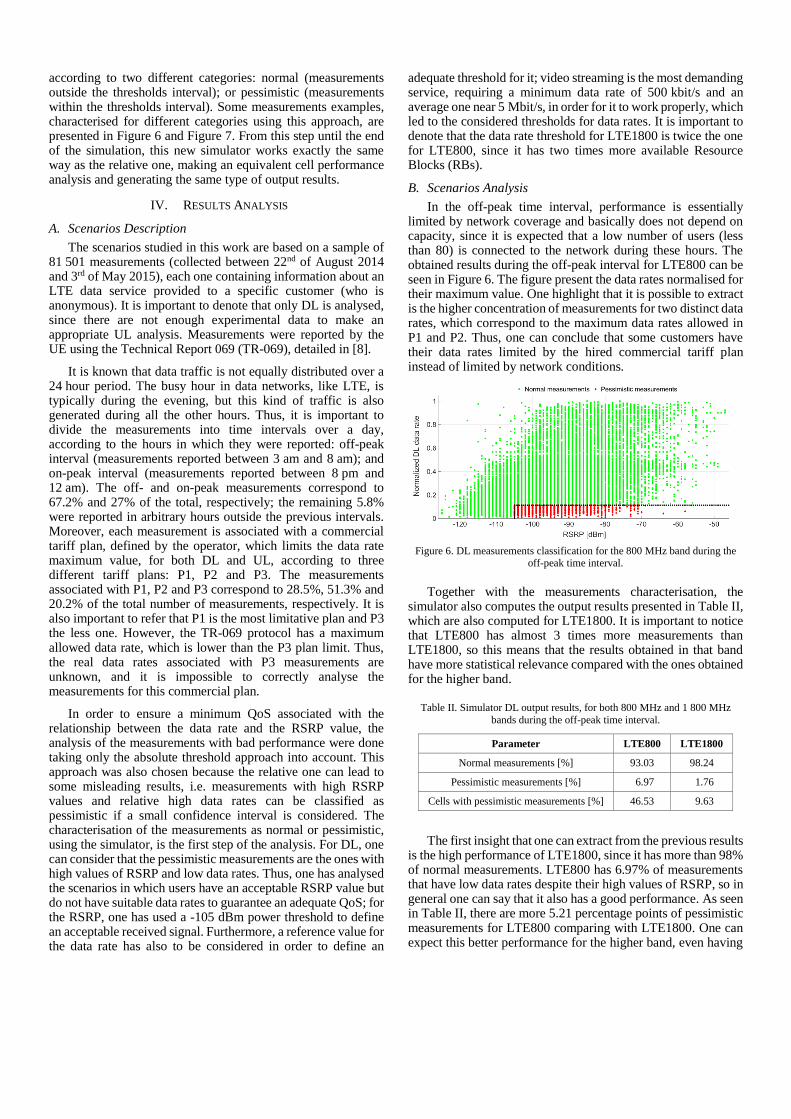
according to two different categories: normal (measurements outside the thresholds interval); or pessimistic (measurements within the thresholds interval). Some measurements examples, characterised for different categories using this approach, are presented in Figure 6 and Figure 7. From this step until the end of the simulation, this new simulator works exactly the same way as the relative one, making an equivalent cell performance analysis and generating the same type of output results.
IV. RESULTS ANALYSIS
A. Scenarios Description
The scenarios studied in this work are based on a sample of 81 501 measurements (collected between 22nd of August 2014 and 3rd of May 2015), each one containing information about an LTE data service provided to a specific customer (who is anonymous). It is important to denote that only DL is analysed, since there are not enough experimental data to make an appropriate UL analysis. Measurements were reported by the UE using the Technical Report 069 (TR-069), detailed in [8].
It is known that data traffic is not equally distributed over a 24 hour period. The busy hour in data networks, like LTE, is typically during the evening, but this kind of traffic is also generated during all the other hours. Thus, it is important to divide the measurements into time intervals over a day, according to the hours in which they were reported: off-peak interval (measurements reported between 3 am and 8 am); and on-peak interval (measurements reported between 8 pm and 12 am). The off- and on-peak measurements correspond to 67.2% and 27% of the total, respectively; the remaining 5.8% were reported in arbitrary hours outside the previous intervals. Moreover, each measurement is associated with a commercial tariff plan, defined by the operator, which limits the data rate maximum value, for both DL and UL, according to three different tariff plans: P1, P2 and P3. The measurements associated with P1, P2 and P3 correspond to 28.5%, 51.3% and 20.2% of the total number of measurements, respectively. It is also important to refer that P1 is the most limitative plan and P3 the less one. However, the TR-069 protocol has a maximum allowed data rate, which is lower than the P3 plan limit. Thus, the real data rates associated with P3 measurements are unknown, and it is impossible to correctly analyse the measurements for this commercial plan.
In order to ensure a minimum QoS associated with the relationship between the data rate and the RSRP value, the analysis of the measurements with bad performance were done taking only the absolute threshold approach into account. This approach was also chosen because the relative one can lead to some misleading results, i.e. measurements with high RSRP values and relative high data rates can be classified as pessimistic if a small confidence interval is considered. The characterisation of the measurements as normal or pessimistic, using the simulator, is the first step of the analysis. For DL, one can consider that the pessimistic measurements are the ones with high values of RSRP and low data rates. Thus, one has analysed the scenarios in which users have an acceptable RSRP value but do not have suitable data rates to guarantee an adequate QoS; for the RSRP, one has used a -105 dBm power threshold to define an acceptable received signal. Furthermore, a reference value for the data rate has also to be considered in order to define an
adequate threshold for it; video streaming is the most demanding service, requiring a minimum data rate of 500 kbit/s and an average one near 5 Mbit/s, in order for it to work properly, which led to the considered thresholds for data rates. It is important to denote that the data rate threshold for LTE1800 is twice the one for LTE800, since it has two times more available Resource Blocks (RBs).
B. Scenarios Analysis
In the off-peak time interval, performance is essentially limited by network coverage and basically does not depend on capacity, since it is expected that a low number of users (less than 80) is connected to the network during these hours. The obtained results during the off-peak interval for LTE800 can be seen in Figure 6. The figure present the data rates normalised for their maximum value. One highlight that it is possible to extract is the higher concentration of measurements for two distinct data rates, which correspond to the maximum data rates allowed in P1 and P2. Thus, one can conclude that some customers have their data rates limited by the hired commercial tariff plan instead of limited by network conditions.
Figure 6. DL measurements classification for the 800 MHz band during the
off-peak time interval.
Together with the measurements characterisation, the
simulator also computes the output results presented in Table II, which are also computed for LTE1800. It is important to notice that LTE800 has almost 3 times more measurements than LTE1800, so this means that the results obtained in that band have more statistical relevance compared with the ones obtained for the higher band.
Table II. Simulator DL output results, for both 800 MHz and 1 800 MHz
bands during the off-peak time interval.
Parameter LTE800 LTE1800
Normal measurements [%] 93.03 98.24
Pessimistic measurements [%] 6.97 1.76
Cells with pessimistic measurements [%] 46.53 9.63
The first insight that one can extract from the previous results is the high performance of LTE1800, since it has more than 98% of normal measurements. LTE800 has 6.97% of measurements that have low data rates despite their high values of RSRP, so in general one can say that it also has a good performance. As seen in Table II, there are more 5.21 percentage points of pessimistic measurements for LTE800 comparing with LTE1800. One can expect this better performance for the higher band, even having
a more demanding threshold for data rate, because LTE1800 can achieve higher data rates, comparing to LTE800, since it has twice the bandwidth and correspondingly twice the number of RBs. In terms of cells, LTE1800 has only 9.63% of cells with at least one pessimistic measurement against 46.53% for LTE800.
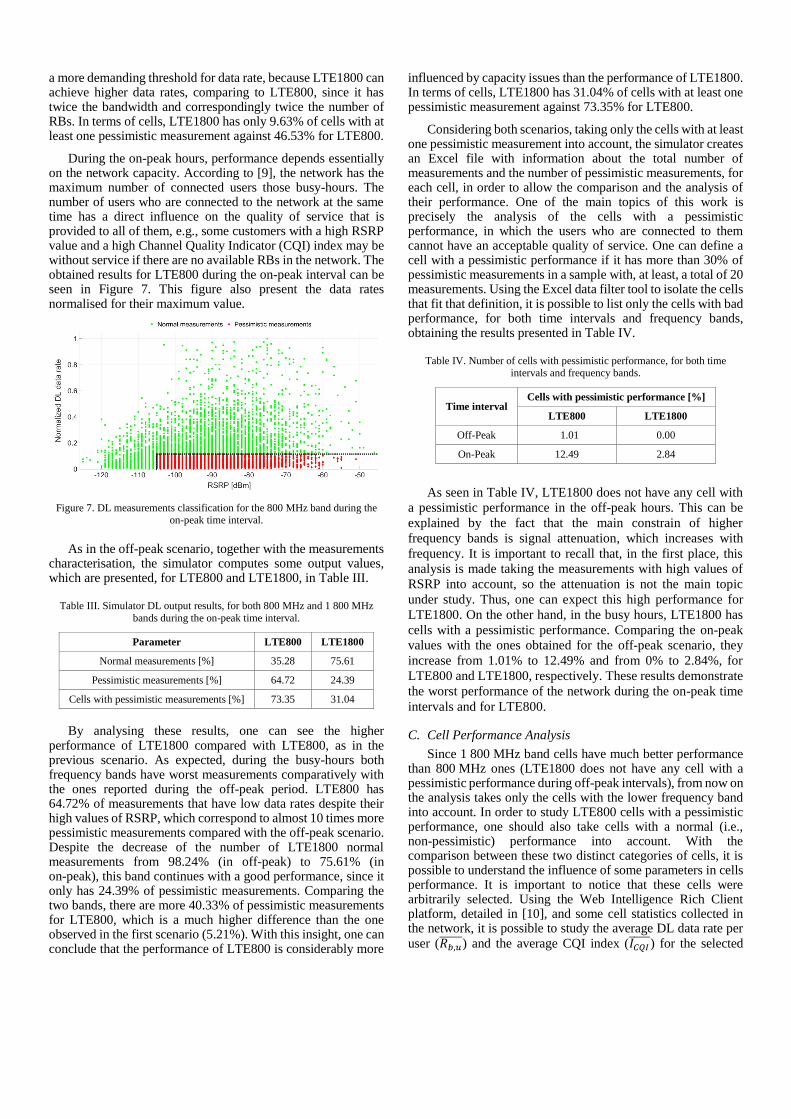
During the on-peak hours, performance depends essentially on the network capacity. According to [9], the network has the maximum number of connected users those busy-hours. The number of users who are connected to the network at the same time has a direct influence on the quality of service that is provided to all of them, e.g., some customers with a high RSRP value and a high Channel Quality Indicator (CQI) index may be without service if there are no available RBs in the network. The obtained results for LTE800 during the on-peak interval can be seen in Figure 7. This figure also present the data rates normalised for their maximum value.
Figure 7. DL measurements classification for the 800 MHz band during the on-peak time interval.
As in the off-peak scenario, together with the measurements
characterisation, the simulator computes some output values, which are presented, for LTE800 and LTE1800, in Table III.
Table III. Simulator DL output results, for both 800 MHz and 1 800 MHz
bands during the on-peak time interval.
Parameter LTE800 LTE1800
Normal measurements [%] 35.28 75.61
Pessimistic measurements [%] 64.72 24.39
Cells with pessimistic measurements [%] 73.35 31.04
By analysing these results, one can see the higher
performance of LTE1800 compared with LTE800, as in the previous scenario. As expected, during the busy-hours both frequency bands have worst measurements comparatively with the ones reported during the off-peak period. LTE800 has 64.72% of measurements that have low data rates despite their high values of RSRP, which correspond to almost 10 times more pessimistic measurements compared with the off-peak scenario. Despite the decrease of the number of LTE1800 normal measurements from 98.24% (in off-peak) to 75.61% (in on-peak), this band continues with a good performance, since it only has 24.39% of pessimistic measurements. Comparing the two bands, there are more 40.33% of pessimistic measurements for LTE800, which is a much higher difference than the one observed in the first scenario (5.21%). With this insight, one can conclude that the performance of LTE800 is considerably more
influenced by capacity issues than the performance of LTE1800. In terms of cells, LTE1800 has 31.04% of cells with at least one pessimistic measurement against 73.35% for LTE800.
Considering both scenarios, taking only the cells with at least one pessimistic measurement into account, the simulator creates an Excel file with information about the total number of measurements and the number of pessimistic measurements, for each cell, in order to allow the comparison and the analysis of their performance. One of the main topics of this work is precisely the analysis of the cells with a pessimistic performance, in which the users who are connected to them cannot have an acceptable quality of service. One can define a cell with a pessimistic performance if it has more than 30% of pessimistic measurements in a sample with, at least, a total of 20 measurements. Using the Excel data filter tool to isolate the cells that fit that definition, it is possible to list only the cells with bad performance, for both time intervals and frequency bands, obtaining the results presented in Table IV.
Table IV. Number of cells with pessimistic performance, for both time intervals and frequency bands.
Time interval Cells with pessimistic performance [%]
LTE800 LTE1800
Off-Peak 1.01 0.00
On-Peak 12.49 2.84
As seen in Table IV, LTE1800 does not have any cell with
a pessimistic performance in the off-peak hours. This can be
explained by the fact that the main constrain of higher
frequency bands is signal attenuation, which increases with
frequency. It is important to recall that, in the first place, this
analysis is made taking the measurements with high values of
RSRP into account, so the attenuation is not the main topic
under study. Thus, one can expect this high performance for
LTE1800. On the other hand, in the busy hours, LTE1800 has
cells with a pessimistic performance. Comparing the on-peak
values with the ones obtained for the off-peak scenario, they
increase from 1.01% to 12.49% and from 0% to 2.84%, for
LTE800 and LTE1800, respectively. These results demonstrate
the worst performance of the network during the on-peak time
intervals and for LTE800.
C. Cell Performance Analysis
Since 1 800 MHz band cells have much better performance than 800 MHz ones (LTE1800 does not have any cell with a pessimistic performance during off-peak intervals), from now on the analysis takes only the cells with the lower frequency band into account. In order to study LTE800 cells with a pessimistic performance, one should also take cells with a normal (i.e., non-pessimistic) performance into account. With the comparison between these two distinct categories of cells, it is possible to understand the influence of some parameters in cells performance. It is important to notice that these cells were arbitrarily selected. Using the Web Intelligence Rich Client platform, detailed in [10], and some cell statistics collected in the network, it is possible to study the average DL data rate per
user (𝑅𝑏,𝑢̅̅ ̅̅ ̅) and the average CQI index (𝐼𝐶𝑄𝐼̅̅ ̅̅ ̅) for the selected
cells. The 𝑅𝑏,𝑢̅̅ ̅̅ ̅ and 𝐼𝐶𝑄𝐼̅̅ ̅̅ ̅ parameters are obtained by using (7), in
which their values correspond to the average of all measurements made during a ∆𝑡 time interval and the average of all measurements made by each of the users connected to the cell under analysis:
𝑝∆𝑡,𝑢̅̅ ̅̅ ̅̅ =1
𝑁𝑢𝑁∆𝑡∑ ∑ 𝑝(𝑡𝑛 , 𝑢𝑚)
𝑁∆𝑡
𝑛=1
𝑁𝑢
𝑚=1 (7)
where:
𝑁𝑢: total number of users connected to a single cell;
𝑝(𝑡𝑛 , 𝑢𝑚): 𝑝 parameter of the 𝑚𝑡ℎ user (𝑢𝑚) in the 𝑛𝑡ℎ time instant
(𝑡𝑛).
The ∆𝑡 time interval used to compute the parameters average corresponds to 1 hour, so 𝑁∆𝑡 = 3.6 × 10
6 , since a new measurement is performed every millisecond.
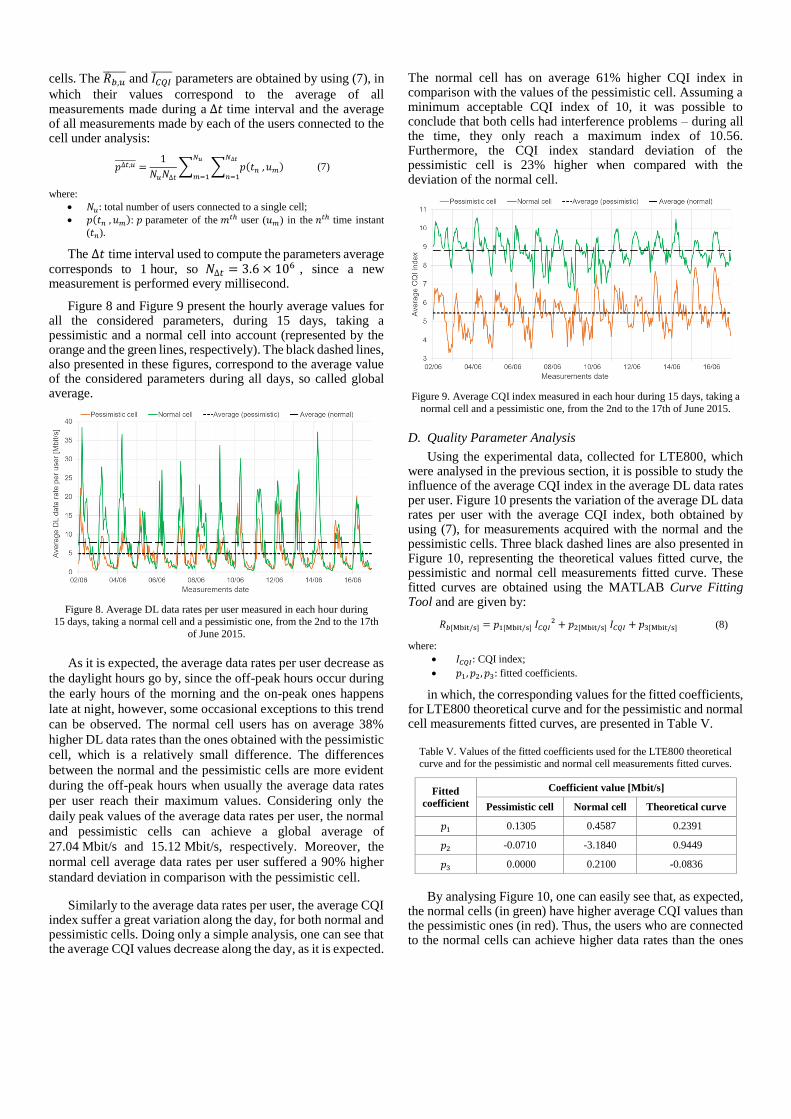
Figure 8 and Figure 9 present the hourly average values for all the considered parameters, during 15 days, taking a pessimistic and a normal cell into account (represented by the orange and the green lines, respectively). The black dashed lines, also presented in these figures, correspond to the average value of the considered parameters during all days, so called global average.
Figure 8. Average DL data rates per user measured in each hour during 15 days, taking a normal cell and a pessimistic one, from the 2nd to the 17th
of June 2015.
As it is expected, the average data rates per user decrease as
the daylight hours go by, since the off-peak hours occur during
the early hours of the morning and the on-peak ones happens
late at night, however, some occasional exceptions to this trend
can be observed. The normal cell users has on average 38%
higher DL data rates than the ones obtained with the pessimistic
cell, which is a relatively small difference. The differences
between the normal and the pessimistic cells are more evident
during the off-peak hours when usually the average data rates
per user reach their maximum values. Considering only the
daily peak values of the average data rates per user, the normal
and pessimistic cells can achieve a global average of
27.04 Mbit/s and 15.12 Mbit/s, respectively. Moreover, the
normal cell average data rates per user suffered a 90% higher
standard deviation in comparison with the pessimistic cell.
Similarly to the average data rates per user, the average CQI index suffer a great variation along the day, for both normal and pessimistic cells. Doing only a simple analysis, one can see that the average CQI values decrease along the day, as it is expected.
The normal cell has on average 61% higher CQI index in comparison with the values of the pessimistic cell. Assuming a minimum acceptable CQI index of 10, it was possible to conclude that both cells had interference problems – during all the time, they only reach a maximum index of 10.56. Furthermore, the CQI index standard deviation of the pessimistic cell is 23% higher when compared with the deviation of the normal cell.
Figure 9. Average CQI index measured in each hour during 15 days, taking a
normal cell and a pessimistic one, from the 2nd to the 17th of June 2015.
D. Quality Parameter Analysis
Using the experimental data, collected for LTE800, which were analysed in the previous section, it is possible to study the influence of the average CQI index in the average DL data rates per user. Figure 10 presents the variation of the average DL data rates per user with the average CQI index, both obtained by using (7), for measurements acquired with the normal and the pessimistic cells. Three black dashed lines are also presented in Figure 10, representing the theoretical values fitted curve, the pessimistic and normal cell measurements fitted curve. These fitted curves are obtained using the MATLAB Curve Fitting Tool and are given by:
𝑅𝑏[Mbit/s] = 𝑝1[Mbit/s] 𝐼𝐶𝑄𝐼2 + 𝑝2[Mbit/s] 𝐼𝐶𝑄𝐼 + 𝑝3[Mbit/s] (8)
where:
𝐼𝐶𝑄𝐼: CQI index;
𝑝1, 𝑝2, 𝑝3: fitted coefficients.
in which, the corresponding values for the fitted coefficients, for LTE800 theoretical curve and for the pessimistic and normal cell measurements fitted curves, are presented in Table V.
Table V. Values of the fitted coefficients used for the LTE800 theoretical
curve and for the pessimistic and normal cell measurements fitted curves.
Fitted
coefficient
Coefficient value [Mbit/s]
Pessimistic cell Normal cell Theoretical curve
𝑝1 0.1305 0.4587 0.2391
𝑝2 -0.0710 -3.1840 0.9449
𝑝3 0.0000 0.2100 -0.0836
By analysing Figure 10, one can easily see that, as expected,
the normal cells (in green) have higher average CQI values than the pessimistic ones (in red). Thus, the users who are connected to the normal cells can achieve higher data rates than the ones
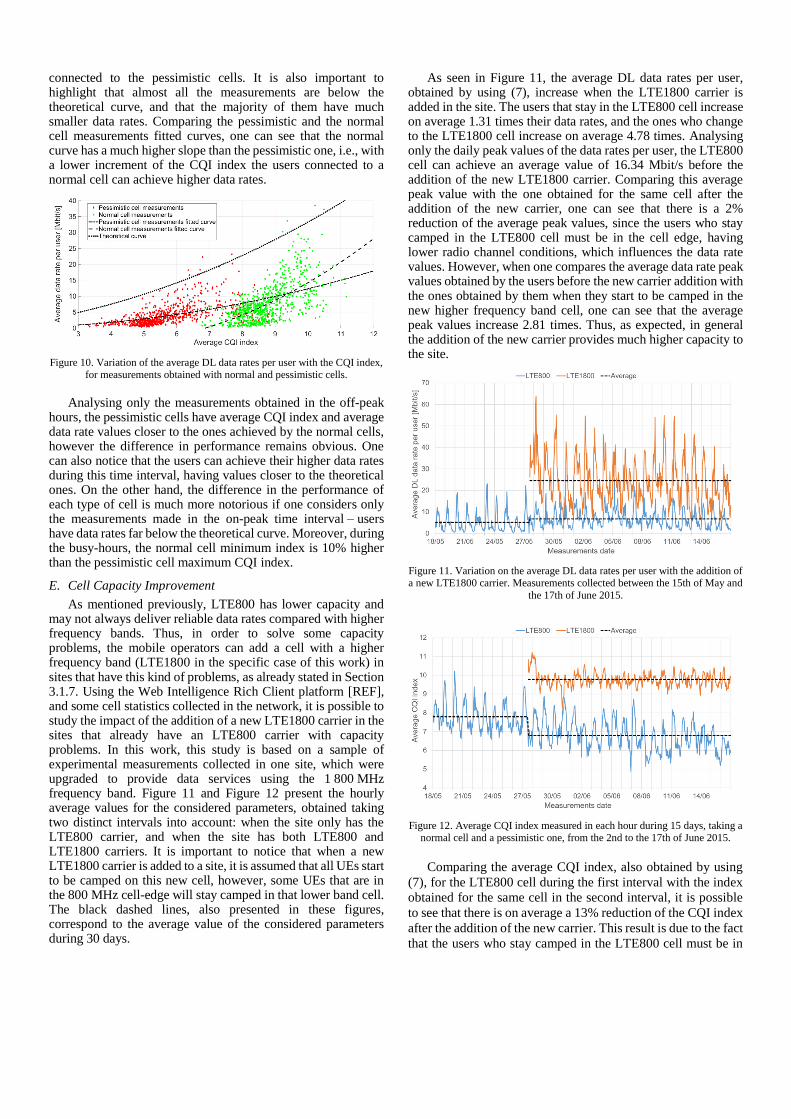
connected to the pessimistic cells. It is also important to highlight that almost all the measurements are below the theoretical curve, and that the majority of them have much smaller data rates. Comparing the pessimistic and the normal cell measurements fitted curves, one can see that the normal curve has a much higher slope than the pessimistic one, i.e., with a lower increment of the CQI index the users connected to a normal cell can achieve higher data rates.
Figure 10. Variation of the average DL data rates per user with the CQI index, for measurements obtained with normal and pessimistic cells.
Analysing only the measurements obtained in the off-peak
hours, the pessimistic cells have average CQI index and average data rate values closer to the ones achieved by the normal cells, however the difference in performance remains obvious. One can also notice that the users can achieve their higher data rates during this time interval, having values closer to the theoretical ones. On the other hand, the difference in the performance of each type of cell is much more notorious if one considers only the measurements made in the on-peak time interval – users have data rates far below the theoretical curve. Moreover, during the busy-hours, the normal cell minimum index is 10% higher than the pessimistic cell maximum CQI index.
E. Cell Capacity Improvement
As mentioned previously, LTE800 has lower capacity and may not always deliver reliable data rates compared with higher frequency bands. Thus, in order to solve some capacity problems, the mobile operators can add a cell with a higher frequency band (LTE1800 in the specific case of this work) in sites that have this kind of problems, as already stated in Section 3.1.7. Using the Web Intelligence Rich Client platform [REF], and some cell statistics collected in the network, it is possible to study the impact of the addition of a new LTE1800 carrier in the sites that already have an LTE800 carrier with capacity problems. In this work, this study is based on a sample of experimental measurements collected in one site, which were upgraded to provide data services using the 1 800 MHz frequency band. Figure 11 and Figure 12 present the hourly average values for the considered parameters, obtained taking two distinct intervals into account: when the site only has the LTE800 carrier, and when the site has both LTE800 and LTE1800 carriers. It is important to notice that when a new LTE1800 carrier is added to a site, it is assumed that all UEs start to be camped on this new cell, however, some UEs that are in the 800 MHz cell-edge will stay camped in that lower band cell. The black dashed lines, also presented in these figures, correspond to the average value of the considered parameters during 30 days.
As seen in Figure 11, the average DL data rates per user, obtained by using (7), increase when the LTE1800 carrier is added in the site. The users that stay in the LTE800 cell increase on average 1.31 times their data rates, and the ones who change to the LTE1800 cell increase on average 4.78 times. Analysing only the daily peak values of the data rates per user, the LTE800 cell can achieve an average value of 16.34 Mbit/s before the addition of the new LTE1800 carrier. Comparing this average peak value with the one obtained for the same cell after the addition of the new carrier, one can see that there is a 2% reduction of the average peak values, since the users who stay camped in the LTE800 cell must be in the cell edge, having lower radio channel conditions, which influences the data rate values. However, when one compares the average data rate peak values obtained by the users before the new carrier addition with the ones obtained by them when they start to be camped in the new higher frequency band cell, one can see that the average peak values increase 2.81 times. Thus, as expected, in general the addition of the new carrier provides much higher capacity to the site.
Figure 11. Variation on the average DL data rates per user with the addition of a new LTE1800 carrier. Measurements collected between the 15th of May and
the 17th of June 2015.
Figure 12. Average CQI index measured in each hour during 15 days, taking a normal cell and a pessimistic one, from the 2nd to the 17th of June 2015.
Comparing the average CQI index, also obtained by using
(7), for the LTE800 cell during the first interval with the index
obtained for the same cell in the second interval, it is possible
to see that there is on average a 13% reduction of the CQI index
after the addition of the new carrier. This result is due to the fact
that the users who stay camped in the LTE800 cell must be in
the cell-edge, having lower radio channel conditions, which
decreases the average CQI index. On the other hand, the users
who change from LTE800 to LTE1800 cell increase their index
25% on average. Thus, a user who is in the LTE1800 cell has
on average a CQI index 44% higher than a user who is in
LTE800 after the addition of the new carrier. Continuing to
assume that 10 is the minimum acceptable CQI index, since it
is the first index that allows 6 bits per symbol Quadrature
Amplitude Modulation (64-QAM), one can notice that this site
has some interference problems, for both LTE800 and
LTE1800 cells. Only during some hours the CQI index is higher
than 10 in the LTE1800 cell. The addition of the new carrier
does not solve the interference problems, so in order to solve
that problems a network coverage optimisation must be made
by the operator.
F. Receiver Conditions Improvement
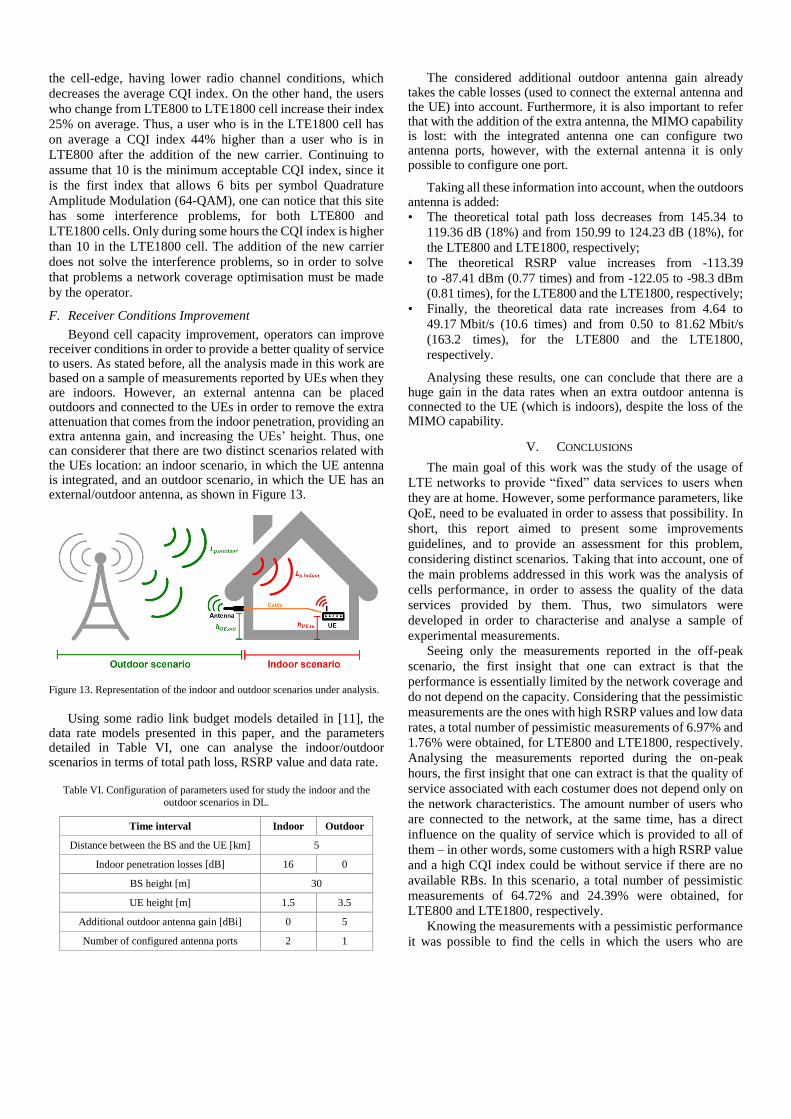
Beyond cell capacity improvement, operators can improve receiver conditions in order to provide a better quality of service to users. As stated before, all the analysis made in this work are based on a sample of measurements reported by UEs when they are indoors. However, an external antenna can be placed outdoors and connected to the UEs in order to remove the extra attenuation that comes from the indoor penetration, providing an extra antenna gain, and increasing the UEs’ height. Thus, one can considerer that there are two distinct scenarios related with the UEs location: an indoor scenario, in which the UE antenna is integrated, and an outdoor scenario, in which the UE has an external/outdoor antenna, as shown in Figure 13.
Figure 13. Representation of the indoor and outdoor scenarios under analysis.
Using some radio link budget models detailed in [11], the
data rate models presented in this paper, and the parameters detailed in Table VI, one can analyse the indoor/outdoor scenarios in terms of total path loss, RSRP value and data rate.
Table VI. Configuration of parameters used for study the indoor and the
outdoor scenarios in DL.
Time interval Indoor Outdoor
Distance between the BS and the UE [km] 5
Indoor penetration losses [dB] 16 0
BS height [m] 30
UE height [m] 1.5 3.5
Additional outdoor antenna gain [dBi] 0 5
Number of configured antenna ports 2 1
The considered additional outdoor antenna gain already takes the cable losses (used to connect the external antenna and the UE) into account. Furthermore, it is also important to refer that with the addition of the extra antenna, the MIMO capability is lost: with the integrated antenna one can configure two antenna ports, however, with the external antenna it is only possible to configure one port.
Taking all these information into account, when the outdoors antenna is added: • The theoretical total path loss decreases from 145.34 to
119.36 dB (18%) and from 150.99 to 124.23 dB (18%), for
the LTE800 and LTE1800, respectively;
• The theoretical RSRP value increases from -113.39
to -87.41 dBm (0.77 times) and from -122.05 to -98.3 dBm
(0.81 times), for the LTE800 and the LTE1800, respectively;
• Finally, the theoretical data rate increases from 4.64 to
49.17 Mbit/s (10.6 times) and from 0.50 to 81.62 Mbit/s
(163.2 times), for the LTE800 and the LTE1800,
respectively.
Analysing these results, one can conclude that there are a huge gain in the data rates when an extra outdoor antenna is connected to the UE (which is indoors), despite the loss of the MIMO capability.
V. CONCLUSIONS
The main goal of this work was the study of the usage of
LTE networks to provide “fixed” data services to users when
they are at home. However, some performance parameters, like
QoE, need to be evaluated in order to assess that possibility. In
short, this report aimed to present some improvements
guidelines, and to provide an assessment for this problem,
considering distinct scenarios. Taking that into account, one of
the main problems addressed in this work was the analysis of
cells performance, in order to assess the quality of the data
services provided by them. Thus, two simulators were
developed in order to characterise and analyse a sample of
experimental measurements.
Seeing only the measurements reported in the off-peak
scenario, the first insight that one can extract is that the
performance is essentially limited by the network coverage and
do not depend on the capacity. Considering that the pessimistic
measurements are the ones with high RSRP values and low data
rates, a total number of pessimistic measurements of 6.97% and
1.76% were obtained, for LTE800 and LTE1800, respectively.
Analysing the measurements reported during the on-peak
hours, the first insight that one can extract is that the quality of
service associated with each costumer does not depend only on
the network characteristics. The amount number of users who
are connected to the network, at the same time, has a direct
influence on the quality of service which is provided to all of
them – in other words, some customers with a high RSRP value
and a high CQI index could be without service if there are no
available RBs. In this scenario, a total number of pessimistic
measurements of 64.72% and 24.39% were obtained, for
LTE800 and LTE1800, respectively.
Knowing the measurements with a pessimistic performance
it was possible to find the cells in which the users who are
connected to them cannot have an acceptable quality of service
(so called pessimistic cells). That cells were defined by having
more than 30% of pessimistic measurements in a sample with,
at least, a total of 20 measurements. LTE1800 does not have
any cell with a pessimistic performance in the off-peak hours.
Comparing the on-peak values with the ones obtained for the
off-peak scenario, they increase from 1.01% to 12.49% and
from 0% to 2.84%, for LTE800 and LTE1800, respectively.
These results demonstrate the worst performance of the
network during the on-peak time intervals and for LTE800.
Since the 1 800 MHz frequency band cells had a much
better performance than the 800 MHz ones, a more specific
analysis was made taking only the cells with the lower
frequency band into account. Thus, in order to study the
LTE800 cells with a pessimistic performance a comparison
between some of that cells and some cells with a normal
performance were made.
Using some cell statistics collected in the network, it was
possible to study the average DL data rate per user and the
average CQI index for the (arbitrarily) selected cells. As it is
expected, the average data rates per user decrease as the
daylight hours go by, since the off-peak hours occur during the
early hours of the morning and the on-peak ones happens late
at night, however, some occasional exceptions to this trend can
be observed. The normal cell users has on average 38% higher
DL data rates than the ones obtained with the pessimistic cell,
which is a relatively small difference. Considering only the
daily peak values of the average data rates per user, the normal
and pessimistic cells can achieve a global average of
27.04 Mbit/s and 15.12 Mbit/s, respectively.
Similarly to the average data rates per user, the average CQI
index suffer a great variation along the day, for both normal and
pessimistic cells. Doing only a simple analysis, one can see that
the average CQI values decrease along the day, as it is expected.
The normal cell has on average 61% higher CQI index in
comparison with the values of the pessimistic cell. Assuming a
minimum acceptable CQI index of 10, it was possible to
conclude that both cells had interference problems – during all
the time, they only reach a maximum index of 10.56.
Using the experimental data collected for LTE800, which
were already analysed, it was possible to study the influence of
the average CQI index in the average DL data rates per user. As
expected, the normal cells presented higher average CQI values
than the pessimistic ones. Thus, the users who were connected
to the normal cells could achieve higher data rates than the ones
connected to the pessimistic cells. It is also important to
highlight that all the measurements were below the theoretical
curve, and that the majority of them had much smaller data
rates.
LTE800 has lower capacity and may not always deliver
reliable data rates when compared with higher frequency bands.
Thus, in order to solve some capacity problems, the mobile
operators can add a cell with a higher frequency band in sites
which have this kind of problems. Using some cell statistics
collected in the network, it was possible to study the impact of
the addition of a new LTE1800 carrier in sites which had an
LTE800 carrier with capacity issues. The users that stayed in
the LTE800 cell increased on average 1.31 times their data
rates, and the ones who changed for the LTE1800 cell increased
on average 4.78 times. Analysing the average CQI index for the
LTE800 cell before and comparing it with the index obtained
for the same cell after the addition of the new carrier, there were
on average a 13% reduction of the CQI index. On the other
hand, the users who changed from the LTE800 to the LTE1800
cell increased their index on average 25%.
Beyond the cell capacity improvement, the network
operators can improve the receiver conditions in order to
provide a better quality of service to the users. For example, an
external antenna can be placed outdoors and connected to the
UEs in order to remove the extra attenuation that comes from
the indoor penetration, providing an extra antenna gain, and
increasing the UEs’ height. When the outdoors antenna is added
the theoretical data rates can increases from 4.64 to
49.17 Mbit/s (10.6 times) and from 0.50 to 81.62 Mbit/s (163.2
times), for the LTE800 and the LTE1800, respectively.
ACKNOWLEDGMENT
Special acknowledgements are given to my thesis supervisor, Prof. Luís M. Correia, and to Eng. Luís Santo and Eng. Henrique Ribeiro, who followed this work from NOS’ point of view. They always helped me with their prised advices and support, helping me to improve the quality of my work.
REFERENCES
[1] Gandarillas,C., Iglesias,V., Aparicio,M., Olmos,P. and Mino-Díaz,E., “A New Approach for Improving Indoor LTE Coverage”, in Proc. of. IEEE Broadband Wireless Access Workshop, Madrid, Spain, Dec. 2011.
[2] Salami,G., Burley,S., Durowoju,O. and Kellett,C., “LTE indoor small cell capacity and coverage comparison”, in Proc. of PIMRC’2013 - IEEE 24th International Symposium on Personal, Indoor and Mobile Radio Communications, London, United Kingdom, Sep. 2013.
[3] Wang,L. and Li,F, “MIMO DAS Solutions in LTE Indoor System”, in Proc. of DASC’2013 – IEEE 11th International Conference Dependable, Autonomic and Secure Computing, Beijing, China, Dec. 2013.
[4] Furuskar,A., Jing Rao, Blomgren,M. and Skillermark,P., “LTE and HSPA for fixed wireless broadband: Data rates, coverage, and capacity in an Indian rural scenario”, in Proc. of Wireless VITAE’2011 - 2nd International Conference on Wireless Communication, Vehicular Technology, Information Theory and Aerospace & Electronic Systems Technology, Stockholm, Sweden, Mar. 2011.
[5] Ericsson, Ericsson Mobility Report, Stockholm, Sweden, Nov. 2013 (http://www.ericsson.com/res/docs/2013/ericsson-mobility-report-nove mber-2013.pdf).
[6] Ericsson, Coverage and Capacity Dimensioning – Recommendation, Stockholm, Sweden, Jan. 2013.
[7] Pires,J., LTE Fixed to Mobile Subscribers QoE evaluation, M.Sc. Thesis, Instituto Superior Técnico, Lisbon, Portugal, Oct. 2015.
[8] DSL Home – Technical Working Group, CPE WAN Management Protocol (TR-069), May 2004 (https://www.broadband-forum.org/ technical/download/TR-069.pdf).
[9] Nokia, Mobile broadband with HSPA and LTE – capacity and cost aspects, Finland, Jun. 2014.
[10] Business Objects, Web Intelligence Rich Client User's Guide, Mar. 2008 (http://bi.system.tamus.edu/Docs/xi3-1_web_intelligence_rich_client_en .pdf).
[11] Correia,L.M., Mobile Communications Systems – Lecture Notes, Instituto Superior Técnico, Lisbon, Portugal, Feb. 2013.