lulu - shouyang.spaceshouyang.space/docs/workdocs/s.zhou equity research... · lulu ompany analysis...
TRANSCRIPT

1
Lululemon Athletica Inc. Target Price: $74.93 USD Fair Price: $59.07 USD ( Low Est. ) Shouyang Zhou
LULU Friday, July 24, 2015 Company Analysis Report
Our View—
We rate Lululemon Athletica as a buy
based upon growth potential in the ath-
letic apparel industry. Strong consumer
trends in the area of health and fitness
advance the industry of which is further
augmented by Lululemon’s existing posi-
tion in North American markets as a
premium brand following strong expan-
sion possibilities in Europe and into Asia.
We base our opinion upon demonstrated
management capacities in other ven-
tures, and our view on existing regional
market conditions and consumer prefer-
ences. Risks factored into our decision is
the competitive nature of the fitness
apparel industry, the low barriers to
industry, and the relatively new nature
of the company.
Key Points
The growth in demand for health, fitness, and exercise, in our view, are strong up-
ward trends which will propel further revenues. The emerging importance of mil-
lennials and aging baby boomers contribute to a growing concern regarding the
longevity of individuals. This in addition the growth in health care costs and the rise
of the athleisure style brings in considerable potential for growth.
Lululemon’s position in brand image and strategy for marketing its products take
upon a differentiated style that connects to better target and engage its audience
leading in turn to charging as a premium brand. Given Lululemon’s strong technical
and appealing products within yoga, Lululemon maintains a strong presence within
the activity and associated lifestyles. It is able to further leverage this position in
targeting similar associated “lifestyle activities” such as running.
To further augment its brand image, the use of grassroots marketing efforts take
form in a fashion many of its major competitors neglect. The use of genuine social
media involvement, and community building through blogs and events, in addition
to in-store hosted services/ programs appeal strongly to core fitness enthusiasts
largely aging from 18-30.
Strong management and, in our view, strong expansion environments in line with
current plans offer good long term prospects. Lululemon plans to expand its cur-
rent operations from North American and Australian markets into Europe, Asia,
and the Middle East. Currently “testing the waters” through expansion in heavy
traffic areas such as Hong Kong, the use of temporary retail locations and adequate
but lackluster e-commerce options serve as a cautious step forward.
The addition of notable senior management from global enterprises such as Toms
shoes, Dell, and Apple offer experience in global expansion, e-commerce, and con-
nection to a broader, yet similar “hip” audience.
The significance of brand equity and regularly occurring controversy behind the
brand pose undue risks moving further. In the 2013, stretching of Lululemon’s luon
fabric had shown to be have less than modest defects resulting in a product recall.
Following, defensive remarks by company founder Chip Wilson aggravated the
issue by inciting select members of the audience. In recent times another recall
was announced on safety matters though deemed minor by company officials.
Major Competitors are starting to react and engage audiences in similar fashion to
Lululemon. Nike, a major competitor in the eyes of Lululemon, has started to offer
similar product offerings and started in-store activities in select openings. Given
the low barriers to entry, a major competitor with global logistical capacities pre-
sent a challenge.
<BUY>
NASDAQ: LULU; USD 62.86
Mean : 69.29
n = 31
Median : 73.00
Key Statistics
Shares (000’s) 143,935
Market Cap (000’s) 8,923,970
Dividend: 0.00
P/E 33.62
Average Volume (000’s) 2,003
Analyst Estimates
(000’s) 2014 2015F 2016F 2017F 2018F 2019F
Revenue 1,797,213 2,039,837 2,315,215 2,627,769 2,982,517 3,385,157
Revenue
Growth
12.95% 13.500% 13.500% 13.500% 13.500% 13.500%
Gross
Margin
49.13% 49.63% 50.08% 50.47% 50.81% 50.23%
EBIT
margin
20.92% 20.42% 19.98% 19.59% 19.24% 19.83%
EPS 1.66 2.23 2.43 2.67 2.94 3.42
Disclosure:
Any statements that we make, other than historical facts, contain for-
ward-looking information based on our business assessment and as-
sumptions at the time of disclosure. Such forward-looking information
includes, but is not limited to expected growth strategies, projected
operating results, anticipated timing for developments. Our business, as
well as each product we analyze and market, is subject to various risks
and uncertainties beyond our control. Risks and uncertainties that could
affect the Company's future results and financial condition include, but
are not limited to, the factors described after. Information disclosed is
subject to addition, change or deletion without notice. The trading of
stocks, futures, commodities, index futures or any other securities has
potential rewards, and it also has potential risks involved. Trading may
not be suitable for all users. Anyone wishing to invest should seek his or
her own independent financial or professional advice. YOU SHOULD NOT
MAKE ANY DECISION, FINANCIAL, INVESTMENTS, TRADING OR OTHER-
WISE, BASED ON ANY OF THE INFORMATION PRESENTED ON HERE
WITHOUT UNDERTAKING INDEPENDENT DUE DILIGENCE AND CONSUL-
TATION WITH A PROFESSIONAL BROKER OR COMPETENT FINANCIAL
ADVISOR. You understand that you are using any and all information
available here on YOUR OWN RISK.
$62.86 $74.93 Low Target
42.00
High Target
85.00

2
Company Description and Highlights
Company Description
Lululemon offers a variety of fitness apparel marketed under the ath-
leisure lifestyle. The corporation offers a variety of different apparel
and accessories to the general public in addition to targeted groups
under athletic pursuits such as yoga, running, and dance-inspired activi-
ties. The group markets with emphasis towards women and female
youth, however are in the process of diversifying to men’s athletic ap-
parel and children’s apparel. Their product line focuses upon technical
and practical improvements with emphasis on fabric design.
They believe their market segment to be driven by the focus on longevi-
ty by aging Baby Boomers and Millennials. Products are largely sold
through corporate-owned stores though e-commerce by direct to con-
sumer channels are also present and growing. As of February 1st, 2015
Lululemon operates in total 302 retail stores, of which 211 reside
within the United States and 57 reside within Canada. The group
had opened 48 stores during fiscal 2014 and plans to expand largely
into Non-North American markets.
News & Event Highlights
Jul 25, 2015— Lululemon branded beer announced
Lululemon announced through social media a limited run of 88,000
cans of “Curiosity Lager” in partnership with Stanley Park Brewing, a
Canadian craft beer brewery. Some consider this introduction a stunt
geared towards expanding the brand towards men in along with their
expansion goals. Furthermore, a statement by global events manager,
Travis McKenzie. “Our focus has always been to bring our event man-
tra — yoga.run.party — to life” The Guardian reports select social
media users drew backlash to the graphic design of the product. Some
call the “totem pole” design offensive towards native Americans.
Jun 29, 2015— Announced recall for select drawstring products.
Lululemon announced a joint recall with the U.S. Consumer Product
Safety Commission and Health Canada. Consumers risk injury from
drawstrings on 318,000 tops such as hoodies as they have the poten-
tial to lash faces. In the past Lululemon experienced a similar recall in
2013 for excessively transparent yoga pants under certain conditions.
In a company statement, “ We assessed and accrued for the financial
impact … and do not consider this to be material to our business”.
Jun 25, 2015— Names Miguel Almedia Executive Vice President
Effective mid July Miguel Almedia will start his employment under the
company subordinate to Laurent Potdevin, CEO. The press release
claims Mr. Almedia’s specialty is within the digital realm, focusing on e
-commerce strategies. E-commerce discussed later is a fast growing
source of revenues for the company. Miguel Almedia has served in
similar roles before under Walgreens, Dell, and Appel and as a strate-
gy consultant under the Boston Consulting Group.
Jun 09, 2015— Q1 2015 Earnings Call
Latest earnings call reflect momentum being built within growth areas
such as men's apparel and the ivivva brand. Store expansion into Asia
continue. In along with the e-commerce focus, a website redesign is
planned. Expenses following foreign exchange developments and
west coast port delays in addition to unexpected airfreight expenses
add pressures to margins.
Mar 26, 2015— Earnings Call w/ Outlook
Lululemon builds upon 2014 goals, developing supply chain with expe-
rienced management, building a third distribution center in Ohio, and
launching a mobile shopping app. In the near future, the company
expects gross margins of 49-50% and to open 60 new stores, 8 of
which in Asia and Europe. In closing, company expectations of the
long term are mid-single comp growth, a low to mid 50% gross mar-
gin.
Feb 02, 2015— Founder Chip Wilson resigns from board
After disagreements with other directors, Mr. Wilson is looking to sell
his $1.3 billion stake in the company. This move appears to follow the
Wilson family’s recent venture Kit and Ace, another Canadian apparel
company. From the globe and mail, “according to sources familiar
with the matter, Wilson left the board earlier this year after it failed to
move forward on governance reforms that he had pushed for last
year”. In the past Chip Wilson has been the source of controversial
comments that have been attributed to the company as offensive.
Jan 07, 2015— Names Stuart C. Haselden Chief Financial Officer
Lululemon Athletica Inc. Target Price: $74.93 USD Fair Price: $59.07 USD ( Low Est. ) Shouyang Zhou
LULU Friday, July 24, 2015 Company Analysis Report

3
Qualitative Analysis
Marketing Differentiation
Lululemon engages in a variety of new marketing approaches. Em-
phasis is placed upon “grassroots” marketing in which Lululemon ap-
peals to many however targets a relatively few number of people/
places. A growing portion of revenues come from whole sale opera-
tions in targeted yoga studios, health clubs, and fitness centers. In
addition the utilization of small showroom or temporary locations
augmented with a community based approach to social media, in
store community and brand ambassadorship .
Value Generation
The continued demand for this group’s technical product, style, and
lifestyle is critical for the continued growth and basis of the compa-
ny revenues. This is augmented by the strong customer relations
Lululemon marketing strategy incorporating a “grassroots” and
modern approach. From a technical perspective, Lululemon is driven
by the demand for fitness apparel in the areas of yoga, running,
sports wear and associated accessories. In addition, specialty exer-
cise apparel further drive demand in product lines such as stink-free
apparel, and mesh fabrics. In lieu of the athleisure lifestyle, most
products and select lines design specifically fall under dual purpose
clothing suitable for fitness though carrying a distinctive modern style
suitable as casual wear. So long as current trends in fitness and athlei-
sure continues driven by developments in culture, the Lululemon
brand stands to gain from growth in technical demand and also their
marketing positioning evident in the brand’s mention in social media.
Macroeconomic Factors
Consumer income and spending are of most importance. Lululemon
could be considered a premium brand relative to most mass market
offerings within its arena. Price points for its tops and pants are
often within the 60-150 dollar range. Within North America, upper-
middle income populations whom are most associated with this
trend in fitness are a key driver of revenues. In light of Lululemon’s
current store base and expansion goals, Australia shows a significant
population in addition to most parts of Europe. Expansion into the
Middle East and parts of Asia show significantly less persons in this
income group. Spending and cultural preferences within these areas
will also be a decisive factor, a question developed upon later will
deal with how these markets will react to the growth in fitness and in
particular the brand’s targeted activities and lifestyle.
Growth Drivers
Continued Trends in Fitness, Health, and Fashion
In a 2012 National Health Interview Survey, yoga became the top
used mind and body practice within the United States. From past
years, this marks a significant increase from 6.1% in 2007 and 5.1% in
2002. As reported by IBIS world, growth in time spent and participa-
tion in sports and exercise inherently drive product demand. In addi-
tion, in the realm of fitness and health clubs, an area Lululemon ca-
ters to through products but also in their “grassroots’ marketing
strategy through product placement and partnerships.
Increase in consumer income, the growth of the middle class in
emerging markets.
Studies in consumer income versus health and fitness trends show
that as developments in this middle/upper-middle category contin-
ues, a greater demand of fitness clubs and apparel will being to
emerge. In light of Lululemon’s current caution in not to over satu-
rate North American markets the growth of the middle class in the
emerging markets Lululemon targets, which includes Asia, will be
severely blunted by these region’s income.
Growth in E-commerce business segment
Recent growth in revenues are largely attributed to growth in sales
from the Lululemon website and mobile app.
Lululemon Athletica Inc. Target Price: $74.93 USD Fair Price: $59.07 USD ( Low Est. ) Shouyang Zhou
LULU Friday, July 24, 2015 Company Analysis Report

4
Qualitative Analysis
Notable Risks
Diminished Brand Equity
Given the presence of the Lululemon brand within the athleisure, the promo-
tion strategy, and positioning as a premium brand, Luluelmon is at risk of se-
vere downturn in lieu of bad public image. In recent controversies caused by
Founder remarks, product recalls and concerns over the Lululemon limited
beer production run, the brand is surprisingly resilient in face of its string of
bad publicity.
Reliance on suppliers
Lululemon acknowledges that none of it’s products are manufactured in
house. Given that the brand differentiates on a technical level through their
promoted named fabrics, difficulties of sourcing what Lululemon considers
relatively advanced textile products may be of issue. The dependences on
five companies that source 63% of Lululemon’s product and 40% of raw
materials may come of concern in the long run. There is a special risk in light
of campaigns towards environmentalism, emerging market labour concerns
and the effect on brand equity.
Downturn on consumer spending
As discussed earlier, a downturn in economic factors and in consumer senti-
ment will result in more substitutable goods such as Lululemon branded
apparel to be out of reach.
Loss of market share
The market for athletic apparel is considered highly competitive and diversi-
fied. Competition may result in pricing pressures', the loss of profit margins,
and lower growth. Competition comes from traditional athletic apparel com-
panies and also similar “grass roots” companies. Traditional apparel compa-
nies will be able to expand or switch existing production and have existing
distribution capacity as this market grows and becomes increasingly attrac-
tive. Companies such as Nike and Adidas, who are named major competitors
of Lululemon, have longer operation histories, broader customer bases, and
established consumer, retail, supplier, and distributor relationships. Smaller
technical companies such as Under Amour, may nullify existing expansion
opportunities such as the expansion into men’s products given Lululemon's
existing target individual.
Obsolescence
The nature of fashion and lifestyle trends may be of concern in the long
term as the demand for the athleisure lifestyle and associated products /
styles rotate out of fashion.
Lack of patents
Lululemon acknowledges that the intellectual property rights in technology,
fabrics, and processes used to manufacture are owned or controlled by sup-
pliers. The in ability to obtain such rights leave greatly lowered barriers to
entry. Risks include a vital supplier leaving Lululemon for one of their more
mature competitors.
Notable Management
Given the current expansion strategy into Non-North Amercian mar-
kets, and focuses in E-commence opportunities. This analysis of man-
agement will focus upon key individuals with experience in expan-
sion into emerging markets, European apparel markets, and the
overall targeted individuals Lululemon pursues.
Michael Casey Independent Co-Chairman of the Board
He retired from Starbucks Corporation in October 2007, where he had served as Sen-
ior Vice President and CFO from August 1995 to September 1997, and Executive Vice
President, CFO and Chief Administrative Officer from September 1997 to October
2007. Subsequent to retirement he served as a Senior Advisor to Starbucks Corpora-
tion from October 2007 to May 2008 and from November 2008 to January 2015.
Laurent Potdevin Chief Executive Officer
Mr. Potdevin previously worked at Toms Shoes, a socially-conscious shoe company,
where he served as President from May 2011 to December 2013. From 1995 to 2010,
he worked at Burton Snowboards, the world's largest and premier snowboarding
company, serving in various capacities including as President and CEO from 2005 to
2010.
Scott (Duke) Stump Executive Vice-President
Mr. Stump was the Principal and Chief Architect at the Northstar Manifesto, a compa-
ny committed to helping others become "bonfire" brands, emphasizing the role that a
business conscience can play in propelling brands further on the road to growth and
sustainability, where he had been since 2008. He also served as the SVP Culture, Crea-
tive and Brand Innovation at Easton Sports from January 2011 to April 2014. Prior to
2008, Mr. Stump worked at Seventh Generation as the Chief Marketing Officer and
spent over 15 years at Nike in various roles in brand, product and sales.
Miguel Almedia Executive Vice President
Mr. Almeida's career spans over 15 years of operational and senior leadership with a
keen focus on digital strategies. Most recently, he was the Group VP, Digital Com-
merce and Mobile solutions for Walgreens where he was responsible for omni-
channel initiatives, mobile solutions, and online-to-consumer commerce across a
variety of digital brands. Prior to joining Walgreens, Miguel held senior roles in the
online groups of Apple and Dell where he drove global online expansion for both com-
panies. Previously, he was a strategy consultant with The Boston Consulting Group
where he worked across multiple countries in Europe and South America mainly in
high technology, telecom, ecommerce, marketing and retail.
Lululemon Athletica Inc. Target Price: $74.93 USD Fair Price: $59.07 USD ( Low Est. ) Shouyang Zhou
LULU Friday, July 24, 2015 Company Analysis Report

5
Industry Overview — Select Data Sourced from Mintel Academic
Porter’s Five Forces Summary ( Less Competition )
Power of Suppliers
All of the named major competitors source the production of goods
to third party supplies to some degree. Lululemon is of interest here
in particular, it claims that given the high technical nature of it’s prod-
ucts there are fewer possibilities of adequate suppliers for its fabrics. A
trend in Lululemon’s major competitors focuses upon “greenifying”
their efforts in human rights, environmentalism, and safety in their
sourcing operations.
Power of Buyers
Given the competitive nature of the industry, buyers are constantly
pressuring for lower production costs and better shipment in quality
and quantity.
New Entrants
As seen in the diverse competitors of Lululemon, the ease of entry is
low especially for other entities already within the apparel space.
Substitute Product
Lululemon being what could be considered an industry leader may be
able to stave off product substitution by leveraging it’s brand as many
competitors do. However in practical terms, substitution is of ease.
Competition
Competition in the athletic ap-
parel industry is principally on
the basis of brand image and
recognition as well as product
quality, innovation, style, distri-
bution and price. Lululemon fo-
cuses their efforts on their target-
ed niche of women’s apparel
largely by offering product quali-
ty, style, and leveraging their
brand equity while charging ac-
cordingly to this “premium brand”
image. Lululemon identifies three
major competitors, Nike, Adidas,
and Under Armor and three sec-
ondary competitors, The Gap,
Lucy Activewear, and Bebe stores.
The Consumer
Mintel advises that in general higher household incomes out leads to
healthier lifestyles which in turn leads to greater purchases in fitness
apparel . Young men 18-34 are mentioned specifically by Mintel for
higher tendencies for purchases and reporting that they are exercis-
ing more than a year ago. Furthermore their price tolerances are
reported to be higher than average. One point worth mention is that
38% of consumers of the respondents to Mintel report purchases for
fitness clothing for casual wear.
Nielsen Global reports that program offerings are increasingly rele-
vant and the demand for quality and coaching are higher in women
and millennials.
In addition, Mintel notes that in US markets the growth of the His-
panic population greatly benefits this fitness apparel industry as this
population has “ a higher fitness clothing purchase incidence than
other ethnicities due in part to the median age being younger, with
80% buying apparel in the past year. They are more willing to pay
elevated prices for most items as well “.
“Marketers can attempt to increase frequency of purchase and/or basket size among the avid purchasers, in particular young adults with high house-hold incomes, recognizing insights about each group. Young adult men are brand loyal and prefer quality, durable items while young women are price conscious but are interested in being fashionable and stylish. Those with higher household incomes are more prone to purchase higher-ticket items with ancillary features like moisture-wicking, weatherproof, or smart tech-nology.
Encouraging purchases as part of a larger reward or incentive program could be appealing, as 29% of consumers said they buy fitness clothing to treat themselves. Also, the idea of positioning fitness clothing as a gift appears to be an opportunity area for retailers to consider. Young men and affluent consumers are more likely to buy athletic apparel as a gift already. Perhaps this could be accelerated among less active or non-exercising shoppers.
Hispanic-focused initiatives should be included in marketing and branding
efforts given the overall growth of this group coupled with their tendency to
buy more fitness clothing overall versus the general population. They will
also maintain loyalty to retailers and brands who they think are “for me.”
Marketing Strategies of Significant Companies
Nike— Using traditional channels such as television Nike arguably
focuses more-so upon the male population through it’s marketing
statements in the area of performance and heroism. Nike has histor-
ically used athlete endorsements and sponsorships to great effect.
Adidas— Much like Nike Adidas promotes their brand through a
mixture of traditional channels and sponsorship. Notable mentions
go towards their World Cup efforts and popular youth icons such as
Kanye West.
Under Armor— Under Armor is a similar company expanding into
new markets and products. Originally marketing to men through a
gritty industrial / urban theme now moving into women’s and chil-
dren apparel.
Lululemon Athletica Inc. Target Price: $74.93 USD Fair Price: $59.07 USD ( Low Est. ) Shouyang Zhou
LULU Friday, July 24, 2015 Company Analysis Report

6
Outlook
Short Term Outlook
E-commerce will continue to be the main driver of revenues.
Direct to consumer sales increased approximately 22% from 2014 to 2015
while traditional store retail sales increased 9.7%. Reported margins after
general corporate expenses come out to be 41.4 % for e-commerce sales
while retail is at 26.4%. The continued development on website sales and
mobile applications show very favorable prospects domestically within
North America and also abroad into emerging markets. As of the current,
Lululemon offer’s its mobile shopping app and training / social media app on
iOS devices however not its shopping app on android devices. Its website
store already allows shipment to the vast majority of the globe including all
of western Europe, Scandinavia, China, Korea, India, Japan, Turkey, UAE,
Israel, Saudi Arabia, the Caribbean, and south America.
Consumer sentiment and spending will be dampened given recent
developments in the oil price plunge and markets in Asia and Eu-
rope.
Despite savings on gasoline and related oil and gas expenditures, Q1 per-
sonal consumption in the areas of recreational goods and vehicles, clothing
and footwear have remained largely steady towards past quarterly figures.
From the start of 2015, the consumer confidence index had remained largely
steady on average near 100 ( 1985 =100 ) levels. From the most recent
release of July 28, 2015, the consumer index has dropped by 8.9 points from
99.8 to 90.9. The release shows that while consumers show that current
situations are largely favorable, short-term expectations are less optimistic
regarding employment, and financial markets likely due to developments in
China and Greece. If conditions continue, dampened spending within the
Fall and Winter seasons will have a great impact on the revenues of Lu-
lulemon.
Long Term Outlook
Growth of the Middle and Upper Classes in Asia and in particular
China.
Given the growth of the middle class and dispositions in trends re-
garding environmentalism, fitness and health, and in addition Ameri-
can culture, Lululemon products, in our view, seem to be well re-
ceived in this market. As reported by IBIS world, The Gym, Health
and Fitness Clubs industry in China has been developing rapidly in
recent years, largely due to increasing disposable incomes and
health awareness among Chinese consumers”. IBIS world statistics
report that in the last five years, the annual growth rate of this in-
dustry comes to be approximately 13.7%. Going further, “The com-
bined market share of the top four players in the industry – Haosa
Group, Wellness Group, Impulse Total Fitness, and Powerhouse Gym
– is estimated at about 17.1% in 2015. There are a large number of
regional fitness clubs in the industry. Many clubs only establish chain
establishments in a specific city so as to maximize their influence.
These fragmented clubs provide similar fitness services and make a
relatively small contribution to industry revenue. The low industry
concentration level is also attributed to the industry being in the
growth phase of its life cycle”. In our view, bringing the same level of
community engagement firstly to these key industry players through
strategic partnerships then followed suit by smaller regional players
will allow Lululemon to secure a great deal of future revenues.
Physical Activity still an issue in North America.
Despite increased awareness in light of over all health and longevity
concerns, North Americans are still showing trends towards an in-
creasingly obese population. In recent years, the demographic of
fitness orientated individuals has changed from the 18-30 range to a
more dispersed level amongst all age groups. As the centers for Dis-
ease Control and Prevention says, “some Americans are getting
enough, but too many are not” . Key findings by the Outdoor foun-
dation show that running and jogging staying at the most popular
outdoor activity. In addition, young women and teenage girls are
collectively adding five percentage points more in terms of overall
outdoor activity participation, in our view a proxy for overall physical
activity engagement. In our view the trends in North America paint
two divergent outlooks. As the effects of obesity within the general
population comes about the trend towards a healthier lifestyle could
accelerate or become increasely irrelevant. With specific focus on
women’s products, Lululemon stands to gain from a larger participa-
tion population.
Lululemon Athletica Inc. Target Price: $74.93 USD Fair Price: $59.07 USD ( Low Est. ) Shouyang Zhou
LULU Friday, July 24, 2015 Company Analysis Report

7
Key Questions Q1. How will Lululemon cater to / adapt its current operations to better fulfill its expansion into European and Emerging Markets?
Firstly the use of the temporary and showroom store model mitigates early concerns regarding the lack of traction with foreign markets. In
the notable management panel, we discussed how select members of senior management have the global expansion experience within
other companies such as CEO Laurent Potdevin. Mr. Potdevin brings experience from Toms shoes and Burton brand. In our view, Lululemon
could benefit from additional website overhauls and as Mr. Potdevin says, the company will have to adapt to Asia and not the other way
around. Upon inspection of the e-commerce site despite the wide range of shipping options the current selection of nationality appears to
only affect pricing and presumably shipping matters. The website is still in English and additional brand community measures such as the
blog and education section follow suit. In Europe, a greater sense of health and exercise exists and will likely propel the brand though this
may be offset given the perceived stigma of a “yogi” American brand. In terms of Asia, we’ve discussed the brand ambassadorship and the
opportunities in partnership with the growing fitness clubs present in Asia. The company will likely have to drastically adapt it’s product line
in suit for Asian styles and fitness goals.
Q2. Given the nature of this industry, how will major players such as Nike reacts as Lululemon expands into other markets and gain traction
domestically.
We’ve named Nike in particular given their recent movements into this athleisure lifestyle area. On November 21, 2014, Nike opened a
6,000 sq-ft store in Newport Beach, California. Matching Lululemon’s initiative on building communities around the brand and store, Nike’s
new opening servers as a retail location but also as a service for yoga classes and pant hemming services both offered by Lululemon for years
now. Nike has expanded it’s product line directly in competition of Lululemon’s product offerings. Traditionally, Nike has a large presence in
the realm of running equipment, now it appears to be coping the move into yoga through it’s own branded leggings and pants. Nike does not
maintain a in-house e-commerce store while relying on third parties such as Amazon while Lululemon offers an in-house and third party Ama-
zon option. On the mobile front, Nike has various training apps however not a mobile store application. In our view, a expansion into these
areas of e-commerce will likely be well received by the Lululemon demographic though we are unsure of its financial viability overall for Nike.
Lululemon Athletica Inc. Target Price: $74.93 USD Fair Price: $59.07 USD ( Low Est. ) Shouyang Zhou
LULU Friday, July 24, 2015 Company Analysis Report

8
Scenario Analysis Base Case ( See Attached ) 67.52 / 59.07
In the base case we model a neutral view largely based upon industry outlook and statements made in earnings calls by company officials.
We predict an expected growth rate of 13.5% annually, larger than the 2014 FY period though smaller compared to the 2013 FY period
( 16.11% ) in which the Luon fabric recall and controversial statements by Chip were made. In line with their targeted gross margin goals,
for year 2015 the margin will come to be 49.63%. Under current circumstances, incorporating Q1 data, our EPS estimates for 2015 FY and
2016 FY are 2.23 and 2.43. These are higher than the 1.93 and 2.32 average estimates polled by Yahoo Finance. However our yearly reve-
nue estimate of 2.03 B is on par with the average analyst estimate. This difference is likely due to the expected share repurchases under
Lululemon’s share buyback program within the coming year. Our terminal value is based upon earnings call and estimates for industry
growth, and company consensus estimates at 7.00%. In the Q1 2015 earnings call, company officials stated that the long term outlook
would incorporate a low-mid single digit growth. In consensus analyst estimates provided by Thompson one, the lowest polled estimate out
of 31 is 11.90.
Aggressive Case 68.1 / 74.41
If Lululemon were to maintain the growth rate experienced for 2013 FY and 2012 FY, a growth rate of 16.12% and a long term growth rate
of 7.50% given its focus on expanding abroad and through e-commerce channel then a price increase up to 74.41 by terminal value. Expec-
tations here see a smooth transition abroad and in following a strong initiative to revamp North American stores which see a significant in-
crease in revenues.
50
55
60
65
70
75
10 11 12 13 14 15 16 17 18
Est
ima
ted
Eq
uit
y V
alu
e p
er
Sh
are
% Annual Growth
Equity Value versus 5-Year Growth Rates
EBITDA Method
Perpetuity Method
Lululemon Athletica Inc. Target Price: $74.93 USD Fair Price: $59.07 USD ( Low Est. ) Shouyang Zhou
LULU Friday, July 24, 2015 Company Analysis Report

9
Comparables Analysis
Data from Thompson One Academic
We note that Under Armour, Nike, and Adidas are the three primary competitors here with other brands largely fitting with
the area of general apparel and/ or expanding their own fitness apparel line. Lululemon maintains a well above average year
on year sales growth in comparison to its competitors while holding the highest net margins for TTM and FY1. This is offset by
its low growth in EBITA and EBIT of which it’s competitors such as Nike and Under Armour show values more fitting for their
year to year sales. Presumably Nike has the logistical capacity to handle a growth in sales. Presumably the expansion into for-
eign markets and foreign exchange considerations in recent times have had more of an effect on Lululemon given it’s strong
net margin , ROA, and ROE figures. In our view, it is natural to consider Under Armor as a suitable alternative investment choice
to Lululemon however the given Under Armour’s lower yearly return and abnormally high P/E, price to cash flow and price to
book ratios, this investment alternative is overvalued.
Key Financials & Effectiveness
Name Sales TTM
Sales Year/Year
EBITDA Year/Year
EBIT Year/Year
Net Margin TTM
Net Margin FY1
EPS TTM
EPS Year/Year
EPS FY1
ROA TTM
ROE TTM
LULULEMON ATHLETICA INC. 1,745.84 1.22 1.06 1.02 14.46% 13.51% 1.76 1.17 2.06 19.90% 22.84%
THE GAP, INC. 16,318.00 1.01 1.00 0.98 7.61% 7.06% 2.86 1.10 2.77 17.17% 41.96%
UNDER ARMOUR, INC. 3,421.63 1.29 1.26 1.23 5.94% 6.14% 0.92 0.66 1.08 9.37% 15.91%
NIKE, INC. 30,601.00 1.10 1.16 1.18 10.70% 11.14% 3.70 1.24 4.18 18.11% 27.82%
BEBE STORES, INC. 411.28 0.95 0.75 0.77 (13.84%) (5.07%) (0.72) 0.95 (0.28) (22.06%) (30.33%)
adidas 16,200.19 1.06 0.93 0.88 3.36% 4.41% 2.63 0.75 3.74 4.74% 8.53%
URBAN OUTFITTERS, INC. 3,375.78 1.08 0.90 0.86 6.75% 6.99% 1.68 0.92 1.90 12.33% 16.41%
ABERCROMBIE & FITCH CO. 3,631.02 0.89 0.93 0.88 0.34% 1.40% 0.13 0.27 0.73 1.35% 0.86%
L BRANDS, INC. 11,575.00 1.06 1.14 1.16 9.81% 9.35% 3.81 1.23 3.75 21.88% (186.68%)
COACH, INC. 4,323.72 0.88 - - 10.78% 12.65% 1.68 0.51 1.91 - 18.91%
AMERICAN EAGLE OUTFIT-TERS, INC. 3,336.26 1.02 1.45 1.87 3.16% 5.45% 0.54 1.77 0.97 6.39% 9.20%
Mean 8,630.88 1.05 1.06 1.08 5.37% 6.64% 1.73 0.96 2.07 8.92% (4.96%)
Median 3,631.02 1.06 1.03 1.00 6.75% 6.99% 1.68 0.95 1.91 10.85% 15.91%
High 30,601.00 1.29 1.45 1.87 14.46% 13.51% 3.81 1.77 4.18 21.88% 41.96%
Low 411.28 0.88 0.75 0.77 (13.84%) (5.07%) (0.72) 0.27 (0.28) (22.06%) (186.68%)
Market Data & Price Multiples
Name Dividend
Yield TTM Total
Return 1 Yr Market Cap -
Consolidated Enterprise
Value P/E
TTM P/E FY1
Price/ Cash Flow
TTM
Price/ Cash Flow
FY1
Price/ BV Tangi-
ble
LULULEMON ATHLETICA INC. 0.00% 55.04% 9,557.97 8,873.64 38.32 32.75 33.01 24.94 8.21
THE GAP, INC. 2.56% 4.51% 15,045.65 15,064.65 12.61 13.03 8.50 9.83 5.12
UNDER ARMOUR, INC. 0.00% 40.26% 21,455.54 22,000.04 107.39 91.70 56.99 92.49 28.91
NIKE, INC. 0.99% 33.60% 98,440.00 92,140.00 31.08 27.52 22.99 23.37 8.02
BEBE STORES, INC. 0.00% (40.82%) 149.71 78.16 NEG NEG NEG - 0.96
adidas 2.10% (4.27%) 16,648.53 16,477.77 30.25 21.30 15.55 16.36 4.48
URBAN OUTFITTERS, INC. 0.00% 12.30% 4,228.33 3,954.77 19.65 17.35 11.81 11.20 3.13
ABERCROMBIE & FITCH CO. 3.94% (38.92%) 1,384.42 1,338.48 159.01 27.23 5.15 5.11 1.01
L BRANDS, INC. 2.41% 70.68% 23,748.38 27,810.38 21.36 21.72 15.67 18.07 NEG
COACH, INC. 4.43% (14.11%) 8,647.79 7,517.79 18.59 16.43 10.14 10.79 3.90 AMERICAN EAGLE OUTFIT-TERS, INC. 2.85% 43.04% 3,392.50 3,065.59 32.20 17.93 10.99 11.22 3.12
Mean 1.75% 14.66% - - 42.53 25.46 16.94 22.34 5.15
Median 2.56% 12.30% - - 30.25 21.30 11.81 13.79 3.90
High 4.43% 70.68% 98,440.00 92,140.00 159.01 91.70 56.99 92.49 28.91
Low 0.00% (40.82%) 149.71 78.16 12.61 13.03 5.15 5.11 0.96
Lululemon Athletica Inc. Target Price: $74.93 USD Fair Price: $59.07 USD ( Low Est. ) Shouyang Zhou
LULU Friday, July 24, 2015 Company Analysis Report

10
CONSOLIDATED STATEMENTS OF OPERATIONS AND INCOME
(Amounts in thousands)
Period Ending January 31st. 2013A 2014A 2015A 2016F 2017F 2018F 2019F 2020F
Revenue
Net Sales 1,370,358 1,591,188 1,797,213 2,039,837 2,315,215 2,627,769 2,982,517 3,385,157
% Growth 16.11% 12.95% 13.500% 13.500% 13.500% 13.500% 13.500%
Cost of goods sold (Adjusted)
Cost of goods sold 564,532 702,044 824,669 935,999 1,062,359 1,205,778 1,368,558 1,553,313
COGS as a % of revenue 41.20% 44.12% 45.89% 45.89% 45.89% 45.89% 45.89% 45.89%
Gross profit 805,826 889,144 972,544 1,103,837 1,252,855 1,421,991 1,613,960 1,831,844
Gross profit margin (%) 58.80% 55.88% 54.11% 54.11% 54.11% 54.11% 54.11% 54.11%
Gross profit margin (%) ( including de-preciation) 44.33% 47.20% 49.13% 49.63% 50.08% 50.47% 50.81% 50.23%
Operating expenses
Selling, general and administrative 386,387 448,718 538,147 610,797 693,254 786,844 893,068 1,013,632
SG&A as a % of revenue 28.20% 28.20% 29.94% 29.94% 29.94% 29.94% 29.94% 29.94%
EBITDA ( Adjusted) 419,439 440,426 434,397 493,041 559,601 635,147 720,892 818,213
EBITDA margin (%) 30.61% 27.68% 24.17% 24.17% 24.17% 24.17% 24.17% 24.17%
Depreciation and amortization 43,000 49,068 58,364 76,405 97,010 120,396 146,939 146,939
EBIT 376,439 391,358 376,033 416,635 462,591 514,751 573,953 671,273
EBIT margin (%) 27.47% 24.60% 20.92% 20.42% 19.98% 19.59% 19.24% 19.83%
Interest
Other Income (Expense) 4,957 5,768 7,102 7,102 7,102 7,102 7,102 7,102
Taxation
Income tax expense 109,965 117,579 144,102 127,206 141,002 156,660 174,433 203,648
Deffered Taxes 13,469 9,345 5,480 1,688 311
Net Taxation 113,737 131,657 151,181 172,745 203,338
Tax rate (%) 28.83% 29.61% 37.61% 30.02% 30.02% 30.02% 30.02% 30.02%
Minority Control
Net income attributable to non-controlling interest 875.00 0.00 0.00 0.00 0.00 0.00 0.00 0.00
Net Income (Adjusted) 270,556 279,547 239,033 310,000 338,037 370,673 408,310 475,038
Net Income (Reported) 270,556 279,547 239,033
Earnings Per Share (EPS)
Basic 1.88 1.93 1.66 2.23 2.43 2.67 2.94 3.42
Diluted 1.86 1.91 1.66 2.22 2.42 2.66 2.93 3.41
Average Shares Outstanding
Basic 144,000 144,913 143,935 139,055 139,055 139,055 139,055 139,055
Diluted 145,806 146,043 144,298 139,418 139,418 139,418 139,418 139,418
Lululemon Athletica Inc. Target Price: $74.93 USD Fair Price: $59.07 USD ( Low Est. ) Shouyang Zhou
LULU Friday, July 24, 2015 Company Analysis Report

11
CONSOLIDATED STATEMENTS OF CASH FLOWS
(Amounts in thousands)
Period Ending January 31st. 2013A 2014A 2015A 2016F 2017F 2018F 2019F 2020F
Cash flows from operating activities
Net income 270,556 279,547 239,033 310,000 338,037 370,673 408,310 475,038 Items not affecting cash
Depreciation and amorti-zation 43,000 49,068 58,364 76,405 97,010 120,396 146,939 146,939
Deferred income taxes (6,445) 820 2,087 13,469 9,345 5,480 1,688 311
Working Capital Changes ( From Bal-ance Sheet )
Accounts receivable (5,552) (1,843) (810) (1,965) (2,230) (2,531) (2,873)
Inventories (33,568) (19,326) (19,169) (30,684) (34,826) (39,527) (44,863)
Prepaid expenses and oth-er current assets (10,896) (18,474) (8,731) (9,909) (11,247) (12,765) (14,489)
Accounts payable 11,602 (3,308) 3,138 1,684 1,912 2,170 2,463
Accrued inventory liabili-ties (14,617) 6,881 8,000 4,090 4,642 5,269 5,980
Accrued compensation and related expenses (8,085) 10,487 2,039 4,316 4,899 5,560 6,311
Income taxes payable (38,868) 19,304 (4,545) 1,684 1,911 2,169 3,566
Unredeemed gift card lia-bility 3,230 7,909 (3,955) 5,710 6,481 7,356 8,349
Other accrued liabilities 29,595 2,394 2,960 4,718 5,355 6,078 6,899
Net cash provided by operating activities 307,111 262,276 303,508 378,802 424,037 473,445 530,716 593,630
Cash flows from investing activities v v
Purchase of property and equipment Hardcoded (106,408) (119,733) (136,154) (154,535) (175,397) (199,075) (225,950)
Other non-current assets (82) (73) (57) (44) (58)
11,554 8,842 8,454 8,014 12,145 Other non-current liabilities
Net cash used in investing activities (106,408) (119,733) (124,681) (145,765) (166,999) (191,105) (213,863)
Purchase of property and equipment % of Revenues 6.69% 6.66% 6.67% 6.67% 6.67% 6.67% 6.67%
Cash flows from financing activities
Proceeds from exercise of stock op-tions 11,014 8,171 2,913 0 0 0 0 0
Taxes paid related to net share settlement of equity awards (393) (5,721) (4,972) (5,812) 0 0 0 0
Repurchase of common stock 0 0 (147,431) (302,569) 0 0 0 0 Net cash (used in) provided by financing activities 10,621 2,450 (149,490) (308,381) 0 0 0 0
v
Shares Repurchased @ 64.00 62 (4,880) 0 0 0 0
Effect of exchange rate changes on cash (651) (72,368) (79,809) (65,000) (65,000) (32,500) (16,250) (8,125) (Decrease) increase in cash and cash equivalents 85,950 (45,524) (119,260) 213,272 273,946 323,361 371,642
Lululemon Athletica Inc. Target Price: $74.93 USD Fair Price: $59.07 USD ( Low Est. ) Shouyang Zhou
LULU Friday, July 24, 2015 Company Analysis Report

12
CONSOLIDATED BALANCE SHEETS
(Amounts in thousands)
Period Ending January 31st. 2013A 2014A 2015A 2016F 2017F 2018F 2019F 2020F
ASSETS
Current Assets
Cash and cash equivalents 590,179 698,649 664,479 545,219 758,492 1,032,437 1,355,798 1,727,440
Accounts receivable 6,351 11,903 13,746 14,556 16,521 18,751 21,283 24,156
Inventories 155,222 188,790 208,116 227,285 257,969 292,795 332,322 377,186
Prepaid expenses and oth-er current assets 35,301 46,197 64,671 73,402 83,311 94,558 107,323 121,812
787,053 945,539 951,012 860,462 1,116,292 1,438,541 1,816,726 2,250,593
Property and equipment, net 214,639 255,603 296,008 355,757 413,282 468,282 520,418 599,429 Goodwill and intangible as-sets, net 30,201 28,201 26,163 26,163 26,163 26,163 26,163 26,163
Deferred income tax asset 15,033 18,300 16,018 16,018 16,018 16,018 16,018 16,018
Other non-current assets 4,152 4,745 7,012 7,094 7,166 7,224 7,267 7,325
Total 1,051,078 1,252,388 1,296,213 1,265,494 1,578,921 1,956,228 2,386,592 2,899,529 LIABILITIES AND STOCKHOLD-ERS' EQUITY
Current liabilities
Accounts payable 1,045 12,647 9,339 12,477 14,161 16,073 18,243 20,706
Accrued inventory liabili-ties 30,032 15,415 22,296 30,296 34,386 39,028 44,297 50,277
Accrued compensation and related expenses 27,530 19,445 29,932 31,971 36,287 41,186 46,746 53,057
Income taxes payable 39,637 769 20,073 15,528 17,212 19,124 21,293 24,860
Unredeemed gift card lia-bility 35,113 38,343 46,252 42,298 48,008 54,489 61,845 70,194
Other accrued liabilities 0 29,595 31,989 34,949 39,667 45,022 51,100 57,999
133,357 116,214 159,881 167,519 189,722 214,922 243,524 277,092
Deferred income tax liability 0 3,977 3,633 17,102 26,447 31,927 33,615 33,925
Other non-current liabilities 30,422 35,515 43,131 54,685 63,528 71,982 79,997 92,142
163,779 155,706 206,645 239,306 279,697 318,831 357,136 403,159
Other non-current liabili-ties ( % 0f PP&E ) 15.10% 15.64% 15.37% 15.37% 15.37% 15.37% 15.37%
Stockholders' equity
Common stock 562 577 661 661 661 661 661 661
Additional paid-in capital 221,372 240,351 241,695 235,883 235,883 235,883 235,883 235,883
Retained earnings 644,275.00 923,822 1,020,619 1,028,050 1,366,087 1,736,760 2,145,070 2,620,107
Accumulated other com-prehensive loss 21,090.00 (68,069) (173,407) (238,407) (303,407) (335,907) (352,157) (360,282)
Note on Debt
Total 1,051,078 1,252,387 1,296,213 1,265,494 1,578,921 1,956,228 2,386,592 2,899,529
Check 0.00 1.00 0.00 0.00 0.00 0.00 0.00 0.00
Check ( % of
Assets ) 0.00% 0.00% 0.00% 0.00% 0.00% 0.00% 0.00% 0.00%
Lululemon Athletica Inc. Target Price: $74.93 USD Fair Price: $59.07 USD ( Low Est. ) Shouyang Zhou
LULU Friday, July 24, 2015 Company Analysis Report

13
Depreciation
(Amounts in thousands)
Period Ending January 31st. 2013A 2014A 2015A 2016F 2017F 2018F 2019F 2020F
Property and equipment ( Beg of Year) 214,639 255,603 296,008 355,757 413,282 468,282 520,418 599,429
Capital expenditures ( Beg of Year) 119,733 136,154 154,535 175,397 199,075 225,950
Book ( GAAP) depreciation
Useful Life
PP&E 7
CAPEX 8 8 8 8 8 8
Depreciation ( Level Method , End of Year )
Existing PP&E 42,287 42,287 42,287 42,287 42,287 42,287
CAPEX 2015 15,964 15,964 15,964 15,964 15,964 15,964
CAPEX 2016 18,154 18,154 18,154 18,154 18,154
CAPEX 2017 20,605 20,605 20,605 20,605
CAPEX 2018 23,386 23,386 23,386
CAPEX 2019 26,543 26,543
CAPEX 2020 30,127
Total 58,251 76,405 97,010 120,396 146,939 146,939
Book ( MACRS) depreciation
Useful Life
Depreciation ( Half Year % , 7-year)
Existing PP&E 14.29% 24.49% 17.49% 12.49% 8.93% 8.92%
CAPEX 2015 14.29% 24.49% 17.49% 12.49% 8.93% 8.92%
CAPEX 2016 14.29% 24.49% 17.49% 12.49% 8.93%
CAPEX 2017 14.29% 24.49% 17.49% 12.49%
CAPEX 2018 14.29% 24.49% 17.49%
CAPEX 2019 14.29% 24.49%
CAPEX 2020 14.29%
Depreciation ( Half Year)
Existing PP&E 42,300 72,492 51,772 36,971 26,434 26,404
CAPEX 2015 17,110 29,323 20,941 14,955 10,692 10,680
CAPEX 2016 19,456 33,344 23,813 17,006 12,159
CAPEX 2017 22,083 37,846 27,028 19,301
CAPEX 2018 25,064 42,955 30,677
CAPEX 2019 28,448 48,754
CAPEX 2020 32,288
Total 59,409 121,271 128,140 138,649 152,562 147,974
Deferred Tax Liability 13,469 9,345 5,480 1,688 311
Lululemon Athletica Inc. Target Price: $74.93 USD Fair Price: $59.07 USD ( Low Est. ) Shouyang Zhou
LULU Friday, July 24, 2015 Company Analysis Report

14
Operating Working Capital
(Amounts in thousands)
Period Ending January 31st. 2013A 2014A 2015A 2016F 2017F 2018F 2019F 2020F
Current Assets
Accounts receivable 6,351 11,903 13,746 14,556 16,521 18,751 21,283 24,156
Receivable days 2 3 3 3 3 3 3
Inventories 155,222 188,790 208,116 227,285 257,969 292,795 332,322 377,186
Inventory days 89 88 89 89 89 89 89
Prepaid expenses and other current assets 35,301 46,197 64,671 73,402 83,311 94,558 107,323 121,812
Prepaid expense days 38 44 44 44 44 44 44
Current liabilities
Accounts payable 1,045 12,647 9,339 12,477 14,161 16,073 18,243 20,706
Payable days 4 5 5 5 5 5 5
Accrued inventory liabilities 30,032 15,415 22,296 30,296 34,386 39,028 44,297 50,277
Payable days 12 8 12 12 12 12 12
Accrued compensation and related expenses 27,530 19,445 29,932 31,971 36,287 41,186 46,746 53,057
Payable days 19 17 19 19 19 19 19
Income taxes payable 39,637 769 20,073 15,528 17,212 19,124 21,293 24,860
Payable Days 63 26 45 45 45 45 45
Unredeemed gift card liability 35,113 38,343 46,252 42,298 48,008 54,489 61,845 70,194
Payable Days 8 9 9 9 9 9 9
Other accrued liabilities 0 29,595 31,989 34,949 39,667 45,022 51,100 57,999
Payable Days 3 6 6 6 6 6 6
Lululemon Athletica Inc. Target Price: $74.93 USD Fair Price: $59.07 USD ( Low Est. ) Shouyang Zhou
LULU Friday, July 24, 2015 Company Analysis Report
15
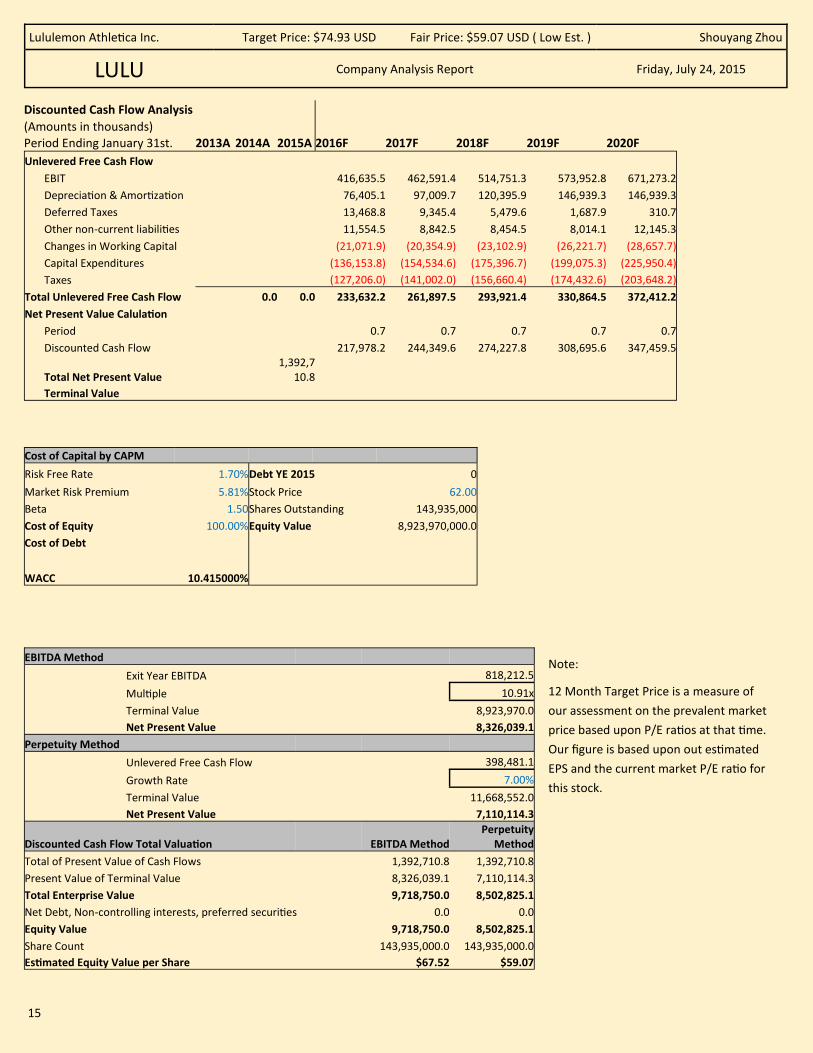
Discounted Cash Flow Analysis
(Amounts in thousands) Period Ending January 31st. 2013A 2014A 2015A 2016F 2017F 2018F 2019F 2020F
Unlevered Free Cash Flow
EBIT 416,635.5 462,591.4 514,751.3 573,952.8 671,273.2
Depreciation & Amortization 76,405.1 97,009.7 120,395.9 146,939.3 146,939.3
Deferred Taxes 13,468.8 9,345.4 5,479.6 1,687.9 310.7
Other non-current liabilities 11,554.5 8,842.5 8,454.5 8,014.1 12,145.3
Changes in Working Capital (21,071.9) (20,354.9) (23,102.9) (26,221.7) (28,657.7)
Capital Expenditures (136,153.8) (154,534.6) (175,396.7) (199,075.3) (225,950.4)
Taxes (127,206.0) (141,002.0) (156,660.4) (174,432.6) (203,648.2)
Total Unlevered Free Cash Flow 0.0 0.0 233,632.2 261,897.5 293,921.4 330,864.5 372,412.2
Net Present Value Calulation
Period 0.7 0.7 0.7 0.7 0.7
Discounted Cash Flow 217,978.2 244,349.6 274,227.8 308,695.6 347,459.5
Total Net Present Value 1,392,7
10.8
Terminal Value
Cost of Capital by CAPM
Risk Free Rate 1.70% Debt YE 2015 0
Market Risk Premium 5.81% Stock Price 62.00
Beta 1.50 Shares Outstanding 143,935,000
Cost of Equity 100.00% Equity Value 8,923,970,000.0
Cost of Debt
WACC 10.415000%
EBITDA Method
Exit Year EBITDA 818,212.5
Multiple 10.91x
Terminal Value 8,923,970.0
Net Present Value 8,326,039.1
Perpetuity Method
Unlevered Free Cash Flow 398,481.1
Growth Rate 7.00%
Terminal Value 11,668,552.0
Net Present Value 7,110,114.3
Discounted Cash Flow Total Valuation EBITDA Method Perpetuity
Method
Total of Present Value of Cash Flows 1,392,710.8 1,392,710.8
Present Value of Terminal Value 8,326,039.1 7,110,114.3
Total Enterprise Value 9,718,750.0 8,502,825.1
Net Debt, Non-controlling interests, preferred securities 0.0 0.0
Equity Value 9,718,750.0 8,502,825.1
Share Count 143,935,000.0 143,935,000.0
Estimated Equity Value per Share $67.52 $59.07
Note:
12 Month Target Price is a measure of
our assessment on the prevalent market
price based upon P/E ratios at that time.
Our figure is based upon out estimated
EPS and the current market P/E ratio for
this stock.
Lululemon Athletica Inc. Target Price: $74.93 USD Fair Price: $59.07 USD ( Low Est. ) Shouyang Zhou
LULU Friday, July 24, 2015 Company Analysis Report

16
Sources and Further Reading
Nielsen Global Consumer Exercise Trends Survey 2014 http://www.slideshare.net/Bryankorourke/nielsen-global-consumer-exercise-
trends-survey-2014
Jul 25, 2015— Lululemon branded beer announced http://www.thestar.com/life/2015/07/21/from-duds-to-suds-lululemon-going-
into-beer-business.html
http://www.cbc.ca/news/canada/british-columbia/lululemon-branded-beer-
hits-store-shelves-this-summer-1.3161000
http://www.theguardian.com/business/2015/jul/24/lululemon-branded-beer-
can-cartoon-totem-pole
Jun 29, 2015— Announced recall for select drawstring products. http://www.theglobeandmail.com/report-on-business/lululemon-recalls-
drawstrings-from-hoodies-after-they-lash-faces/article25112115/
http://www.fool.com/investing/general/2015/07/08/lululemon-athletica-inc-
issues-another-product-rec.aspx
Jun 25, 2015— Names Miguel Almedia Executive Vice Presi-
dent
http://investor.lululemon.com/releasedetail.cfm?ReleaseID=919574
Mar 26, 2015— Earnings Call w/ Outlook http://files.shareholder.com/downloads/LULU/4156765498x0x818138/
EC275B0E-84B6-4AE7-8136-50FB05287D15/LULU-4Q14_Transcript.pdf
Feb 02, 2015— Founder Chip Wilson resigns from board http://www.theglobeandmail.com/report-on-business/founder-chip-wilson-
looking-at-sale-of-entire-lululemon-stake/article24913579/
North America, Europe Are the Principal Domains of the
Upper-Middle Income
http://www.pewglobal.org/2015/07/08/a-global-middle-class-is-more-promise
-than-reality/pg-2015-07-08_globalclass-10/
Ancient practice of yoga now a growth industry http://www.usatoday.com/story/news/nation/2015/03/01/yoga-health-
fitness-trends/23881391/
Most Used Mind & Body Practices NHIS https://nccih.nih.gov/research/statistics/NHIS/2012/mind-body/yoga
IBISWorld Industry Report 71394 - University Subscription—
Table 2.3.5. Personal Consumption Expenditures by Major
Type of Product
http://www.bea.gov/iTable/iTable.cfm?
reqid=9&step=1&acrdn=2#reqid=9&step=3&isuri=1&903=65
Fitness for Foreigners
How people exercise in China, Pakistan, Sudan, and Sweden
http://www.slate.com/articles/life/fitness/2011/01/
fitness_for_foreigners.html
Outdoor Participation Report http://www.outdoorfoundation.org/pdf/ResearchParticipation2014.pdf
Health And Wellness A European Consumer Obsession? http://www.marketresearchworld.net/content/view/2201/77/
Nike Just Launched A Direct Threat To Lululemon http://www.businessinsider.com/nike-just-launched-a-threat-to-lululemon-
2014-11
Facts about Physical Activity http://www.cdc.gov/physicalactivity/data/facts.html