lumban raja saputra johannes anhorn ... lumban raja adang saputra johannes anhorn presented at the...
TRANSCRIPT
Denny LUMBAN RAJA
Adang SAPUTRA
Johannes ANHORN
Presented at th
e FIG W
orking Week 2017,
May 29 - June 2, 2
017 in Helsinki, F
inland

• Most of the surroundings of Cipongkor is dominated by very high
soil erosion potential
• GIS is capable to give a visual impression of the main factors
contributing to soil erosion
• Increasing soil erosion and haphazard human interventions at the
study area leading to destabilized slopes do aggravate the
potential for damaging large scale landslide events
MAIN RESULTS

• West Java Province in Indonesia is the region with the most
frequent landslide occurrence, especially during the rainy season
• Cipongkor region is a mountainous landscape area. Medium to
steep slopes are controlled by geological structures reflected by
active faults, such as the Cimandiri and Lembang fault line.
Fertile soils and thick weathering of rocks attracts people to live in
the study area.
• The geological conditions, existing landuse (85% of agriculture
and plantation), high rainfall, large soil thickness, and steep
slopes support the occurrence of erosion and stimulate landslide
occurrence.
BACKGROUND

Coordinate Area : 6o53’00” – 7o00’00” LS dan 107o18’00” – 107o26’00” BT
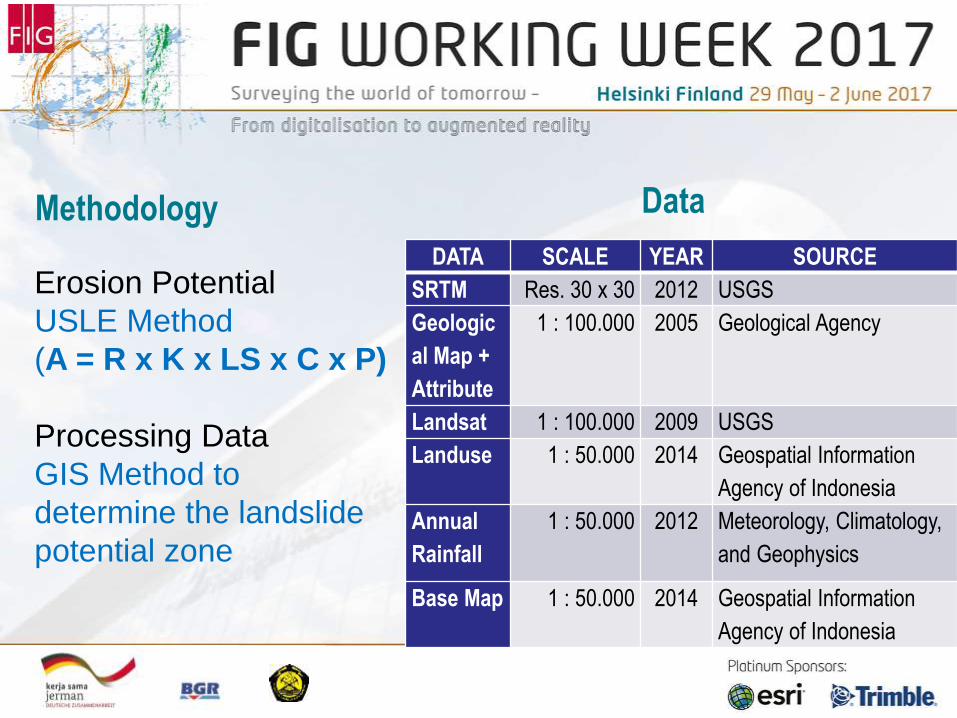
DATA SCALE YEAR SOURCE
SRTM Res. 30 x 30 2012 USGS
Geologic
al Map +
Attribute
1 : 100.000 2005 Geological Agency
Landsat 1 : 100.000 2009 USGS
Landuse 1 : 50.000 2014 Geospatial Information
Agency of Indonesia
Annual
Rainfall
1 : 50.000 2012 Meteorology, Climatology,
and Geophysics
Base Map 1 : 50.000 2014 Geospatial Information
Agency of Indonesia
Data
Erosion Potential
USLE Method
(A = R x K x LS x C x P)
Processing Data
GIS Method to
determine the landslide
potential zone
Methodology

Rainfall data SRTM Satellite Imagery Geology Map
Rainfall
Map
Soil
Texture
Land
use
R K
Slope
length
Steep-
ness
C
Classification
Soil Erosion
Map
Base Map
LS
USLE
Field Survey
Verification
Preparation
Supporting Data
FL
OW
CH
AR
T O
F
ME
TH
OD
OL
OG
Y
P

USLE methode was used to assess erosion risk
USLE Formula: A = R x K x LS x C x P
where:
A : represents the potential long term average
annual soil loss in tons per hectare (ton/ha/yr);
R : rainfall–runoff erosivity factor (mm/yr );
K : soil erodibility factor (ton/ha);
LS : slope length–steepness factor (dimensionless);
C : crop management factor (dimensionless);
P : is the land management practice factor (dimensionless).

USLE methode was used to assess erosion risk
Rainfall Index
EI30 is defined as the product of kinetic
energy of rainfall and the maximum
contiguous 30 minutes rainfall intensity
during the rainfall event
EI30 year = 0,41 x R1,09
(Wiersum and Ambar 1979; in Ambar; 1986)

Soil erodibility index (K) No Soil Texture K
1. Clay 0,02
2. Loam clay 0,04
3. Loam sand 0,30
4. Sillty 0,20
5. Sandy 0,70
Crop- and vegetation cover index (CP) (Ministry of Forestry, 1985)
No Class name CP
1. Settlement 0,60
2. Mixed Garden 0,30
3. Paddy Field 0,05
4. Dry fields 0,75
5. Garden 0,40
6. Forest 0,03

Slope gradient and
Slope Length Index (LS) (Ministry of Forestry 1986)
No Slope (%) LS
1. 0 – 5 0,25
2. 5 – 15 1,20
3. 15 - 35 4,25
4. 35 - 50 7,50
5. > 50 12,0
𝐿𝑆 = 𝑃𝑜𝑤( 𝐹𝑙𝑜𝑤𝐴𝑐𝑐 𝑥 𝑟𝑒𝑠𝑜𝑙𝑢𝑡𝑖𝑜𝑛
22.1 𝑥 0.6) 𝑥 𝑃𝑜𝑤 (
sin 𝑠𝑙𝑜𝑝𝑒 𝑔𝑟𝑎𝑑𝑖𝑒𝑛𝑡 𝑥 0.001745
0.09 𝑥 1.3)

Classification of erosion risk level (Ministry of Forestry 1998)
No Soil loss
(ton/ha/th)
Class of
Erosion Erosion Level
1. < 20 I Very low
2. 20 – 50 II Low
3. 50 – 250 III Moderate
4. 250 – 1000 IV High
5. > 1000 V Very high
STUDY
RESULT

STUDY
RESULT

Points of Field Survey
No. Lat Long Location Geology Slope
Ero-1 -6.99 107.320 Cilabodas Village Breksi/Andesit 54º
Ero-2 -7.00 107.369 CicangkapGirang Tuffa, Sand 65º
Ero-3 -7.00 107.416 Tugu Batas Sand 40º
Ero-4 -6.95 107.342 M. Masigit Andesit 45º
Ero-5 -6.96 107.342 BojongHaur Tuffa 36º
Ero-6 -6.97 107.340 Sodong Village Tuffa 43º
Ero-7 -6.92 107.349 Saguling Waterbody Tuffa, Sand 60º
Ero-8 -6.89 107.358 Saguling Waterbody Tuffa, Sand 60º
Ero-9 -6.89 107.334 Saguling Waterbody Tuffa, Sand 60º

Erosion in the roadside
Village Saguling, Kec. Cipongkor Massive landslides in the roadside
Cipongkor-Saguling

Conclusions
• Spatial modeling with GIS is capable to give a visual impression of the
main factors contributing to soil erosion
• Most of the surroundings of Cipongkor is dominated by very high soil
erosion potential.
• Human activity is one of the main factors affecting erosion potential in
the study area.
• Increasing soil erosion and haphazard human interventions leading to
destabilized slopes do aggravate the potential for damaging large scale
landslide events.
