lunar ionosphere exploration method using auroral ... · lunar ionosphere exploration method using...
TRANSCRIPT

Earth Planets Space, 63, 47–56, 2011
Lunar ionosphere exploration methodusing auroral kilometric radiation
Yoshitaka Goto1, Takamasa Fujimoto1, Yoshiya Kasahara1,Atsushi Kumamoto2, and Takayuki Ono2
1Kanazawa University, Kanazawa, Japan2Tohoku University, Sendai, Japan
(Received June 3, 2009; Revised November 10, 2010; Accepted January 14, 2011; Online published February 21, 2011)
The evidence of a lunar ionosphere provided by radio occultation experiments performed by the Sovietspacecraft Luna 19 and 22 has been controversial for the past three decades because the observed large densityis difficult to explain theoretically without magnetic shielding from the solar wind. The KAGUYA missionprovided an opportunity to investigate the lunar ionosphere with another method. The natural plasma wavereceiver (NPW) and waveform capture (WFC) instruments, which are subsystems of the lunar radar sounder(LRS) on board the lunar orbiter KAGUYA, frequently observe auroral kilometric radiation (AKR) propagatingfrom the Earth. The dynamic spectra of the AKR sometimes exhibit a clear interference pattern that is caused byphase differences between direct waves and waves reflected on a lunar surface or a lunar ionosphere if it exists.It was hypothesized that the electron density profiles above the lunar surface could be evaluated by comparingthe observed interference pattern with the theoretical interference patterns constructed from the profiles withray tracing. This method provides a new approach to examining the lunar ionosphere that does not involve theconventional radio occultation technique.Key words: KAGUYA, lunar ionosphere, auroral kilometric radiation.
1. IntroductionThe lunar atmosphere is extremely tenuous compared to
the Earth’s atmosphere. The gas concentration, which con-sists of helium, argon, etc. (Stern, 1999), is only approxi-mately 2 × 105 cm−3 during the lunar night and 104 cm−3
during the lunar day (Hodges, 1975). Like the Earth’s iono-sphere, these gas particles are ionized by solar ultravioletradiation to form the ionosphere. In theory, however, thepeak density in the lunar ionosphere is considered to be lessthan or equal to the solar wind density. Nevertheless, it wasreported that 500 to 1000 cm−3 electron densities were ob-served at altitudes of 5 to 10 km by the Soviet Luna 19 and22 in the 1970s (Vasil’ev et al., 1974; Vyshlov and Savich,1979). In this observation, an occultation technique wasused to measure the phase shifts of radio waves due to elec-tron densities around the Moon. This result remains con-troversial, however, because the observed large density isdifficult to explain theoretically without magnetic shieldingfrom the solar wind.
Because the Moon does not have a strong global mag-netic field like the Earth, the interplanetary magnetic field(IMF) principally determines the magnetic field aroundthe Moon. In local field structures, however, there aresome regions that have strong magnetic fields, called mini-magnetospheres (Hood and Schubert, 1980; Hood et al.,
Copyright c© The Society of Geomagnetism and Earth, Planetary and Space Sci-ences (SGEPSS); The Seismological Society of Japan; The Volcanological Societyof Japan; The Geodetic Society of Japan; The Japanese Society for Planetary Sci-ences; TERRAPUB.
doi:10.5047/eps.2011.01.005
2001; Kurata et al., 2005). The dense plasma layers maybe maintained by these strong fields. Alternatively, near-surface electric fields could possibly loft charged particlesup to higher altitudes (Stubbs et al., 2006). The highdensities observed by the Luna are therefore a result of acurrently unknown maintainable or transfer mechanism ofcharged particles.
During the KAGUYA mission, as in the Luna experi-ments, an electron density profile above the lunar surfacewas observed by a radio occultation technique using a Vstarsub-satellite (Imamura et al., 2008). In this experiment, co-herent S-band and X-band signals were employed to mea-sure the total electron content from the satellite to a ter-restrial tracking station. Because the density of the lunarionosphere can be obtained by subtracting the effects ofthe Earth’s ionosphere, the estimation accuracy of this tech-nique depends on that of the Earth’s ionosphere.
The KAGUYA continuously observed natural waves us-ing the natural plasma wave receiver (NPW) and the wave-form capture (WFC) instruments, which are subsystems ofthe lunar radar sounder (LRS) (Kasahara et al., 2008; Onoet al., 2008, 2010). Auroral kilometric radiation (AKR),whose source is the Earth’s polar regions, is one of thesewaves. The AKR frequency is considered to correspond tothe local electron gyro frequency at the source on the auro-ral field lines (Morioka et al., 2005). The source of the AKRin a frequency range from 100 to 500 kHz is, therefore, lo-cated at an altitude range from 3,500 to 10,000 km. As de-picted in the time-frequency spectrogram in Fig. 1, the AKRobserved by the KAGUYA sometimes includes a clear inter-
47

48 Y. GOTO et al.: LUNAR IONOSPHERE EXPLORATION METHOD
Fig. 1. An example of an interference pattern on the AKR observed by LRS-NPW (2007/12/23 12:58–13:01). The horizontal axis indicates observationtime (UT) and the vertical axis indicates frequency in kilohertz. The wave intensity at each frequency point is represented by color. Additional blacklines are used for later comparison with theoretical stripes.
Fig. 2. Schematic chart of observation of the interference pattern on the AKR by the KAGUYA.
ference pattern. This pattern is caused by phase differencesbetween directly arrived waves and waves reflected on ornear the lunar surface, as illustrated in Fig. 2. Actually, thepeak electron densities observed by the Luna correspond toplasma frequencies from 200 to 450 kHz. Reflection alwaysoccurs on such density layers when the AKR frequency islower than these plasma frequencies. However, even whenthe AKR frequency is higher than the plasma frequencies,reflection occurs in the case of oblique incidences. There-fore, the interference patterns signify the existence of thelunar ionosphere in certain conditions.
In this paper, a new exploration method of the lunar iono-sphere using the AKR is presented. A theoretical interfer-ence pattern of the AKR for a given electron density pro-file can be constructed by calculating the phase delays ofreflected waves to direct waves with ray tracing. Then, pos-
sible density profiles can be evaluated by comparing the ob-served interference patterns with the theoretical ones recon-structed for the profiles. This is a new approach to exam-ining the lunar ionosphere that is not based on the radiooccultation technique.
2. Instrumentation and DataThe KAGUYA is a lunar orbiter that is placed in a polar
orbit with an inclination of 90◦ and a nominal altitude of100 km from the lunar surface. The orbit covers all localtimes in half a month. The NPW and WFC, both of whichreceive natural plasma waves, are subsystems of LRS onboard the KAGUYA. Both receivers obtain electric fieldspectrograms and waveforms with two orthogonal 30 m tip-to-tip antennas. The NPW covers a frequency range from20 kHz to 10 MHz, and the WFC covers that from 100 Hz

Y. GOTO et al.: LUNAR IONOSPHERE EXPLORATION METHOD 49
Fig. 3. Two-dimensional plane for the AKR ray tracing.
to 1 MHz. Various kinds of observation modes are availablein both receivers. Although waveform observation by theNPW is the best at analyzing the interference pattern ofthe AKR in terms of time and frequency resolutions, datacoverage is unfortunately not very extensive. In contrast,although the resolutions of the WFC spectrogram are poor,the amount of data is sufficient to enable statistical study.
From the upper hybrid resonance frequency in the spec-trogram of the WFC, in situ electron density is estimatedalong a satellite trajectory. The observed density exhibits aclear day-night asymmetry. The day-side density is gener-ally Ne = 1–5 cm−3 whereas the night-side density is Ne <
0.1 cm−3. The day-side density is considered to denote thesolar wind density and the night-side density is consistentwith the lunar wake.
Magnetic field strength at the KAGUYA trajectory isgoverned by the IMF when the KAGUYA is not locatedwithin the Earth’s magnetosphere. The strength is usuallyless than 10 nT, and thus, the electron gyro frequency, whichis calculated as frequency less than 280 Hz, is sufficientlysmall relative to the AKR frequency. Therefore, the plasmaenvironment around the Moon is considered to be isotropicfor the AKR. The refractive index of the AKR wave canbe regarded as a function of only in situ electron plasmafrequency.
3. Theoretical Calculation of Phase DifferenceA principal problem in exploring the lunar ionosphere
using the AKR is calculating theoretical phase patterns ac-curately. For this purpose, ray tracing was used. In thissection, after describing the ray tracing, phase maps areuniquely constructed for typical electron density profilesobserved by the Luna.3.1 Ray tracing
The interference pattern of the AKR is caused by phasedifferences between direct and reflected waves. Thesephase differences are determined by path differences be-tween these two waves and the reflectance of the lunar sur-face. If the AKR propagates in a mode that approximates
light speed around the Moon, the path differences can begeometrically calculated. However, if the dispersion ofplasma must be taken into account, ray tracing is convenientfor calculating the path difference accurately. Because thepurpose of ray tracing here is to estimate the propagationdelay of the reflected waves to the direct waves, their prop-agations near the Earth are not dealt with strictly. Thesewaves propagate along almost the same trajectory there.Therefore, the ray tracing is started from where the AKRbegins to propagate along a straight path. This means thatthe starting position of the ray tracing is not a real wavesource but a virtual one. The validity of the virtual sourceis discussed in 3.4.
In Fig. 3, a two-dimensional orthogonal coordinate sys-tem X Z is defined as a ray tracing space, where the centerof the Moon is at the coordinate origin O , a virtual wavesource S is on the X axis and the KAGUYA location P is onthe X Z plane. An angle η ≡ � POS to denote the positionof the KAGUYA is also defined. In the numerical calcu-lation of the ray tracing, the orthogonal coordinate system(X, Z) is converted into a polar coordinate system (r, φ) byfunctions of
r =√
X2 + Z2, φ = tan−1(Z/X), (1)
for convenience. Then, the position of a traced ray is repre-sented by the distance from the origin r and the angle fromthe X axis φ, as depicted in Fig. 3. The wave normal angleof the ray is defined by the angle δ between the wave normalvector and the position vector (r, φ).
Propagation paths are calculated recursively from an ini-tial position (r0, φ0) and an initial wave normal angle δ0
using the following differential equations (Kimura et al.,1985):
dr
dτ= c
2π f n2
(n cos δ + ∂n
∂δsin δ
), (2)
dφ
dτ= c
2π f n2r
(n sin δ − ∂n
∂δcos δ
), (3)

50 Y. GOTO et al.: LUNAR IONOSPHERE EXPLORATION METHOD
Fig. 4. Electron density model profiles according to Luna 19 and 22 observations (Profile 0, 1, 2) and a model profile with no ionosphere (Profile 4).
dδ
dτ= c
2π f n2r
{∂n
∂φcos δ −
(r∂n
∂r+ n
)sin δ
}, (4)
where τ is a non-dimensional parameter that is proportionalto a distance along the propagation path. f is a wavefrequency and n is a refractive index, which is representedby the following equation in isotropic plasma (Stix, 1962):
n =√
1 − (fp/ f
)2(5)
where fp is in situ plasma frequency. In this study, a modi-fied Adams’ method was adopted to solve these differentialequations (Shampine and Gordon, 1975).3.2 Time delay of reflected AKR for density profiles
observed by the luna missionIn order to examine the feasibility of the new approach,
three typical vertical density profiles (Profile 0, 1, 2) fromthe Luna observations and one vertically uniform profileof 5 cm−3 (Profile 3), as illustrated in Fig. 4, were as-sumed. Profile 3 assumes the background solar wind elec-tron density. The former three profiles have peak densitiesof 2,200 cm−3, 750 cm−3, and 450 cm−3 at an altitude of5 km, respectively. In each model, density falls into the so-lar wind density of 5 cm−3 smoothly at high altitudes. Forsimplicity, all profiles are assumed to be spherically sym-metric. The AKR is reflected on a layer whose plasma fre-quency corresponds to wave frequency when a sufficientlydense ionosphere exists. In contrast, the AKR is reflectedon the lunar surface when the lunar ionosphere does notexist or when it is too tenuous. In this case, attenuation
and a phase shift due to the reflection occur to the wave. Inthis study, relative permittivity and conductivity on the lunarsurface was assumed to be ε = 10 and σ = 10−13 −1 m−1,respectively (Carrier et al., 1991).
Ray tracing was performed from an initial position repre-sented as S in Fig. 3. The initial distance r0 from the centerof the Moon was set to be the distance between the Earthand the Moon at the period of every AKR observation. Thedistance was not so sensitive to time delays of the reflectedwaves to direct waves. The altitude of the KAGUYA wasassumed to be 100 km here. Because the altitude actuallyvaries within 100 ± 20 km, it is necessary to recalculatethe theoretical delays for a real altitude in application. Thepropagation times of the direct and reflected waves to theobservation location P were calculated by changing the ini-tial wave normal angle δ0 until the ray path intercepted thelocation P .
Figures 5, 6, and 7 depict the time delays for satelliteposition η for wave frequencies of 100 kHz, 200 kHz, and400 kHz, respectively. In the figures, there is no differencebetween time delays for 100 kHz, 200 kHz and 400 kHz forProfile 3, as represented by solid lines. This is due to theuniform density profile and frequency-independent reflec-tion on the lunar surface because of a small conductivity.The delay is long for small η. The longest delay is foundwhen the AKR comes from the zenith direction (η = 0◦).This tendency can be easily understood because the differ-ence in path lengths between direct and reflected waves be-comes small as η becomes larger. The direct and reflectedwaves cannot be distinguished around η = 110◦ because the

Y. GOTO et al.: LUNAR IONOSPHERE EXPLORATION METHOD 51
Fig. 5. Time delay of reflected wave to direct wave for satellite position η for 100 kHz.
Fig. 6. Time delay of reflected wave to direct wave for satellite position η for 200 kHz.
Fig. 7. Time delay of reflected wave to direct wave for satellite position η for 400 kHz.

52 Y. GOTO et al.: LUNAR IONOSPHERE EXPLORATION METHOD
Fig. 8. Theoretically constructed phase maps for Profile 0, 1, 2, and 3. The direct and reflected waves are inphase when the phase difference is 0 or 2π .
observation point is concealed behind the Moon.From the result of f = 100 kHz, the delay becomes
shorter in the following order: Profile 1, 0, 2, 3. The plasmafrequency fp is 100 kHz at altitudes of 34 km, 27 km, and23 km for Profile 1, 0, and 2, respectively. Thus, the or-der is considered to be determined by the reflection alti-tude. When the AKR comes from the zenith direction forProfile 1, the delay is 0.5 ms. This takes 10% or more addi-tional time compared to the case in which the wave propa-gates to the reflection altitude at the light speed because thegroup refractive indices above the reflection point are largerthan unity. The same tendency can be observed for Profile0 and 2.
Next, from the result of f = 200 kHz, the delay for eachprofile is in the same order as that of 100 kHz for 13◦ < η
whereas the delays for Profile 0 and 1 are counterchangedfor η < 13◦. Although the plasma frequency is 200 kHzat 20 km in both Profile 0 and 1, the delay for Profile 1 islonger than that for Profile 0 for η ∼ 0◦. This is becausethe group refractive index for Profile 1 is larger than thatfor Profile 0 above 20 km. For oblique incidence, however,the reflection altitude for Profile 1 is higher than that forProfile 0, in accordance with Snell’s law. Thus, the delayfor Profile 0 is longer than Profile 1 for large η. Because thepeak plasma frequency for Profile 2 is not higher than 200kHz, the wave is considered to reach the lunar surface forη ∼ 0◦. The delay for Profile 2, however, does not agreewith that for Profile 3, even when η = 0◦.
Finally, from the result of f = 400 kHz, all delay curves
for Profile 0, 1, and 2 approach that for Profile 3. Becausefp/ f is relatively small compared to that for f = 100 kHzand 200 kHz, the refractive index of the wave approachesunity and the group velocity approaches light speed. Forη ∼ 0◦, the ionospheric reflection occurs only in Profile 0and the surface reflection occurs in Profile 1, 2, and 3. Itshould be noted that, in the case of the surface reflection, thedelay for Profile 1 and 2 never agrees with that for Profile 3.
On the basis of these results, it is concluded that the de-lay curve for η signifies both reflection altitude and verticaldensity profiles. The delay is different even if the reflectionaltitude is the same because the electron density above thealtitude influences the wave propagation. In addition, foroblique incidence, even when the peak of the electron den-sity profile is not very large, ionospheric reflection occurs.3.3 Construction of the phase difference map
The presence of the interference pattern observed by theKAGUYA implies that there is a standing wave betweenthe lunar surface and the observation altitude. This patternis not determined by an initial phase at a wave source butby an electron density profile above the lunar surface andits reflectivity.
The phase difference between the direct and reflectedwaves can be calculated by multiplying the delay to thecorresponding angular frequency. The phase shift due toreflectance of the lunar surface is added if necessary. Basedon these calculations, “phase maps” for wave frequency fand satellite position η can be obtained, as shown in Fig. 8.Each map represents the phase difference for Profile 0, 1,
Y. GOTO et al.: LUNAR IONOSPHERE EXPLORATION METHOD 53
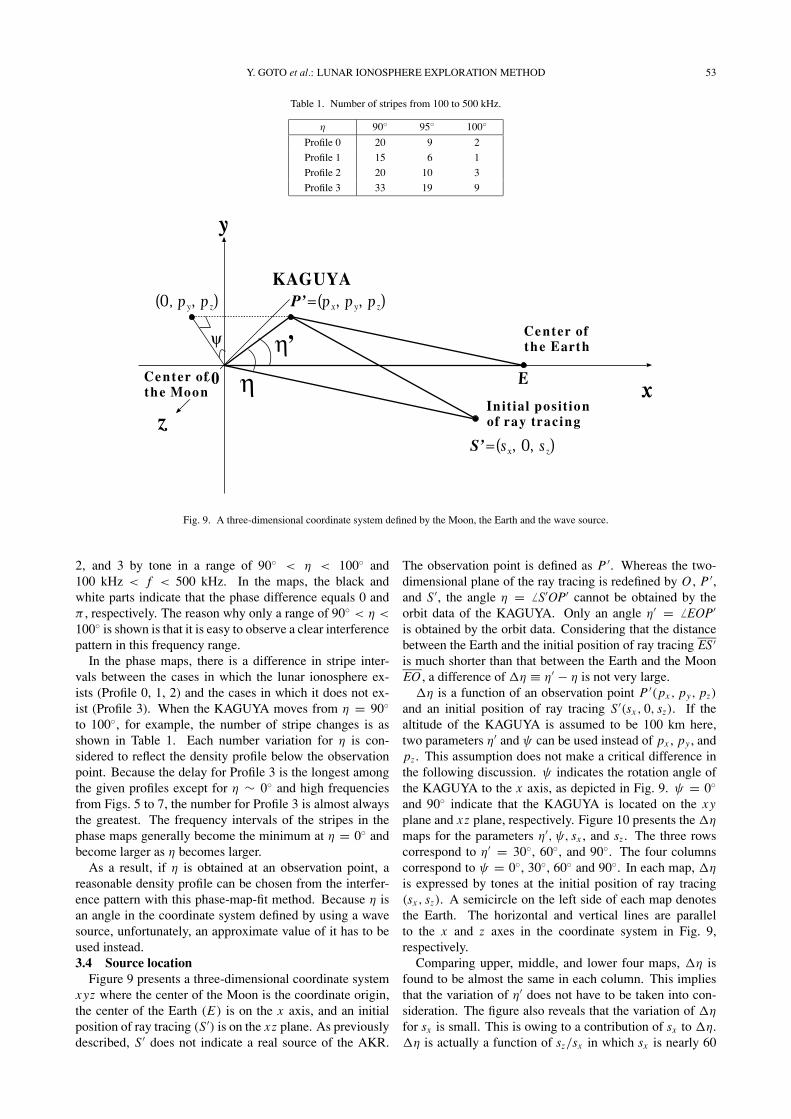
Table 1. Number of stripes from 100 to 500 kHz.
η 90◦ 95◦ 100◦
Profile 0 20 9 2
Profile 1 15 6 1
Profile 2 20 10 3
Profile 3 33 19 9
Fig. 9. A three-dimensional coordinate system defined by the Moon, the Earth and the wave source.
2, and 3 by tone in a range of 90◦ < η < 100◦ and100 kHz < f < 500 kHz. In the maps, the black andwhite parts indicate that the phase difference equals 0 andπ , respectively. The reason why only a range of 90◦ < η <
100◦ is shown is that it is easy to observe a clear interferencepattern in this frequency range.
In the phase maps, there is a difference in stripe inter-vals between the cases in which the lunar ionosphere ex-ists (Profile 0, 1, 2) and the cases in which it does not ex-ist (Profile 3). When the KAGUYA moves from η = 90◦
to 100◦, for example, the number of stripe changes is asshown in Table 1. Each number variation for η is con-sidered to reflect the density profile below the observationpoint. Because the delay for Profile 3 is the longest amongthe given profiles except for η ∼ 0◦ and high frequenciesfrom Figs. 5 to 7, the number for Profile 3 is almost alwaysthe greatest. The frequency intervals of the stripes in thephase maps generally become the minimum at η = 0◦ andbecome larger as η becomes larger.
As a result, if η is obtained at an observation point, areasonable density profile can be chosen from the interfer-ence pattern with this phase-map-fit method. Because η isan angle in the coordinate system defined by using a wavesource, unfortunately, an approximate value of it has to beused instead.3.4 Source location
Figure 9 presents a three-dimensional coordinate systemxyz where the center of the Moon is the coordinate origin,the center of the Earth (E) is on the x axis, and an initialposition of ray tracing (S′) is on the xz plane. As previouslydescribed, S′ does not indicate a real source of the AKR.
The observation point is defined as P ′. Whereas the two-dimensional plane of the ray tracing is redefined by O , P ′,and S′, the angle η = � S′OP′ cannot be obtained by theorbit data of the KAGUYA. Only an angle η′ = � EOP′
is obtained by the orbit data. Considering that the distancebetween the Earth and the initial position of ray tracing ES′is much shorter than that between the Earth and the MoonEO , a difference of �η ≡ η′ − η is not very large.
�η is a function of an observation point P ′(px , py, pz)
and an initial position of ray tracing S′(sx , 0, sz). If thealtitude of the KAGUYA is assumed to be 100 km here,two parameters η′ and ψ can be used instead of px , py , andpz . This assumption does not make a critical difference inthe following discussion. ψ indicates the rotation angle ofthe KAGUYA to the x axis, as depicted in Fig. 9. ψ = 0◦
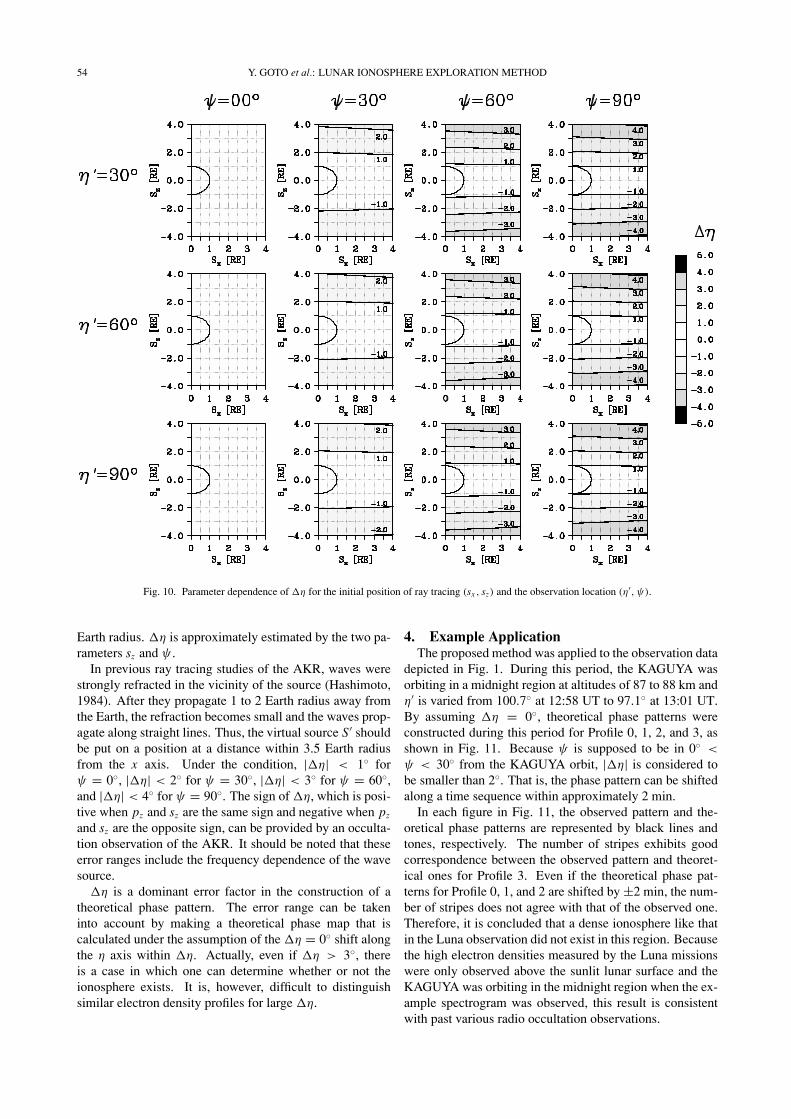
and 90◦ indicate that the KAGUYA is located on the xyplane and xz plane, respectively. Figure 10 presents the �η
maps for the parameters η′, ψ, sx , and sz . The three rowscorrespond to η′ = 30◦, 60◦, and 90◦. The four columnscorrespond to ψ = 0◦, 30◦, 60◦ and 90◦. In each map, �η
is expressed by tones at the initial position of ray tracing(sx , sz). A semicircle on the left side of each map denotesthe Earth. The horizontal and vertical lines are parallelto the x and z axes in the coordinate system in Fig. 9,respectively.
Comparing upper, middle, and lower four maps, �η isfound to be almost the same in each column. This impliesthat the variation of η′ does not have to be taken into con-sideration. The figure also reveals that the variation of �η
for sx is small. This is owing to a contribution of sx to �η.�η is actually a function of sz/sx in which sx is nearly 60
54 Y. GOTO et al.: LUNAR IONOSPHERE EXPLORATION METHOD
Fig. 10. Parameter dependence of �η for the initial position of ray tracing (sx , sz) and the observation location (η′, ψ).
Earth radius. �η is approximately estimated by the two pa-rameters sz and ψ .
In previous ray tracing studies of the AKR, waves werestrongly refracted in the vicinity of the source (Hashimoto,1984). After they propagate 1 to 2 Earth radius away fromthe Earth, the refraction becomes small and the waves prop-agate along straight lines. Thus, the virtual source S′ shouldbe put on a position at a distance within 3.5 Earth radiusfrom the x axis. Under the condition, |�η| < 1◦ forψ = 0◦, |�η| < 2◦ for ψ = 30◦, |�η| < 3◦ for ψ = 60◦,and |�η| < 4◦ for ψ = 90◦. The sign of �η, which is posi-tive when pz and sz are the same sign and negative when pz
and sz are the opposite sign, can be provided by an occulta-tion observation of the AKR. It should be noted that theseerror ranges include the frequency dependence of the wavesource.
�η is a dominant error factor in the construction of atheoretical phase pattern. The error range can be takeninto account by making a theoretical phase map that iscalculated under the assumption of the �η = 0◦ shift alongthe η axis within �η. Actually, even if �η > 3◦, thereis a case in which one can determine whether or not theionosphere exists. It is, however, difficult to distinguishsimilar electron density profiles for large �η.
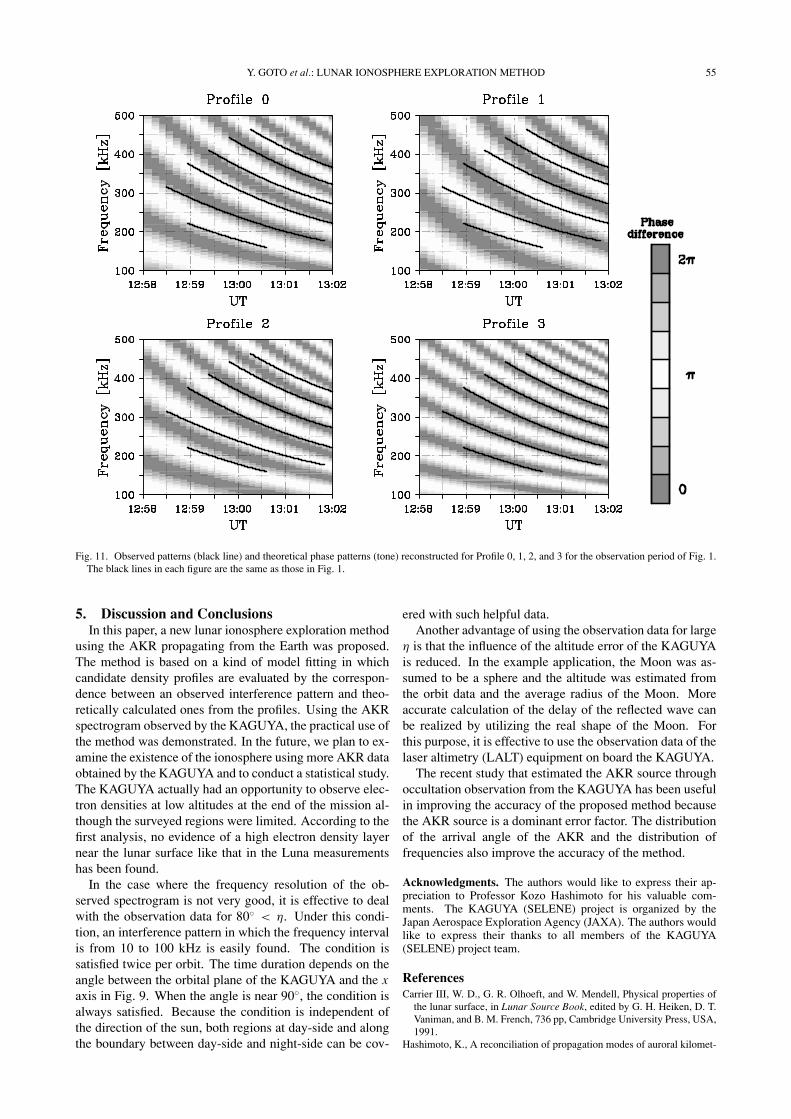
4. Example ApplicationThe proposed method was applied to the observation data
depicted in Fig. 1. During this period, the KAGUYA wasorbiting in a midnight region at altitudes of 87 to 88 km andη′ is varied from 100.7◦ at 12:58 UT to 97.1◦ at 13:01 UT.By assuming �η = 0◦, theoretical phase patterns wereconstructed during this period for Profile 0, 1, 2, and 3, asshown in Fig. 11. Because ψ is supposed to be in 0◦ <
ψ < 30◦ from the KAGUYA orbit, |�η| is considered tobe smaller than 2◦. That is, the phase pattern can be shiftedalong a time sequence within approximately 2 min.
In each figure in Fig. 11, the observed pattern and the-oretical phase patterns are represented by black lines andtones, respectively. The number of stripes exhibits goodcorrespondence between the observed pattern and theoret-ical ones for Profile 3. Even if the theoretical phase pat-terns for Profile 0, 1, and 2 are shifted by ±2 min, the num-ber of stripes does not agree with that of the observed one.Therefore, it is concluded that a dense ionosphere like thatin the Luna observation did not exist in this region. Becausethe high electron densities measured by the Luna missionswere only observed above the sunlit lunar surface and theKAGUYA was orbiting in the midnight region when the ex-ample spectrogram was observed, this result is consistentwith past various radio occultation observations.
Y. GOTO et al.: LUNAR IONOSPHERE EXPLORATION METHOD 55
Fig. 11. Observed patterns (black line) and theoretical phase patterns (tone) reconstructed for Profile 0, 1, 2, and 3 for the observation period of Fig. 1.The black lines in each figure are the same as those in Fig. 1.
5. Discussion and ConclusionsIn this paper, a new lunar ionosphere exploration method
using the AKR propagating from the Earth was proposed.The method is based on a kind of model fitting in whichcandidate density profiles are evaluated by the correspon-dence between an observed interference pattern and theo-retically calculated ones from the profiles. Using the AKRspectrogram observed by the KAGUYA, the practical use ofthe method was demonstrated. In the future, we plan to ex-amine the existence of the ionosphere using more AKR dataobtained by the KAGUYA and to conduct a statistical study.The KAGUYA actually had an opportunity to observe elec-tron densities at low altitudes at the end of the mission al-though the surveyed regions were limited. According to thefirst analysis, no evidence of a high electron density layernear the lunar surface like that in the Luna measurementshas been found.
In the case where the frequency resolution of the ob-served spectrogram is not very good, it is effective to dealwith the observation data for 80◦ < η. Under this condi-tion, an interference pattern in which the frequency intervalis from 10 to 100 kHz is easily found. The condition issatisfied twice per orbit. The time duration depends on theangle between the orbital plane of the KAGUYA and the xaxis in Fig. 9. When the angle is near 90◦, the condition isalways satisfied. Because the condition is independent ofthe direction of the sun, both regions at day-side and alongthe boundary between day-side and night-side can be cov-
ered with such helpful data.Another advantage of using the observation data for large
η is that the influence of the altitude error of the KAGUYAis reduced. In the example application, the Moon was as-sumed to be a sphere and the altitude was estimated fromthe orbit data and the average radius of the Moon. Moreaccurate calculation of the delay of the reflected wave canbe realized by utilizing the real shape of the Moon. Forthis purpose, it is effective to use the observation data of thelaser altimetry (LALT) equipment on board the KAGUYA.
The recent study that estimated the AKR source throughoccultation observation from the KAGUYA has been usefulin improving the accuracy of the proposed method becausethe AKR source is a dominant error factor. The distributionof the arrival angle of the AKR and the distribution offrequencies also improve the accuracy of the method.
Acknowledgments. The authors would like to express their ap-preciation to Professor Kozo Hashimoto for his valuable com-ments. The KAGUYA (SELENE) project is organized by theJapan Aerospace Exploration Agency (JAXA). The authors wouldlike to express their thanks to all members of the KAGUYA(SELENE) project team.
ReferencesCarrier III, W. D., G. R. Olhoeft, and W. Mendell, Physical properties of
the lunar surface, in Lunar Source Book, edited by G. H. Heiken, D. T.Vaniman, and B. M. French, 736 pp, Cambridge University Press, USA,1991.
Hashimoto, K., A reconciliation of propagation modes of auroral kilomet-

56 Y. GOTO et al.: LUNAR IONOSPHERE EXPLORATION METHOD
ric radiation, J. Geophys. Res., 89(A9), 7459–7466, 1984.Hodges, R. R. Jr., Formation of the lunar atmosphere, The Moon, 14, 139–
157, 1975.Hood, L. L. and G. Schubert, Lunar magnetic anomalies and surface opti-
cal properties, Science, 208, 49–51, 1980.Hood, L. L., A. Zakharian, J. Halekas, D. L. Mitchell, R. P. Lin, M. H.
Acuna, and A. B. Binder, Initial mapping and interpretation of lunarcrustal magnetic anomalies using Lunar Prospector magnetometer data,J. Geophys. Res., 106, 27825–27839, 2001.
Imamura, T., K.-I. Oyama, T. Iwata, Y. Kono, K. Matsumoto, Q. Liu, H.Noda, Y. Futaana, and A. Nabatov, The possibility of studying the lunarionosphere with the SELENE radio science experiment, Earth PlanetsSpace, 60, 387–390, 2008.
Kasahara, Y., Y. Goto, K. Hashimoto, T. Imachi, A. Kumamoto, T. Ono,and H. Matsumoto, Plasma wave observation using waveform capturein the Lunar Radar Sounder on board the SELENE spacecraft, EarthPlanets Space, 60, 341–351, 2008.
Kimura, I., T. Matsuo, M. Tsuda, and K. Yamauchi, Three dimensionalray tracing of whistler mode waves in a non-dipolar magnetosphere, J.Geomag. Geoelectr., 37, 945–956, 1985.
Kurata, M., H. Tsunakawa, Y. Saito, H. Shibuya, M. Matsushima, andH. Shimizu, Mini-magnetosphere over the Reiner Gamma magneticanomaly region on the Moon, Geophys. Res. Lett., 32, L24205,doi:10.1029/2005GL0244097, 2005.
Morioka, A., Y. S. Miyoshi, F. Tsuchiya, H. Misawa, A. Kumamoto, H.Oya, H. Matsumoto, K. Hashimoto, and T. Mukai, Auroral kilometricradiation activity during magnetically quiet periods, J. Geophys. Res.,110, A11223, doi:10.1029/2005JA011204, 2005.
Ono, T., A. Kumamoto, Y. Yamaguchi, A. Yamaji, T. Kobayashi, Y. Kasa-
hara, and H. Oya, Instrumentation and observation target of the Lu-nar Radar Sounder (LRS) experiment on-board the SELENE spacecraft,Earth Planets Space, 60, 321–332, 2008.
Ono, T., A. Kumamoto, Y. Kasahara, Y. Yamaguchi, A. Yamaji, T.Kobayashi, S. Oshigami, H. Nakagawa, Y. Goto, K. Hashimoto, Y.Omura, T. Imachi, H. Matsumoto, and H. Oya, The Lunar RadarSounder (LRS) onboard the KAGUYA (SELENE) spacecraft, SpaceSci. Rev., doi:10.1007/s11214-010-9673-8, 2010.
Shampine, L. F. and M. K. Gordon, Computer Solution of Ordinary Dif-ferential Equations, 318 pp, W. H. Freeman & Co. Ltd., 1975.
Stern, S. A., The lunar atmosphere: history, status, current problems, andcontext, Rev. Geophys., 34(4), 453–491, 1999.
Stix, T. H., The Theory of Plasma Waves, 283 pp, McGraw-Hill BookCompany, New York, 1962.
Stubbs, T. J., R. R. Vondrak, and W. M. Farrell, A dynamic fountain modelfor lunar dust, Adv. Space Res., 37, 59–66, 2006.
Vasil’ev, M. B., V. A. Vinogradov, A. S. Vyshlov, O. G. Ivanovskii, M.A. Kolosov, N. A. Savich, V. A. Samovol, L. N. Samoznaev, A. I.Sidorenko, A. I. Sheikhet, and D. Ya. Shtern, Radio transparency ofcircumlunar space using the Luna-19 station, Cosmic Res., 12, 102–107,1974.
Vyshlov, A. S. and N. A. Savich, Observations of radio source occultationsby the moon and the nature of the plasma near the moon, Cosmic Res.,16, 450–454, 1979.
Y. Goto (e-mail: [email protected]), T. Fujimoto, Y.Kasahara, A. Kumamoto, and T. Ono