lunar surface rock abundance and regolith fines temperatures
TRANSCRIPT

Lunar surface rock abundance and regolith fines temperaturesderived from LRO Diviner Radiometer data
Joshua L. Bandfield,1 Rebecca R. Ghent,2 Ashwin R. Vasavada,3 David A. Paige,4
Samuel J. Lawrence,5 and Mark S. Robinson5
Received 16 May 2011; revised 21 June 2011; accepted 18 July 2011; published 3 December 2011.
[1] Surface temperatures derived from thermal infrared measurements provide a means ofunderstanding the physical properties of the lunar surface. The contrasting thermophysicalproperties between rocks and regolith fines cause multiple temperatures to be presentwithin the field of view of nighttime multispectral data returned from the LunarReconnaissance Orbiter (LRO) Diviner Radiometer between 60°N/S latitudes. Regolithtemperatures are influenced by the presence of rocks in addition to factors such as thethermophysical properties of the regolith fines, latitude and local slopes, and radiativeheating from adjacent crater walls. Preliminary comparisons of derived rockconcentrations with LRO Camera images show both qualitative and quantitativeagreement. Although comparisons of derived rock concentrations with circularpolarization ratio radar data sets display general similarities, there are clear differencesbetween the two data sets in the relative magnitude and areal extent of rocky signatures.Several surface units can be distinguished based on their regolith temperature and rockconcentration values and distributions including maria and highlands surfaces, rockyimpact craters, rilles, and wrinkle ridges, dark mantled deposits, and isolated cold surfaces.Rock concentrations are correlated with crater age and rocks are only preserved on theyoungest surfaces or where steep slopes occur and mass wasting prevents mantling withfines. The presence of rocky surfaces excavated by young impacts allows for theestimation of minimum regolith thickness from the size of the impact. The derived rockconcentrations confirm the presence of thicker regolith cover in the highlands and inlocations of radar‐dark haloes.
Citation: Bandfield, J. L., R. R. Ghent, A. R. Vasavada, D. A. Paige, S. J. Lawrence, and M. S. Robinson (2011), Lunar surfacerock abundance and regolith fines temperatures derived from LRO Diviner Radiometer data, J. Geophys. Res., 116, E00H02,doi:10.1029/2011JE003866.
1. Introduction
[2] The development and reworking of planetary surfacesin a vacuum environment is dominated by impact processesand lack the influence of aeolian and fluvial processes thatare prevalent on planets such as Earth and Mars. The surfacelayer records the history of the interaction between theMoon and the outside environment throughout its history.By understanding this history, we can better understandseveral basic aspects of lunar science, which is also likely to
have direct relevance to the surfaces of other airless bodieswithin the Solar System. In addition, the lunar surface layeris the principal factor influencing most remote sensingmeasurements and it is crucial to understand the relationshipbetween the regolith at the lunar surface and the primaryigneous materials from which it is derived.[3] There are few terrestrial analogs that provide a means
to determine the connection between the processes unique tothe vacuum and space weathering environment and theresulting development of planetary surfaces. We are requiredto rely on remote observations as well as samples andobservations collected at landing sites. The Apollo, Surveyor,and Luna programs provided a great deal of detailed infor-mation about the compositional and physical properties of thelunar regolith for a limited number of sites [Heiken et al.,1991]. Remotely sensed observations have extended thecoverage across large areas, especially using Earth basedobservations of the nearside [e.g., Thompson et al., 1974;Mendell, 1976; Helfenstein and Veverka, 1987; Ghent et al.,2005; Campbell et al., 2007].
1Earth and Space Sciences, University of Washington, Seattle,Washington, USA.
2Department of Geology, University of Toronto, Toronto, Ontario,Canada.
3Jet Propulsion Laboratory, California Institute of Technology,Pasadena, California, USA.
4Earth and Space Sciences, University of California, Los Angeles,California, USA.
5School of Earth and Space Exploration, Arizona State University,Tempe, Arizona, USA.
Copyright 2011 by the American Geophysical Union.0148‐0227/11/2011JE003866
JOURNAL OF GEOPHYSICAL RESEARCH, VOL. 116, E00H02, doi:10.1029/2011JE003866, 2011
E00H02 1 of 18

[4] Remote observations acquired at ultraviolet throughmicrowave wavelengths have been used to characterizelunar regolith properties. Each style of observation has itsown unique set of sensitivities that when used in combina-tion can leverage a more complete characterization of lunarsurface properties [e.g., Thompson et al., 1974]. Radarobservations, for example, are highly sensitive to the pres-ence of rocks similar in size to the wavelength of measure-ment. In addition, radar observations have the ability to probethe subsurface and glean information about buried rocks orpotential layering. By contrast, reflected light observations atshort wavelengths are sensitive to the composition andphysical properties of the upper few millimeters of surfaces,which are typically dominated by the regolith fines.[5] Surface temperatures derived from thermal infrared
(TIR) measurements provide a third means of understandingthe physical properties of the lunar surface. These mea-surements are sensitive to the thermal conductivity of thesurface layer to a depth that scales with the square root ofthe time period of the energy input (e.g., the diurnal energycycle). The lunar diurnal cycle results in depths of sensi-tivity that vary from several centimeters for highly insulat-ing regolith fines up to meter scales for highly conductingsolid rock. The highly contrasting thermal conductivitybetween lunar rocks and regolith fines results in a largetemperature contrast between these materials [Roelof, 1968].Previous work has used these properties to characterize thelunar surface using TIR telescopic measurements as well asthe Apollo 17 Infrared Scanning Radiometer and the thermalimager on the Midcourse Science Experiment (MSX)[Shorthill, 1970;Mendell and Low, 1974; Price et al., 2003].[6] We continue this work using data returned from the
Lunar Reconnaissance Orbiter (LRO) Diviner Radiometer.Specifically, we describe here the influence of rocks onnighttime surface temperatures at low to midlatitudes andseparate their effects from regolith fines temperatures. Thisprovides a global characterization of rock distributions onthe lunar surface as well as global thermophysical units. Acomprehensive study of lunar surface thermophysicalproperties using Diviner data is beyond the scope of thiswork, especially with respect to the characterization andthermophysical modeling of the lunar regolith fines.
2. Data and Methods
2.1. Diviner Instrument and Data Description
[7] The Diviner Radiometer is primarily a thermal infra-red radiometer with 7 spectral channels; 3 spectral filters arenear 8 mm wavelengths and separate filters cover ∼13–23,25–41, 50–100, and 100–400 mm wavelengths [Paige et al.,2010]. Each channel consists of a 1 by 21 element detectorarray and separate spectral channels are arranged and dataare collected in a pushbroom configuration. The spatialsampling of Diviner is ∼160 by 320 m from a 50 km polarorbit and the local time of observations migrated across thefull diurnal cycle throughout the primary LRO mission.More complete descriptions of the Diviner instrumentcharacteristics and operations are given by Paige et al.[2010].[8] We used data collected from July 5, 2009 through
November 30, 2010 for this study. Data were restricted tolocal times of 1930 to 0530 with solar incidence angles
greater than 90 degrees, latitudes between 60°N and 60°S,emission angles less than 15 degrees, and brightness tem-peratures less than 200 K. The latitude restriction wasincluded because of the large influence of slopes on surfacetemperatures at higher latitudes that persists throughout thelunar night. Unresolved slopes will contribute to ani-sothermality that would be incorrectly modeled as increasedrock concentrations. Several quality constraints present inthe Diviner Reduced Data Records (RDR’s) available at thePlanetary Data System (PDS) repository were used as well(quality flag for calibration – 0; quality flag for miscella-neous – 0; noise quality flag – 0 to 1).[9] Only Diviner channels 6, 7, and 8 were used with full
width half max (FWHM) band passes of 13–23, 25–41, and50–100 mm respectively. The shorter 8 mm channels 3–5were not used because they do not have adequate signal‐to‐noise ratios (SNR) at the relatively cold lunar nighttimetemperatures used for this study. At 90 K, the SNR inDiviner channels 3–5 is <1, even when taking into accountthe fact that most spatial bins include an average of 10s ofmeasurements. Channel 9 (100–400 mm) was not usedbecause significant drifts in brightness temperature arepresent in the channel 9 data immediately following cali-bration observations that would interfere with the analysis ifincluded.[10] Data from each channel were binned at 32 pixels per
degree in ten separate one hour increments of local timefrom 1930 to 0530. Because of the ground track walk andlocal time drift of the LRO orbit, most surfaces are coveredby only a single acquisition time, but include up to ∼10separate measurements for each channel. In some cases,surfaces are covered by multiple observations acquired ∼6or 12 months apart. Lunar obliquity and variations in solardistance between data acquisition dates may result in dif-ferent temperatures for a surface at a given local time.However, the resulting differences in nighttime temperaturesare small (<0.5 K). A greater variation in temperaturebetween observations that fall within a single 1 h bin canoccur due to variations in local time of the observation. Forequatorial observations, this can be as much as 7 K forobservations collected at the start and end of the 1930–2030time bin. The resulting data present in the bin will be theaverage of the separate measurements and local times, andthe resulting effect on derived rock abundance and regolithtemperatures is negligible.[11] We included data collected in the pre‐mapping 30 ×
216 km orbit during the first 60 days after the lunar orbitinsertion sequence [Tooley et al., 2010] resulting in variablespatial resolution data. The 32 pixels per degree (PPD) binsize effectively resamples the data to ∼500–1000 m/pixeland in most cases spatial resolution is reduced by a factor of2–4, but with the higher altitude pre‐mapping orbit dataacquired near periapsis at higher latitudes, data can beoversampled by a factor of ∼2 in the cross‐track direction.[12] Data from each spectral channel are acquired sepa-
rately with no attempt to co‐locate separate spectral chan-nels. The resulting data may include observations fromseparate channel centers up to ∼1.4 km apart at opposingcorners within a bin. This can result in spurious and non‐physical results in regions of high spatial variability, such asat the edge of a crater rim. In practice, this result was not
BANDFIELD ET AL.: LUNAR SURFACE ROCK ABUNDANCE E00H02E00H02
2 of 18

found to be common in the derived rock abundance andregolith temperature data sets.
2.2. Methodology
[13] The derivation of rock abundance relies on thepresence of multiple temperatures present within the field ofview (FOV) of the measurement and the nonlinear nature ofPlanck radiance with respect to wavelength. Multispectralmeasurements can be used to estimate the distribution oftemperatures present within the measurement FOV. Theestimated temperature distributions can be used to derivesurface properties such as surface rock fraction or surfaceslope distributions [Christensen, 1986; Colwell and Jakosky,2002; Nowicki and Christensen, 2007; Bandfield andEdwards, 2008; Bandfield, 2009]. This anisothermalitythat results from the presence of different materials within aparticular FOV radiating at different temperatures can beexpressed as brightness temperature as a function of wave-
length. For example, in the case of an anisothermal surface,the measured brightness temperature approaches the weightedaverage of those temperatures present with increasingwavelength (Figure 1). The measured brightness tempera-ture approaches the highest temperature present in thescene with decreasing wavelength. As a result, the mea-sured brightness temperature will fall somewhere betweenthe scene average temperature and the highest temperaturepresent regardless of the wavelength of measurement.[14] It is important to note that a warmer surface does not
necessarily result in a higher rock concentration. Forexample, equator facing slopes will retain higher tempera-tures throughout the lunar night, but all spectral channelswill show equally elevated brightness temperatures. In asimilar manner, rille and crater floors may be radiativelyheated by nearby walls, but this effect will not increaseanisothermality that would lead to an increased rockconcentration retrieval.[15] In practice, data are limited by wavelength range, the
number of spectral channels available, instrument precision,and systematic errors. In addition, the relatively subtlevariations in the spectral shape of Planck radiance over thetemperatures and wavelengths measured do not allow for theunique identification and separation of more than a fewtemperatures. Our implementation of rock abundance andregolith fines temperature retrieval uses the binned Divinerchannel 6–8 radiance described above. These three mea-surements are fit in a least squares manner using a simplemodel with two parameters; 1) rock areal fraction (0–100%),and 2) regolith fines temperature.[16] Rock temperatures are modeled a priori using the
properties for vesicular basalt described by Horai andSimmons [1972] and the 1‐dimensional thermal modeldescribed by Vasavada et al. [1999]. We used a density of2940 kg/m3, thermal conductivity of 1.491 W/(m K), and atemperature dependent heat capacity of (−154.9 + 4.983 · T −0.008207 · T2 + 0.000005192 · T3) J/(kg K), where T istemperature in K [Horai and Simmons, 1972]. Although thetemperature dependence of thermal conductivity may besignificant for regolith fines in a vacuum environment, it isnot significant for solid materials. Using these parameters,our thermophysical definition of a rock has a thermal inertiaof 1570 J · m−2 · K−1 · s−1/2 at 200 K. Rock temperatures weremodeled assuming an albedo of 0.15 and emissivity of 0.95and an infinitely thick, level, and laterally continuous layer.The albedo chosen was a moderate value in between that ofhighlands and maria. The temperature effects due to varia-tions in albedo are largely dissipated during the lunar nightand are less than ±1 K. Temperatures were modeled atequinox and seasonal variations in temperature were nottaken into account. As discussed above, seasonal effects donot result in significant changes in surface temperatures innighttime data at low and midlatitudes. A rock temperaturelookup table was constructed at 5 degree latitude and 15 minlocal time intervals over the course of the lunar day. Modeledtemperatures at the equator range from 238 to 203 K at a localtime of 1930 and 0530 respectively. At 60°N, modeledtemperatures are 212 to 185 K for the same local times of1930 and 0530. The rock temperatures used in the fitting ofthe Diviner data are linearly interpolated using this lookuptable for each latitude and local time.
Figure 1. (top) Brightness temperature and (bottom) radi-ance as a function of wavelength for rock/soil mixtures.The wavelength coverage of Diviner spectral channels6–8 used in this study are shown in light gray. For this sim-ple example, rock is assumed to be at 185 K and regolith isat 90 K with all materials having unit emissivity. Brightnesstemperatures increase with decreasing wavelength andwarmer temperatures have an increased proportional influ-ence on brightness temperature and radiance at shorterwavelengths.
BANDFIELD ET AL.: LUNAR SURFACE ROCK ABUNDANCE E00H02E00H02
3 of 18

[17] The modeled Diviner channel 6–8 radiance is pro-duced using the predicted rock temperature and an initialguess for the rock areal fraction and regolith temperature.Temperatures are converted to radiance using a lookup tableof Planck radiance convolved with the Diviner instrumentresponse functions for each channel. The radiances for rockand regolith temperatures are added together weighted bythe rock areal fraction. For each latitude/longitude/local timebin, the root mean squared (RMS) difference betweenmodeled and measured radiance is calculated. In this man-ner, the RMS difference is minimized using the optimalcombination of regolith temperature and rock areal fraction.The minimization routine is well‐behaved and predictable.Convergence on optimal values is rapid and assumes RMSdifferences are a quadratic function of the individual vari-ables to select predicted minimum values for the subsequentiteration. Rock fractions are forced to be greater than orequal to zero.[18] This methodology relies on several simplifying
assumptions. The primary motivation for these assumptionsis the relatively simple nature of the data (3 values of radi-ance) that precludes the retrieval of information from a morecomplicated model. For example, we attempted to solve forrock temperatures in addition to regolith temperature androck areal fraction. Although three measurements and threeunknowns are present, the solution is non‐unique and con-
vergence on a solution is highly unstable. There is ambiguityinherent in the problem because a surface composed entirelyof rocks can either lead to a solution of 100% rocks with anyregolith temperature (since regolith does not contribute to thesolution in this case) or 0% rocks and a regolith temperaturethat is the same as that predicted for rocks.[19] What qualifies as a “rock” according to the modeling
here is dependent on both the size of the object and the timeat which it is observed. Using the range of values forbasaltic rock and breccia density, heat capacity, and thermalconductivity, the skin depth of rock under lunar diurnalconditions is ∼0.5–1 m for a horizontally continuous slab. Inreality, rocks are not continuous slabs, but are protruding,partially buried, subject to differential heating as a functionof latitude and time of day, and mantled with regolith fines[Roelof, 1968]. In addition, smaller rocks cool faster overthe course of the night than large rocks, so that they are attemperatures similar to larger rocks early in the night, butapproach the temperature of the colder regolith fines nearsunrise. Other situations may be present as well, such asradiative and conductive warming of regolith surfaces byadjacent rocks. There are many complicating “real world”factors that are not modeled here. We have taken a prag-matic approach to assessing the potential errors in theretrieval algorithm and have compared our results with
Figure 2. Rock concentration maps derived from local times of 1930 through 0530. The maps cover alllongitudes and 60°N to 60°S with the equator and prime meridian at the center of each image.
BANDFIELD ET AL.: LUNAR SURFACE ROCK ABUNDANCE E00H02E00H02
4 of 18

high‐resolution Lunar Reconnaissance Orbiter Camera(LROC) [Robinson et al., 2010] images.[20] To provide a sense of the precision of the algorithm,
we used synthetic radiance constructed assuming a regolithtemperature of 93 K and a 1% rock concentration at 204 K(temperature values are for a local time of 0500 at theequator). Random noise (as documented for Diviner chan-nels 6–8 [Paige et al., 2010]) was added to a set of 10000spectra. Rock concentration and regolith temperature valueswere retrieved using the algorithm described here. Averageretrieved regolith temperatures were 92.9 K with a standarddeviation of 0.94 K. Average retrieved rock concentrationvalues were 0.010 with a standard deviation of 0.0015. Thederived rock concentration and regolith temperature valuesare stable at the noise equivalent radiance levels of Diviner.[21] In addition, it is possible to instead solve for rock
temperature and areal fractions using assumed regolithtemperatures. However, most surfaces have rock coverageclose to zero and even surfaces considered “rocky” typicallyhave fractions less than 10%. Uncertainties in rock tem-peratures result in abundance uncertainties that are roughlyproportional to the rock areal fraction. A 5 K error in reg-olith fines temperature for a surface composed of 99%regolith will result in much larger retrieval errors than the
same 5 K error in the assumed temperatures of rocks cov-ering 1% of the surface.
3. Results
3.1. Global Maps
[22] 89.5 million separate rock concentration and regolithtemperature retrievals were calculated from the globalbinned Diviner channel 6–8 radiance data set (Figures 2–4).Ten separate maps were produced for each 1 h bin of localtime and surface coverage is 89.8%, accounting for thevariable coverage of the spatial bins as a function of latitude.Average RMS error between measured and modeled spectrais 0.0079 W cm−2 mm−1 (2.5% of the measured radiance)corresponding to a difference in brightness temperature of0.9, 0.4, and 1.1 K for Channels 6–8 at 90 K respectively.There is no distinct trend in RMS error with rock concen-tration and a slight correlation with regolith temperature(Figure 5).[23] Global average rock concentration within the ±60°
latitude range is 0.004. Small, but systematic differences inrock concentrations are present between different localtimes, ranging from an average of 0.003 to 0.005. Althoughsome of this difference can be attributed to different geo-graphical coverage between the separate local time maps,
Figure 3. Rock‐free regolith temperature maps derived from local times of 1930 through 0530. Themaps cover all longitudes and 60°N to 60°S with the equator and prime meridian at the center of eachimage. The temperature dependence on both latitude and local time is clearly apparent in the images.
BANDFIELD ET AL.: LUNAR SURFACE ROCK ABUNDANCE E00H02E00H02
5 of 18
the differences persist when comparing only coincidentpixels. 99.995% of measured surfaces have rock con-centrations less than 0.20 and no pixels show rock fractionsabove 0.70. Where low rock concentrations are present,there is a clear decrease in retrieved rock concentrationthroughout the lunar night (Figure 6) and rock concentra-tions retrieved from observations acquired at local timesbetween 0430 and 0530 are only about 65% of thoseacquired between 1930 and 2030. Distinct trends in averagerock concentration as a function of latitude are also presentin early evening retrievals, but are largely absent from pre‐dawn measurements (Figure 7). There is no distinct latitu-dinal trend present for surfaces with elevated rock fractions.[24] Derived regolith temperatures have clear trends with
latitude and local time, as expected (Figure 8). Globalaverage regolith temperatures decrease from 103.6 Kbetween 1930 and 2030 to 90.1 K between 0430 and 0530.Post‐sunset (1930–2030) temperatures decrease from ∼108 Kto 95 K between 0° and 60°N/S latitude, respectively. Pre‐dawn (0430–0530) temperatures decrease from ∼94K to 83Kbetween 0° and 60°N/S latitude, respectively.
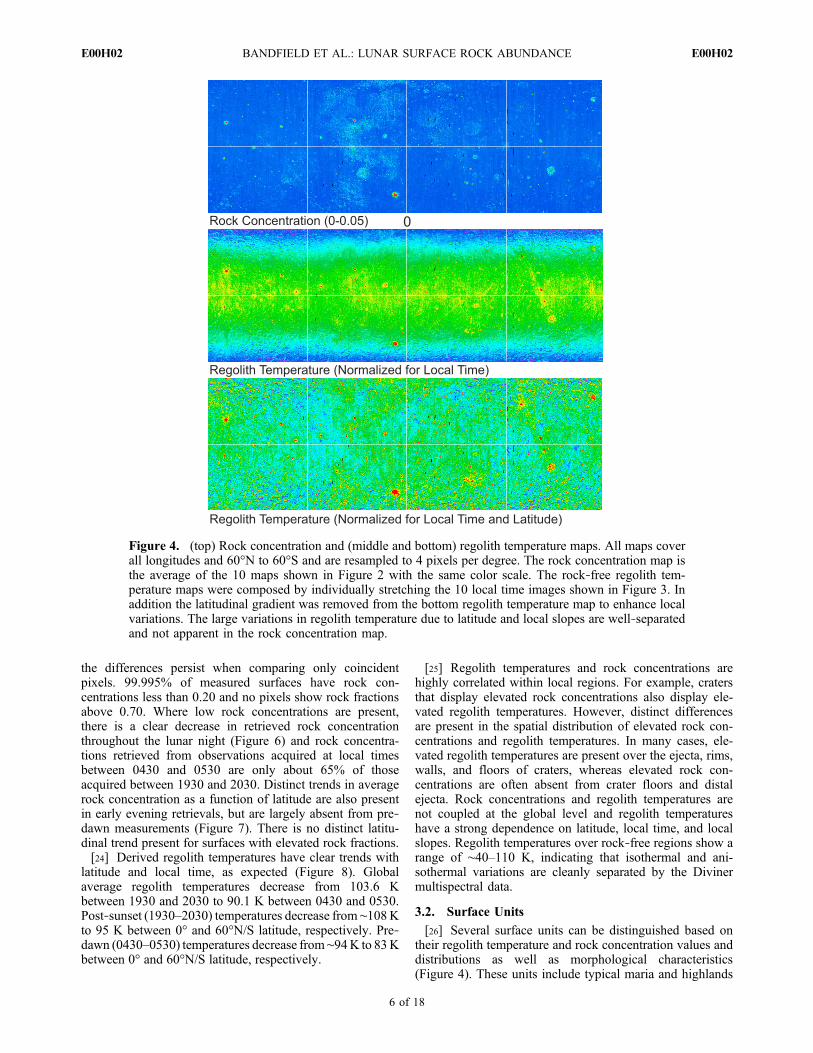
[25] Regolith temperatures and rock concentrations arehighly correlated within local regions. For example, cratersthat display elevated rock concentrations also display ele-vated regolith temperatures. However, distinct differencesare present in the spatial distribution of elevated rock con-centrations and regolith temperatures. In many cases, ele-vated regolith temperatures are present over the ejecta, rims,walls, and floors of craters, whereas elevated rock con-centrations are often absent from crater floors and distalejecta. Rock concentrations and regolith temperatures arenot coupled at the global level and regolith temperatureshave a strong dependence on latitude, local time, and localslopes. Regolith temperatures over rock‐free regions show arange of ∼40–110 K, indicating that isothermal and ani-sothermal variations are cleanly separated by the Divinermultispectral data.
3.2. Surface Units
[26] Several surface units can be distinguished based ontheir regolith temperature and rock concentration values anddistributions as well as morphological characteristics(Figure 4). These units include typical maria and highlands
Figure 4. (top) Rock concentration and (middle and bottom) regolith temperature maps. All maps coverall longitudes and 60°N to 60°S and are resampled to 4 pixels per degree. The rock concentration map isthe average of the 10 maps shown in Figure 2 with the same color scale. The rock‐free regolith tem-perature maps were composed by individually stretching the 10 local time images shown in Figure 3. Inaddition the latitudinal gradient was removed from the bottom regolith temperature map to enhance localvariations. The large variations in regolith temperature due to latitude and local slopes are well‐separatedand not apparent in the rock concentration map.
BANDFIELD ET AL.: LUNAR SURFACE ROCK ABUNDANCE E00H02E00H02
6 of 18

surfaces, rocky young impact craters, rilles, and wrinkleridges, dark mantled deposits, and isolated cold surfaces.[27] Maria plains surfaces typically have low rock con-
centration values (typically <0.5%), but numerous smallcraters (>100s of m in diameter) expose abundant rocks. Inmany cases, these craters cannot be resolved at the resolu-tion of the maps produced here, but their contribution to theoverall signal is strong enough to significantly raise the rockconcentration of the pixel. Regolith temperatures follow atrend typical of most highlands and mare surfaces. However,the numerous small rocky craters also produce elevated
regolith temperatures correlated with the elevated rockconcentrations.[28] Highlands surfaces are also characterized by low rock
concentration values; however, in contrast to the maria,craters do not typically expose rocky surfaces. Within theseregions, only larger (>5–10 km) relatively fresh craters haveelevated rock concentrations. Regolith temperatures aresimilar to those of most highlands and mare surfaces.However, the presence of numerous slopes causes morevariability in regolith temperatures within the rough high-
Figure 5. RMS fitting error versus (top) rock concentration and (bottom) regolith temperature. Datainclude every 10th point taken from 345 to 353°E, 40–46°S covering Tycho Crater and the surroundingarea. There is no apparent correlation between rock abundance and RMS error, but higher regolith tem-peratures do tend to have slightly higher RMS errors.
Figure 6. Global average rock concentration values foreach of the 10 local times shown in Figure 2. There is adistinct decreasing trend in derived rock concentrationsthrough the lunar night.
Figure 7. Longitudinally averaged rock concentrationvalues for 4 separate local time bins. There are clear trendsin rock concentration as a function of latitude and localtime present, though some of the latitudinal dependenceis correlated with the location of maria.
BANDFIELD ET AL.: LUNAR SURFACE ROCK ABUNDANCE E00H02E00H02
7 of 18

lands surfaces, especially at higher latitudes. As with themaria surfaces, regolith temperatures are higher where rockconcentrations are elevated.[29] Dark mantled deposits are characterized by smooth,
relatively low‐albedo surfaces and are hypothesized to bepyroclastic in origin [e.g., Gaddis et al., 1985]. These sur-faces are characterized by uniformly low rock concentra-tions and regolith temperatures such as can be seen on theAristarchus Plateau or Rimae Bode. Where craters arepresent, they do not typically expose rocks or show elevatedregolith temperatures.[30] Relatively fresh craters expose areas of elevated rock
concentrations and high regolith temperatures. Large craters,such as Tycho, have extensive rocky and relatively warmregolith surfaces that cover the floor, walls, rim, and ejectawithin 1 crater radius. The regions of elevated rock con-centrations and high regolith temperatures are nearly coin-cident. This correlation often breaks down for smallercraters (<15 km in diameter). In some cases, the crater floorsare relatively rock‐free, but have high regolith temperatures.In other cases, small (<5 km in diameter) young craters haverocky ejecta extending ∼1–1.5 crater radii from the craterrim, but with high regolith temperatures extending up to 3–4crater radii from the crater rim. Although not always thecase, smaller, fresh craters often have more extensive areasof high regolith temperatures relative to areas of elevatedrock concentrations.[31] Exposures of elevated rock concentrations are typi-
cally associated with craters, rilles and wrinkle ridges andother surfaces where steep slopes are present. As with thesmaller craters, regions of high regolith temperatures appearmore extensive than regions of elevated rock concentrations.[32] An additional anomalously rocky region is located
near 168°E, 42°N, covering an area approximately 100 kmin diameter. Areas of elevated rock concentration are nearlycoincident with areas of high regolith temperatures.Although the surface is rough and contains numerous cra-ters, the surfaces with elevated rock concentrations arepatchy and not obviously associated with the craters. This
region is otherwise nondescript and is apparently uniquewith regards to these properties.[33] Numerous isolated locations within the maria and
highlands contain anomalous regolith temperatures that arecommonly 5–10 K colder than the surrounding rock‐freeregolith surfaces throughout the lunar night. These lowregolith temperatures are typically associated with a fresh,rocky crater at the center of the cold region. Rock con-centrations are uniformly low within these cold areas
Figure 8. Longitudinally averaged regolith temperaturevalues for each of the 10 local times shown in Figure 3.The nighttime cooling trend is apparent with each succeedinglocal time.
Figure 9. Example region containing anomalously coldregolith temperatures centered near 151.7°E, 4.1°S. (top)Rock abundance shows no variation except within theimmediate vicinity of the crater. (middle) Low regolith tem-peratures extend up to ∼100 km from the crater in distinctrays. (bottom) There is no associated albedo or morpholog-ical signature present in LROC wide‐angle camera data orother low spatial resolution imaging data sets.
BANDFIELD ET AL.: LUNAR SURFACE ROCK ABUNDANCE E00H02E00H02
8 of 18

(<0.3%). The largest of these regions covers a region∼100 km in diameter with a 1.5 km diameter crater at thecenter near 151.7°E, 4.1°S (Figure 9). Rays or streamers ofthe “cold spots” are apparent up to ∼200 km from the center,but are typically <15 km in diameter. There is no apparentvisible/near‐infrared color or albedo difference associatedwith these low temperature surfaces.[34] Because of latitude differences in the coverage of the
various surface units, it is not possible to directly comparetheir regolith temperatures. However, we can compare therock concentration values and we find that they do notdisplay a significant dependence on latitude (except wheremaria surfaces are also correlated with equatorial and lownorthern latitudes; Figure 10). Modal rock concentrationsincrease slightly from the cold spots to dark mantled deposits,highlands, and maria (from 0.2 to 0.5%). Only maria, freshcraters, and the anomalously rocky region discussed abovehave a significant fraction of their surfaces with elevatedrock concentrations. The example cold spots, dark mantleddeposit, highlands, maria, anomalously rocky, and youngcrater surfaces presented here have 0.1, 0.4, 0.5, 18.6, 63.5,and 98.4%, respectively of their surfaces with >1% rockconcentrations.
3.3. Validation and Comparison With the Imagingand Radar Data Sets
[35] We completed a preliminary assessment and com-parison of rock abundance with the LRO Camera (LROC).LROC is typically sampled at 0.5 or 1.0 m/pixel, whichallows for resolution of objects 1.0 or 2.0 m across,respectively. In practice, only blocks larger than ∼2 m couldbe unambiguously identified and it is likely that someblocks <3 m in diameter would escape detection.[36] A quantitative comparison was done using a 0.4 by
2.0 km subset of LROC image M121423567R, locatedwithin the central peak of King Crater near 120.66 E, 5.06 N(Figure 11). This region covers half of two Diviner rock
concentration bins with 10.0 and 10.6% rock concentrationvalues. Only rocks that could be unambiguously identifiedas such were counted. In each case, 3 points were selectedon the edge of each rock that defined a circle that was usedto determine diameter and area. A total of 769 blocks wereidentified over an area of 0.848 km2 and were placed into1 m diameter bins (Table 1).[37] Block counts increase with decreasing diameter, but
decrease in number at the 2–3 m bin and no blocks <2 m indiameter were confidently identified. This pattern is due tothe functional limit of the spatial resolution and it is prob-able that any block counts for sizes <3 m in diameter areunder‐counted. Given the expectation of increasing numbersof rocks with decreasing diameter and the sensitivity ofDiviner data to rocks ∼1 m in diameter, the LROC blockcounts are likely to be a significant underestimate. This isalso suggested by comparison with Diviner rock concen-tration values as the direct counted areal fraction of thecomparison area is 1.5%, significantly less than the 10.3%estimation from Diviner. However, assuming an accurateblock count at >3 m in diameter, the lunar cumulative blocksize distribution can be well represented using a powerfunction [Cintala and McBride, 1995] (Figure 12). Thecumulative rock concentration can be represented by thefunction c = 0.082 d−1.326, where d is the rock diameter andc is the concentration of rocks present with diameters equalto or larger than d. The LROC block counts are well‐fitusing this relationship with a correlation coefficient of0.997. For blocks greater than or equal to 1 m in diameter,this relationship predicts a block concentration of 8.2%, ingood agreement with theDiviner derived rock concentrations.[38] This comparison is preliminary and more extensive
comparisons are necessary to fully validate and quantita-tively compare block concentrations in Diviner and LROCdata. It is apparent, however, that at least on a qualitativelevel, the two data sets are in good agreement with eachother. An example is demonstrated in the region of RimaBode. A rille is present near 356 E, 13 N and rocks areclearly visible and concentrated on the steeper slopes. Thereis good qualitative agreement between the relative abun-
Figure 10. Distribution of rock concentration values overrepresentative surface thermophysical units. Data are binnedin increments of 0.001 (0.1%) and normalized to the peakbin value. Small rocky craters contribute to the long tailof high rock concentration values in the maria. Tycho Crateris a particularly rocky region, but is still dominated by sur-faces with <10% rock coverage.
Figure 11. Portions of LROC images M121423567L/Rcovering the central peak of King Crater. A manual rockcount was completed within the area denoted by the whitebox on the right hand side of the image.
BANDFIELD ET AL.: LUNAR SURFACE ROCK ABUNDANCE E00H02E00H02
9 of 18

dance of rocks visible in the LROC images and the Divinerrock concentration values. This qualitative agreement appearsto be valid for rock concentration values from less than 1% togreater than 10% (Figure 13).[39] Direct comparison of the Diviner rock concentrations
with radar data sets is also possible. The Miniature RadioFrequency (MiniRF) system is a synthetic aperture radarutilizing X‐band and S‐band frequencies (∼3 and 10 cmrespectively) at 30 and 150 m sampling [Nozette et al.,2010]. We used the S‐band circular polarization ratio(CPR) map‐projected level 2 products available at thePlanetary Data System (PDS). All data used here wereacquired prior to September 19, 2010. The CPR is adimensionless parameter that is the ratio of the same sensecircular polarization return to the opposite sense circularpolarization return. This parameter is highly sensitive toscatterers (such as rocks) of roughly the same size as thewavelength of the signal [e.g., Campbell et al., 2010]. Inaddition, we used the 70 cm Arecibo‐based CPR maps (alsoavailable at the PDS) for comparison [Campbell et al., 2007].The MiniRF data were used to illustrate high‐resolutiondetails within the Copernicus Crater region and the Areciboradar data provided a regional synoptic view covering muchof Oceanus Procellarum.[40] Both radar data sets were only used in a qualitative
sense. Individual MiniRF images are typically thin stripswith high aspect ratios and it is necessary to mosaic the datato produce images that cover larger areas. In order to do this,we removed cross‐track gradients from individual MiniRFstrips. The resulting data was adjusted using a standarddeviation linear stretch and blended where separate observa-tions overlapped spatially to produce seam‐free mosaics.
4. Discussion
4.1. Overview
[41] We have produced quantitative maps of rock con-centrations and regolith temperatures. However, eventhough the results can be described as quantitative, howthese numbers relate to actual surface properties is not welldefined. Interpretation of these results requires an under-standing of the fundamental limitations of the method. Theavailability of only 3 independent radiance measurementsprevents the retrieval of more than a few parameters and themodel has been kept necessarily simple. As mentioned
above, there are many potential complexities that are nottaken into account by this model and all of these factors(and likely many others) add uncertainty to the interpreta-tion of rock concentration and regolith temperature valuespresented here.[42] In general, as is well known already, most lunar
surfaces are relatively free of rocks. Micrometeorite bom-bardment and space weathering are the dominant currentgeologic processes for most lunar surfaces. Rocks are onlyexposed where mass wasting on steep slopes or recent largerimpacts expose larger clasts that have not been exposed longenough to be broken down. The Diviner measurements haveprovided systematic coverage of the planet with multispec-tral observations that allow for the separation of the prop-erties of finer materials from those of exposed rocks.[43] Most surfaces have rock concentrations between 0
and 0.01 and fine distinctions at the 0.001 level can be madebetween surface units (Figure 10). It is not clear howaccurate these small concentrations are, however and othersystematic differences are present as illustrated by the var-iation in rock concentrations with local time (Figure 7).Some of this difference can be attributed to increased sen-sitivity to smaller rocks early in the lunar night. Residualanisothermality due to surface roughness that persists intothe lunar night is not likely a factor as its effects are morepronounced and would lead to higher rock concentrations athigher latitudes, which is not observed. Regardless, giventhe systematic variability in rock concentrations with localtime, small differences (<0.005) do not necessarily reflectactual differences in the abundance of rocks on the lunarsurface. However, small relative variations in rock con-centrations within similar latitudes and local times areprobably valid, consistent with the standard deviation of0.0015 in rock concentration derived from the sensitivitystudy discussed above.
Table 1. LROC Block Count Results From a Portion of ImageM121423567R
BlockSize (m)
Number ofBlocks
Blocks/km2
ArealFraction
CumulativeFraction
>11 11 13.0 0.0023 0.002310–11 12 14.2 0.0012 0.00359–10 8 9.4 0.0007 0.00428–9 6 7.1 0.0004 0.00467–8 23 27.1 0.0012 0.00586–7 19 22.4 0.0007 0.00665–6 61 72.0 0.0017 0.00834–5 177 208.8 0.0033 0.01163–4 332 391.7 0.0038 0.01542–3 120 141.6 0.0007 0.01611–2 0 0 00–1 0 0 0
Figure 12. Rock count results from the area shown inFigure 9. The blue crosses are the direct calculation ofareal coverage of rocks at or larger than the block diameterfrom the LROC image. The plotted line is the power func-tion regression fit to bins greater than or equal to 3–4 m indiameter. The best fit equation and correlation coefficientare shown in the upper right and the Diviner derived rockconcentration value is shown as a red cross.
BANDFIELD ET AL.: LUNAR SURFACE ROCK ABUNDANCE E00H02E00H02
10 of 18

4.2. Comparison With LROC Images
[44] Despite this complexity, the results appear to be well‐correlated, at least qualitatively, with boulder concentrationsdirectly observable in LROC images. As with the Divinerdata products, LROC images have limitations, primarily dueto the limit of the image resolution. Fortunately, LROC allowsfor the identification of boulders of similar scale at whichDiviner is likely to be sensitive (∼1m). As shown in Figure 13and is apparent in many other locations, there is goodagreement on a qualitative level between the relative abun-dance of blocks visible in LROC images and the Divinerderived rock concentration values. Although we have notperformed an exhaustive survey, no instances have beenidentified where there is apparent disagreement betweenimages and rock concentrations. In this sense, the Divinerderived rock concentration maps are accurate. Errors due tomisregistration between bands or incorrectly predicted rocktemperatures do not appear to significantly affect the quali-tative results. It should also be noted that while radiativeheating from adjacent surfaces on slopes may result in higher
nighttime temperatures, this heating does not have a largeeffect on the anisothermality. Because the algorithm used forthe derivation of rock concentrations is sensitive to increasedanisothermality rather than a simple increase in brightnesstemperature, the derived increase in rock concentrationswithin depressions such as rilles or craters is not affected byradiative heating effects from adjacent surfaces.[45] Although only a single region was investigated, rock
counts provide a basis for the comparison of image andthermal data sets. The decrease in the number of blocksidentified below 3 m in diameter provides a practical senseof the limitations of the LROC data set, even with 0.5 m/pixel sampling. In the example described above, the scalingrelationship between cumulative rock areal coverage andminimum block diameter is closely described using a simplepower law relationship. The close agreement between thepredicted >1 m block diameter areal coverage (8.2%) andthe Diviner derived rock concentration value (10.3%) pro-vides limited support that the technique is indeed sensitiveto blocks of diameters ∼1 m and larger.[46] Extrapolating the predicted coverage to smaller block
diameters illustrates how much rock coverage is likely to bepresent. For example, 20.5% and 69.2% areal coverages arepredicted for block diameters greater than 0.5 and 0.2 m,
Figure 14. (top) Rock concentration and (bottom) Arecibo70 cm circular polarization ratio (CPR) [Campbell et al.,2007] maps. The images cover 300–350°E and 0–30°Nand Lunar Orbiter Laser Altimeter (LOLA) data are used forshading. Regions of high CPR are interpreted as havinghigher abundances of blocks within ∼10 m of the surface.
Figure 13. (top) Rock concentration values near Rima Bode(356.1°E, 12.9°N) with LROC images M102193170L/Rused for shading. The white box denotes the area shownin the bottom image. (bottom) A portion of LROC imageM102193170L. Each square in the image covers a separateDiviner bin with the derived rock concentration valuelisted. There is qualitative agreement between the abun-dance of blocks apparent in the image and the Divinerderived rock concentration values.
BANDFIELD ET AL.: LUNAR SURFACE ROCK ABUNDANCE E00H02E00H02
11 of 18

respectively for the King Crater central peak region dis-cussed here. Despite such large proportions of the surfacepredicted to be covered by blocks, the 10.3% coveragepredicted from the Diviner data set indicates the insensitivityto these smaller block sizes. However, regolith temperaturesare also elevated relative to adjacent block‐free surfaces. Itis likely that the presence of smaller blocks are responsiblefor these elevated temperatures. In this manner, largerblocks primarily affect the Diviner rock concentration valuesand smaller blocks likely have a more pronounced effect onthe derived regolith temperatures.
4.3. Comparisons With Radar Data Sets
[47] There is a general correlation between both radar datasets and the rock concentration maps as would be expected
because the radar data sets are highly sensitive to the pres-ence of rocks. Craters (such as Aristarchus, Kepler, Reiner,and Copernicus craters) that show elevated rock concentra-tions also have high values of CPR (Figures 14 and 15).Where maria surfaces show rocky small craters, the radar dataalso show increased values of CPR. Other regions, such asAristarchus Plateau, have low concentrations of rocks andlow values of CPR. In a general sense, both data sets arein agreement and clearly distinguish rocky and rock‐freeregions.[48] On closer inspection, significant differences in the
spatial patterns between the radar and rock concentrationdata sets are clearly present. For example, the overallrock concentrations in the Aristarchus crater region aresignificantly higher than the concentrations present in theCopernicus crater region. By contrast, CPR values are clearlylower over Aristarchus than Copernicus. At the basic level,the radar data could be used to interpret Copernicus crater asrockier than Aristarchus crater and the opposite interpretationwould be made from the thermal data set. Rocky craters alsodisplay distinctly elevated CPR values within ∼1 crater radiusoutside the rim whereas Diviner derived rock concentrationvalues are only slightly elevated and are typically <1%.[49] These differences are likely due to the depth of sen-
sitivity of the two methods. For dry lunar materials, radarcan penetrate to depths of roughly 10 times the wavelengthof the measurement [Campbell et al., 1997]; ∼1 and 7 m forthe MiniRF S‐band and Arecibo 70 cm data sets, respec-tively. By contrast, the Diviner data are primarily influencedby rocks present at the surface. In all but the most recentlyformed craters, rocks at the surface will be broken down bymicrometeorite bombardment in the vacuum environment.However, even shallowly buried rocks will be preserved anddetected by the radar while remaining undetected in thethermal data. This difference in sensitivity shows that blocksfrom crater ejecta and on crater floors are largely buried andnot commonly present at the surface.[50] Many lunar craters are surrounded by a region of low
CPR values (referred to as “radar dark haloes”), which havebeen hypothesized as being a mantle of relatively rock freeejecta [Ghent et al., 2005; Ghent et al., 2008]. Similarspatial patterns are present in the rock concentration data.Although the thermal data are only sensitive to the near‐surface materials, relatively young craters of various sizescan be used to probe the nature of the subsurface materials.These craters can expose rocky materials that would other-wise remain buried and undetected in the thermal infrareddata.[51] Smaller craters lack significant rock concentrations in
the radar dark halo regions, consistent with previous resultsthat indicate these are thick and relatively rock‐free layers ofejecta. Immediately outside the radar dark halo regionswithin the maria, small craters do commonly have elevatedrock abundances indicating that the rock‐free regolith issignificantly thinner in these regions.[52] In addition, cold spots do not appear in either the
Arecibo or MiniRF data. This may indicate that they are arelatively thin, near‐surface phenomenon. By contrast, darkmantled deposits such as Aristarchus Plateau show bothuniformly low CPR and rock concentration values. This isconsistent with these deposits being relatively thick.
Figure 15. Rock concentration (top) and MiniRF S‐bandcircular polarization ratio (CPR) image mosaic (bottom) ofCopernicus Crater (centered near 339.9°E, 9.6°N). TheLROC Wide‐angle Camera (WAC) global mosaic is usedfor shading. Regions of high CPR values extend farther out-side the crater rim than elevated rock concentration values.
BANDFIELD ET AL.: LUNAR SURFACE ROCK ABUNDANCE E00H02E00H02
12 of 18

4.4. Variations in Surface Unit Properties
[53] As has been anticipated, the presence of rocks ishighly correlated with regions of increased brightness tem-peratures [e.g., Mendell and Low, 1974; Urquhart andJakosky, 1997]. However, there are a number of locationswhere this correlation breaks down. There are variations inregolith temperatures that are apparently independent of thepresence of rocks. This is best illustrated by comparing thetemperatures of typical maria and highlands surfaces withdark mantled deposits and the cold spots. All of these sur-faces typically have <0.5% rock concentration values, whichis only sufficient to raise Diviner Channel 8 (100–200 mm)brightness temperatures by ∼0.5 K. Both dark mantleddeposits and cold spots show temperature reductions greaterthan this. Without the presence of rocks, the lower nighttimetemperatures associated with dark mantled deposits and coldspots must be due to the physical properties of the regolithfines.[54] Cold Spots. Dark mantled deposits are hypothesized
to be composed of pyroclastic materials that are commonlycomposed of uniformly small particle sizes, which mayaccount for their slightly lower rock‐free regolith tempera-tures relative to typical lunar regolith fines. The 5–10 Klower temperatures present at the cold spots surroundingfresh craters is more difficult to explain. Typical lunarregolith fines are highly insulating, but there must be aprocess present related to the formation of these craters thatcreates a surface with a significantly lower thermal inertia.
[55] These cold surfaces (as well as the slightly coolerareas of Aristarchus Plateau) were noticed by Mendell andLow [1975] using Apollo 17 Infrared Scanning Radiome-ter data near Bessarion B. In this region, near 319E, 18N,temperatures were found to be as low as 88K. Mendell andLow [1975] did not identify the craters associated with thesefeatures and noted that there were no features in the pho-tographic data associated with the cold surfaces themselves.[56] Typical lunar surfaces have diurnal temperatures
consistent with layering with an increased packing of mate-rials at greater depths [Keihm et al., 1973]. This leads to aslowing of surface cooling later in the lunar night due to thedelayed influence of the higher thermal inertia materialspresent at a depth of a few centimeters. The colder regolithsurfaces also show a temperature trend consistent with thepresence of a packed layer at depth but are consistently colderthan adjacent mare or highlands surfaces throughout the lunarnight. This indicates that these surfaces have a lower thermalinertia at the surface than typical lunar regolith fines.[57] The cold spots are related to young impact craters
<2 km in diameter. Apollo, Clementine, and LROC imagesdo not show any distinguishing albedo or morphologyassociated with the cold spots. Clementine multispectraldata also do not display any distinguishing characteristics.High resolution LROC images do display unique char-acteristics, however. Most of the craters associated withcold spots have a relatively unique ejecta pattern within∼10 crater radii of the center (Figure 16). These surfaceshave a radial, layered, and streaming pattern with distinctedges. Topographic features appear to have some controlover the radial pattern that also displays some sinuosity.The abrupt edges and topographic influence indicate thatthis material was not emplaced ballistically and was likelydue to a fluid‐like density current. The actual cold regolithtemperatures occur outside this region where radial streaksare still present, but the continuous layered pattern isabsent. This may be due to the presence of rocks closerto the crater that would influence the derived regolithtemperatures.[58] The cold spots appear to be associated with young
craters of unique morphological properties but are otherwisenot unique with regards to the crater size, or terrain. Thepossibility that density currents were present to form thesedeposits suggests the presence of gasses, which is surprisingfor an airless planet with a volatile‐poor regolith. However,it may be possible to deliver the volatiles necessary toproduce density currents via an ice‐rich impactor. A ∼1.5 kmdiameter crater on the Moon can be produced by a ∼50 mdiameter comet [Melosh, 1989]. Assuming a composition ofprimarily ice, which is all converted into gas, this will pro-duce ∼0.65 km3 of gas at standard temperature and pressure.A cometary impact at the lunar surface should produce gasvolumes orders of magnitude larger, with higher temperaturesand lower pressures. Such conditions should still be capableof producing density currents.[59] Although detailed modeling of these impacts is
beyond the scope of this work, it appears that recent com-etary impacts are a plausible formation mechanism for theseunique features. It is not clear, however, why the sur-rounding regolith is more highly insulating than typicallunar surfaces, though the presence of gas could perhaps berelated to the formation of more delicately packed regolith
Figure 16. Mosaic of LROC images M110601418L/R andM125936995L/R centered near 151.7°E, 4.1°S. The crater isat the center of a region of colder rock‐free regolith tempera-tures termed “cold spots” shown in Figure 9. Although therelatively bright surface of the crater is typical of freshcraters, the continuous, layered nature of the ejecta isassociated with craters with the colder surfaces beyond thecontinuous deposits.
BANDFIELD ET AL.: LUNAR SURFACE ROCK ABUNDANCE E00H02E00H02
13 of 18

particles. There are other possible interpretations for theproduction of some of the morphological properties, how-ever, such as ballistic erosion and sedimentation [Oberbeck,1975]. Clearly, a more detailed and focused investigation ofthese morphologically and thermophysically unique cratersis necessary.4.4.1. Crater Regolith Properties[60] There is a clear correlation between regolith tem-
perature and rock concentration values. It is not likely thatthis is a result of incorrect assumptions in the algorithmdescribed here because large variations in regolith temper-ature due to factors such as variable local times, latitudes, orlocal slopes appear largely independent of the rock con-centration determinations. This correlation is probably dueto a combination of 3 factors; 1) smaller rocks are likely tobe present that will remain somewhat warmer than regolithfines throughout the lunar night; 2) buried rocks are likely tobe present that would elevate the temperature of the night-
time regolith; and 3) the presence of exposed rocks willradiatively heat the surrounding regolith. This correlationbetween regolith temperatures and rock concentration valuesappears to break down within craters. The floors of craterstypically have lower rock concentrations than the craterwalls and can be similar to the surrounding plains, withconcentrations <0.01. By contrast, the floors of these cratershave elevated regolith temperatures, typically ∼15 K warmerthan the surrounding plains (Figures 17 and 18). It is notclear if this patter persists for smaller craters (<3 km indiameter) as the floors are not clearly resolved at the 32 pixelsper degree sampling.[61] Similar to the cold regions, it appears that this is a
case where regolith fines temperatures are decoupled fromthe presence of large blocks visible in high resolution ima-ges. There are several possible causes for the relativewarmth of these surfaces despite the apparent absence ofblocks. In the example shown in Figure 17, the craterMarius A has a diameter of 15 km and a depth of 5 km.From the center point of the crater, the rim of the crater isabout 35 degrees above the level horizon. The walls willprovide a substantial component of radiant energy to thefloor of the crater that will keep the surface warmer than thesurrounding plains, which are fully exposed to space. Thiseffect is likely contributing to increased regolith tempera-tures in other regions, such as rilles. However, the elevatedrock concentrations in these regions are not a result of thiseffect.[62] There is also the possibility that the crater floor
consists of a block size distribution that is largely devoid ofblocks >1 m in diameter and is composed of coarser or moredensely packed particles than typical lunar regolith. Thiswould register as warmer regolith fines temperatures withrelatively low rock concentrations. Although this is plausi-ble, it is not clear what process would result in such a dis-tribution of particle sizes on crater floors, especially becauselarger block sizes are expected to persist on the lunar surfacelonger than smaller blocks [e.g., Hörz et al., 1975]. Thehigher temperatures can be explained by the extra radianceprovided by the crater walls without invoking any additional
Figure 17. (top) Rock concentration and (bottom) regolithtemperature images of Marius‐A. The images are centerednear 313.9°E, 12.6°N and the LROC WAC global mosaicis used for shading. The floor of the crater is relativelyrock‐free, but still contains uniformly elevated rock‐freeregolith temperatures. The radiative contribution from thewalls of the crater is likely contributing to the higher tem-peratures rather than intrinsic thermophysical properties ofthe floor materials.
Figure 18. Rock concentration values versus rock‐free reg-olith temperatures for the wall, floor, and outside plains ofMarius‐A shown in Figure 15.
BANDFIELD ET AL.: LUNAR SURFACE ROCK ABUNDANCE E00H02E00H02
14 of 18

complexity. This further illustrates that the rock concentra-tion algorithm is indeed sensitive to the anisothermalityfrom the presence of rocks over a mixed surface rather thansimply translating warmer nighttime temperatures into ele-vated rock concentration values.[63] By contrast, elevated rock concentrations are present
over extended level surfaces outside of some young craters.For example, Hell‐Q, a 3.8 km diameter crater centered near355.5E, 33S is surrounded by a region of elevated regolithtemperature that extends beyond the region of elevated rockconcentrations (Figure 19). The elevated regolith tempera-tures do contain elevated rock concentrations, but are<0.015 despite regolith temperatures 10–15 K above that ofthe surrounding plains (Figure 20).[64] Ejecta block sizes decrease with increasing distance
from the crater [Hörz et al., 1983;Melosh, 1989]. In the caseof young craters, the original ejecta block distribution maybe preserved as well as the clast size distribution as afunction of distance from the crater. Hell‐Q has elevatedrock concentrations within 1–2 crater radii from the rim andelevated regolith temperatures within 4–5 crater radii. Thisseparation of regolith and rock concentration properties
likely represents a change in the surface particle size dis-tributions. Although the more distal crater ejecta are largelyfree of larger blocks that would be detected by the rockabundance algorithm (or in LROC images), particles that arecoarser or more densely packed than typical lunar regolithmust be present. The separation of rock concentrations andregolith fines temperatures allows for the retrieval of someminimal clast size distribution information.[65] That these warm regolith temperatures only occur
around immature craters is consistent with previous workthat predicts much longer survival times for larger rocks. Inthis environment, 0.1 and 1 m diameter rocks were found tohave median survival times of ∼10 and 100 million yearsrespectively [Hörz et al., 1975]. This effect may explainwhy elevated rock abundances persist near older craterseven though the extended regions of elevated regolithtemperatures do not.
Figure 19. (top) Rock concentration and (bottom) regolithtemperature images of Hell‐Q. The images are centered near355.5°E, 33.0°S and the LROC WAC global mosaic is usedfor shading. Regions of significantly elevated regolith tem-peratures extend to regions of only slightly elevated rockconcentrations.
Figure 20. Rock concentration values versus rock‐free reg-olith temperatures for the Hell‐Q and its immediate sur-roundings shown in Figure 15.
Figure 21. Rock concentration values near King Crater.The image is centered near 120.5°E, 5.0°N and the LROCWAC global mosaic is used for shading. Slightly elevatedrock concentrations are associated with the impact meltnorthwest of the crater rim, but are typically restricted tosteep slopes or recent small impact craters.
BANDFIELD ET AL.: LUNAR SURFACE ROCK ABUNDANCE E00H02E00H02
15 of 18

4.4.2. Impact Melts[66] The rock concentration distributions near craters and
rilles illustrates that exposure of rocks requires mass wastingto keep the surface free of mantling regolith. Relatively levelsurfaces are commonly free of rocks with the exception ofvery young craters such as the Hell‐Q example describedabove. Impact melts, such as those exposed immediatelynorthwest of King Crater, also illustrate this property. KingCrater is a Copernican Age crater dated to ∼1 Ga [Ashleyet al., 2011]. The central peak, crater walls, and the perimeterof the impact melt region have elevated rock concentrations.The crater ejecta has only slightly elevated rock concentra-tions within about half a crater radius from the rim.
[67] The impact melt region clearly contains rocky sur-faces, but these are limited to steeper and rough terrains andareas adjacent to these terrains or within impact craters onthe melt region (Figure 21). Relatively featureless and levelsurfaces have been mantled by an insulating regolith cover.This cover is likely to be quite thin as small impacts on thesesurfaces expose rocks that are clearly visible in LROCimages. Mendell [1976] also noticed the lack of elevatedtemperatures over impact melts in Copernicus Crater. It ispossible that mass wasting of fine particulate material fromcrater walls mantles the floor or that somehow impact meltshave mechanical properties that result in a more rapiddevelopment of regolith cover [Mendell, 1976]. In the case
Figure 22. Rock concentration values with the LROC WAC global mosaic used for shading. Rock con-centrations are progressively diminished with increasing age. Craters shown (from youngest to oldest;Neukum and Koenig [1976]) are Tycho (Copernican period), Arstarchus (Copernican), Copernicus(Copernican), Bullialdus (Eratosthenian), and Manilius (Eratosthenian).
BANDFIELD ET AL.: LUNAR SURFACE ROCK ABUNDANCE E00H02E00H02
16 of 18

of King Crater, the melt is extensive enough and external tothe crater so that mantling of the material through masswasting from adjacent steep slopes is not possible. Althoughsome impact melt surfaces may be relatively young andlikely started without a regolith cover, the development ofregolith over these surfaces over time appears to be similarto that of crater ejecta deposits and rock concentrations aretypically less than a few percent.4.4.3. Crater Ages and Regolith Thickness[68] As has been noted previously, rocks exposed at the
surface in the lunar environment are degraded over time,primarily by micrometeorite impacts [Thompson et al.,1974; Mendell, 1976]. As a result, only younger cratersshow elevated rock concentrations. For example, a trend ofdecreasing rock concentration with increasing age wasnoticed between Aristarchus, Kepler, and Copernicus Cra-ters by Mendell [1976].[69] Large young craters, such as Tycho, Giordano Bruno,
and Aristarchus, have continuous areas of elevated rockconcentrations that include the crater interior, rim andproximal ejecta. There is a clear contrast in both abundanceand spatial pattern of the surfaces bearing elevated rockconcentrations with older Copernican craters, such asCopernicus and Kepler. These older Copernican aged cratershave limited areas of highly elevated rock concentrationsthat are present on steep slopes. Elevated rock concentra-tions (and regolith temperatures) are present on the floor andproximal ejecta blanket, but these values are typically lessthan ∼2%. This trend continues with further subdued rockconcentrations and extents in Eratosthenian aged craters thathave only slightly elevated rock concentrations and noapparent increased rock concentrations immediately outsidethe crater rim. A general trend between crater age and rockabundance is clear from comparison of rock concentrationvalues between craters of a range of ages (Figure 22)[Neukum and Koenig, 1976]. Although it is likely that targetrock type and crater size influence the exposure of rocks atthe lunar surface, it is apparent that the relative age of craterformation can be quickly estimated by the extent and valuesof increased rock concentrations associated with the crater.This requires that the crater is large enough to excavatematerial beneath the local fine particulate regolith. This istypically the case for craters greater than several 10s of kmin diameter.[70] The association of crater size with excavation depth
allows for the estimation of regolith thickness. A fullassessment of regolith thickness from the association of rockconcentrations with crater diameter is beyond the scope ofthis work. However, it is apparent that numerous smallcraters excavate rocks within the younger Mare surfaces.This pattern is absent from both highlands and within theextended ejecta blankets of craters with radar dark “haloes.”[71] There are exceptions to this pattern. Dark mantled
deposits, for example, do not contain elevated rock con-centrations associated with small craters. This may notrepresent regolith thickness, however, as these deposits arelikely to be pyroclastic in nature and may not be of sufficientstrength to survive ejection and subsequent impact in acratering event. In addition, it is not uncommon for small(<1 km diameter) younger craters in the lunar highlands todisplay elevated rock concentrations. This implies that thelunar regolith thickness may be quite variable within the
highlands and rocky materials may be close to the surface inisolated locations.
5. Conclusions
[72] LRO Diviner radiometer data have been used toproduce rock concentration and regolith temperature mapswithin 60°N/S latitude. Although the data and model usedhere are relatively simple and necessarily require simplify-ing assumptions, there are clear correlations with blocksvisible in LROC images. There are also correlations withradar CPR data sets. The Diviner rock concentration andregolith temperature data discussed here are publicly avail-able at the Planetary Data System.[73] The derivation of rock abundance is largely driven by
anisothermality between spectral channels. Residual heatingon western facing slopes after sunset, for example, willdisplay higher regolith fines temperatures, but derived rockconcentration values are largely unaffected. In addition,crater floors, cold spots, dark mantled deposits, and distalejecta from young craters show trends in regolith tempera-ture independent of the presence of rocks. The crater floorsare likely warmed by downwelling radiance from adjacentcrater walls. However, in the other cases, regolith propertiesappear to have qualities different from typical lunar high-lands and maria regolith. There is a clear contrast betweenisothermal and anisothermal surfaces and the Diviner mul-tispectral data have been used to distinguish between thesesurfaces.[74] The extent and absolute value of rock concentrations
is correlated with crater age. Rocky surfaces are only pre-served on the youngest surfaces or where steep slopes occurand mass wasting prevents mantling with fines. The pres-ence of rocky surfaces excavated by young impacts allowsfor the estimation of minimum regolith thickness from thesize of the impact. A first order assessment shows that mariasurfaces typically have a thin regolith cover and many craterejecta and the lunar highlands have a thicker regolith, ashas been previously established. However, the excavationof rocky surfaces by small craters in the lunar highlandsimplies that this thick regolith is not uniform.[75] What we have described here is only an initial
description and assessment of the rock concentration andregolith fines temperature data sets. There appears to be agreat deal of potentially useful information present in thesedata and further validation, comparisons with other datasets, and focused studies are planned.
[76] Acknowledgments. We would like to thank the spacecraft andDiviner operations teams at Goddard Space Flight Center, Jet PropulsionLaboratory, and UCLA for their support. Comments from Sylvain Piqueuxand an anonymous reviewer were quite constructive and we hope that themanuscript has been significantly improved as a result of our efforts toaddress them. Support to J.L.B. for this work was provided by NASA grantNNX08AT73G under the Lunar Reconnaissance Orbiter ParticipatingScientist Program.
ReferencesAshley, J. W., et al. (2011), Geologic mapping of the King Crater regionwith an emphasis on melt pond anatomy: Evidence for subsurface drain-age on the Moon, Proc. Lunar Planet. Sci. Conf., 42, 2437.
Bandfield, J. L. (2009), Effects of surface roughness and graybody emissivityon Martian thermal infrared spectra, Icarus, 202, 414–428, doi:10.1016/j.icarus.2009.03.031.
BANDFIELD ET AL.: LUNAR SURFACE ROCK ABUNDANCE E00H02E00H02
17 of 18

Bandfield, J. L., and C. S. Edwards (2008), Derivation of Martian surfaceslope characteristics from directional thermal infrared radiometry, Icarus,193, 139–157, doi:10.1016/j.icarus.2007.08.028.
Campbell, B. A., B. R. Hawke, and T. W. Thompson (1997), Regolithcomposition and structure in the lunar maria: Results of long‐wavelengthradar studies, J. Geophys. Res., 102, 19,307–19,320, doi:10.1029/97JE00858.
Campbell, B. A., D. B. Campbell, J. L. Margot, R. R. Ghent, M. Nolan,J. Chandler, L. M. Carter, and N. J. S. Stacy (2007), Focused 70‐cmwavelength radar mapping of the Moon, IEEE Trans. Geosci. RemoteSens., 45, 4032–4042, doi:10.1109/TGRS.2007.906582.
Campbell, B. A., L. M. Carter, D. B. Campbell, M. Nolan, J. Chandler, R. R.Ghent, B. Ray Hawke, R. F. Anderson, and K. Wells (2010), Earth‐based12.6‐cm wavelength radar mapping of the Moon: New views of impactmelt distribution and mare physical properties, Icarus, 208, 565–573,doi:10.1016/j.icarus.2010.03.011.
Christensen, P. R. (1986), The spatial distribution of rocks on Mars, Icarus,68, 217–238, doi:10.1016/0019-1035(86)90020-5.
Cintala, M. J., and K. M. McBride (1995), Block distributions on the lunarsurface: A comparison between measurements obtained from surface andorbital photography, NASA Tech. Memo. 104804.
Colwell, J. E., and B. M. Jakosky (2002), Effects of topography on thermalinfrared spectra of planetary surfaces, J. Geophys. Res., 107(E11), 5106,doi:10.1029/2001JE001829.
Gaddis, L. R., C. M. Pieters, and B. R. Hawke (1985), Remote sensing oflunar pyroclastic mantling deposits, Icarus, 61, 461–489, doi:10.1016/0019-1035(85)90136-8.
Ghent, R. R., D. W. Leverington, B. A. Campbell, B. R. Hawke, and D. B.Campbell (2005), Earth‐based observations of radar‐dark crater haloeson the Moon: Implications for regolith properties, J. Geophys. Res.,110, E02005, doi:10.1029/2004JE002366.
Ghent, R. R., B. A. Campbell, B. R. Hawke, and D. B. Campbell (2008),Earth‐based radar data reveal extended deposits of the Moon’s Orientalebasin, Geology, 36, 343–346, doi:10.1130/G24325A.1.
Heiken, G. H., D. T. Vaniman, and B. M. French (1991), Lunar Source-book: A User’s Guide to the Moon. Research Supported by NASA,753 pp., Cambridge Univ. Press, Cambridge, U. K.
Helfenstein, P., and J. Veverka (1987), Photometric properties of lunar ter-rains derived from Hapke’s equation, Icarus, 72, 342–357, doi:10.1016/0019-1035(87)90179-5.
Horai, K.‐I., and G. Simmons (1972), Thermal property measurementson lunar material returned by Apollo 11 and 12 missions, ProgressAstronaut. Aeronaut., 28, 243–267.
Hörz, F., E. Schneider, D. E. Gault, J. B. Hartung, and D. E. Brownlee(1975), Catastrophic rupture of lunar rocks: A Monte Carlo simulation,Moon, 13, 235–258, doi:10.1007/BF00567517.
Hörz, F., R. Ostertag, and D. A. Rainey (1983), Bunte breccia of the Ries:Continuous deposits of large impact craters, Rev. Geophys. Space Phys.,21, 1667–1725, doi:10.1029/RG021i008p01667.
Keihm, S. J., K. Pieters, M. G. Langseth, and J. L. Chute Jr. (1973), Apollo15 measurements of lunar surface brightness temperatures thermal con-ductivity of the upper 1 1/2 meters of regolith, Earth Planet. Sci. Lett.,19, 337–351, doi:10.1016/0012-821X(73)90084-8.
Melosh, H. J. (1989), Impact Cratering: A Geologic Process, OxfordMonogr. Geol. Geophys., vol. 11, 253 pp., Oxford Univ. Press, NewYork.
Mendell, W. W. (1976), Degradation of large, period II lunar craters, Proc.Lunar Planet. Sci. Conf., 7, 2705–2716.
Mendell, W. W., and F. J. Low (1974), Preliminary results of the Apollo 17infrared scanning radiometer, Moon, 9 , 97–103, doi:10.1007/BF00565396.
Mendell, W. W., and F. J. Low (1975), Infrared orbital mapping of lunarfeatures, Proc. Lunar Planet. Sci. Conf., 6, 2711–2719.
Neukum, G., and B. Koenig (1976), Dating of individual lunar craters,Proc. Lunar Planet. Sci. Conf., 7, 2867–2881.
Nowicki, S. A., and P. R. Christensen (2007), Rock abundance on Marsfrom the Thermal Emission Spectrometer, J. Geophys. Res., 112,E05007, doi:10.1029/2006JE002798.
Nozette, S., et al. (2010), The Lunar Reconnaissance Orbiter MiniatureRadio Frequency (Mini‐RF) technology demonstration, Space Sci.Rev., 150, 285–302, doi:10.1007/s11214-009-9607-5.
Oberbeck, V. R. (1975), The role of ballistic erosion and sedimentation inlunar stratigraphy, Rev. Geophys., 13, 337–362, doi:10.1029/RG013i002p00337.
Paige, D. A., et al. (2010), The Lunar Reconnaissance Orbiter DivinerLunar Radiometer experiment, Space Sci. Rev., 150, 125–160,doi:10.1007/s11214-009-9529-2.
Price, S. D., D. Mizuno, and T. L. Murdock (2003), Thermal profiles of theeclipsed Moon, Adv. Space Res., 31, 2299–2304, doi:10.1016/S0273-1177(03)00531-3.
Robinson, M. S., et al. (2010), Lunar Reconnaissance Orbiter Camera(LROC) instrument overview, Space Sci. Rev. , 150 , 81–124,doi:10.1007/s11214-010-9634-2.
Roelof, E. C. (1968), Thermal behavior of rocks on the lunar surface, Icarus,8, 138–159, doi:10.1016/0019-1035(68)90069-9.
Shorthill, R. W. (1970), Infrared Moon: A review, J. Spacecraft Rockets, 7,385–397, doi:10.2514/3.29952.
Thompson, T. W., H. Masursky, R. W. Shorthill, G. L. Tyler, and S. H.Zisk (1974), A comparison of infrared, radar, and geologic mapping oflunar craters, Moon, 10, 87–117, doi:10.1007/BF00562019.
Tooley, C. R., M. B. Houghton, R. S. Saylor, C. Peddie, D. F. Everett, C. L.Baker, and K. N. Safdie (2010), Lunar Reconnaissance Orbiter Missionand spacecraft design, Space Sci. Rev., 150, 23–62, doi:10.1007/s11214-009-9624-4.
Urquhart, M. L., and B. M. Jakosky (1997), Lunar thermal emission andremote determination of surface properties, J. Geophys. Res., 102,10,959–10,969, doi:10.1029/97JE00224.
Vasavada, A. R., D. A. Paige, and S. E. Wood (1999), Near‐surface tem-peratures on Mercury and the Moon and the stability of polar ice depos-its, Icarus, 141, 179–193, doi:10.1006/icar.1999.6175.
J. L. Bandfield, Johnson Hall 070, Box 351310, University ofWashington, Seattle, WA 98195‐1310, USA. ([email protected])R. R. Ghent, Department of Geology, University of Toronto, Earth
Sciences Centre, 22 Russell St., Toronto, ON M5S 3B1, Canada.S. J. Lawrence and M. S. Robinson, School of Earth and Space
Exploration, Arizona State University, Tempe, AZ 85251, USA.D. A. Paige, Earth and Space Sciences, UCLA, PO Box 951567,
Los Angeles, CA 90095‐1567, USA.A. R. Vasavada, Jet Propulsion Laboratory, California Institute of
Technology, M.S. 321‐220, 4800 Oak Grove Dr., Pasadena, CA 91109,USA.
BANDFIELD ET AL.: LUNAR SURFACE ROCK ABUNDANCE E00H02E00H02
18 of 18