lung tumor segmentation using otsu thresholding
TRANSCRIPT

LUNG TUMOR SEGMENTATION USING
OTSU THRESHOLDING
A THESIS SUBMITTED TO THE GRADUTE
SCHOOL OF APPLIED SCIENCES
OF
NEAR EAST UNIVERSITY
by
BUSE UĞUR
In Partial Fulfillment of the Reguirements for
the Degree of Master of Science
in
Biomedical Engineering
NICOSIA, 2017
BU
SE
UĞ
UR
NE
U, 2
01
7


LUNG TUMOR SEGMENTATION USING
OTSU THRESHOLDING
A THESIS SUBMITTED TO THE GRADUTE
SCHOOL OF APPLIED SCIENCES
OF
NEAR EAST UNIVERSITY
by
BUSE UĞUR
In Partial Fulfillment of the Reguirements for
the Degree of Master of Science
in
Biomedical Engineering
NICOSIA, 2017

I hereby declare that all information in this document has been obtained and presented
in accordance with academic rules and etical conduct. I also declare that, as required by
these rules and conduct, I have fully cited and referenced all material and results that are
not original to this work.
Name, Last name:
Signature:
Date:

i
ACKNOWLEDGEMENTS
I would like to express my great gratitude to Assist. Prof. Dr. Kamil Dimililer, my
supervisor, for his patience and encouragement throughout this research. I am very grateful
to him for giving me this opportunity.
I would also like to express my appreciation to Prof. Dr. Ali Unal Sorman who has
provided me with contructive inputs and invaluable advices for the maturation my thesis.
The time he has allocated to me is greatly appreciated.
I extend my thanks to Assist. Prof. Dr. Boran Sekeroglu as well, who lent his assistance to
me whenever I asked for it.
I am equally very thankful to my dear friends, Tareq Tarazi, Melda Kulle and Onuralp
Ozer, for their never-ending support to always keep me enthusiastic.
Lastly, my deepest thanks go to my family, my mother Serife Ugur, my sister Sude Ugur
and my father Omer Ugur, for always being there for me and making my life meaningful.
Nevertheless, special thanks goes to my dearest, mother, who has been alongside me for all
my life like a close friend,as well as an academic inspiration. Her generosity in asnwering
my endless questions her intellectual capacity and her motivational support has helped me
tremendously throughout the completion of my thesis.

ii
ABSTRACT
Lung cancer is one of the most common diseases and main cause of deaths in many
countries due its malignancy. The thesis is a development of an algorithm based medical
image processing to segment the lung tumor in CT images due to the lack of such
algorithms and approaches used to detect tumor where most of researches involve machine
learning to solve such segmentation problem. The work involves different image
processing tools which successfully achieved the required goals when combined and
successively applied.
The segmentation system comprises of different stages to finally reach its target which is to
segment the lung tumor. Image pre-processing takes place first where some enhancement
techniques are used to enhance and reduce noise in images. The next stage is where the
different parts in the images are seperated to be able to segment the tumor in later stages.
In this phase threshold was selected automatically which assures the right selection of all
images since the tumor have different gray-levels intensities in each image. Another
technique was also used here to remove the tumor from the thresholded image. Finally, the
lung tumor is accurately segmented by subtracting the thresholded and the other image.
The developed segmentation algorithm was tested on 70 tumor and non-tumor images
which shows a high accuracy of segmenting tumor of 97.14%. Moreover, the system
shows a high sensitivity and specificity of 100% and 96% respectively.
Keywords: Accuracy; image enhancement; image processing techniques; lung tumor;
segmentation; sensitivity; specificity; thresholding

iii
ÖZET
Kanser günümüzde en çok rastlanan sonu ölümle sonuçlanan hastalıklardan birisidir.
Akciğer kanseri ise en sık karşılaşılan ve tedavisi olmayan kanser türlerindendir. Bu
çalışmada, medikal alanda kullanılmak üzere görüntü işleme teknikleri içeren ve tomografi
görüntülerinde tümörün saptanması hedef alınarak geliştirilen algoritma kullanılmıştır. Bu
çalışmada kullanılan farklı görüntü işleme teknikleri başarıyla sonuca ulaşıp amacını elde
etmiştir. Akciğerde bulunan tümörü ayırabilmek için farklı aşamalarda oluşan
segmentasyon sistemi uygulanmıştır. Öncelikle görüntü ön işleme alınarak iyileştirme
dahteknikleri kullanıldı. Görüntülerdeki gürültüler azaltılarak daha iyi bir görüntü elde
edildi.
Daha sonra tümörün saptanabilmesi için görüntü farklı kısımlara bölünmüştür. Bu
aşamada ise eşik değeri otomatik olarak seçilerek görüntülerde bulunan tümörlerin farklı
gri seviyedeki yoğunluklarından meydana gelen çeşitliliği doğru bir şekilde seçilmesi
sağlanmıştır. Eşiklenen görüntüye uygulanan bir başka teknikle tümör yok edilmiştir. Son
olarak ise elde edilen bu görüntülerden eşiklenen görüntüler çıkartılarak tümör başarıyla
elde edilmiştir. Segmentasyon algoritmasında toplamda 70 adet olmak üzere tümörlü ve
tümörsüz akciğer görüntüleri test edilerek %97.14 oranında başarı sağlanmıştır. Ayrıca,
buna ek olarak sistemde duyarlılık %100 ve özgüllük ise %96 olarak hesaplanmıştır. Bu
sistemle, onkologlara ve radyologlara erken tanıda yardımcı olmak hedeflenmiştir
Anahtar Kelimeler: Akciğer tümörü; başarı; eşik; görüntü işleme teknikleri; görüntü
iyileştirme; hassasiyet; özgüllük; segmentasyon

iv
TABLE OF CONTENTS
ACKNOWLEDGMENTS..........................................................................................
ABSTRACT.................................................................................................................
ÖZET............................................................................................................................
TABLE OF CONTENTS...........................................................................................
LIST OF TABLES......................................................................................................
LIST OF FIGURES....................................................................................................
LIST OF ABBREVIATONS......................................................................................
CHAPTER ONE: INTRODUCTION.......................................................................
1.1 Contribution of Thesis.............................................................................................
1.2 Aim of Thesis..........................................................................................................
1.3 Limitations of the Thesis.........................................................................................
1.4 Thesis Overview.....................................................................................................
CHAPTER TWO: ANATOMY OF THE LUNG AND LUNG CANCER…........
2.1 Anatomy of the Lungs and the Respiratory System…………………..............
2.2 The Gas Exchange System…………......................................................................
2.3 The Breathing Process.............................................................................................
2.4 Common Lung Diseases…………………………………………….....................
2.4.1 Pneumonia……………………………………………………......................
2.4.2 Asthma……………………………………………………….....…..............
2.4.3 Emphysema………………………………………………………..............
2.4.4 Chronic bronchitis……………………………………………………..........
2.4.5 Chronic obstructive pulmonary disease (COPD)………………….............
2.4.6 Cystic fibrosis…………………………………………………...................
2.5 Lung Cancer............................................................................................................
2.6 Causes of Lung Cancer…………...........................................................................
2.6.1 Smoking……………………………......………….......................................
2.6.2 Passive smoking……………………………………………….....................
2.6.3 Asbestos fibers……………………………………………………..............
i
ii
iii
iv
viii
ix
x
1
5
6
6
6
7
7
7
8
9
9
9
9
10
10
10
10
11
11
12
12
v
2.6.4 Radon gas…...................................................................................................
2.6.5 Familial predisposition.…..............................................................................
2.6.6 Lung diseases.…............................................................................................
2.6.7 Prior history of lung cancer.….......................................................................
2.6.8 Pollution……………………..…...................................................................
2.7 Types of Lung Cancer……………………….........................................................
2.7.1 SCLC……………………..…........................................................................
2.7.2 NSCLC……………………..….....................................................................
2.7.3 Bronchial carcinoids……………………..….................................................
2.8 The Signs and Symptoms of Lung Cancer………………......................................
2.8.1 No symptoms……………........………..…...................................................
2.8.2 Symptoms related to the cancer……………………..…...............................
2.8.3 Symptoms related to the metastasis…………….....…..…............................
2.8.4 Paraneoplastic symptoms………..............…………..…...............................
2.8.5 Nonspecific symptoms……..................………………..…...........................
2.9 Diagnostic Lung Cancer..........................................................................................
2.10 Staging of Lung Cancer........................................................................................
2.11 Treatment of Lung Cancer....................................................................................
2.11.1 Surgery........................…….................………………..…..........................
2.11.2 Radiation......................…….................………………..….........................
2.11.3 Chemotherapy..............................................................................................
2.11.4 Brain prophylactic radiation.......…....………………..…............................
2.11.5 Treatment of recurrence.............…...…...……………..…..........................
2.11.6 Targeted therapy........................…...…...……………..…...........................
2.11.7 Photodynamic therapy (PDT)......................................................................
2.11.8 Radiofrequency ablation (RFA)...................................................................
2.11.9 Experimental therapies.................................................................................
2.12 The Prognosis (outcome) of Lung Cancer............................................................
CHAPTER THREE: IMAGE PROCESSING.........................................................
3.1 Introduction.............................................................................................................
3.1.1 Purpose of image processing..........................................................................
3.1.2 Types..............................................................................................................
13
13
14
14
14
14
14
15
16
16
16
17
17
17
17
18
22
23
23
24
25
26
26
27
27
28
28
28
30
30
31
32

vi
3.2 Image Processing Basics.........................................................................................
3.3 Image Analysis Strategies.......................................................................................
3.4 Image Processing Applications...............................................................................
3.4.1 Medical image processing..............................................................................
3.5 Computerized Image Processing Requirements for Medical Applications……....
3.6 Image Enhancements..............................................................................................
3.7 Data Compression and Data Redundancy...............................................................
3.7.1 Compression methods....................................................................................
3.8 Image Segmentation................................................................................................
3.8.1 Thresholding..................................................................................................
CHAPTER FOUR: DESIGNED LUNG TUMOR SEGMENTATION SYSTEM
4.1 Methodology...........................................................................................................
4.1.1 Proposed system.............................................................................................
4.1.2 Flowchart........................................................................................................
4.1.3 Advantages of proposed system.....................................................................
4.2 Proposed System Procedure....................................................................................
4.2.1 Database.........................................................................................................
4.2.2 Morphological operations..............................................................................
4.2.3 Image filtering................................................................................................
4.2.4 Threshold segmentation.................................................................................
4.2.5 Small objects removal....................................................................................
4.2.6 Image subtraction...........................................................................................
CHAPTER FIVE: RESULTS AND DISCUSSION.................................................
5.1 System Performance................................................................................................
5.2 Result Discussion....................................................................................................
5.3 Result Comparison..................................................................................................
CHAPTER SIX: CONCLUSION AND RECOMMENDATIONS.........................
6.1 Conclusion...............................................................................................................
6.2 Recommendations...................................................................................................
32
33
34
34
35
36
37
38
39
41
42
42
42
43
43
43
44
42
47
49
53
55
58
58
60
61
64
64
65

vii
REFERENCES............................................................................................................
APPENDICES.............................................................................................................
Appendix A: Source Code...........................................................................................
Appendix B: Database.................................................................................................
66
75
76
79

viii
LIST OF TABLES
Table 1:
Table 2:
Table 3:
The segmentation ratio of the system.........................................................
The performance ratio of the system..........................................................
Comparison of the system..........................................................................
59
60
63

ix
LIST OF FIGURES
Figure 3.1
Figure 3.2
Figure 3.3
Figure 3.4
Figure 4.1
Figure 4.2
Figure 4.3
Figure 4.4
Figure 4.5
Figure 4.6
Figure 4.7
Figure 4.8
Figure 4.9
Figure 4.10
Figure 4.11
Figure 4.12
Figure 4.13
Figure 4.14
Example of image enhancement.................................................................
Lossy compression......................................................................................
Lossless compression..................................................................................
Threshold based segmentation....................................................................
Flowchart of the proposed system..............................................................
Samples of original CT images...................................................................
Erosion for abnormal images......................................................................
Erosion for normal image...........................................................................
Filtration process........................................................................................
Median filtering for normal images............................................................
Median filtering for filtered abnormal images............................................
Thresholding for abnormal images.............................................................
Thresholding for normal images...............................................................
Object removal for normal images............................................................
Object removal for abnormal images........................................................
Image subtraction for normal image..........................................................
Image subtraction for abnormal images....................................................
Steps of the processing system..................................................................
37
38
39
40
43
44
45
46
47
48
48
50
53
53
54
55
56
56

x
LIST OF ABBREVIATIONS
NSCLC
SCLC
MRI
CT
CO2
COPD
CFTR
U.S
%
ACTH
PET
FNA
PDT
RFA
LIDC
GLCM
Non-small cell lung cancer
Small cell lung cancer
Magnetic resonance imaging
Computerized tomography
Carbon Dioxide
Chronic obstructive pulmonary disease
Cystic fibrosis trans membrane conductance regulator
United States
Percentage
Adrenocorticotrophic hormone
Positron emission tomography
Fine needle aspiration
Photodynamic therapy
Radiofrequency ablation
Lung Image Database Consortium
Gray-Level Co-occurrence Matrix

1
CHAPTER ONE
INTRODUCTION
This chapter makes a present of an overall introduction of the lung cancer. It discusses the
structure of the lung cancer, moreover types of it consisting benign and malignant tumors.
In this chapter, aims of the thesis are also described. In addition to this, the contributions of
the proposed work are discussed, as well as, the thesis overview and structure.
Cancer is the name given to a collection of related diseases. In all types of cancer, some of
the body‟s cells begin to divide without stopping and spread into surrounding tissues.
Cancer can start almost anywhere in the human body, which is made up of trillions of cells.
In a wide range of cancer, some portion of the body‟s cells, start to separate without halting
and spread into encompassing tissues. Tumor can begin anywhere within these cells. In
general the human cells develop and separate to form new cells as required by the body.
When cells are old, new cells usually substitute them, however when cancer occurs, this
process does not operate as it supposed to. The old cells do not die and the new cells are
formed without necessity. The cells keep on dividing without any restrictions and forms
outgrowths in the body called tumors. (Som et al., 2011)
Tumors are usually solid and are strong masses of tissue. Malignancies of the blood, for
example, leukaemia, by and large do not shape strong tumors. The cancerous tumors can
spread into, or attack the tissues close to them, these are called malignant. In addition, as
these tumors grow, some cancer cells can break off and travel to distant places in the body
through the blood or the lymph system and form new tumors far from the original tumor,
but benign tumors are not like malignant tumors, they do not spread or attack the tissues
surrounding them, or the tissues close to them. After removal either by surgery or by other
treatment procedures, benign tumors do not grow back. This is unlike malignant tumors,
which sometimes grow back after removal (Sayar et al., 2004 ).
Generally, benign tumors are not life threatening, except for the benign tumors that occur
in the brain. The brain benign tumors can be risky and can even be the cause of death of a
person.

2
Cancer cells differ from normal cells in many ways that allow them to grow out of control
and become invasive.The imperative contrast is that disease cells are not as specialized as
normal human cells in the body. Normal human cells can grow into cells performing
particular functions in the body but carcinogenic cells cannot. This causes them to spread
widely without a halt. The body uses a mechanism called programmed cell death also
called as apoptosis, where it does away with unwanted cells (Travis et al., 2013).
The cancer cells do not listen to signals sent by the body to stop dividing. The area around
tumor cells in some cases, like the non-carcinogenic human cells, blood vessels, gets
affected. This area is called microenvironment. The cancer cells can affect the normal cells
in such a way that they are forced to create blood vessels to feed the tumors and can get rid
of the excreta from the tumors.
The immune system, which is a system of organs and concentrated cells that shields the
body from diseases and different conditions are frequently dodged by the cancer
cells.Tumors can also use the immune system to stay alive and grow. For example, with
the help of certain immune system cells that normally prevent a runaway immune response,
cancer cells can actually keep the immune system from killing cancer cells (Lin and Yan,
2002).
The lungs are the parts of our body that we use to breathe. They supply oxygen to the
organs and tissues of the body. The lungs are divided into areas called lobes. The right lung
has three lobes and the left lung has two. Lung cancer is the type of cancer which unchecks
the growth of unusual cells either in one or in both the lungs. These anomalous cells do not
perform the functions of healthy human cells and do not mature into normal cells. This
abnormality affects the proper regular functioning of the lung of supplying oxygen to the
human body through blood. All though there are many advances in treatment procedures,
the lung cancer which is at an advanced stage or late stage is not often easily curable
(Gould et al., 2013).
There are two main types of primary lung cancer which one is known as the most common
type, Non-small cell lung cancer (NSCLC) and the other one is Small cell lung cancer
(SCLC) .The treatment of these two types of lung cancers is quite different as they behave

3
in different ways and respond to treatments differently. The most common known of lung
tumor is non-small cell lung cancer (NSCLC), as one of genuine ailments bringing on
death for human beings.Computer-aided diagnosis and survival prediction of NSCLC is of
great sign of cancer in diagnosis and treatment of people suffering from lung cancer (Wang
et al., 2014). The prognosis of lung malignancy is poor, in many nations only 10 percent of
survival rate for about five-year. Two major types of NSCLC are adenocarcinoma
(including bronchi alveolar carcinoma) which is about 40% and squamous cell carcinoma
about 25 - 30% (Wang et al., 2014).
Adenocarcinoma is a type of cancer that forms in mucus-secreting glands throughout the
body. It can occur in many different places in the body. Diagnostic tests vary according to
where the cancer is located. When diagnosing adenocarcinoma, some kind of tests may be
carried out. First one is biopsy which is the removal of a sample of abnormal tissue in the
body. Once the tissue is removed, a pathologist can examine it under a microscope to
determine whether cancer is present. If cancer is present, a biopsy can determine whether
the cancer originated at the biopsied site or in another part of the body. Secondly,
computerized tomography is an X-ray procedure that uses a computer to take detailed,
three-dimensional pictures of abnormal tissue in the body. CT scans are also performed
during treatment to check the effectiveness of current treatment and the last one is
magnetic resonance imaging (MRI) uses radiofrequency waves to create detailed cross-
sectional images of different parts of the body. Treatment for adenocarcinoma varies
depending on where it grows in the body, but may include. Usually the treatment for
adenocarcinoma varies depending on where it grows on the body (Ung et al., 2007). But
generally the treatment procedures include;
Surgery is one of the treatment option which is adenocarcinoma is often treated with
surgical removal of cancerous glandular tissue, as well as some surrounding tissue.
Minimally invasive surgical treatment methods can help to reduce healing time and
minimize the risk of infection after surgery.
Radiation therapy is typically used in combination with surgery and/or chemotherapy.
Advanced radiation therapies make use of image guidance before and during treatment to
target adenocarcinoma tumors, while sparing healthy tissues and surrounding organs.

4
Chemotherapy treats adenocarcinoma with drugs that destroy cancer cells, either
throughout the whole body, or in a specific area. In some cases, chemotherapy may be used
in combination with other forms of adenocarcinoma treatment, such as radiation therapy or
surgery (Anagnostou et al., 2012).
Squamous cell Carcinoma is found centrally in the lung and is generally linked to smoking.
This type of lung cancer is responsible for about 30 percent of all non-small cell lung
cancers. It is found centrally in the lung where the larger bronchi join the trachea to the
lung or in one of the main airway branches. This sort of lung tumor usually stays inside the
lungs. The cancer spreads though the lymph nodes and creates cavities. Squamous cell
carcinoma is usually found in the regions of the body affected by UV rays from the sun.
The squamous cell carcinoma of the lungs can be classified into 4 stages of cancer. In stage
1, the cancer is present within the lung and has not yet spread to other parts and lymph
nodes. In stage 2, the tumor already affected the nearby lymph nodes or is in a particular
part of the bronchi. In stage 3, the lungs are already affected by the carcinoma and In stage
4, other regions of the body get affected.
The usual symptoms of squamous cell carcinoma are coughing up blood, constant cough.
They usually show symptoms at very early stage as compared to other forms of lung
cancer. They usually obstruct the airways of the lungs causing infections like pneumonia
and damage part of the lung. There is a syndrome called Pancoast syndrome. The
syndrome starts at the beginning of the lungs and move on to other parts of the body
adjacent to them, is mostly caused by Squamous cell carcinoma. People with squamous
cell carcinoma are likewise more inclined to encounter a raised calcium level
(hypercalcemia) which can bring about weak muscles and other issues. Hypercalcemia is
one of the side effects of paraneoplastic disorder, and is created by a tumor which secrets a
hormone-like substance that brings the calcium level up in the blood.
The first step of detection of squamous cell carcinoma is through X-rays. If there is any
abnormalities in the lungs. The other diagnostic methods are The computed tomography of
the chest aids pathologists visualize the lungs and vessels inside them through non-invasive
imaging techniques. The technique also involves injecting a dye known as contrast dye into
the veins before scanning, so as to enable pathologists to clearly view the lungs. The

5
second one is Positron Emission Tomography test is a radiology test which is commonly
used alongside other diagnosis measures like CT scan. And the last one is Bronchoscopy
which is a process in which large tube is inserted in the passage of mouth or through the
nose in order to view the airways under medical supervision.
This thesis is a development of an image processing algorithm for accurate segmentation
of the lung tumor. The developed approach is purely image processing where it uses
different iimage preparing tools to reach its target: lung tumor segmentation. The
segmentation system can be mainly divided into three main stages. During the first stage,
the CT images are smoothed and enhanced using some image enhancement techniques
such as median filtering and image erosion. This helps in reducing the noise in an image
and clearly smoothes its edges. Secondly, the image is to be partitioned so that each part of
it is separated from the other. This is achieved by using thresholding which eliminated the
intensities which are lower than an automatically selected threshold. As a result of
thresholding, an image of tumor and clavicles is remained. The thresholded image also
undergoes a technique which helps in removing all parts in the image keeping only the
tumor. The third part of the segmentation system is to extract the tumor by subtracting the
thresholded image from the cleaned image which results in an image that contains only a
tumor. Experimentally, the system is tested using many tumor and non-tumor lung images
it outperforms the related systems listed in the state of art (Senthilkumaran and Vaithegi,
2016).
Overall, the developed segmentation system showed a great efficiency, accuracy,
sensitivity, and specificity in segmenting tumor present in a CT lung images
1.1 Contribution of Thesis
This thesis is a contribution to the international carcinoma diagnosis and early detection
researches around the world using image processing techniques in software programming.
It is a part of these ongoing researches to detect and diagnose lung cancer that purposes to
decrease the rate of presence of that disease and detect it in its earlier stages instead of
treating it prior to its growth and development. It can also help radiologists and doctors to
follow the condition of diseases at early stages.

6
However, the thesis provides different and additional methods and techniques to reach the
desired purpose which is to detect the tumor located in the lung, and then remove it from
the original image.
1.2 Aim of Thesis
The aim of this study is to develop an image processing algorithm for lung tumor detection
on CT Images. Proposed system is to ensure that oncologists and radiologists can easily
diagnose the illness and begin treatment as soon as possible.
Most of medical researchers appraised the analysis of sputum cells for early diagnosis of
lung cancer. Ultimate research relay on quantitative information for instance, the shape,
size and the ratio of the affected cells
1.3 Limitations of Thesis
The proposed image processing lung nodules detection system aims to detect the tumor in
the lungs image. However, the image contains many structures including the tumor.
Therefore, it was a bit though to segment the tumor where it is directly attached to the
lungs. Moreover, another limitation of the work is to get enough number of images to test
and evaluate the performance of system. Such databases are usually private for some
hospitals and research centers. Eventually one database is obtained and used for testing
purposes.
1.4 Thesis Overview
In this thesis; chapter one gives a brief introduction, aim of thesis and thesis overview.
Chapter two will discuss the related studies; Anatomy of lung, lung tumor and lung cancer.
Chapter three discusses the image processing fundamentals that includes; Image
Acquisition, Image Enhancement, Image Segmentation and Image Classification. Chapter
four discusses and explains the methodology that apply to detect lung tumor from CT
images. Chapter five introduces the obtained results from the proposed system designed,
discussions of the analysis results. Finally, in chapter six will talk about conclusion of the
thesis.

7
CHAPTER TWO
ANATOMY OF THE LUNG AND LUNG CANCER
In this chapter we will have a quick overview on the anatomy of the lungs, which is very
important to understand many of the structures we will see while interpreting the lung CT.
We will also have a quick look on the respiratory system, which will help in understanding
the internal structure of the lung. Then, we will cover some of the most common lung
diseases. Lastly, we will talk about lung cancer, the core disease we are working in
developing a system to diagnose.
2.1 Anatomy of the Lungs and the Respiratory System
The right lung consists of three lobes, while the left has only two lobes. Each lung has two
layers of pleura, which is filled in with a fluid called pleural fluid produced by the pleurae
to lubricate the surfaces of the pleura. The main entrance of the trachea into the lung is
called the primary bronchus, which is subdivided into secondary bronchi, then to tertiary
bronchi, and so on. The last end of the wind track are the alveoli, which are the final
branchings of the respiratory tree and act as the primary gas exchange units of the lung
(Ries et al., 2002).
2.2 The Gas Exchange System
The alveolar sacs consist of many alveoli and are composed of a single layer of epithelial
tissue. There are about 300 million alveoli in the adult lung. The alveoli are considered the
functional unit of the lung. In the spaces between the alveoli of the lungs is elastic
connective tissue which is important for exhalation. The alveoli are surrounded by a
network of pulmonary capillaries. These capillaries are made of simple squamous
epithelium, therefore there are only two cells between the air in the alveoli and the blood in
the pulmonary capillaries which permits efficient diffusion of gases. It is through the moist
walls of both the alveoli and the capillaries that rapid exchange of CO2 and O2 occurs.
Carbon dioxide diffuses from the red blood cells through the capillary walls, into the
alveoli. CO2 leaves the alveoli, exhaled through the nose and mouth. The opposite process
8
occurs with O2, which diffuses from the alveoli into the capillaries, and from there into the
red blood cells (Ichinose et al., 2001).
2.3 The Breathing Process
The diaphragm divides the body cavity into the abdominal cavity, which contains the
viscera (e.g. stomach and intestines) and the thoracic cavity, which contains the heart and
lungs.
The inner surface of the thoracic cavity and the outer surface of the lungs are lined with
pleural membranes which adhere to each other. If air is introduced between them, the
adhesion is broken and the natural elasticity of the lung causes it to collapse. This can
occur from trauma. And it is sometimes induced deliberately to allow the lung to rest. In
either case, reinflation occurs as the air is gradually absorbed by the tissues. Because of
this adhesion, any action that increases the volume of the thoracic cavity causes the lungs
to expand, drawing air into them. Inhalation is also called inspiration and is the movement
of air into the lungs. Changes in the shape and size of the thoracic cavity result in changes
in the air pressure within that cavity and in the lungs. The difference in air pressure causes
the movement of air into and out of the lungs. Air moves from an area there pressure is
high to area where pressure is lower. Respiratory muscles are responsible for changes in
the shape of the thoracic cavity that cause the air movements involved in breathing
(Tanaka et al., 2001).
During inspiration (inhaling),
The external intercostal muscles contract, lifting the ribs up and out.
The diaphragm contracts, drawing it down.
During expiration (exhaling), these processes are reversed and the natural
elasticity of the lungs returns them to their normal volume. At rest, we breathe 15-
18 times a minute exchanging about 500 ml of air.
In more vigorous expiration,
The internal intercostal muscles draw the ribs down and inward
The wall of the abdomen contracts pushing the stomach and liver upward.
9
Under these conditions, an average adult male can flush his lungs with about 4 liters of air
at each breath. This is called the vital capacity. Even with maximum expiration, about
1200 ml of residual air remain.
2.4 Common Lung Diseases
Common lung diseases are mentioned below.
2.4.1 Pneumonia
Pneumonia is an infection of the alveoli. It can be caused by many kinds of both bacteria
(e.g., Streptococcus pneumoniae) and viruses. Tissue fluids accumulate in the alveoli
reducing the surface area exposed to air. If enough alveoli are affected, the patient may
need supplemental oxygen (Martini et al., 1992).
2.4.2 Asthma
In asthma, periodic constriction of the bronchi and bronchioles makes it more difficult to
breathe in and, especially, out. Attacks of asthma can be:
triggered by airborne irritants such as chemical fumes and cigarette smoke
airborne particles to which the patient is allergic
2.4.3 Emphysema
In this disorder, the delicate walls of the alveoli break down, reducing the gas exchange
area of the lungs. The condition develops slowly and is seldom a direct cause of death.
However, the gradual loss of gas exchange area forces the heart to pump ever-larger
volumes of blood to the lungs in order to satisfy the body‟s needs. The added strain can
lead to heart failure.
The immediate cause of emphysema seems to be the release of proteolytic enzymes as part
of the inflammatory process that follows irritation of the lungs. Most people avoid this
kind of damage during infections, etc. by producing an enzyme inhibitor (a serpin) called
alpha-1 antitrypsin. Those rare people who inherit two defective genes for alpha-1
antitrypsin are particularly susceptible to developing emphysema (Izbichi et all., 1995).
10
2.4.4 Chronic bronchitis
Any irritant reaching the bronchi and bronchioles will stimulate an increased secretion of
mucus. In chronic bronchitis the air passages become clogged with mucus, and this leads to
a persistent cough. Chronic bronchitis is usually associated with cigarette smoking (Velzen
et al., 1997).
2.4.5 Chronic obstructive pulmonary disease (COPD)
Irritation of the lungs can lead to asthma, emphysema, and chronic bronchitis. And, in fact,
many people develop two or three of these together. This constellation is known as chronic
obstructive pulmonary disease (COPD).
Among the causes of COPD are
cigarette smoke (often)
cystic fibrosis (rare)
2.4.6 Cystic fibrosis
It is a genetic disorder caused by inheriting two defective genes for the cystic fibrosis
trans-membrane conductance regulator (CFTR), a trans-membrane protein needed for the
transport of Cl− ions out of the epithelial cells of the lung thus enabling water to follow by
osmosis. Diminished CFTR function reduces the water content of the fluid in the lungs
making it more viscous and difficult for the ciliated cells to move it up out of the lungs.
The accumulation of mucus plugs the air ways interfering with breathing and causing a
persistent cough. Cystic fibrosis is the most common inherited disease in the U.S. white
population (Riquet et al., 1999).
2.5 Lung Cancer
Tumors can be benign or malignant; when we speak of “cancer” we refer to those tumors
that are considered malignant. Benign tumors can usually be removed and do not spread to
other parts of the body. Malignant tumors, on the other hand, grow aggressively and invade
other tissues of the body, allowing entry of tumor cells into the bloodstream or lymphatic
system and then to other sites in the body. This process of spread is termed metastasis; the
areas of tumor growth at these distant sites are called metastases. Since lung cancer tends
to spread or metastasize very early in its course, it is a very life-threatening cancer and one

11
of the most difficult cancers to treat. While lung cancer can spread to any organ in the
body, certain organs -- particularly the adrenal glands, liver, brain, and bone -- are the most
common sites for lung-cancer metastasis. The lung is also a very common site for
metastasis from tumors in other parts of the body. Tumor metastases are made up of the
same type of cells as the original, or primary, tumor. For example, if prostate cancer
spreads via the bloodstream to the lungs, it is metastatic prostate cancer in the lung and is
not lung cancer (Goldman and Schafer, 2011).
Lung cancer is the most common cancer and the most common cause of cancer deaths in
U.S. males. Although more women develop breast cancer than lung cancer, since 1987
U.S. women have been dying in larger numbers from lung cancer than from breast cancer.
Lung cancer, like all cancer, is an uncontrolled proliferation of cells. There are several
forms of lung cancer, but the most common (and most rapidly increasing) types are those
involving the epithelial cells lining the bronchi and bronchioles. Ordinarily, the lining of
these airways consists of two layers of cells.
Chronic exposure to irritants causes the number of layers to increase. This is especially apt
to happen at forks where the bronchioles branch. The ciliated and mucus-secreting cells
disappear and are replaced by a disorganized mass of cells with abnormal nuclei. If the
process continues, the growing mass penetrates the underlying basement membrane. At
this point, malignant cells can break away and be carried in lymph and blood to other parts
of the body where they may lodge and continue to proliferate. It is this metastasis of the
primary tumor that eventually kills the patient (Ung et al., 2007).
2.6 Causes of Lung Cancer
Most cases of lung cancer are caused by smoking, although people who have never
smoked can also develop the condition. The causes of are lung cancer is described below.
2.6.1 Smoking
The incidence of lung cancer is strongly correlated with cigarette smoking, with about 90%
of lung cancers arising as a result of tobacco use. The risk of lung cancer increases with the
number of cigarettes smoked over time; doctors refer to this risk in terms of pack-years of

12
smoking history (the number of packs of cigarettes smoked per day multiplied by the
number of years smoked). For example, a person who has smoked two packs of cigarettes
per day for 10 years has a 20 pack-year smoking history. While the risk of lung cancer is
increased with even a 10-pack-year smoking history, those with 30-pack-year histories or
more are considered to have the greatest risk for the development of lung cancer. Among
those who smoke two or more packs of cigarettes per day, one in seven will die of lung
cancer (Stewart and Kleihues, 2003).
Pipe and cigar smoking can also cause lung cancer, although the risk is not as high as with
cigarette smoking. While someone who smokes one pack of cigarettes per day has a risk
for the development of lung cancer that is 25 times higher than a non-smoker, pipe and
cigar smokers have a risk of lung cancer that is about five times that of a non-smoker.
Tobacco smoke contains over 4,000 chemical compounds, many of which have been
shown to be cancer-causing, or carcinogenic. The two primary carcinogens in tobacco
smoke are chemicals known as nitrosamines and polycyclic aromatic hydrocarbons. The
risk of developing lung cancer decreases each year following smoking cessation as normal
cells grow and replace damaged cells in the lung. In former smokers, the risk of developing
lung cancer begins to approach that of a non-smoker about 15 years after cessation of
smoking (Johnson et al., 2001).
2.6.2 Passive smoking
Passive smoking, or the inhalation of tobacco smoke from other smokers sharing living or
working quarters, is also an established risk factor for the development of lung cancer.
Research has shown that non-smokers who reside with a smoker have a 24% increase in
risk for developing lung cancer when compared with other non-smokers. An estimated
3,000 lung cancer deaths occur each year in the U.S. that are attributable to passive
smoking (Whincup et al., 2004)
2.6.3 Asbestos fibers
Asbestos fibers are silicate fibers that can persist for a lifetime in lung tissue following
exposure to asbestos. The workplace is a common source of exposure to asbestos fibers, as
13
asbestos was widely used in the past as both thermal and acoustic insulation. Today,
asbestos use is limited or banned in many countries, including the U.S. Both lung cancer
and mesothelioma (cancer of the pleura of the lung as well as of the lining of the
abdominal cavity called the peritoneum) are associated with exposure to asbestos.
Cigarette smoking drastically increases the chance of developing an asbestos-related lung
cancer in exposed workers. Asbestos workers who do not smoke have a fivefold greater
risk of developing lung cancer than non-smokers, and those asbestos workers who smoke
have a risk that is 50 to 90 times greater than non-smokers (Dostert et al., 2008).
2.6.4 Radon gas
Radon gas is a natural, chemically inert gas that is a natural decay product of uranium.
Uranium decays to form products, including radon, that emit a type of ionizing radiation.
Radon gas is a known cause of lung cancer, with an estimated 12% of lung-cancer deaths
attributable to radon gas, or 15,000-22,000 lung cancer-related deaths annually in the U.S.,
making radon the second leading cause of lung cancer in the U.S. As with asbestos
exposure, concomitant smoking greatly increases the risk of lung cancer with radon
exposure. Radon gas can travel up through soil and enter homes through gaps in the
foundation, pipes, drains, or other openings. The U.S. Environmental Protection Agency
estimates that one out of every 15 homes in the U.S. contains dangerous levels of radon
gas. Radon gas is invisible and od or less, but it can be detected with simple test kits (Field
et al., 2000).
2.6.5 Familial predisposition
While the majority of lung cancers are associated with tobacco smoking, the fact that not
all smokers eventually develop lung cancer suggests that other factors, such as individual
genetic susceptibility, may play a role in the causation of lung cancer. Numerous studies
have shown that lung cancer is more likely to occur in both smoking and non-smoking
relatives of those who have had lung cancer than in the general population. Recent research
has localized a region on the long (q) arm of human chromosome number 6 that is likely to
contain a gene that confers an increased susceptibility to the development of lung cancer in
smokers (Flynn et al., 2005).

14
2.6.6 Lung diseases
The presence of certain diseases of the lung, notably chronic obstructive pulmonary
disease (COPD), is associated with an increased risk (four to six times the risk of a non-
smoker) for the development of lung cancer even after the effects of concomitant cigarette
smoking are excluded.
2.6.7 Prior history of lung cancer
Survivors of lung cancer have a greater risk than the general population of developing a
second lung cancer. Survivors of non-small cell lung cancers (NSCLCs) have an additive
risk of 1%-2% per year for developing a second lung cancer. In survivors of small cell lung
cancers (SCLCs), the risk for development of second cancers approaches 6% per year
(Miller et al., 2004).
2.6.8 Pollution
Air pollution from vehicles, industry, and power plants can raise the likelihood of
developing lung cancer in exposed individuals. Up to 1% of lung cancer deaths are
attributable to breathing polluted air, and experts believe that prolonged exposure to highly
polluted air can carry a risk for the development of lung cancer similar to that of passive
smoking
2.7 Types of Lung Cancer
Lung cancers, also known as bronchogenic carcinomas (carcinoma is another term for
cancer), are broadly classified into two types: small cell lung cancers (SCLC) and non-
small cell lung cancers (NSCLC). This classification is based upon the microscopic
appearance of the tumor cells themselves. These two types of cancers grow and spread in
different ways and may have different treatment options, so a distinction between these
two types is important (Travis et al., 2013).
2.7.1 SCLC
SCLC comprise about 20% of lung cancers and are the most aggressive and rapidly
growing of all lung cancers. SCLC are strongly related to cigarette smoking, with only 1%
15
of these tumors occurring in non-smokers. SCLC rapidly to many sites within the body and
are most often discovered after they have spread extensively. Referring to a specific cell
appearance often seen when examining samples of SCLC under the microscope, these
cancers are sometimes called oat cell carcinomas (Pataer et al., 2012).
2.7.2 NSCLC
NSCLC are the most common lung cancers, accounting for about 80% of all lung cancers.
NSCLC can be divided into three main types that are named based upon the type of cells
found in the tumor:
Adenocarcinomas are the most commonly seen type of NSCLC in the U.S. and comprise
up to 50% of NSCLC. While adenocarcinomas are associated with smoking like other lung
cancers, this type is observed as well in non-smokers who develop lung cancer. Most
adenocarcinomas arise in the outer, or peripheral, areas of the lungs.
Bronchioloalveolar carcinoma is a subtype of adenocarcinoma that frequently develops at
multiple sites in the lungs and spreads along the preexisting alveolar walls.
Squamous cell carcinomas were formerly more common than adenocarcinomas; at present,
they account for about 30% of NSCLC. Also known as epidermoid carcinomas, squamous
cell cancers arise most frequently in the central chest area in the bronchi.
Large cell carcinomas, sometimes referred to as undifferentiated carcinomas, are the least
common type of NSCLC.
Mixtures of different types of NSCLC are also seen.
Other types of cancers can arise in the lung; these types are much less common than
NSCLC and SCLC and together comprise only 5%-10% of lung cancers (Schild et al.,
2017).
16
2.7.3 Bronchial carcinoids
They account for up to 5% of lung cancers. These tumors are generally small (3-4 cm or
less) when diagnosed and occur most commonly in people under 40 years of age.
Unrelated to cigarette smoking, carcinoid tumors can metastasize, and a small proportion
of these tumors secrete hormone-like substances that may cause specific symptoms related
to the hormone being produced. Carcinoids generally grow and spread more slowly than
bronchogenic cancers, and many are detected early enough to be amenable to surgical
resection.
Cancers of supporting lung tissue such as smooth muscle, blood vessels, or cells involved
in the immune response can rarely occur in the lung.
As discussed previously, metastatic cancers from other primary tumors in the body are
often found in the lung. Tumors from anywhere in the body may spread to the lungs either
through the bloodstream, through the lymphatic system, or directly from nearby organs.
Metastatic tumors are most often multiple, scattered throughout the lung, and concentrated
in the peripheral rather than central areas of the lung (Sevastos et al., 2007).
2.8 The Signs and Symptoms of Lung Cancer
Symptoms of lung cancer are varied depending upon where and how widespread the tumor
is. Warning signs of lung cancer are not always present or easy to identify. A person with
lung cancer may have the following kinds of symptoms:
2.8.1 No symptoms
In up to 25% of people who get lung cancer, the cancer is first discovered on a routine
chest X-ray or CT scan as a solitary small mass sometimes called a coin lesion, since on a
two-dimensional X-ray or CT scan, the round tumor looks like a coin. These patients with
small, single masses often report no symptoms at the time the cancer is discovered (Travis
et al., 1999).

17
2.8.2 Symptoms related to the cancer
The growth of the cancer and invasion of lung tissues and surrounding tissue may interfere
with breathing, leading to symptoms such as cough, shortness of breath, wheezing, chest
pain, and coughing up blood (hemoptysis). If the cancer has invaded nerves, for example, it
may cause shoulder pain that travels down the outside of the arm (called Pancoast‟s
syndrome) or paralysis of the vocal cords leading to hoarseness. Invasion of the esophagus
may lead to difficulty swallowing (dysphagia). If a large airway is obstructed, collapse of a
portion of the lung may occur and cause infections (abscesses, pneumonia) in the
obstructed area.
2.8.3 Symptoms related to metastasis
Lung cancer that has spread to the bones may produce excruciating pain at the sites of bone
involvement. Cancer that has spread to the brain may cause a number of neurologic
symptoms that may include blurred vision, headaches, seizures, or symptoms of stroke
such as weakness or loss of sensation in parts of the body (Grippi, 1990).
2.8.4 Paraneoplastic symptoms
Lung cancers frequently are accompanied by symptoms that result from production of
hormone-like substances by the tumor cells. These paraneoplastic syndromes occur most
commonly with SCLC but may be seen with any tumor type. A common paraneoplastic
syndrome associated with SCLC is the production of a hormone called
adrenocorticotrophic hormone (ACTH) by the cancer cells, leading to over secretion of the
hormone cortisol by the adrenal glands (Cushing‟s syndrome). The most frequent
paraneoplastic syndrome seen with NSCLC is the production of a substance similar to
parathyroid hormone, resulting in elevated levels of calcium in the bloodstream.
2.8.5 Nonspecific symptoms
Nonspecific symptoms seen with many cancers, including lung cancers, include weight
loss, weakness, and fatigue. Psychological symptoms such as depression and mood
changes are also common (Andersen and Prakash, 1982).

18
2.9 Diagnosing Lung Cancer
Doctors use a wide range of diagnostic procedures and tests to diagnose lung cancer. These
include;
The history and physical examination may reveal the presence of symptoms or signs
that are suspicious for lung cancer. In addition to asking about symptoms and risk
factors for cancer development such as smoking, doctors may detect signs of
breathing difficulties, airway obstruction, or infections in the lungs. Cyanosis, a
bluish color of the skin and the mucous membranes due to insufficient oxygen in the
blood, that suggests compromised function of the lung. Likewise, changes in the
tissue of the nail beds, known as clubbing, may also indicate lung disease.
The chest X-ray is the most common first diagnostic step when any new symptoms
of lung cancer are present. The chest X-ray procedure often involves a view from
the back to the front of the chest as well as a view from the side. Like any X-ray
procedure, chest X-rays expose the patient briefly to a minimum amount of
radiation. Chest X-rays may reveal suspicious areas in the lungs but are unable to
determine if these areas are cancerous. In particular, calcified nodules in the lungs
or benign tumors called hamartomas may be identified on a chest X-ray and mimic
lung cancer (Strauss et al., 2008).
CT (computerized axial tomography scan, or CAT scan) scans may be performed on
the chest, abdomen, and/or brain to examine for both metastatic and primary tumor.
A CT scan of the chest may be ordered when X-rays do not show an abnormality or
do not yield sufficient information about the extent or location of a tumor. One
advantage of CT scans is that they are more sensitive than standard chest X-rays in
the detection of lung nodules. Sometimes intravenous contrast material is given
prior to the procedure to help delineate the organs and their positions. A CT scan
exposes the patient to a minimal amount of radiation. The most common side effect
is an adverse reaction to intravenous contrast material that may have been given
prior to the procedure. There may be resulting itching, a rash, or hives that generally
disappear rather quickly. Severe anaphylactic reactions (life-threatening allergic
reactions with breathing difficulties) to contrast material are rare. CT scans of the
19
abdomen may identify metastatic cancer in the liver or adrenal glands, and CT scans
of the head may be ordered to reveal the presence and extent of metastatic cancer in
the brain (Miller et al., 2004).
A technique called a low-dose helical CT scan (or spiral CT scan) is sometimes
used in screening for lung cancers. This procedure requires a special type of CT
scanner and has been shown to be an effective tool for the identification of small
lung cancers in smokers and former smokers.
Magnetic resonance imaging (MRI) scans may be appropriate when precise detail
about a tumor‟s location is required. The MRI technique uses magnetism, radio
waves, and a computer to produce images of body structures. As with CT scanning,
the patient is placed on a moveable bed which is inserted into the MRI scanner.
There are no known side effects of MRI scanning, and there is no exposure to
radiation. The image and resolution produced by MRI is quite detailed and can
detect tiny changes of structures within the body. People with heart pacemakers,
metal implants, artificial heart valves, and other surgically implanted structures
cannot be scanned with an MRI because of the risk that the magnet may move the
metal parts of these structures. (Tsubamoto et al., 2002).
Positron emission tomography (PET ) scanning is a specialized imaging technique
that uses short-lived radioactive drugs to produce three dimensional colored images
of those substances in the tissues within the body. While CT scans and MRI scans
look at anatomical structures, PET scans measure metabolic activity and functioning
of tissue. PET scans can determine whether a tumor tissue is actively growing and
can aid in determining the type of cells within a particular tumor. In PET scanning,
the patient receives a short half-lived radioactive drug and receives approximately
the amount of radiation exposure as two chest X-rays. The drug discharges particles
known as positrons from wherever they are taken up and used in the body. As the
positrons encounter electrons within the body, a reaction producing gamma rays
occurs. A scanner records these gamma rays and maps the area where the
radioactive drug is located. For example, combining glucose (a common energy

20
source in the body) with a radioactive substance will show where glucose is rapidly
being used, for example, in a growing tumor (Quekel et al., 2001).
Bronchoscopy, examination of the airways by bronchoscopy (visualizing the
airways through a thin, fiber optic probe inserted through the nose or mouth) may
reveal areas of tumor that can be sampled (biopsied) for diagnosis by a pathologist.
A tumor in the central areas of the lung or arising from the larger airways is
accessible to sampling using this technique. Bronchoscopy may be performed using
a rigid or a flexible, fiber optic bronchoscope and can be performed in a same-day
outpatient bronchoscopy suite, an operating room, or on a hospital ward. The
procedure can be uncomfortable, and it requires sedation or anesthesia. While
bronchoscopy is relatively safe, it must be carried out by a lung specialist
(pulmonologist or surgeon) experienced in the procedure. When a tumor is
visualized and adequately sampled, an accurate cancer diagnosis usually is
possible. Some patients may cough up dark-brown blood for one to two days after
the procedure. More serious but rare complications include a greater amount of
bleeding, decreased levels of oxygen in the blood, and heart arrhythmias as well as
complications from sedative medications and anesthesia (Vansteenkiste et al.,
1999).
Needle biopsy, fine needle aspiration (FNA) through the skin, most commonly
performed with radiological imaging for guidance, may be useful in retrieving cells
for diagnosis from tumor nodules in the lungs. Needle biopsies are particularly
useful when the lung tumor is peripherally located in the lung and not accessible to
sampling by bronchoscopy. A small amount of local anesthetic is given prior to
insertion of a thin needle through the chest wall into the abnormal area in the lung.
Cells are suctioned into the syringe and are examined under the microscope for
tumor cells. This procedure is generally accurate when the tissue from the affected
area is adequately sampled, but in some cases, adjacent or uninvolved areas of the
lung may be mistakenly sampled. A small risk (3%-5%) of an air leak from the
lungs (called a pneumothorax, which can easily be treated) accompanies the
procedure.
21
Thoracentesis, Sometimes lung cancers involve the lining tissue of the lungs
(pleura) and lead to an accumulation of fluid in the space between the lungs and
chest wall (called a pleural effusion). Aspiration of a sample of this fluid with a
thin needle (thoracentesis) may reveal the cancer cells and establish the diagnosis.
As with the needle biopsy, a small risk of a pneumothorax is associated with this
procedure (Burry et al., 1998).
Major surgical procedures, If none of the aforementioned methods yields a
diagnosis, surgical methods must be employed to obtain tumor tissue for diagnosis.
These can include mediastinoscopy (examining the chest cavity between the lungs
through a surgically inserted probe with biopsy of tumor masses or lymph nodes
that may contain metastases) or thoracotomy (surgical opening of the chest wall for
removal or biopsy of a tumor). With a thoracotomy, it is rare to be able to
completely remove a lung cancer, and both mediastinoscopy and thoracotomy carry
the risks of major surgical procedures (complications such as bleeding, infection,
and risks from anesthesia and medications). These procedures are performed in an
operating room, and the patient must be hospitalized (Veselle et al., 2002).
Bone scans are used to create images of bones on a computer screen or on film.
Doctors may order a bone scan to determine whether a lung cancer has
metastasized to the bones. In a bone scan, a small amount of radioactive material is
injected into the bloodstream and collects in the bones, especially in abnormal areas
such as those involved by metastatic tumors. The radioactive material is detected
by a scanner, and the image of the bones is recorded on a special film for
permanent viewing.
Sputum cytology, the diagnosis of lung cancer always requires confirmation of
malignant cells by a pathologist, even when symptoms and X-ray studies are
suspicious for lung cancer. The simplest method to establish the diagnosis is the
examination of sputum under a microscope. If a tumor is centrally located and has
invaded the airways, this procedure, known as a sputum cytology examination, may
allow visualization of tumor cells for diagnosis. This is the most risk-free and
inexpensive tissue diagnostic procedure, but its value is limited since tumor cells

22
will not always be present in sputum even if a cancer is present. Also,
noncancerous cells may occasionally undergo changes in reaction to inflammation
or injury that makes them look like cancer cells (Murray et al., 2002).
Blood tests, while routine blood tests alone cannot diagnose lung cancer, they may
reveal biochemical or metabolic abnormalities in the body that accompany cancer.
For example, elevated levels of calcium or of the enzyme alkaline phosphatase
may accompany cancer that is metastatic to the bones. Likewise, elevated levels of
certain enzymes normally present within liver cells, including aspartate
aminotransferase (AST or SGOT) and alanine aminotransferase (ALT or SGPT),
signal liver damage, possibly through the presence of metastatic tumor
(Rangdaeng et al., 2002).
2.10 Staging of Lung Cancer
The stage of a cancer refers to the extent to which a cancer has spread in the body. Staging
involves both evaluation of a cancer‟s size as well as the presence or absence of metastases
in the lymph nodes or in other organs. Staging is important for determining how a
particular cancer should be treated, since lung-cancer therapies are geared toward specific
stages. Staging of a cancer is also critical in estimating the prognosis of a given patient,
with higher-stage cancers generally having a worse prognosis than lower-stage cancers.
Doctors may use several tests to accurately stage a lung cancer, including laboratory (blood
chemistry) tests, X-rays, CT scans, bone scans, and MRI scans. Abnormal blood chemistry
tests may signal the presence of metastases in bone or liver, and radiological procedures
can document the size of a cancer as well as possible spread to other organs (Kiernan et al.,
2002).
I. NSCLC are assigned a stage from I to IV in order of severity:
In stage I, the cancer is confined to the lung.
In stages II and III, the cancer is confined to the chest (with larger and more
invasive tumors classified as stage III).
Stage IV cancer has spread from the chest to other parts of the body.

23
II. SCLC are staged using a two-tiered system:
Limited-stage SCLC refers to cancer that is confined to its area of origin in the
chest.
In extensive-stage SCLC, the cancer has spread beyond the chest to other parts of
the body (Graeter et al., 2003).
2.11 Treatment of Lung Cancer
Treatment for lung cancer can involve surgical removal of the cancer, chemotherapy, or
radiation therapy, as well as combinations of these treatments. The decision about which
treatments will be appropriate for a given individual must take into account the localization
and extent of the tumor as well as the overall health status of the patient.
As with other cancers, therapy may be prescribed that is intended to be curative (removal
or eradication of a cancer) or palliative (measures that are unable to cure a cancer but can
reduce pain and suffering). More than one type of therapy may be prescribed. In such
cases, the therapy that is added to enhance the effects of the primary therapy is referred to
as adjuvant therapy. An example of adjuvant therapy is chemotherapy or radiotherapy
administered after surgical removal of a tumor in order to be certain that all tumor cells are
killed (Bach et al., 2001).
2.11.1 Surgery
Surgical removal of the tumor is generally performed for limited-stage (stage I or
sometimes stage II) NSCLC and is the treatment of choice for cancer that has not spread
beyond the lung. About 10%-35% of lung cancers can be removed surgically, but removal
does not always result in a cure, since the tumors may already have spread and can recur at
a later time. Among people who have an isolated, slow-growing lung cancer removed,
25%-40% are still alive five years after diagnosis. Surgery may not be possible if the
cancer is too close to the trachea or if the person has other serious conditions (such as
severe heart or lung disease) that would limit their ability to tolerate an operation. Surgery
is less often performed with SCLC because these tumors are less likely to be localized to
one area that can be removed (Schroen et al., 2000).
24
The surgical procedure chosen depends upon the size and location of the tumor. Surgeons
must open the chest wall and may perform a wedge resection of the lung (removal of a
portion of one lobe), a lobectomy (removal of one lobe), or a pneumonectomy (removal of
an entire lung). Sometimes lymph nodes in the region of the lungs are also removed
(lymphadenectomy). Surgery for lung cancer is a major surgical procedure that requires
general anesthesia, hospitalization, and follow-up care for weeks to months. Following the
surgical procedure, patients may experience difficulty breathing, shortness of breath, pain,
and weakness. The risks of surgery include complications due to bleeding, infection, and
complications of general anesthesia (Silvestri et al., 1998).
2.11.2 Radiation
Radiation therapy may be employed as a treatment for both NSCLC and SCLC. Radiation
therapy uses high-energy X-rays or other types of radiation to kill dividing cancer cells.
Radiation therapy may be given as curative therapy, palliative therapy (using lower doses
of radiation than with curative regimens), or as adjuvant therapy in combination with
surgery or chemotherapy. The radiation is either delivered externally, by using a machine
that directs radiation toward the cancer, or internally through placement of radioactive
substances in sealed containers within the area of the body where the tumor is localized.
Brachytherapy is a term used to describe the use of a small pellet of radioactive material
placed directly into the cancer or into the airway next to the cancer. This is usually done
through a bronchoscope (Laroche et al., 1998).
Radiation therapy can be given if a person refuses surgery, if a tumor has spread to areas
such as the lymph nodes or trachea making surgical removal impossible, or if a person has
other conditions that make them too ill to undergo major surgery. Radiation therapy
generally only shrinks a tumor or limits its growth when given as a sole therapy, yet in
10%-15% of people it leads to long-term remission and palliation of the cancer. Combining
radiation therapy with chemotherapy can further increase the chances of survival when
chemotherapy is administered. External radiation therapy can generally be carried out on
an outpatient basis, while internal radiation therapy requires a brief hospitalization. A
person who has severe lung disease in addition to a lung cancer may not be able to receive

25
radiotherapy to the lung. A type of external radiation therapy called the "gamma knife" is
sometimes used to treat single brain metastases. In this procedure, multiple beams of
radiation are focused on the tumor over a few minutes to hours while the head is held in
place by a rigid frame.
For external radiation therapy, a process called simulation is necessary prior to treatment.
Using CT scans, computers, and precise measurements, simulation maps out the exact
location where the radiation will be delivered, called the treatment field or port. This
process usually takes 30 minutes to two hours. The external radiation treatment itself
generally is done over four or five days a week for several weeks. Radiation therapy does
not carry the risks of major surgery, but it can have unpleasant side effects including
fatigue and lack of energy. A reduced white blood cell count (rendering a person more
susceptible to infection) and low blood platelet levels (making blood clotting more
difficult) can also occur with radiation therapy. If the digestive organs are in the field
exposed to radiation, patients may experience nausea, vomiting, or diarrhea. Radiation
therapy can irritate the skin in the area that is treated, but this irritation generally improves
with time after treatment has ended (Field et al., 2000).
2.11.3 Chemotherapy
Both NSCLC and SCLC may be treated with chemotherapy. Chemotherapy refers to the
administration of drugs that stop the growth of cancer cells by killing them or preventing
them from dividing. Chemotherapy may be given alone, as an adjuvant to surgical therapy,
or in combination with radiotherapy. While a number of chemotherapeutic drugs have been
developed, the class of drugs known as the platinum-based drugs have been the most
effective in treatment of lung cancers.
Chemotherapy is the treatment of choice for most SCLC, since these tumors are generally
widespread in the body when they are diagnosed. Only half of people who have SCLC
survive for four months without chemotherapy. With chemotherapy, their survival time is
increased up to four- to fivefold. Chemotherapy alone is not particularly effective in
treating NSCLC, but when NSCLC have metastasized, it can prolong survival in many
cases (Pataer et al., 2012).

26
Chemotherapy may be given as pills, as an intravenous infusion, or as a combination of the
two. Chemotherapy treatments are usually given in an outpatient setting. A combination of
drugs is given in a series of treatments, called cycles, over a period of weeks to months,
with breaks in between cycles. Unfortunately, the drugs used in chemotherapy also kill
normally dividing cells in the body, resulting in unpleasant side effects. Damage to blood
cells can result in increased susceptibility to infections and difficulties with blood clotting
(bleeding or bruising easily). Other side effects include fatigue, weight loss, hair loss,
nausea, vomiting, diarrhea, and mouth sores. The side effects of chemotherapy vary
according to the dosage and combination of drugs used and may also vary from individual
to individual. Medications have been developed that can treat or prevent many of the side
effects of chemotherapy. The side effects generally disappear during the recovery phase of
the treatment or after its completion (Schild et al., 2017).
2.11.4 Brain prophylactic radiation
SCLC often spreads to the brain. Sometimes people with SCLC that is responding well to
treatment are treated with radiation therapy to the head to treat very early spread to the
brain (called micro-metastasis) that is not yet detectable with CT or MRI scans and has not
yet produced symptoms. Brain radiation therapy can cause short-term memory problems,
fatigue, nausea, and other side effects.
2.11.5 Treatment of recurrence
Lung cancer that has returned following treatment with surgery, chemotherapy, and/or
radiation therapy is called recurrent or relapsed. If a recurrent cancer is confined to one site
in the lung, it may be treated with surgery. Relapsed tumors generally do not respond to the
chemotherapeutic drugs that were previously administered. Since platinum-based drugs are
generally used in initial chemotherapy of lung cancers, these agents are not useful in most
cases of recurrence. A type of chemotherapy referred to as second-line chemotherapy is
used to treat recurrent cancers that have previously been treated with chemotherapy, and a
number of second-line chemotherapeutic regimens have been proven effective at
prolonging survival. People with recurrent lung cancer who are well enough to tolerate
therapy are also good candidates for experimental therapies, including clinical trials
(Dostert et al., 2008).

27
2.11.6 Targeted therapy
One alternative to standard chemotherapy is the drug erlotinib (Tarceva) which may be
used in patients with NSCLC who are no longer responding to chemotherapy. It is a so-
called targeted drug, a drug that more specifically targets cancer cells, resulting in less
damage to normal cells. Erlotinib targets a protein called the epidermal growth factor
receptor (EGFR) that helps cells to divide. This protein is found at abnormally high levels
on the surface of some types of cancer cells, including many cases of non-small cell lung
cancer. Erlotinib is taken by mouth in pill form.
Other attempts at targeted therapy include drugs known as antiangiogenesis drugs, which
block the development of new blood vessels within a cancer. Without adequate blood
vessels to supply oxygenated blood, the cancer cells will die. The antiangiogenic drug
bevacizumab (Avastin) has recently been found to prolong survival in advanced lung
cancer when it is added to the standard chemotherapy regimen. Bevacizumab is given
intravenously every two to three weeks. However, since this drug may cause bleeding, it is
not appropriate for use in patients who are coughing up blood, if the lung cancer has spread
to the brain, or in people who are receiving anticoagulation therapy (“blood thinner”
medications). Bevacizumab is also not used in cases of squamous cell cancer, because it
leads to bleeding from this type of lung cancer (Flynn et al., 2005).
2.11.7 Photodynamic therapy (PDT)
One newer therapy used for different types and stages of lung cancer (as well as some
other cancers) is photodynamic therapy. In photodynamic treatment, a photosynthesizing
agent (such as a porphyrin, a naturally occurring substance in the body) is injected into the
bloodstream a few hours prior to surgery. During this time, the agent deposits itself
selectively in rapidly growing cells such as cancer cells. A procedure then follows in which
the physician applies a certain wavelength of light through a handheld wand directly to the
site of the cancer and surrounding tissues. The energy from the light activates the
photosensitizing agent, causing the production of a toxin that destroys the tumor cells. PDT
has the advantages that it can precisely target the location of the cancer, is less invasive
than surgery, and can be repeated at the same site if necessary. The drawbacks of PDT are
that it is only useful in treating cancers that can be reached with a light source and is not
28
suitable for treatment of extensive cancers. Research is ongoing to further determine the
effectiveness of PDT in lung cancer (Sevastos et al., 2007).
2.11.8 Radiofrequency ablation (RFA)
Radiofrequency ablation is being studied as an alternative to surgery, particularly in cases
of early stage lung cancer. In this newer type of treatment, a needle is inserted through the
skin into the cancer, usually under guidance by CT scanning.
Radiofrequency (electrical) energy is then transmitted to the tip of the needle where it
produces heat in the tissues, killing the cancerous tissue and closing small blood vessels
that supply the cancer. RFA usually is not painful and has been approved by the U.S. Food
and Drug Administration for the treatment of certain cancers including lung cancers.
Studies have shown that this treatment can prolong survival similarly to surgery, when
used to treat early stages of lung cancer, but without the risks of major surgery and the
prolonged recovery time associated with major surgical procedures (Tannehill et al., 1997).
2.11.9 Experimental therapies
Since no therapy is currently available that is absolutely effective in treating lung cancer,
patients may be offered a number of new therapies that are still in the experimental stage,
meaning that doctors do not yet have enough information to decide whether these therapies
should become accepted forms of treatment for lung cancer. New drugs or new
combinations of drugs are tested in so-called clinical trials, which are studies that evaluate
the effectiveness of new medications in comparison with those treatments already in
widespread use. Experimental treatments known as immunotherapies are being studied that
involve the use of vaccine-related therapies or other therapies that attempt to utilize the
body‟s immune system to fight cancer cells (Komaki et al., 2001).
2.12 The Prognosis (outcome) of Lung Cancer
The prognosis of lung cancer refers to the chance for cure or prolongation of life (survival),
and is dependent upon where the cancer is localized, the size of the cancer, the presence of
symptoms, the type of lung cancer, and the overall health status of the patient.

29
SCLC has the most aggressive growth of all lung cancers, with a median survival time of
only two to four months after diagnosis when untreated. (That is, by two to four months,
half of all patients have died.) However, SCLC is also the type of lung cancer most
responsive to radiation therapy and chemotherapy. Because SCLC spreads rapidly and is
usually disseminated at the time of diagnosis, methods such as surgical removal or
localized radiation therapy are less effective in treating this tumor type. However, when
chemotherapy is used alone or in combination with other methods, survival time can be
prolonged four- to fivefold; however, of all patients with SCLC, only 5%-10% are still
alive five years after diagnosis. Most of those who survive have limited-stage SCLC
(Travis et al., 2013).
In non-small cell lung cancer (NSCLC), results of standard treatment are generally poor in
all but the most localized cancers that can be surgically removed. However, in stage I
cancers that can be completely removed, five-year survival approaches 75%. Radiation
therapy can produce a cure in a small minority of patients with NSCLC and leads to relief
of symptoms in most patients. In advanced-stage disease, chemotherapy offers modest
improvements in survival time, although overall survival rates are poor.
The overall prognosis for lung cancer is poor when compared with some other cancers.
Survival rates for lung cancer are generally lower than those for most cancers, with an
overall five-year survival rate for lung cancer of about 16% compared to 65% for colon
cancer, 89% for breast cancer, and over 99% for prostate cancer (O‟Leary et al., 2017)
30
CHAPTER THREE
IMAGE PROCESSING
This chapter discusses a brief and general introduction of the image processing, since the
proposed system is based completely on image processing techniques and methods. It
briefly presents the history of image processing and how it has developed through years.
Moreover, this chapter explains the main image processing techniques that are used in each
image analysis system such as image enhancement and mage filtering. It also discusses
some applications of image processing in medicine and explains the image fusion.
3.1 Introduction
Image processing is a method to convert an image into digital form and perform some
operations on it, in order to get an enhanced image or to extract some useful information
from it. It is a type of signal dispensation in which input is image, like video frame or
photograph and output may be image or characteristics associated with that image.
Usually Image Processing system includes treating images as two dimensional signals
while applying already set signal processing methods to them.
It is among rapidly growing technologies today, with its applications in various aspects of
a business. Image Processing forms core research area within engineering and computer
science disciplines too (Andrew, 2008). Image processing basically includes the following
three steps.
Importing the image with optical scanner or by digital photography.
Analyzing and manipulating the image which includes data compression and image
enhancement and spotting patterns that are not to human eyes like satellite
photographs.
Output is the last stage in which result can be altered image or report that is based
on image analysis.
In parallel with space applications, digital image processing strategies started in the late
1960s and mid-1970s to be utilized as a part of restorative imaging, remote Earth assets
perceptions, and astronomy. The innovation in the mid-1970s of modernized hub

31
tomography (CAT), additionally called automated tomography (CT) for short, is a standout
amongst the most essential occasions in the use of image processing in restorative
judgment. Automated hub tomography is a procedure in which a ring of identifiers
surrounds an article (or quiet) and a X-beam source, concentric with the indicator ring,
turns about the object. The X-beams go through the item and are gathered at the inverse
end by the relating identifiers in the ring. As the source turns, this technique is repeated.
(Chaudhary and Singh, 2012)
Tomography comprises of calculations that utilize the sensed information to develop a
picture that speaks to a "cut" through the item. Movement of the item in a bearing opposite
to the ring of identifiers delivers an arrangement of such cuts, which constitute a three-
dimensional (3-D) version of within the article. Tomography was concocted freely by Sir
Godfrey N. Hounsfield and Professor Allan M. Cormack, who imparted the 1979 Nobel
Prize in Medicine for their creation. It is intriguing to note that X-beams were found in
1895 by Wilhelm Conrad Roentgen, for which he got the 1901 Nobel Prize for Physics.
These two creations, about 100 years separated, prompted a percentage of the most
dynamic application ranges of image processing today (Gonzalez and woods, 2004).
Medical image analysis is shifting from the visual analysis of planar images to the
computerized quantitative analysis of volumetric images. It is important to have high
performance computing power to handle the extra computation necessary for volumetric
images (Warfield et al., 1998).
3.1.1 Purpose of image processing
The purpose of image processing is divided into 5 groups. They are:
1. Visualization - Observe the objects that are not visible.
2. Image sharpening and restoration - To create a better image.
3. Image retrieval - Seek for the image of interest.
4. Measurement of pattern – Measures various objects in an image.
5. Image Recognition – Distinguish the objects in an image.

32
3.1.2 Types
The two types of methods used for Image Processing are Analog and Digital Image
Processing. Analog or visual techniques of image processing can be used for the hard
copies like printouts and photographs. Image analysts use various fundamentals of
interpretation while using these visual techniques. The image processing is not just
confined to area that has to be studied but on knowledge of analyst. Association is another
important tool in image processing through visual techniques. So analysts apply a
combination of personal knowledge and collateral data to image processing (Sharma and
Jindal, 2011).
Digital Processing techniques help in manipulation of the digital images by using
computers. As raw data from imaging sensors from satellite platform contains deficiencies.
To get over such flaws and to get originality of information, it has to undergo various
phases of processing. The three general phases that all types of data have to undergo while
using digital technique are Pre- processing, enhancement and display, information
extraction (Assefa et al., 2013).
3.2 Image Processing Basics
In the wake of changing over picture data into a cluster of numbers, the picture can be
controlled, prepared, and showed by PC. PC transforming is utilized for picture upgrade,
rebuilding, division, portrayal, distinguishment, and coding, remaking, change.
The general electronic picture changing system may be separated into three sections: The
information device (or digitizer), the mechanized processor, and the yield contraption
(Stefanescu et al., 2004).
The digitizer changes more than a perpetual tone and spatially persevering sparkle spread f
[x, y] to a discrete bunch (the propelled picture) fq [n, m], where n, m, besides fq are
numbers.
The modernized processor chips away at the propelled picture fq [n, m] to make an
alternate mechanized picture gq [k, c], where k, c, and gq are numbers. The yield

33
picture may be identified with in another heading system, in this way the use of
various records k and c.
The picture showcase changes over the propelled yield picture gq [k, c] afresh into
a ceaseless tone moreover spatially steady picture g [x, y] for audit. It should be
recognized that a couple of structures may not oblige a showcase (e.g., in machine
vision and fake insight applications); the yield may be a touch of information. For
example, a modernized imaging system that was expected to answer the request, Is
there confirmation of a ruinous tumor in this x-bar picture ideally would have two
possible yields (YES or NO), i.e., a singular bit of information (Teramato and
Fujita, 2013).
3.3 Image Analysis Strategies
Image analysis involves the conversion of features and objects in image data into
quantitative information about these measured features and attributes. Microscopy images
in biology are often complex, noisy, artifact-laden and consequently require multiple
image processing steps for the extraction of meaningful quantitative information (Korfiatis
et al., 2014).
An outline of a general strategy for image analysis is presented below:
1) The starting point in image analysis typically involves a digital image acquired using a
CCD camera. Raw microscopy images obtained on digital CCD cameras are subject to
various imperfections of the image acquisition setup, such as noise at low light levels,
uneven illumination, defective pixels, etc…We often need to first process the image to
correct for such defects and also to enhance the contrast to accentuate features of interest in
the image for subsequent analysis. In section II, we introduce various image transformation
and spatial filtering techniques that can be used for this purpose (Milan et al., 1998).
2) Having corrected artifacts and enhanced contrast in the images, we can apply various
computational techniques to extract features and patterns from the images. In the
following section, we describe various tools of morphological image processing and image
segmentation that can be used for this purpose (Dai et al., 2015).

34
3) After biological important features have been segmented from images, we can then
derive quantitative information from these features and objects. MATLAB provides a set
of tools that can be used to measure the properties of regions; the matrix representation of
images in MATLAB also allows for easy manipulation of data and calculation of quantities
from microscopy images (Suzuki et al., 2005).
3.4 Image Processing Applications
The field of digital image has rapidly expanded in the recent years. The usefulness of this
technology is clear in many different disciplines and areas (Andrew, 2008; Van et al.,
2001).
The fields of image processing are:
Robotics
Medical imaging
Machine vision
Digital camera images
3.4.1 Medical image processing
Restorative imaging has been experiencing an insurgency in the previous decade with the
coming of quicker, more precise, and less obtrusive gadgets. This has driven the
requirement for relating programming improvement which thusly has given a noteworthy
catalyst to new calculations in sign and picture transforming (Zhou et al., 2014).
In particular, in therapeutic imaging we have four key issues:
1. Segmentation - automated methods that create patient-specific models of relevant
anatomy from images;
2. Registration - automated methods that align multiple data sets with each other;
3. Visualization - the technological environment in which image-guided procedures can be
displayed;
Imaging innovation in Medicine made the specialists to see the inside parts of the body for
simple determination. It likewise helped specialists to make keyhole surgeries for coming

35
to the inside parts without truly opening excessively of the body. CT Scanner, Ultrasound
and Magnetic Resonance Imaging assumed control x-beam imaging by making the
specialists to take a gander at the body‟s subtle third measurement. With the CT Scanner,
body‟s inside can be uncovered with straight forwardness and the unhealthy territories can
be distinguished without bringing about either uneasiness or torment to the patient. X-ray
grabs signals from the body‟s attractive particles turning to its attractive tune and with the
assistance of its intense PC, changes over scanner information into uncovering pictures of
inward organs. Image processing strategies produced for breaking down remote sensing
information may be altered to dissect the yields of therapeutic imaging frameworks to get
best preference to break down indications of the patients without any difficulty (Rao and
Rao, 2004).
3.5 Computerized Image Processing Requirements for Medical Applications
• Interfacing Analog yields of sensors for example, magnifying lens, endoscopes,
ultrasound and so forth, to digitizers and thusly to Computerized Image Processing
frameworks (Paryeen and Kayitha, 2013).
• Image upgrades.
• Changing thickness element scope of B/W images.
• Color redress in shading images.
• Manipulating of hues inside an image.
• Contour discovery.
• Area estimations of the cells of a biomedical picture.
• Display of picture line profile.
• Restoration of images.
• Smoothing of images.
• Registration of different images.
• Construction of 3-D images from 2-D images.
• Generation of negative images.
• Zooming of images.
• Pseudo shading.
• Point to point estimations.
• Getting help impact.

36
3.6 Image Enhancements
Image enhancement is basically improving the interpretability or perception of information
in images for human viewers and providing „better‟ input for other automated image
processing techniques. The principal objective of image enhancement is to modify
attributes of an image to make it more suitable for a given task and a specific observer.
During this process, one or more attributes of the image are modified. The choice of
attributes and the way they are modified are specific to a given task. Moreover, observer-
specific factors, such as the human visual system and the observer‟s experience, will
introduce a great deal of subjectivity into the choice of image enhancement methods
(Kumar and Saini, 2013).
There exist many techniques that can enhance a digital image without spoiling it. The
enhancement methods can broadly be divided in to the following two categories:
1. Spatial Domain Methods
2. Frequency Domain Methods
In spatial domain techniques, we directly deal with the image pixels. The pixel values are
manipulated to achieve desired enhancement. In frequency domain methods, the image is
first transferred in to frequency domain. It means that, the Fourier Transform of the image
is computed first. All the enhancement operations are performed on the Fourier transform
of the image and then the Inverse Fourier transform is performed to get the resultant image.
These enhancement operations are performed in order to modify the image brightness,
contrast or the distribution of the grey levels. As a consequence the pixel value (intensities)
of the output image will be modified according to the transformation function applied on
the input values (Gonzalez and woods, 2001).
Image enhancement simply means, transforming an image f into image g using T. (Where
T is the transformation. The values of pixels in images f and g are denoted by r and s,
respectively. As said, the pixel values r and s are related by the expression,
(3.1)

37
where T is a transformation that maps a pixel value r into a pixel value s. The results of this
transformation are mapped into the grey scale range as we are dealing here only with grey
scale digital images.
Figure 3.1: Example of image enhancement (Fan et al., 2002).
3.7 Data Compression and Data Redundancy
Data compression is defined as the process of encoding data using a representation that
reduces the overall size of data. This reduction is possible when the original dataset
contains some type of redundancy. Digital image compression is a field that studies
methods for reducing the total number of bits required to represent an image. This can be
achieved by eliminating various types of redundancy that exist in the pixel values. In
general, three basic redundancies exist in digital images that follow. Psycho-visual
Redundancy: It is a redundancy corresponding to different sensitivities to all image signals
by human eyes. Therefore, eliminating some less relative important information in our
visual processing may be acceptable (Javed et al., 2013).
Inter-pixel Redundancy: It is a redundancy corresponding to statistical dependencies
among pixels, especially between neighboring pixels.
Coding Redundancy: The uncompressed image usually is coded with each pixel by a fixed
length. For example, an image with 256 gray scales is represented by an array of 8-bit
integers. Using some variable length code schemes such as Huffman coding and arithmetic
coding may produce compression. There are different methods to deal with different kinds
of aforementioned redundancies. As a result, an image compressor often uses a multi-step
algorithm to reduce these redundancies.
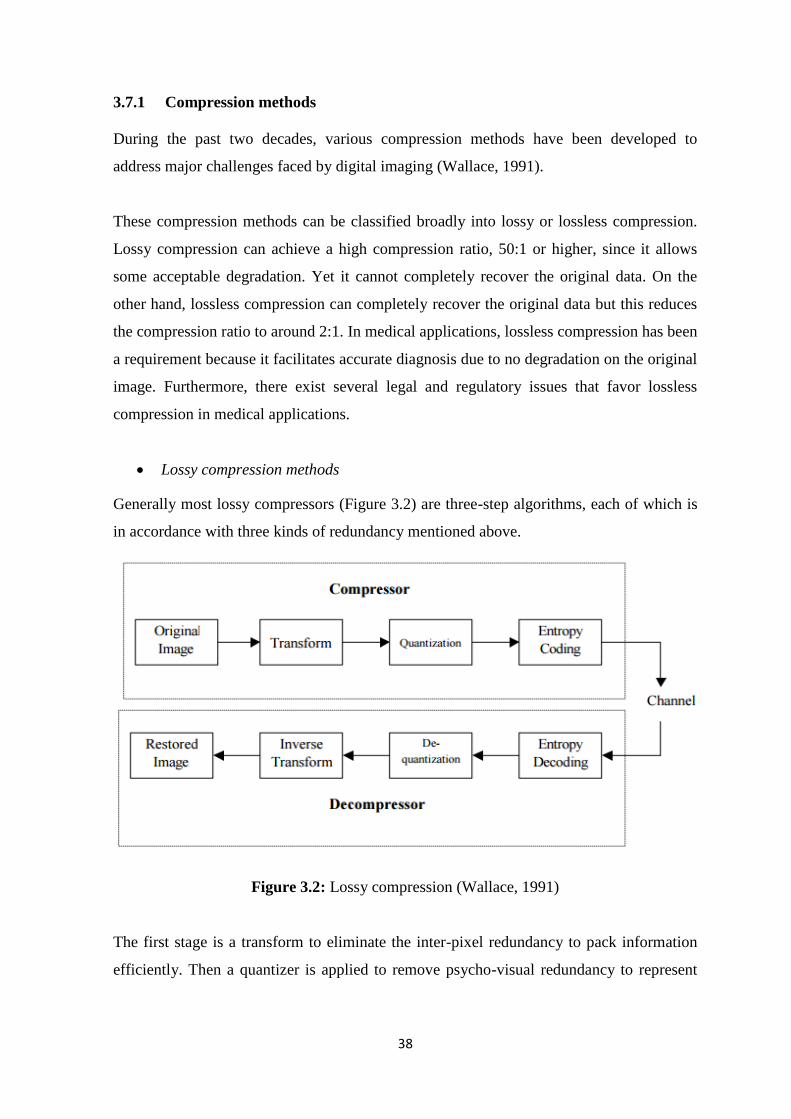
38
3.7.1 Compression methods
During the past two decades, various compression methods have been developed to
address major challenges faced by digital imaging (Wallace, 1991).
These compression methods can be classified broadly into lossy or lossless compression.
Lossy compression can achieve a high compression ratio, 50:1 or higher, since it allows
some acceptable degradation. Yet it cannot completely recover the original data. On the
other hand, lossless compression can completely recover the original data but this reduces
the compression ratio to around 2:1. In medical applications, lossless compression has been
a requirement because it facilitates accurate diagnosis due to no degradation on the original
image. Furthermore, there exist several legal and regulatory issues that favor lossless
compression in medical applications.
Lossy compression methods
Generally most lossy compressors (Figure 3.2) are three-step algorithms, each of which is
in accordance with three kinds of redundancy mentioned above.
Figure 3.2: Lossy compression (Wallace, 1991)
The first stage is a transform to eliminate the inter-pixel redundancy to pack information
efficiently. Then a quantizer is applied to remove psycho-visual redundancy to represent
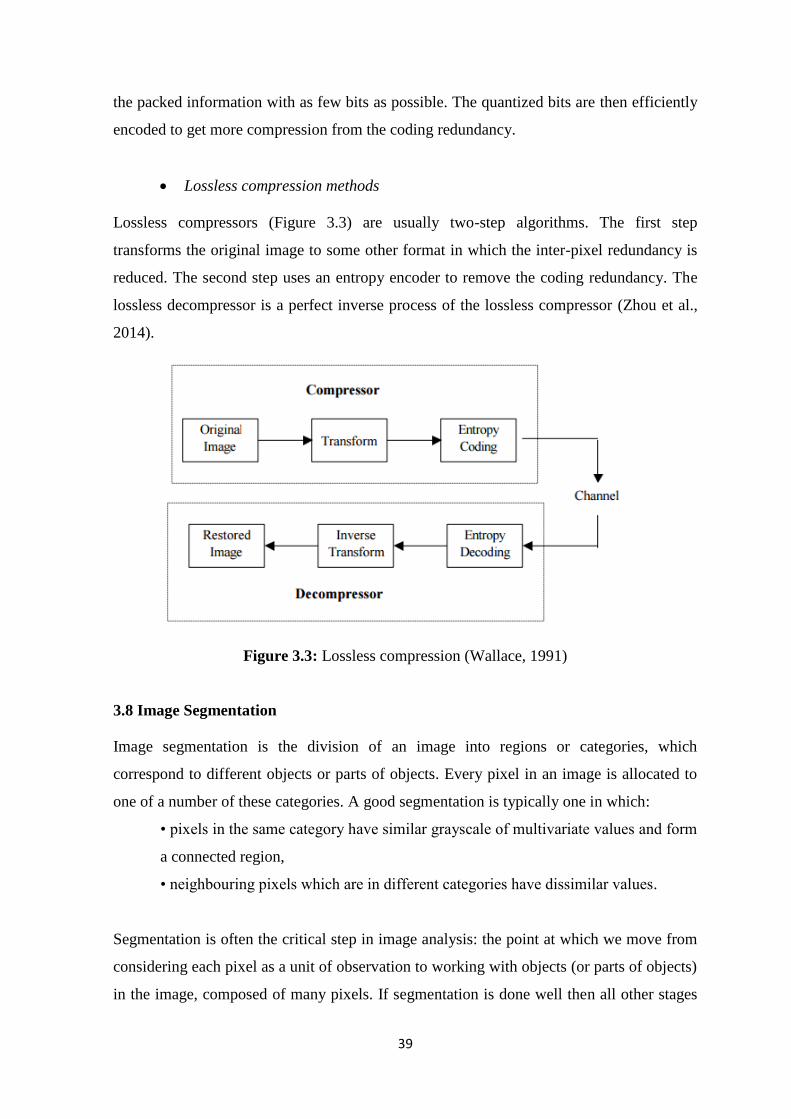
39
the packed information with as few bits as possible. The quantized bits are then efficiently
encoded to get more compression from the coding redundancy.
Lossless compression methods
Lossless compressors (Figure 3.3) are usually two-step algorithms. The first step
transforms the original image to some other format in which the inter-pixel redundancy is
reduced. The second step uses an entropy encoder to remove the coding redundancy. The
lossless decompressor is a perfect inverse process of the lossless compressor (Zhou et al.,
2014).
Figure 3.3: Lossless compression (Wallace, 1991)
3.8 Image Segmentation
Image segmentation is the division of an image into regions or categories, which
correspond to different objects or parts of objects. Every pixel in an image is allocated to
one of a number of these categories. A good segmentation is typically one in which:
• pixels in the same category have similar grayscale of multivariate values and form
a connected region,
• neighbouring pixels which are in different categories have dissimilar values.
Segmentation is often the critical step in image analysis: the point at which we move from
considering each pixel as a unit of observation to working with objects (or parts of objects)
in the image, composed of many pixels. If segmentation is done well then all other stages

40
in image analysis are made simpler. But, as we shall see, success is often only partial when
automatic segmentation algorithms are used. However, manual intervention can usually
overcome these problems, and by this stage the computer should already have done most
of the work (Zhang et al., 2010).
Segmentation algorithms may either be applied to the images as originally recorded, or
after the application of transformations and filters. After segmentation, methods of
mathematical morphology can be used to improve the results. The segmentation results
will be used to extract quantitative information from the images.
There are three general approaches to segmentation, termed thresholding, edge-based
methods and region-based methods.
• In thresholding, pixels are allocated to categories according to the range of values
in which a pixel lies.
• In edge-based segmentation, an edge filter is applied to the image, pixels are
classified as edge or non-edge depending on the filter output, and pixels which are
not separated by an edge are allocated to the same category.
• Region-based segmentation algorithms operate iteratively by grouping together
pixels which are neighbours and have similar values and splitting groups of pixels
which are dissimilar in value (Mansoor et al., 2014).
Figure 3.4: Threshold based segmentation (Saif et al., 2012)

41
3.8.1 Thresholding
This method converts a gray value image into a binary image. If a voxel has a value within
a certain threshold range it is assigned the value one, otherwise zero, where T1 and T2
represent the upper and lower bounds of the threshold interval. Often only T1 is specified,
assuming T2 to be the highest intensity value in the image.
Instead of using a fixed threshold range, an optimal threshold procedure can be used,
where for each input image the optimal threshold interval is determined. In (Hu et al.,
2001) for example, an iterative procedure is used to select the optimal threshold:
Ti+1
=
until T
i+1 = T
i (3.2)
In this equation Ti represents the threshold at step i, T
i+1 represents the threshold at step i+1.
Two types of voxels are distinguished: body voxels, belonging to the object, and non-body
or background voxels. The values νb and νn represent the mean gray level of the body
voxels and non-body voxels after segmentation with threshold Ti. The iteration is
initialized with a selected threshold T0 (Bhargavi and Jyothi, 2014).

42
CHAPTER FOUR
DESIGNED LUNG TUMOR SEGMENTATION SYSTEM
In this chapter segmentation of tumors within the lung using image processing techniques
will be proposed. Introducing main features and goals of the developed lung tumor
segmentation system will be discussed in this chapter. Furthermore, developed algorithms
of lung tumor segmentation by listing and explaining the methods used for the detection
process will be clarified. Database of the images which used for this research and
demonstrate some examples of the medical image processing system will be discussed.
4.1 Methodology
This section describes basic steps of lung tumor segmentation.
4.1.1 Proposed system
In this thesis, a Lung Tumor Segmentation System is designed. The system is a model
which found in image processing that combines different image processing techniques to
accomplish its goal that is the segmentation of the lung tumors placed into the lung and
segment them on the original image using threshold. The system is implemented and
simulated using Matlab programing language (Matlab 2013Ra, software tools).
Lung Tumor Segmentation System is based upon different image processing techniques
used for segmenting the lung tumor into a lung. The lung image database is an on-line CT
image dataset available for the researchers in the field of digital image processing. Firstly,
removing the noise from images, erosion and median filter are applied to the system
respectively. Afterwards, thresholding is applied to the filtered image which is one of the
most common techniques used in CT images. Threshold value is a specific value that turns
a grayscale image into a binary image due to thresholding method. Then, binary areas are
opened to remove small objects from threshold images. In last method, in order to create
tumor cells alone, difference between filtered image and small objects removed from the
images are taken into account
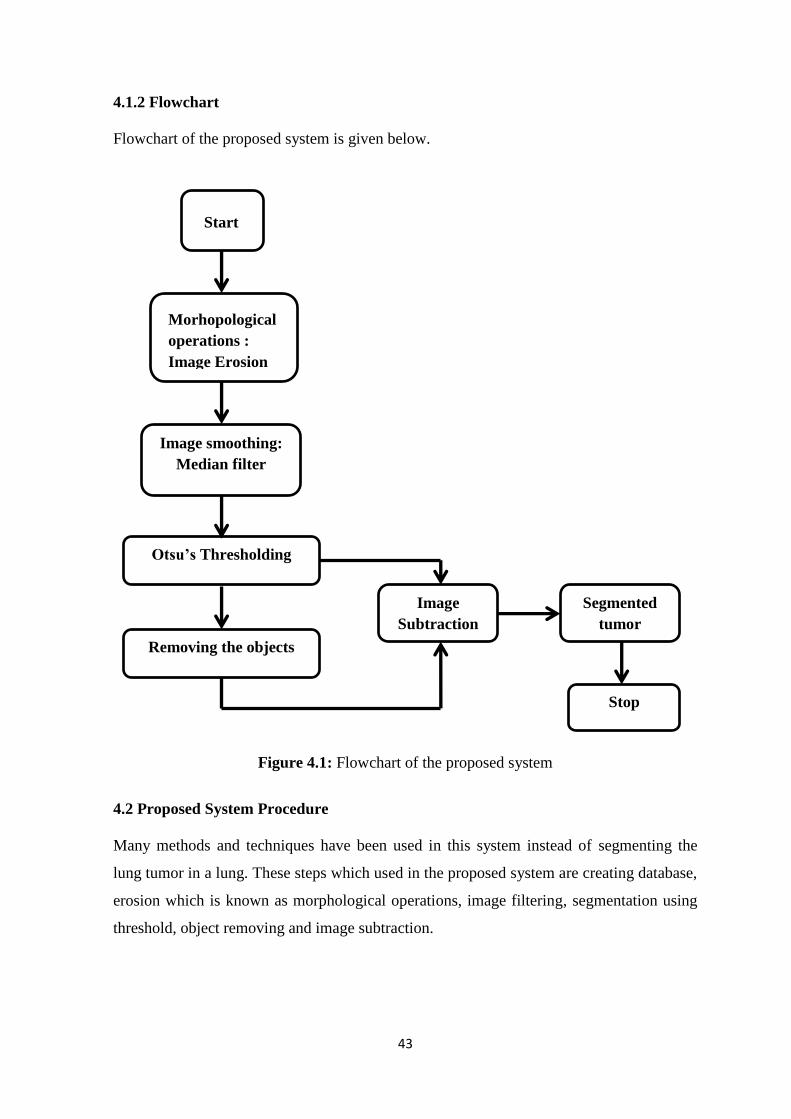
43
4.1.2 Flowchart
Flowchart of the proposed system is given below.
Figure 4.1: Flowchart of the proposed system
4.2 Proposed System Procedure
Many methods and techniques have been used in this system instead of segmenting the
lung tumor in a lung. These steps which used in the proposed system are creating database,
erosion which is known as morphological operations, image filtering, segmentation using
threshold, object removing and image subtraction.
Start
Morhopological
operations :
Image Erosion
Image smoothing:
Median filter
Otsu’s Thresholding
Removing the objects
Image
Subtraction
Segmented
tumor
Stop

44
4.2.1 Database
Computed tomography (CT) scan images are preferred to be used in this research, due to
low noise and better clarity compared to X-Ray and MRI images. The lung image database
has been chosen randomly from NIH/NCI Lung Image Database Consortium (LIDC)
which is an on-line CT image dataset available in the “Cancer Imaging Archieve” (Cancer
Imaging Archieve, 2014) for the researchers in the field of digital image processing. The
images used within this research are in .jpg format. Figure 4.2 shows samples of original
CT images. It converts original DICOM images which are in grey color to JPEG format by
removing the tint and saturation information while maintaining the luminance. The original
size of the images was 512*512 and then it converted to 256*256 to get better quality.
Then database is created by own system. There is 70 images which 50 of them has tumor
and 20 of them has non tumor in total. This number is enough since the designed system is
an image analysis and processing system.
Figure 4.2: Samples of original CT images
4.2.2 Morphological operations
Morphology operations can be characterized as a gathering of image processing procedures
that process images taking into account shapes. These morphological operations are taking

45
into account applying an organizing component to an input image keeping in mind the end
goal to make a yield image of the same size. In such operation, the estimation of every
pixel in the yield image is taking into account an examination of the comparing pixel in the
information picture with its neighbors. This is carried out by picking the size and state of
the area. At that point, we can build up a morphological operation that is delicate to
particular shapes in the input image (AKalaivani et al., 2013).
The structure element is a matrix consists of 0‟s and 1‟s, where the 1‟s are called the
neighbors. The value of each pixel in the output image is set according to a comparison of
the corresponding pixel in the input image with its neighbors. It has many shapes
according to its application. The most common and basic morphological operations are
dilation and erosion. Dilation is to add pixels to the boundaries of objects in an image,
while erosion is to remove pixels on object boundaries. The number of pixels that are
added or even removed from the structure in an image depends on the size and shape of the
structuring element that is used to process that image. In these morphological operations
(dilation and erosion), the condition of any given pixel in the output image can be
determined by applying a rule to the studied pixel and its neighbors in the input image
(Gonzalez and Woods, 2004).
(a) original image (b) eroded image
Figure 4.3: Erosion for abnormal images
The figure above shows the erosion of the input original grayscale image which contains
tumor. It shows that the erosion helped in margining the tumor and also shrinking it to be
separated from other tissues which help in later processing of the tumor.

46
Dilation
It is a morphological operation used to remove or add a pixel at object boundary based on
the shape and radius of its corresponding structuring element. During dilation, the value of
the output pixel is the maximum value of all the pixels in the input pixel of the set
neighborhood (Radha and Lakshman, 2013).
Erosion
This can be considered as a dual to dilation; it can be defined as dilation by set
complementation and vice versa. Thus, to erode an image we should dilate the complement
of it, while dilating an image can be accomplished by eroding the complement of the
image. In other words, we can say that the dilation can be used to expand foreground of the
image and shrinks its background, while erosion is used to shrink the image foreground
and expands its background (Radha and Lakshman, 2013).
In this work, only erosion was used to shrink the images. In our case, or system, the
“diamond” structure element with a “radius” of 2 is used to extract the background of the
image (Sahoo et al., 1988).
(a) original image (b) eroded image
Figure 4.4: Erosion for normal images
The image above shows a non-tumor image that undergoes erosion using the proposed
system.

47
4.2.3 Image filtering
Smoothing is an image processing technique used in order to reduce the noise in an image
to produce less pixelated and clearer image. Most smoothing techniques are based on low
pass linear filters. It is mostly based on the averaging technique of the input image or the
middle (median) value technique (Eng and Malek, 2001).
To perform a smoothing operation we will apply a filter to our image. The most common
type of filters is the linear filters such as median filter which is used in our proposed
system. This filter is used to reduce impulsive noise or the salt-and pepper in an image
with preserving the useful features and image edges. Median filtering is a linear process in
which the output of the being processed pixel is found by calculating the median of a
window of pixels that surrounds that studied pixel (Eng and Malek, 2001). In other words,
the median filter goes through each element of the image and replaces each pixel with the
median of its neighboring pixels which are located in a square neighborhood (kernel) of
5*5 pixels around the evaluated pixel.
What effect does this have on the boundary values? There are other approaches that have
different properties that might be preferred in particular circumstances:
Avoid processing the boundaries, with or without cropping the signal or image
boundary afterwards.
Fetching entries from other places in the signal. With images for example, entries
from the far horizontal or vertical boundary might be selected.
Shrinking the window near the boundaries, so that every window is full.
An example of a median filter:
Figure 4.5: Filtration process
3-by-3 adjacent block valuels:
6, 3, 4, 5, 2, 5, 4, 5, 9
Values after sorting process:
2, 3, 4, 4, 5, 5, 5, 6, 9
Median value:
5

48
Figure above illustrates an example of a median filter and its mechanism to reduce the
noise in an image by setting a kernel or window that goes through the whole matrix and
find an output for the processed pixel by calculate the median of the pixels in the window
(Church et. al, 2008). For figure 4.6 and 4.7; (a) is the eroded image, (b) is the median
filtered image.
(a) eroded image (b) median filtered image
Figure 4.6: Median filtering for normal images
(a) eroded image (b) median filtered image
Figure 4.7: Median filtering for abnormal images
It can be seen that the median filter helped in setting and smoothing the edges of the tumor
which makes it easy to be segmented in later techniques and also this filter helped to
reduce impulsive noise or the salt-and pepper in the image which is clear in the Figure 4.7
(a) with preserving the useful features and image edges by going through each element of
the image and replace each pixel with the median of its neighboring pixels which are
located in a square neighborhood (kernel) around the evaluated pixel.

49
4.2.4 Threshold segmentation
Thresholding is an important technique in image segmentation applications. The basic idea
of thresholding is to select an optimal gray-level threshold value for separating objects of
interest in an image from the background based on their gray-level distribution. While
humans can easily differentiate an object from complex background and image
thresholding is a difficult task to separate them (Gonzalez and Woods, 2007).
Image segmentation by thresholding is a simple but powerful approach for segmenting
images having light objects on dark background. Thresholding technique is based on image
space regions i.e. on characteristics of image. Thresholding operation convert a multilevel
image into a binary image i.e., it choose a proper threshold T, to divide image pixels into
several regions and separate objects from background.The gray-level histogram of an
image is usually considered as efficient tools for development of image thresholding
algorithms. Thresholding creates binary images from grey-level ones by turning all pixels
below some threshold to zero and all pixels above that threshold to one. If g(x, y) is a
threshold version of f(x, y) at some global threshold T, it can be defined as (Kang et al.,
2009 ).
g (x, y) = 1 if f(x, y) ≥ T
= 0 otherwise.
(4.1)
Most common threshold methods are described below:
Simple thresholding
Otsu thresholding

50
(a) median filetered image (b) thresholded image
Figure 4.8: Thresholding for abnormal images
Figure 4.8 shows the thresholding process of a tumor images. (a) shows the median filtered
image, (b) is the image after thresholding. It is noticeable that the tumor was correctly
separated from other parts such as lungs and the other structure in the image. This
technique allows the detection of the tumor as a separate object in the image. After this
technique the tumor is easier to be segmented since it is a standalone object in an image of
three structures or parts: lungs, cage, and tumor.
Simple thresholding
Threshold is one of the widely used methods for image segmentation. It is useful in
discriminating foreground from the background. By choosing an adequate threshold value
T, the gray level image can be transform in to binary image. The binary image must
contain required information about the position and shape of the objects of interest
(foreground) (Jain, 1986).
The advantage of obtaining first a binary image is that it reduces the complexity of the data
and simplifies the process of recognition and classification. The most usual way to convert
a gray-level image to a binary image is to select a single threshold value (T). Then all the
gray level values below this T will be classified as black (0), and those above T will be
white (1). The segmentation problem becomes one of selecting the proper value for the
threshold T.

51
Otsu thresholding
Otsu is an automatic threshold selection region based segmentation method. Another way
of accomplishing similar results is to set the threshold so as to try to make each cluster as
tight as possible, thus minimizing their overlap. Obviously, we can‟t change the
distributions, but we can adjust where we separate them (the threshold). As we adjust the
threshold one way, we increase the spread of one and decrease the spread of the other (Qu
and Hang, 2010)
Otsu method is of type global thresholding in which threshold value depends only on gray
value of the image. Otsu method was proposed by Scholar Otsu in 1979. Otsu method is
global thresholding selection method, which is widely used because it is simple and
effective (Gonzalez and Woods, 2007).
The Otsu method requires computing a gray level histogram before running. However,
because of the one-dimensional which only consider the gray-level information, it does not
give better segmentation result. Otsu‟s method was one of the better threshold selection
methods for general real world images with regard to uniformity and shape measures. But
this method does not work well with non-uniform illumination.
Considering, the pixels of a given picture be represented in L gray levels [1, 2,…, L]. The
number of pixels at level i is denoted by ni and the total number of pixels by N = n1 + n2 +
+ nL. In order to simplify the discussion, the gray-level histogram is normalized and
regarded as a probability distribution (Otsu, 1979):
∑
We divide the pixels into two classes CO and C1 (background and objects, or vice versa)
by a threshold at level k; CO denotes pixels with levels [1, , k], and C1 denotes pixels with
levels [k + 1,…. , L]. Then the probabilities of class occurrence and the class mean levels,
respectively, are given by
(4.2)

52
∑
(4.3)
∑
(4.4)
and
∑
∑ ⁄
where
∑
and
∑
which are the zeroth and the first-order increasing moments of the histogram up to kth
level.
For this thesis, Otsu thresholding was used due to its simplicity and the difference in
graylevels intensities which requires different threshold different images. Therefore, the
threshold was selected automatically for different images using Ostu thresholding.
(4.5)
(4.6)
(4.7)
(4.8)

53
(a) median filtered image (b) thresholded image
Figure 4.9: Thresholding for normal images
The figure above shows the thresholding process of a median filtered non-tumor image. It
can be seen that the image edges were correctly detected after this technique which allows
the separation of the lungs and the other parts in the image.
4.2.5 Small objects removal
The images then undergo an operation called as area opening. This technique is used to
remove the un-wanted components into an image. This technique is to remove form a
binary image all the connected components (objects) that have pixels lower than than a set
value (Al Mahmud et al., 2015). After applying this technique we could get a result image
showing the segmented region of interest (tumor region) for abnormal images and an full
black image representing the normal image (Fig.4.10).
(a) Thresholded image (b) object removed image
Figure 4.10: Object removal for normal images
Figure 4.10 shows the application of the function that removes connected components to a
tumor which are uselss. We see no change in image (a) and (b) because the image has no

54
tumor therefore, there should be no elimination of any object in the image; there are no
useless parts in the image.
(a) Thresholded image (b) Object removed image
Figure 4.11: Object removal for abnormal images
Figure 4.11 shows the results of applying a technique or function the removes the objects
that are connected to a tumor in order to make it easier to segment it. Usually this
technique is used to remove the components connected to a tumor which are not related to
it. However, in this thesis this technique is used to remove tumor to keep only the other
parts in the image. In later techniques this image will be subtracted from the one which has
tumor in addition to other parts. As results the tumor will be obtained as a segmented
image.
4.2.6 Image subtraction
The pixel subtraction operator takes two images as input and produces as output a third
image whose pixel values are simply those of the first image minus the corresponding pixel
values from the second image. It is also often possible to just use a single image as input
and subtract a constant value from all the pixels. Some versions of the operator will output
the absolute difference between pixel values rather than the signed output. The subtraction
of two images is performed straight forwardly in a single pass. The output pixel values are
given by
Or if the operator computes absolute differences between the two input images, then:
(4.9)

55
Or if it is simply desired to subtract a constant value C from a single image, then:
R (m,n) = P (m,n) C
If each pixel value corresponds to an n-tuple instead of a number (for instance, the color
image would have each pixel as a vector of three values corresponding to red, blue, and
green components), then such pixels are operated on by subtraction at each corresponding
vector element to produce the output value.
If the operator calculates absolute differences and the two input images use the same pixel
value type, then it is impossible for the output pixel values to be outside the range that may
be represented by the input pixel type, and so this problem does not arise. This is one good
reason to use absolute differences (Qidwai and Chen, 2009).
(a) Thresholded image (b) Object removed image (c) Resultant image
Figure 4.12: Image subtraction for normal images
(4.10)
(4.11)

56
(a) Thresholded image (b) Object removed image (c) Resultant image
Figure 4.13: Image subtraction for abnormal images
The figure 4.13 shows the subtraction of the cleaned image (b) from the thresholded image
(a). As a result of this subtraction operation, the tumor is obtained and segmented in (c).
Similarly figure 4.12 is a subtraction of (b) from (a). However, the result image is black
since both images has no tumor and mathematically are equal so the result must be zero
which is a black image.
Figure 4.14: Steps of the processing sytstem
Figure 4.14 shows an image of lungs with tumor that was processed using the developed
system for the lung tumor segmentation. The image undergoes different techniques until

57
the tumor is segmented. First the image is eroded to separate the tumor from other objects,
then the eroded image is filtered to remove the noise. The image is also threshold
automatically in order to be converted to binary image and to detect the tumor. After
thresholding the tumor was removed from image. Later on the image with no tumor is
subtracted from the one that has a tumor to get the segmented tumor alone in one image.
58
CHAPTER FIVE
RESULTS AND DISCUSSION
This chapter discusses the testing stage of the developed system and the source of the
images that are used in the system are mentioned. Designed system performance is also
represented here, in which the overall segmentation accuracy, sensitivity and specificity
are calculated, and compared, to other researches. These are also shown as tables. Also
illustrated are some figures that present the whole process of the system, when undergoing
both tumor, and non tumor, lung images.
5.1 System Performance
The developed system will automatically segment any lung tumor in a lung image which
contains many other components, or structures, such as clavicles and lungs. Thus, the
images were pre-processed first before starting the segmentation process. This allows the
tumors to be separated from other components in images. This then makes it easier to
segment tumors using thresholding, and some other image processing operations. To test
the system we had to apply some images containing tumors and others with no tumor. 50
lung tumor images and 20 with no tumor images were used to evaluate the effectiveness of
the system. The measurements that were used for evaluating the developed system are the
accuracy, sensitivity, and specificity.
Accuracy is the total number of correctly segmented tumors over the total number of
images
Where CS is the number of corrected segmented images, and T is the total number of
images. ACC is the accuracy of the system
Sensitivity was also used as a measure to evaluate the segmentation system. It can be
defined as a measure of true positive which are the correctly identified areas.
(5.1)

59
It can be defined as the following:
Where TP is true positive this represents the images that they were segmented and that
they have tumor.
FN represents the images that were segmented and they have no tumor.
Another parameter was used for system performance evaluation is the specificity. It can be
defined as:
TN are the images that have no tumor and they were segmented correctly.
FP are the images that were not segmented and they have tumors.
Table 1 & 2 show the system performance, where the accuracy achieved is 97% as a total
accuracy obtained after testing the system by tumor and non-tumor images. The sensitivity
and specificity of the system were 100% and 87% respectively.
Table 1: The segmentation ratio of the system
Number of
images
Correct
segmented
images
Segmentation
ratio
Non Tumor 20 20/20 100%
Tumor 50 48/50 96%
Total 70 68/70 97%
(5.3)
(5.2)
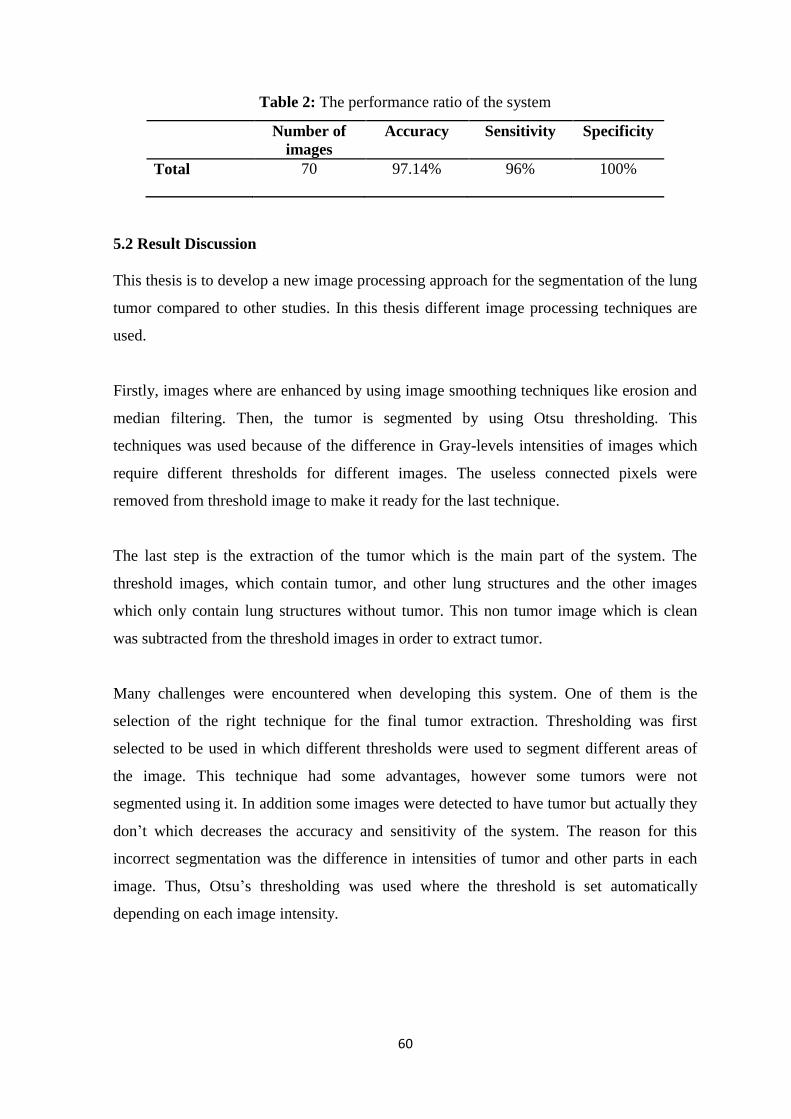
60
Table 2: The performance ratio of the system
Number of
images
Accuracy Sensitivity Specificity
Total 70 97.14% 96% 100%
5.2 Result Discussion
This thesis is to develop a new image processing approach for the segmentation of the lung
tumor compared to other studies. In this thesis different image processing techniques are
used.
Firstly, images where are enhanced by using image smoothing techniques like erosion and
median filtering. Then, the tumor is segmented by using Otsu thresholding. This
techniques was used because of the difference in Gray-levels intensities of images which
require different thresholds for different images. The useless connected pixels were
removed from threshold image to make it ready for the last technique.
The last step is the extraction of the tumor which is the main part of the system. The
threshold images, which contain tumor, and other lung structures and the other images
which only contain lung structures without tumor. This non tumor image which is clean
was subtracted from the threshold images in order to extract tumor.
Many challenges were encountered when developing this system. One of them is the
selection of the right technique for the final tumor extraction. Thresholding was first
selected to be used in which different thresholds were used to segment different areas of
the image. This technique had some advantages, however some tumors were not
segmented using it. In addition some images were detected to have tumor but actually they
don‟t which decreases the accuracy and sensitivity of the system. The reason for this
incorrect segmentation was the difference in intensities of tumor and other parts in each
image. Thus, Otsu‟s thresholding was used where the threshold is set automatically
depending on each image intensity.

61
This technique was definitely good in segmenting an image, by keeping the tumor and
clavicle in an image since they have almost the same intensities. Therefore, another
technique was used to remove the tumor from the images keeping only the clavicle. After
that the two images were subtracted and the tumor was segmented.
Experimentally, the developed approach showed a great efficiency in segmenting tumors in
a CT image using the above discussed technique. This developed lung tumor segmentation
approach outperforms many of the researches listed in the state of art in terms of accuracy,
sensitivity, and specificity.
5.3 Result Comparison
Many researches have been carried out for the purpose of lung tumor segmentation and
detection. However, most of these researches were meant to classify the tumor malignancy
rather than segmenting it. These classification systems used some intelligent classifier
which showed their efficiency in classifying the lung tumor malignancy by distinguishing
both benign and malignant tumor features. Few researches used only image processing
techniques to segment the lung tumor. Therefore, this work was meant to develop a new
easy and simple approach for segmenting the lung tumor using some image processing
techniques.
An approach for extracting lung cancer nodule features from CT images was implemented
by Tun et al., 2014. This work involves a method for using Otsu‟s thresholding and
marker-controlled Watershed segmentation to segment the lung tumor. In their system, the
authors used feature extraction technique to extract the significant features of a tumor. The
Gray-Level Co-occurrence Matrix (GLCM) technique and the physical dimensional
measure are applied for such task. Experimentally, the authors tested their system and it
performed well with accuracy of 91%.
Sakthi et al., 2016 presented also a system for the segmentation of lung tumor using image
processing techniques. Different image processing techniques were used to detect first and
then segment the tumor in a lung. Their system consists of pre-processing phase where
images were smoothed using mean and median filters. In addition, images were enhanced
by increasing their pixels intensity by adjusting them and reducing the difference in

62
intensity between the adjacent pixels. For the next segmentation phase, the authors used
technique called Marker-Controlled Watershed Segmentation. This is an important
technique in image processing where the goal is to detect first and then separate foreground
pixels from the background of image. Marker-controlled watershed technique has two
types: external one which is related to the background, however, the other one is the
internal one and it is related with the foreground. This segmentation technique based
watershed can segment unique edges in an image. In addition to watershed segmentation
the authors also used Otsu‟s thresholding where the image is divided into two regions;
background and foreground. This division is based on a selected threshold where the pixels
are converted to one if they are above this threshold, however, the pixels below this
selected threshold are converted to zero. The experimental results of this system proposed
by Sakthi et al., 2016 shows a good performance in segmenting the lung tumor with
accuracy of 91%.
Similarly, our proposed system based image processing techniques was implemented to
segment lung using thresholding and image subtraction. Our system consists of pre-
processing techniques such as erosion and median filter where the lung images were
smoothed and the edges were defıned as well as the intensity of images was increased.
After image enhancement, the segmentation of the lung tumor in an image takes place. For
this purpose, Otsu‟s thresholding was used to divide image into foreground and
background regions where the tumor is in the foreground part. Otsu thresholding was used
due to its simplicity and the difference in gray-levels intensities which requires different
thresholds and different images. A threshold was selected in such a way where the tumor is
preserved in the images together with the lung clavicles. This image is then cleaned so that
the tumor is removed from the threshold image. A subtraction operation takes place then
between the two images of this operation the lung tumor is extracted. Experimentally, the
developed system outperforms the state of arts in segmenting the lung tumor with accuracy
of 97.14%.

63
Table 3: Comparion of the system
Paper Title Authors Methods used Recognition
Rate
Implementation of Lung
Cancer Nodule Feature
Extraction using Threshold
Technique
Sakthi et al., 2016 Marker-controlled
watershed
segmentation &
Otsu thresholding
91%
Implementation of Lung
Cancer Nodule Feature
Extraction Using Digital Image
Processing
Tun et al., 2014
GLCM & Marker-
controlled
watershed
segmentation
approach
91 %
Proposed System Detection
Rate
Author Morhphological
operations & Otsu
thresholding
97.14%
64
CHAPTER SIX
CONCLUSION AND RECOMMENDATIONS
6.1 Conclusion
Early cancer detection and researches on early detection solutions play vital roles for
human health. Computed tomography images (CT) are widely used in radiotherapy
planning because they provide electronic densities of tissues of interest which are
mandatory to a correct dose computation. Furthermore, the good spatial resolution and
soft/hard tissues contrast allow precise target delineation. Also, CT techniques are
preferred compared to X-Ray and MRI images. Image processing techniques have started
to become popular in use of CT images.
In this thesis, a new approach for the segmentation of lung tumors, especially to the
carcinoma patients, was developed. Image processing techniques were implemented for
this segmentatıon task. The used image processing techniques are easy to use and simple
but play an important role in the medical field in terms of automatic segmentation of lung
tumors in CT ımages. The motivation behind the proposed system is due to the lack of
simple and effective systems for segmenting the lung tumors. Thus, in the designed
system, significant image processing methods used in huge machines such as thresholding
and implement them into a simple and easy use system to help in detecting the tumors.
The developed system was tested by many affected and non-affected images collected
from an online database. The testing aimed to show the capability of the proposed system
in extracting the lung tumor automatically preparing it for segmentation.
The system starts by pre-processing the images so that the tumor may be separated from
the other parts of image. Therefore, images were smoothed using median fılter which
reduces the noise in an image and defines its edges. The images were then eroded in order
to define the region of interest “tumor” by shrinking it and clearing its edges.
Thus, thresholding was selected to be automatic due to the difference in tumor intensities
for each image. This allows the detection of tumor regardless of its intensity. The
65
thresholding technique used here for the purpose of segmenting tumor and the clavicles. As
a result of thresholding we get image of tumor and clavicles only. The longest connected
components are then eliminated from image to keep only the tumor. These two images
undergo subtraction operation which yields to an image of segmented tumor.
The experimental results show that the techniques used in this system were effıcient
enough to segment the tumor in many images since they consider the image‟s intensities
variance separately for each image.
Overall, it can be stated that the developed system was capable of segmenting tumors of
different tumor and non-tumor images of the used database by achieving high accuracy of
97.14% which outperforms the state of art methods discussed in chapter one.
6.2 Recommendations
For future work many techniques for enhancing and segmenting the lung tumor can
recommended:
Classifying the lung images having tumors or non tumors by using artificial intelligence
approaches such as neural network and support vector machine. Finally, for more advanced
researches, artificial neural networks propose a quite different approach to problem
solving. Considering the proposed system in this thesis as a solution, neural networks, or
support vector machine and their interrelated analysis can be combined with this proposed
system as future work.

66
REFERENCES
Al Mahmud, M. A., Karim, A. Z., & Rahman, M. M. (2015). Brain Tumor Detection using
MR Images through Pixel based Methodology. Global Journal of Computer
Science and Technology, 15(4), 302-315.
Assefa, M., Faye, I., Malik, A. S., & Shoaib, M. (2013, May). Lung nodule detection using
multi-resolution analysis. In Proceedings of the International Conference on
Complex Medical Engineering (pp. 457-461). Japan: The Graduate School of
Natural Science and Technology.
Bach, P. B., Cramer, L. D., Schrag, D., Downey, R. J., Gelfand, S. E., & Begg, C. B.
(2001). The influence of hospital volume on survival after resection for lung
cancer. New England Journal of Medicine, 345(3), 181-188.
Bhargavi, K., & Jyothi, S. (2014). A Survey on Threshold Based Segmentation Technique
in Image Processing. International Journal of Innovative Research and
Development, 3(12), 76-85.
Bury, T., Barreto, A., Daenen, F., Barthelemy, N., Ghaye, B., & Rigo, P. (1998). Fluorine-
18 deoxyglucose positron emission tomography for the detection of bone
metastases in patients with non-small cell lung cancer. European Journal of
Nuclear Medicine, 25(9), 1244-1247.
Chaudhary, A., & Singh, S. S. (2012). Lung cancer detection on CT images by using
image processing. In Proceedings of the Internatıonal Conference on Computing
Sciences (pp. 142-146). Phagwara: India.
Dai, S., Lu, K., Dong, J., Zhang, Y., & Chen, Y. (2015). A novel approach of lung
segmentation on chest CT images using graph cuts. Neurocomputing, 168(2), 799-
807.
Dimililer, K. (2012). Neural network implementation for image compression of x-rays.
Electronics World, 118(2), 26–29.
67
Dimililer, K. (2013). Backpropagation neural network implementation for medical image
compression. Journal of Applied Mathematics, 120(2), 30–36.
Dimililer, K., Ever, Y. K., & Ugur, B. (2016, September). ILTDS: Intelligent Lung Tumor
Detection System on CT Images. In Proceedings of The International Symposium
on Intelligent Systems Technologies and Applications (pp. 225-235). Noida: India.
Doll, R., & Hill, A. B. (1950). Smoking and carcinoma of the lung. British medical
journal, 2(4682), 739
Dostert, C., Pétrilli, V., Van Bruggen, R., Steele, C., Mossman, B. T., & Tschopp, J.
(2008). Innate immune activation through Nalp3 inflammasome sensing of
asbestos and silica. Science, 320(5876), 674-677.
Fan, Y., Jiang, T., & Evans, D. J. (2002). Volumetric segmentation of brain images using
parallel genetic algorithms. IEEE transactions on medical imaging, 21(8), 904-909.
Field, R. W., Steck, D. J., Smith, B. J., Brus, C. P., Fisher, E. L., Neuberger, J. S., &
Lynch, C. F. (2000). Residential radon gas exposure and lung cancer the iowa
radon lung cancer study. American Journal of Epidemiology, 151(11), 1091-1102.
Flynn, R. K., Pedersen, C. L., Birmingham, T. B., Kirkley, A., Jackowski, D., & Fowler, P.
J. (2005). The familial predisposition toward tearing the anterior cruciate ligament a
case control study. The American journal of sports medicine, 33(1), 23-28.
Gonzalez and Woods, (2004). Digital Image Processing. New York: CRC Press.
Gonzalez R.C., Woods R.E. (2001) Digital Image Processing. Upper Saddle River:
Prentice Hall.
Graeter, T. P., Hellwig, D., Hoffmann, K., Ukena, D., Kirsch, C. M., & Schäfers, H. J.
(2003). Mediastinal lymph node staging in suspected lung cancer:

68
comparison of positron emission tomography with F-18-fluorodeoxyglucose
and mediastinoscopy. The Annals of thoracic surgery, 75(1), 231-236.
Ichinose, Y., Kato, H., Koike, T., Tsuchiya, R., Fujisawa, T., Shimizu, N., & Japan
Clinical Oncology Group. (2001). Overall survival and local recurrence of 406
completely resected stage IIIa-N2 non-small cell lung cancer patients: questionnaire
survey of the Japan Clinical Oncology Group to plan for clinical trials. Lung
cancer, 34(1), 29-36.
Izbicki, J. R., Passlick, B., Karg, O., Bloechle, C., Pantel, K., Knoefel, W. T., & Thetter, O.
(1995). Impact of radical systematic mediastinal lymphadenectomy on tumor
staging in lung cancer. The Annals of thoracic surgery, 59(1), 209-214.
Jain, Anil K. Fundamentals of digital image processing. (1989). Prentice-Hall.
Javed, U., Riaz, M. M., Cheema, T. A., & Zafar, H. M. F. (2013). Detection of lung
tumor in CE CT images by using weighted support vector machines. In
Proceedings of the 10th International Conference on Applied Sciences and
Technology (pp. 113-116). Bhurban: India.
Kiernan, P. D., Sheridan, M. J., Lamberti, J., Dicicco, B., Wigton, R., Hetrick, V., &
Graling, P. (2002). Mediastinal staging of non-small cell lung carcinoma using
computed and positron-emission tomography. Southern medical journal, 95(10),
1168-1173.
Komaki, R., Lee, J. S., Kaplan, B., Allen, P., Kelly, J. F., Liao, Z., &
Papadimitrakopoulou, V. (2001). Randomized phase III study of amifostine in
patients treated with chemoradiation for inoperable stage II-III non-small cell
lung cancer (NSCLC). International Journal of Radiation Oncology* Biology*
Physics, 51(3), 19-30.

69
Korfiatis, P., Skiadopoulos, S., Sakellaropoulos, P., Kalogeropoulou, C., & Costaridou, L.
(2014). Combining 2D wavelet edge highlighting and 3D thresholding for lung
segmentation in thin-slice CT. The British journal of radiology, 3(6), 1-13.
Kraft M. (2011). Approach to the patient with respiratory disease. In: Goldman L, Schafer
AI, (Eds.), Goldman’s Cecil Medicine (pp. 362-356). Philadelphia, PA: Saunders
Elsevier.
Kumar, V., & Saini, A. (2013). Detection system for lung cancer based on neural network:
X-Ray validation performance. International Journal of Enhanced Research in
Management & Computer Applications, 2(9), 40-47.
Laroche, C., Wells, F., Coulden, R., Stewart, S., Goddard, M., Lowry, E., & Gilligan, D.
(1998). Improving surgical resection rate in lung cancer. Thorax, 53(6), 445-449.
Lin, D. T., & Yan, C. R. (2002, November). Lung nodules identification rules extraction
with neural fuzzy network. In Proceedings of the 9th International Conference on
Neural Information Processing (pp. 2049-2053). Orchid Country Club: Singapore.
Martini, N., Burt, M. E., Bains, M. S., McCormack, P. M., Rusch, V. W., & Ginsberg, R. J.
(1992). Survival after resection of stage II non-small cell lung cancer. The Annals
of thoracic surgery, 54(3), 460-466.
Miller, V. A., Kris, M. G., Shah, N., Patel, J., Azzoli, C., Gomez, J., & Tyson, L. (2004).
Bronchioloalveolar pathologic subtype and smoking history predict sensitivity to
gefitinib in advanced non–small-cell lung cancer. Journal of Clinical Oncology,
22(6), 1103-1109.
Mrak, S. G. M. G. M. (2004). Reliability of objective picture quality measures. Journal of
Electrical Engineering, 55(2), 3-10.
Murray, K. L., Duvall, E., Salter, D. M., & Monaghan, H. (2002). Efficacy and pattern of
use of sputum cytology as a diagnostic test. Cytopathology, 13(6), 350-354.

70
Otsu, N. (1979). Thresholds selection method form grey-level histograms. IEEE Trans. On
Systems, Man and Cybernetics, 9(1), 1979.
Parveen, S. S., & Kavitha, C. (2013). Detection of lung cancer nodules using automatic
region growing method. In Proceedings of the Fourth International Conference on
Computing Communicationsand Networking Technologies (pp. 1-6). Tiruchengode:
India.
Pataer, A., Kalhor, N., Correa, A. M., Raso, M. G., Erasmus, J. J., Kim, E. S., &
Vaporciyan, A. A. (2012). Histopathologic response criteria predict survival of
patients with resected lung cancer after neoadjuvant chemotherapy. Journal of
Thoracic Oncology, 7(5), 825-832.
Qidwai, U., & Chen, C. H. (2009). Digital image processing: an algorithmic approach
with MATLAB. New York: CRC press.
Qu, Z., & Zhang, L. (2010, August). Research on image segmentation based on the
improved Otsu algorithm. In Proceedings of the 2nd International Conference on
Intelligent Human-Machine Systems and Cybernetics (pp. 228-231). Nanjing:
China.
Quekel, L. G. B. A., Goei, R., Kessels, A. G. H., & van Engelshoven, J. M. A. (2001).
Detection of lung cancer on the chest radiograph: impact of previous films,
clinical information, double reading, and dual reading. Journal of clinical
epidemiology, 54(11), 1146-1150.
Quekel, L. G., Kessels, A. G., Goei, R., & van Engelshoven, J. M. (2001). Detection of
lung cancer on the chest radiograph: a study on observer performance. European
journal of radiology, 39(2), 111-116.
Rangdaeng, S., Ya-In, C., Settakorn, J., Chaiwun, B., Bhothirat, C., Sirivanichai, C., &
Aramratana, A. (2002). Cytological diagnosis of lung cancer in Chiang Mai,
Thailand: Cyto-histological correlation and comparison of sensitivity of various

71
methods. Journal of the Medical Association of Thailand Chotmaihet
thangphaet, 85(9), 953-961.
Rao, K.M.M., Rao, V.D.P., (2014). Medical Image Processing. In Proceedings of Image
Analysis and Interpretation (pp. 6-8). India: Indian Institute of Science.
Riquet, M., Manac‟h, D., Le Pimpec-Barthes, F., Dujon, A., & Chehab, A. (1999).
Prognostic significance of surgical-pathologic N1 disease in non-small cell
carcinoma of the lung. The Annals of thoracic surgery, 67(6), 1572-1576.
Sayar, A., Turna, A., Kılıcgun, A., Solak, O., Urerurer, N., & Gurses, A. (2004).
Prognostic significance of surgical-pathologic multiple-station N1 disease in non-
small cell carcinoma of the lung. European journal of cardio-thoracic surgery,
25(3), 434-438.
Schild, S. E., Hillman, S. L., Tan, A. D., Ross, H. J., McGinnis, W. L., Garces, Y. A., &
North Central Cancer Treatment Group. (2017). Long-Terms Results of a Trial of
Concurrent Chemotherapy and Escalating Doses of Radiation for Unresectable
Non–Small Cell Lung Cancer: NCCTG N0028 (ALLIANCE). Journal of Thoracic
Oncology. 25(31), 5030-5041.
Schroen, A. T., Detterbeck, F. C., Crawford, R., Rivera, M. P., & Socinski, M. A. (2000).
Beliefs among pulmonologists and thoracic surgeons in the therapeutic approach to
non-small cell lung cancer. CHEST Journal, 118(1), 129-137.
Senthilkumaran, N., & Vaithegi, S. (2016). Image segmentation by using thresholding
techniques for medical images. Computer Science & Engineering: An International
Journal, 6(1), 34-47.
Sevastos, J., Kennedy, S. E., Davis, D. R., Sam, M., Peake, P. W., Charlesworth, J. A., &
Erlich, J. H. (2007). Tissue factor deficiency and PAR-1 deficiency are protective
against renal ischemia reperfusion injury. Blood, 109(2), 577-583.

72
Sharma, D., & Jindal, G. (2011). Identifying lung cancer using image processing
techniques. In Proceedings of the International Conference on Computational
Techniques and Artificial Intelligence (pp. 115-120). Barcelona: Spain.
Silvestri, G. A., Handy, J., Lackland, D., Corley, E., & Reed, C. E. (1998). Specialists
achieve better outcomes than generalists for lung cancer surgery. CHEST
Journal, 114(3), 675- 680.
Som, H. M., Zain, J. M., & Ghazali, A. J. (2011). Advanced Computing: An International
Journal, 2(2), 1103.5621.
Sonka, M., Hlavac, V., & Boyle, R. (2014). Image processing, analysis, and machine
vision. Cengage Learning.
Stefanescu, R., Pennec, X., & Ayache, N. (2004). Grid powered nonlinear image
registration with locally adaptive regularization. Medical image analysis, 8(3),
325-342.
Strauss, G. M., Herndon, J. E., Maddaus, M. A., Johnstone, D. W., Johnson, E. A.,
Harpole, D. H., & Vokes, E. E. (2008). Adjuvant paclitaxel plus carboplatin
compared with observation in stage IB non–small-cell lung cancer: CALGB 9633
with the Cancer and Leukemia Group B, Radiation Therapy Oncology Group, and
North Central Cancer Treatment Group Study Groups. Journal of Clinical
Oncology, 26(31), 5043-5051.
Suzuki, K., Shiraishi, J., Abe, H., MacMahon, H., & Doi, K. (2005). False-positive
reduction in computer-aided diagnostic scheme for detecting nodules in chest
radiographs by means of massive training artificial neural network. Academic
Radiology, 12(2), 191-201.
Tanaka, F., Yanagihara, K., Otake, Y., Yamada, T., Shoji, T., Miyahara, R., ... & Wada, H.
(2001). Prognostic factors in patients with resected pathologic (p-) T1-2N1M0 non-

73
small cell lung cancer (NSCLC). European Journal of cardio-thoracic surgery,
19(5), 555-561.
Tannehill, S. P., Mehta, M. P., Larson, M., Storer, B., Pellet, J., Kinsella, T. J., & Schiller,
J. H. (1997). Effect of amifostine on toxicities associated with sequential
chemotherapy and radiation therapy for unresectable non-small-cell lung cancer:
results of a phase II trial. Journal of clinical oncology, 15(8), 2850-2857.
Teramoto, A., & Fujita, H. (2013). Fast lung nodule detection in chest CT images using
cylindrical nodule-enhancement filter. International journal of computer assisted
radiology and surgery, 3(6), 1-13.
Travis, W. D., Brambilla, E., & Riely, G. J. (2013). New pathologic classification of lung
cancer: relevance for clinical practice and clinical trials. Journal of Clinical
Oncology, 31(8), 992-1001.
Tsubamoto, M., Kuriyama, K., Kido, S., Arisawa, J., Kohno, N., Johkoh, T., & Kuroda, C.
(2002). Detection of Lung Cancer on Chest Radiographs: Analysis on the Basis of
Size and Extent of Ground-Glass Opacity at Thin-Section CT. Radiology, 224(1),
139-144.
Van Velzen, E., Snijder, R. J., de la Rivière, A. B., Elbers, H. R., & Van den Bosch, J. M.
(1997). Lymph node type as a prognostic factor for survival in T2 N1 M0 non-
small cell lung carcinoma. The Annals of thoracic surgery, 63(5), 1436-1440.
Van Ginneken, B., Romeny, B. T. H., & Viergever, M. A. (2001). Computer-aided
diagnosis in chest radiography: a survey. IEEE Transactions on medical imaging,
20(12), 1228-1241.
Vansteenkiste, J. F., Stroobants, S. G., Dupont, P. J., De Leyn, P. R., Verbeken, E. K.,
Deneffe, G. J., & Demedts, M. G. (1999). Prognostic importance of the
standardized uptake value on 18F-fluoro-2-deoxy-glucose–positron emission

74
tomography scan in non–small-cell lung cancer: an analysis of 125
cases. Journal of Clinical Oncology, 17(10), 3201- 3206.
Vesselle, H., Pugsley, J. M., Vallières, E., & Wood, D. E. (2002). The impact of
fluorodeoxyglucose F 18 positron-emission tomography on the surgical staging of
non–small cell lung cancer. The Journal of thoracic and cardiovascular
surgery, 124(3), 511-519.
Wang, H., Xing, F., Su, H., Stromberg, A., & Yang, L. (2014). Novel image markers for
non- small cell lung cancer classification and survival prediction. BMC
bioinformatics, 15(1), 4-15.
Warfield, S. K., Jolesz, F. A., & Kikinis, R. (1998). A high performance computing
approach to the registration of medical imaging data. Parallel
Computing, 24(9), 1345-1368.
Zhang, J., Zhang, W., Chen, C., Guan, Y., & Wang, C. (2010). Computed diagnosis
system for lung tumor detection based on PET/CT images. In Proceedings of the
3rd International Conference on Biomedical Engineering and Informatics (pp. 166-
170). Yantai University: China.
Zhou, S., Cheng, Y., & Tamura, S. (2014). Automated lung segmentation and smoothing
techniques for inclusion of juxtapleural nodules and pulmonary vessels on chest
CT images. Biomedical Signal Processing and Control, 13(3), 62-70.
Zhou, S., Y. C.,, & Shinichi T. Automated lung segmentation and smoothing techniques
for inclusion of juxtapleural nodules and pulmonary vessels on chest CT images.
Biomedical Signal Processing and Control 13, 62-70.

75
APPENDICES
76
APPENDIX A
SOURCE CODE
clear;
clear all;
clc;
for k = 1:50 % for abnormal images
myFolder = „C:\Users\ahmet\Dropbox\New folder\buse program\lung\Lung-thesis Matlab
code\Lung-Tumors‟; % reading directory
filePattern = fullfile(myFolder, „*.jpg‟);
jpegFiles = dir(filePattern);
baseFileName = jpegFiles(k).name; % read jpg files from directory
fullFileName = fullfile(myFolder, baseFileName);
im = imread(fullFileName);
a = im;
imwrite(a,strcat(„C:\Users\ahmet\Dropbox\New folder\buse-program\lung\Lung-thesis Matlab
code\saved images\Tumor\(step1)Original\‟, „Original‟,num2str(k),‟.jpg‟))
se = strel(„diamond‟,2); % Erosion
b = imerode (a,se);
imwrite(b,strcat(„C:\Users\ahmet\Dropbox\New folder\buse-program\lung\Lung-thesis Matlab
code\saved images\Tumor\(step2)Erosion\‟, „Erosion‟,num2str(k),‟.jpg‟))
c = medfilt2(b,[5 5]); % Median filter
imwrite(c,strcat(„C:\Users\ahmet\Dropbox\New folder\buse-program\lung\Lung-thesis Matlab
code\saved images\Tumor\(step3)Median\‟, „Median‟,num2str(k),‟.jpg‟))
level = graythresh (c);
d = im2bw (c,level); % Otsu threshold
imwrite(d,strcat(„C:\Users\ahmet\Dropbox\New folder\buse-program\lung\Lung-thesis Matlab
code\saved images\Tumor\(step4)Threshold\‟, „Threshold‟,num2str(k),‟.jpg‟))
e = bwareaopen (d,1000); % remove unwanted objects on image
imwrite(e,strcat(„C:\Users\ahmet\Dropbox\New folder\buse-program\lung\Lung-thesis Matlab
code\saved images\Tumor\(Step5)Bwopen\‟, „Bwopen‟,num2str(k),‟.jpg‟))
f = d - e; % Image Subtraction
imwrite(f,strcat(„C:\Users\ahmet\Dropbox\New folder\buse-program\lung\Lung-thesis Matlab
code\saved images\Tumor\(step6)Tumor\‟, „Tumor‟,num2str(k),‟.jpg‟))
end

77
for k = 1:20; % for normal images
MyFolder = „C:\Users\ahmet\Dropbox\New folder\buse-program\lung\Lung-thesis Matlab
code\Lung-NonTumor‟;
filePattern = fullfile(MyFolder, „*.jpg‟);
jpegFiles = dir(filePattern);
baseFileName = jpegFiles(k).name;
fullFileName = fullfile(MyFolder, baseFileName);
im = imread(fullFileName);
a = im;
imwrite(a,strcat(„C:\Users\ahmet\Dropbox\New folder\buse-program\lung\Lung-thesis Matlab
code\saved images\Non-Tumor\(step1)Original\‟, „Original‟,num2str(k),‟.jpg‟))
se = strel(„diamond‟,2);
b = imerode (a,se);
imwrite(b,strcat(„C:\Users\ahmet\Dropbox\New folder\buse-program\lung\Lung-thesis Matlab
code\saved images\Non-Tumor\(step2)Erosion\‟, „Erosion‟,num2str(k),‟.jpg‟))
c = medfilt2(b,[5 5]);
imwrite(c,strcat(„C:\Users\ahmet\Dropbox\New folder\buse-program\lung\Lung-thesis Matlab
code\saved images\Non-Tumor\(step3)Median\‟, „Median‟,num2str(k),‟.jpg‟))
level = graythresh (c);
d = im2bw (c,level);
imwrite(d,strcat(„C:\Users\ahmet\Dropbox\New folder\buse-program\lung\Lung-thesis Matlab
code\saved images\Non-Tumor\(step4)Threshold\‟, „Threshold‟,num2str(k),‟.jpg‟))
e = bwareaopen (d,1000);
imwrite(e,strcat(„C:\Users\ahmet\Dropbox\New folder\buse-program\lung\Lung-thesis Matlab
code\saved images\Non-Tumor\(step5)Bwopen\‟, „Bwopen‟,num2str(k),‟.jpg‟))
f = d - e;
imwrite(f,strcat(„C:\Users\ahmet\Dropbox\New folder\buse-program\lung\Lung-thesis Matlab
code\saved images\Non-Tumor\(step6)Non-Tumor\‟, „Non-Tumor‟,num2str(k),‟.jpg‟))
end
% Calculations
% Total image = 70
% True positive (TP): the diagnostic system yields positive test
% result for the sample and the sample actually has the disease.
% False positive (FP): the diagnostic system yields positive
% test result for the sample but the sample does not actually

78
% have the disease.
% True negative (TN): the diagnostic system yields negative
% test result for the sample and the sample does not actually
% have the disease.
% False negative (FN): the diagnostic system yields negative
% test result for the sample but the sample actually has the
% disease.
% TP: True Positive: Tumor Present and true detected
% TN: True Negative: Tumor not present and not detected
% FP: False Positive: Tumor not present and detected
% FN: False Negative: Tumor present and false detected
TP = 48;
TN = 20;
FP = 2;
FN = 0;
% 1) Accurarcy (verimlilik)
Accuarcy = (TP+TN) / (TP+TN+FP+FN) * 100
% 2) Sensitivity
Sensitivity = TP / (TP+FN) * 100
% 3) Specificity
Specificity = TN / (TN+FP) * 100

79
APPENDIX B
DATABASE

80

81
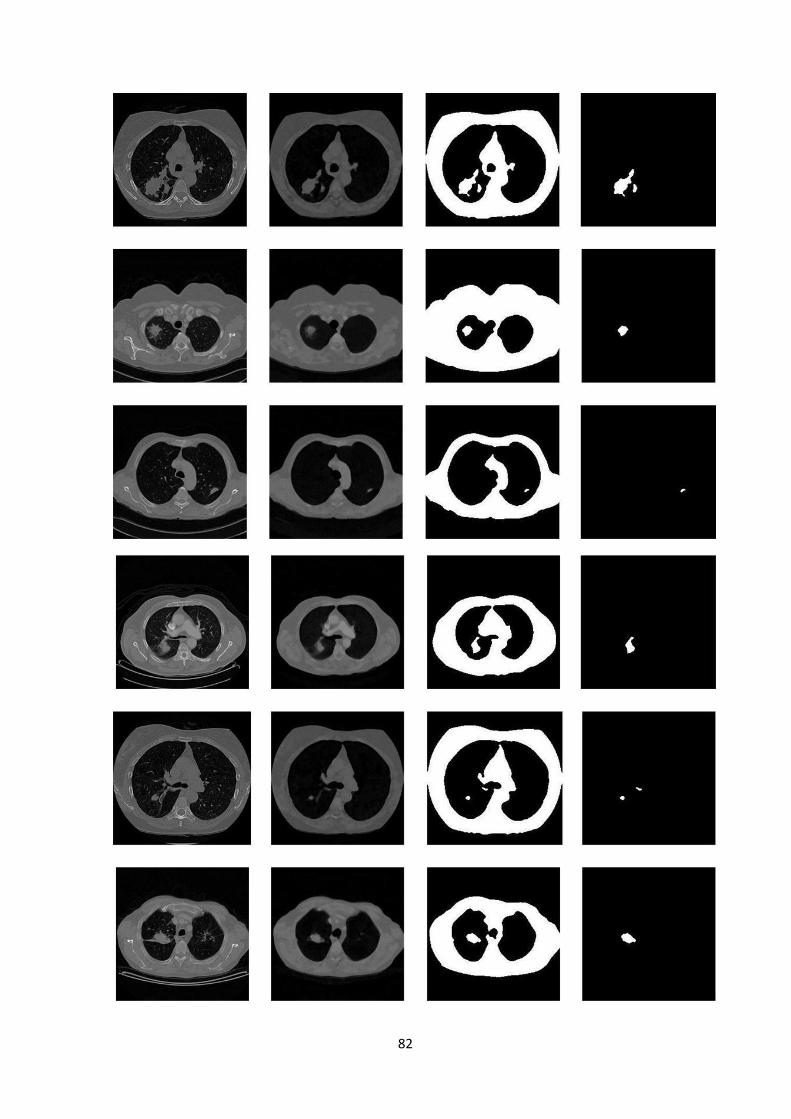
82

83

84
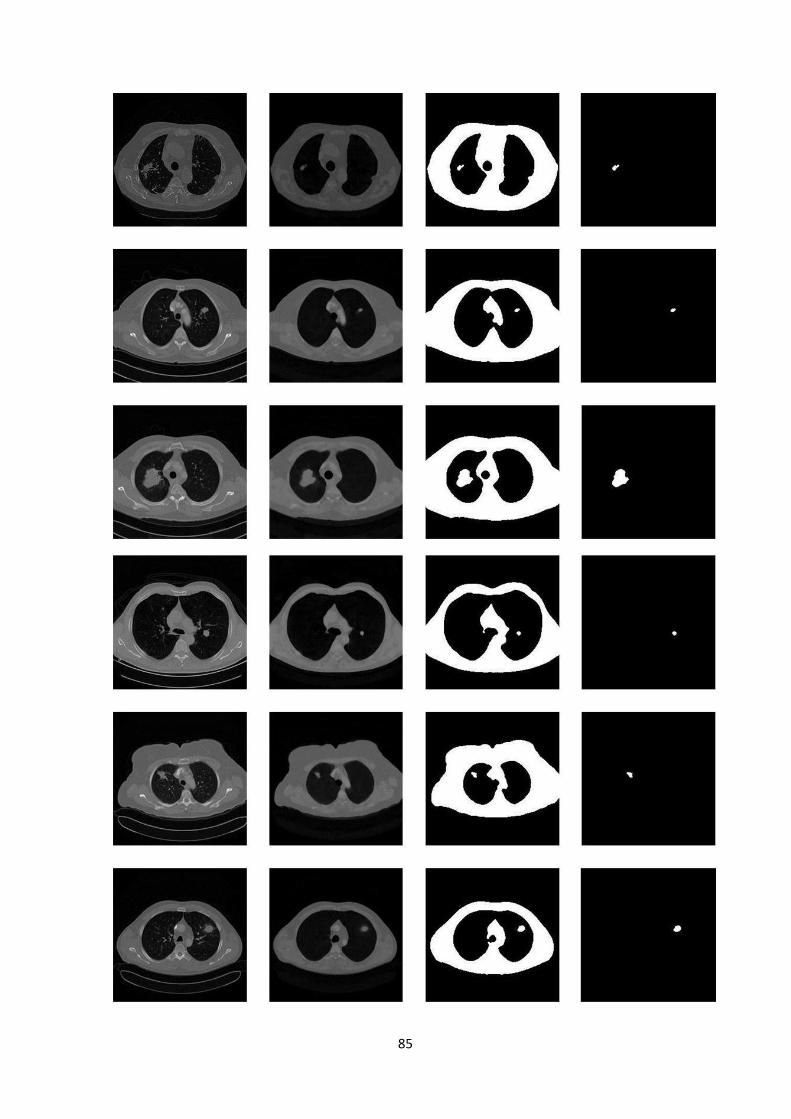
85
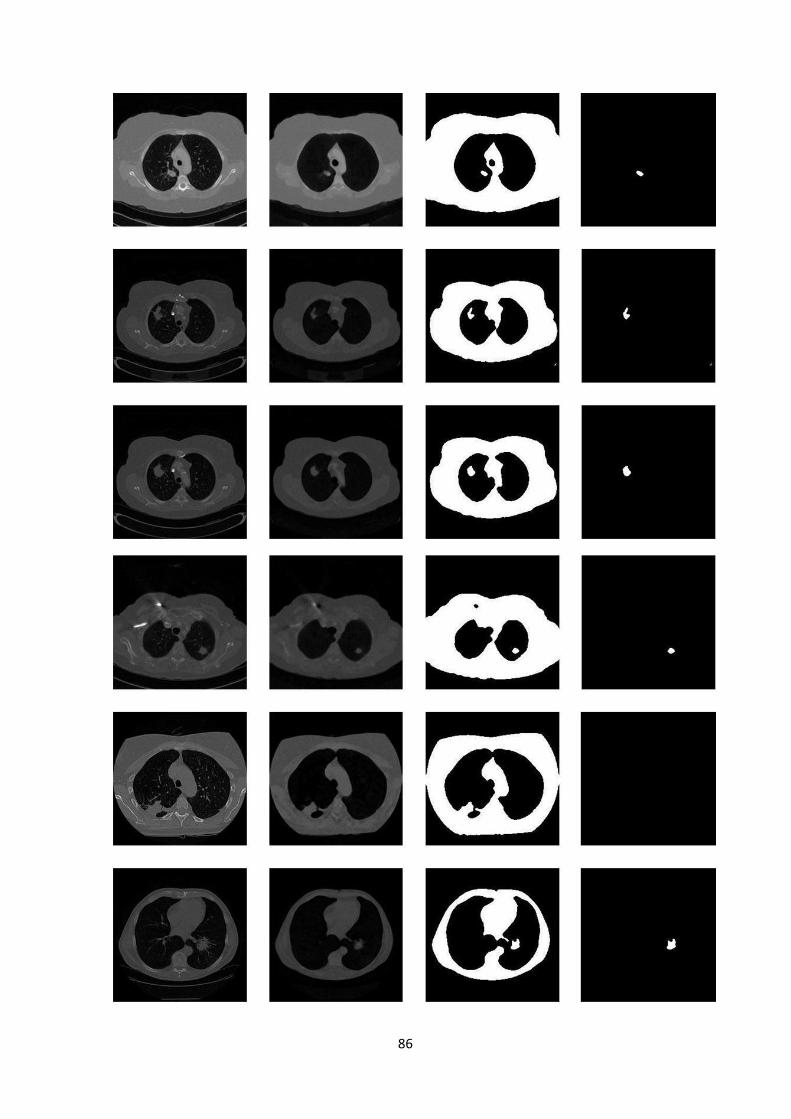
86

87
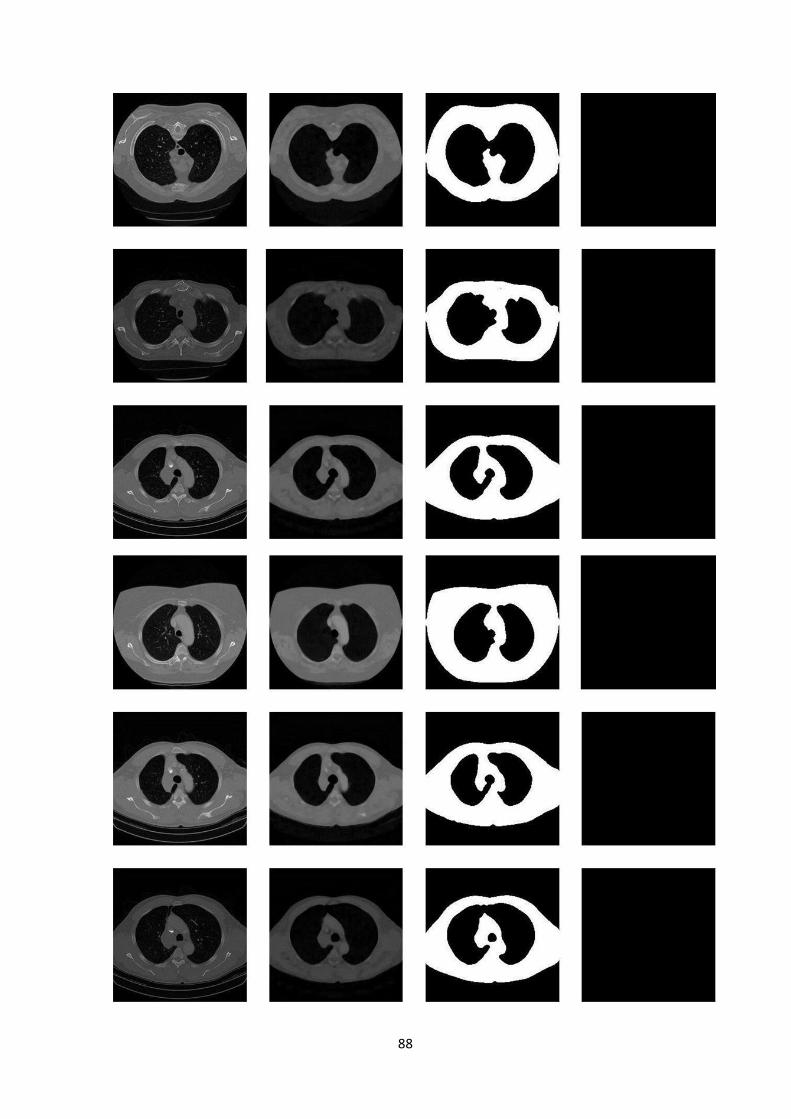
88

89

90