luxottica fy13 analyst & investor presentation
TRANSCRIPT

Building the success ofBuilding the success of tomorrow
Milan, February 28, 2014
FORWARD LOOKING STATEMENTSCertain statements in this investor presentation may constitute “forward-looking statements” as defined in the PrivateSecurities Litigation Reform Act of 1995. Such statements involve risks, uncertainties and other factors that could causeactual results to differ materially from those which are anticipated. Such risks and uncertainties include, but are not limitedto, our ability to manage the effect of the uncertain current global economic conditions on our business, our ability tosuccessfully acquire new businesses and integrate their operations our ability to predict future economic conditions andsuccessfully acquire new businesses and integrate their operations, our ability to predict future economic conditions andchanges in consumer preferences, our ability to successfully introduce and market new products, our ability to maintain anefficient distribution network, our ability to achieve and manage growth, our ability to negotiate and maintain favorablelicense arrangements, the availability of correction alternatives to prescription eyeglasses, fluctuations in exchange rates,changes in local conditions, our ability to protect our proprietary rights, our ability to maintain our relationships with hoststores, any failure of our information technology, inventory and other asset risk, credit risk on our accounts, insurancerisks, changes in tax laws, as well as other political, economic, legal and technological factors and other risks anduncertainties described in our filings with the US Securities and Exchange Commission. These forward-looking statementsare made as of the date hereof, and we do not assume any obligation to update them.
This investor presentation contains measures that were not prepared in accordance with IAS/IFRS. For areconciliation of non-IAS/IFRS measures used in these materials, see the Company’s press release titled“Luxottica completes 2013 with record results” dated February 27, 2014, available on the company’s websitewww.luxottica.com under the Investors tab.
FY 2013 HIGHLIGHTS
› A new net sales record: €7.3 billion (+7.5% at constant forex(1))
• Wholesale constantly upbeat throughout the year: +12% at constant forex(1)
• Retail comps(2) up by 3.4%
› Solid Group operating leverage: +110bps at p p g g pconstant forex(1)
› Free cash flow generation(3): €648 million (excluding extraordinary tax payment)y p y )
• Net debt/EBITDA(3): 1.0x, the lowest in almost 20 years
› Dividend proposal of €0.65 vs. €0.58 per share in 2013
3
2013
FY 2013 highlights
FY 2013 KEY TAKEAWAYS
› Impressive Europe: total sales up by 11% at constant forex(1)
› Sunglass Hut simply outstanding: total sales› Sunglass Hut simply outstanding: total sales +11% at constant forex(1)
› Optical retail, proving strong in the emerging k t d A t limarkets and Australia
› A transitional year for LensCrafters in North America, comps(2) +1%, but profitability growing
› Ray-Ban, 11 years of double-digit growth
› Oakley strong double-digit growth in Europe
FY 2013 highlights 4
› Oakley strong double digit growth in Europe and emerging markets
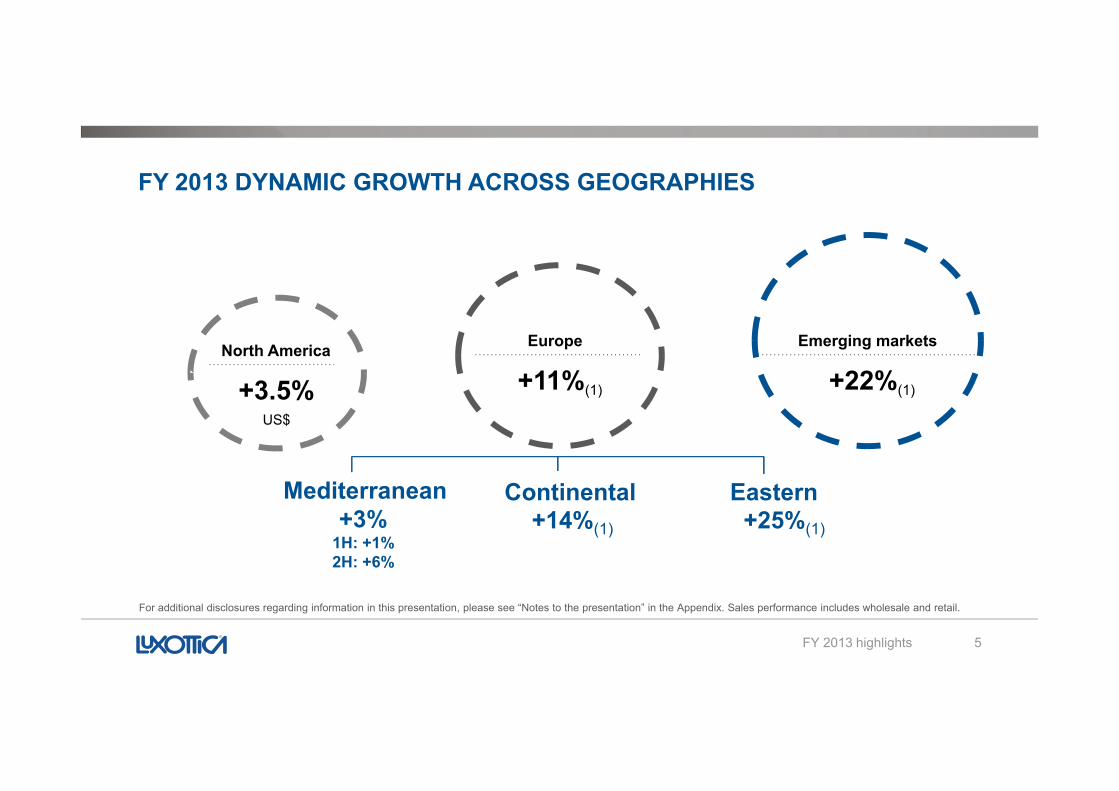
FY 2013 DYNAMIC GROWTH ACROSS GEOGRAPHIES
Europe
+11%(1)
North America
+3 5%
Emerging markets
+22%(1)( )+3.5%US$
( )
C ti t lM dit E tContinental+14%(1)
Mediterranean+25%(1)
Eastern+3%
1H: +1%2H: +6%
5
For additional disclosures regarding information in this presentation, please see “Notes to the presentation” in the Appendix. Sales performance includes wholesale and retail.
FY 2013 highlights

FY 2013 RESULTSADV Campaign 2014
FY 2013 results 6
FY 2013 RESULTS
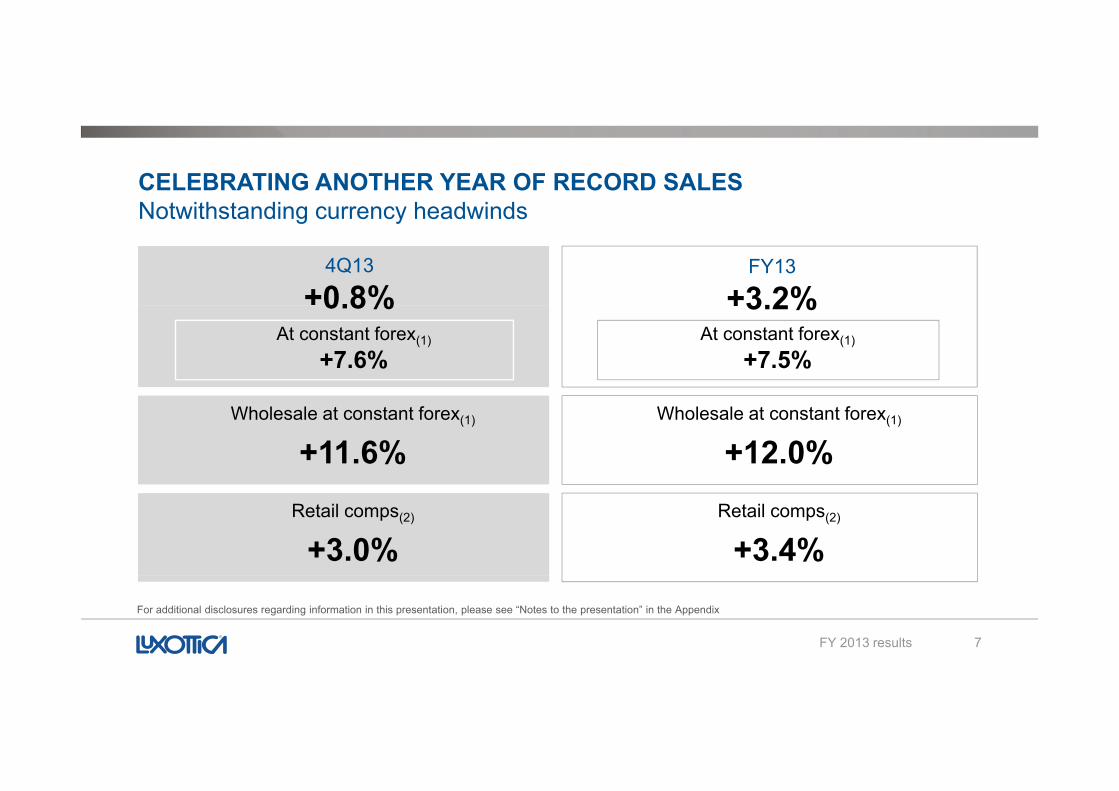
CELEBRATING ANOTHER YEAR OF RECORD SALESNotwithstanding currency headwindsNotwithstanding currency headwinds
4Q13
+0.8%FY13
+3.2%At constant forex(1)
+7.6%
0.8%At constant forex(1)
+7.5%
+3.2%
Wholesale at constant forex(1)
+11.6%Wholesale at constant forex(1)
+12.0%Retail comps(2)
+3.0%Retail comps(2)
+3.4%
7
For additional disclosures regarding information in this presentation, please see “Notes to the presentation” in the Appendix
FY 2013 results
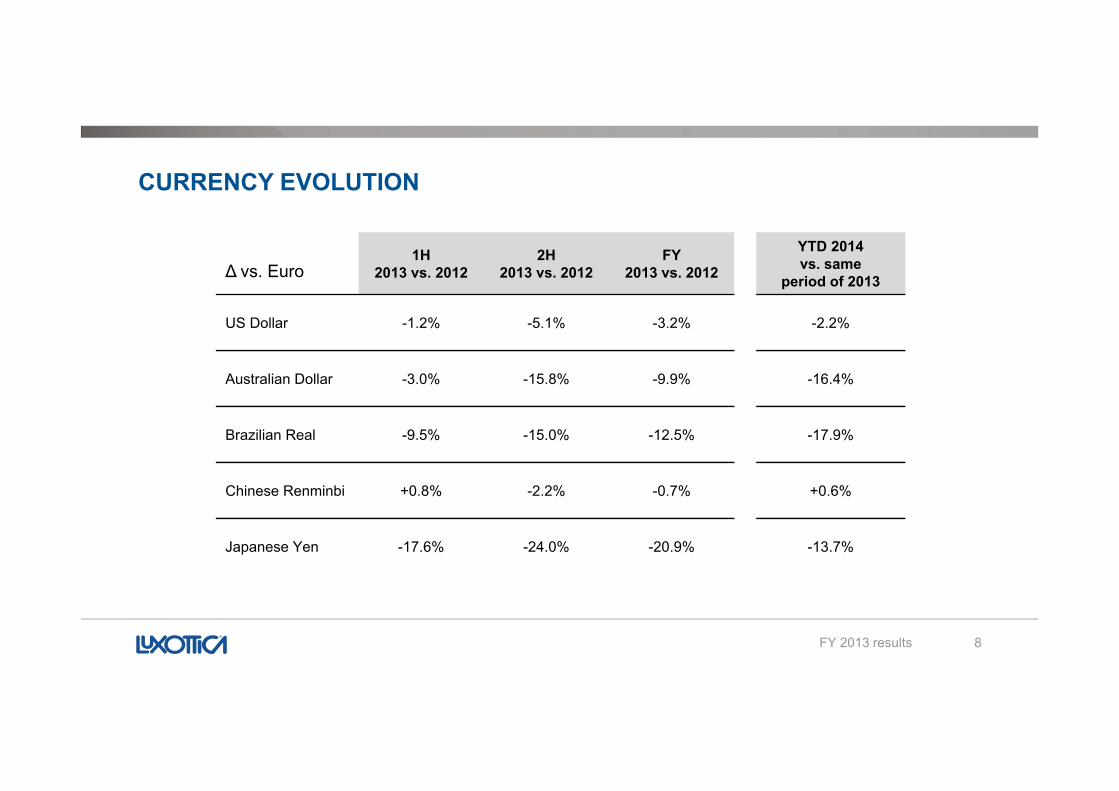
CURRENCY EVOLUTION
1H2013 vs. 2012
2H2013 vs. 2012
FY2013 vs. 2012
YTD 2014 vs. same
period of 2013∆ vs. Euro
US Dollar -1.2% -5.1% -3.2% -2.2%
Australian Dollar -3.0% -15.8% -9.9% -16.4%
Brazilian Real -9.5% -15.0% -12.5% -17.9%
Chi R i bi 0 8% 2 2% 0 % 0 6%Chinese Renminbi +0.8% -2.2% -0.7% +0.6%
Japanese Yen -17.6% -24.0% -20.9% -13.7%
8FY 2013 results
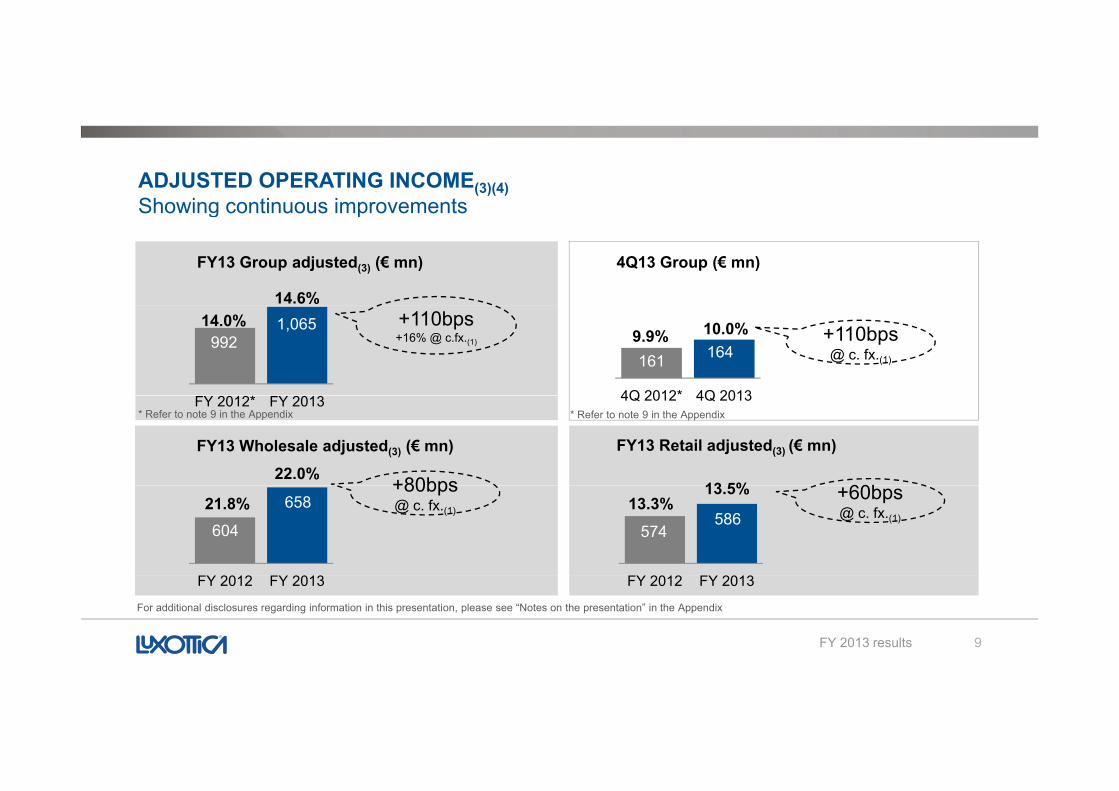
ADJUSTED OPERATING INCOME(3)(4)Showing continuous improvementsg p
4Q13 Group (€ mn)FY13 Group adjusted(3) (€ mn)
14.6%
161 164
4Q 2012* 4Q 2013
9921,06514.0%
9.9% 10.0% +110bps @ c. fx.(1)
+110bps+16% @ c.fx.(1)
4Q 2012 4Q 2013FY 2012* FY 2013
FY13 Wholesale adjusted(3) (€ mn)22.0%
13 5%
FY13 Retail adjusted(3) (€ mn)
+80bps 60b
* Refer to note 9 in the Appendix * Refer to note 9 in the Appendix
604
65821.8%574
58613.3%
13.5%+80bps @ c. fx.(1)
+60bps @ c. fx.(1)
FY 2012 FY 2013
9
FY 2012 FY 2013
For additional disclosures regarding information in this presentation, please see “Notes on the presentation” in the Appendix
FY 2013 results
4Q13 N t i (€ )
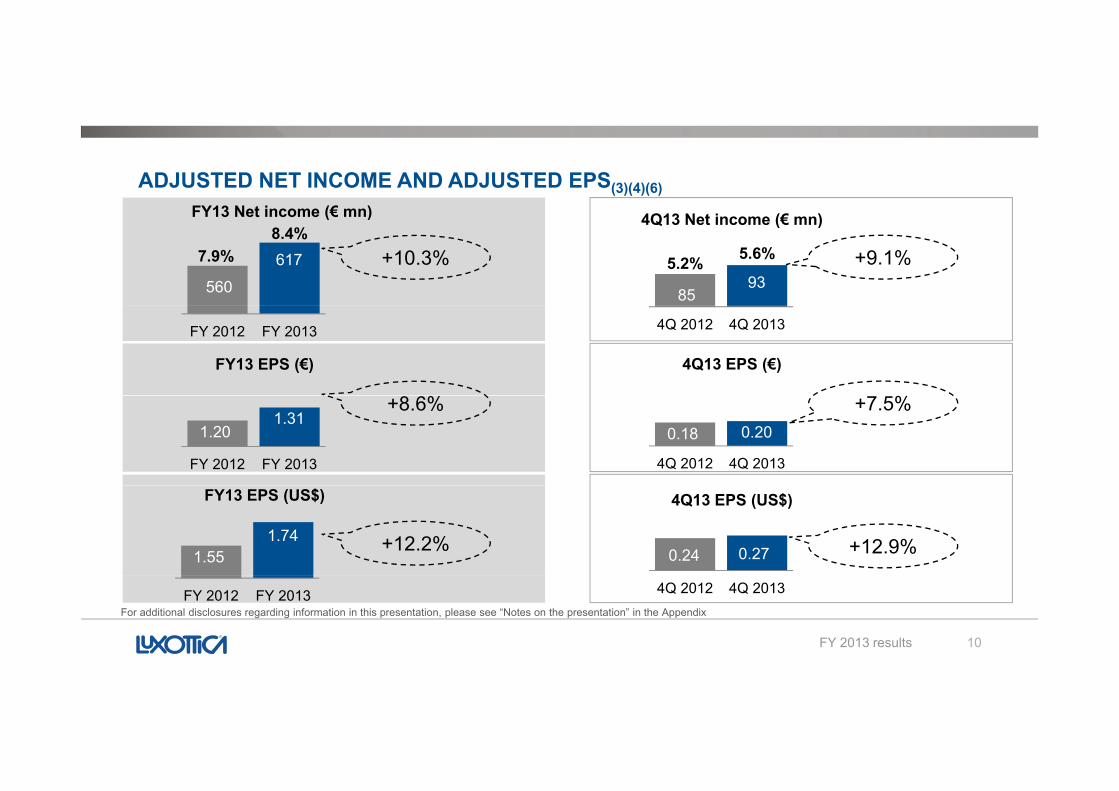
ADJUSTED NET INCOME AND ADJUSTED EPS(3)(4)(6)FY13 Net income (€ mn)
8593
4Q13 Net income (€ mn)
560
617
FY13 Net income (€ mn)
7.9%8.4%
+10.3% 5.2% 5.6% +9.1%
4Q 2012 4Q 2013FY 2012 FY 2013
FY13 EPS (€) 4Q13 EPS (€)
1.201.31
FY 2012 FY 2013
+8.6%0.18 0.20
4Q 2012 4Q 2013
+7.5%
1.551.74
FY13 EPS (US$)
+12.2% 0.24 0.27 +12.9%
4Q13 EPS (US$)
10
For additional disclosures regarding information in this presentation, please see “Notes on the presentation” in the AppendixFY 2012 FY 2013 4Q 2012 4Q 2013
FY 2013 results
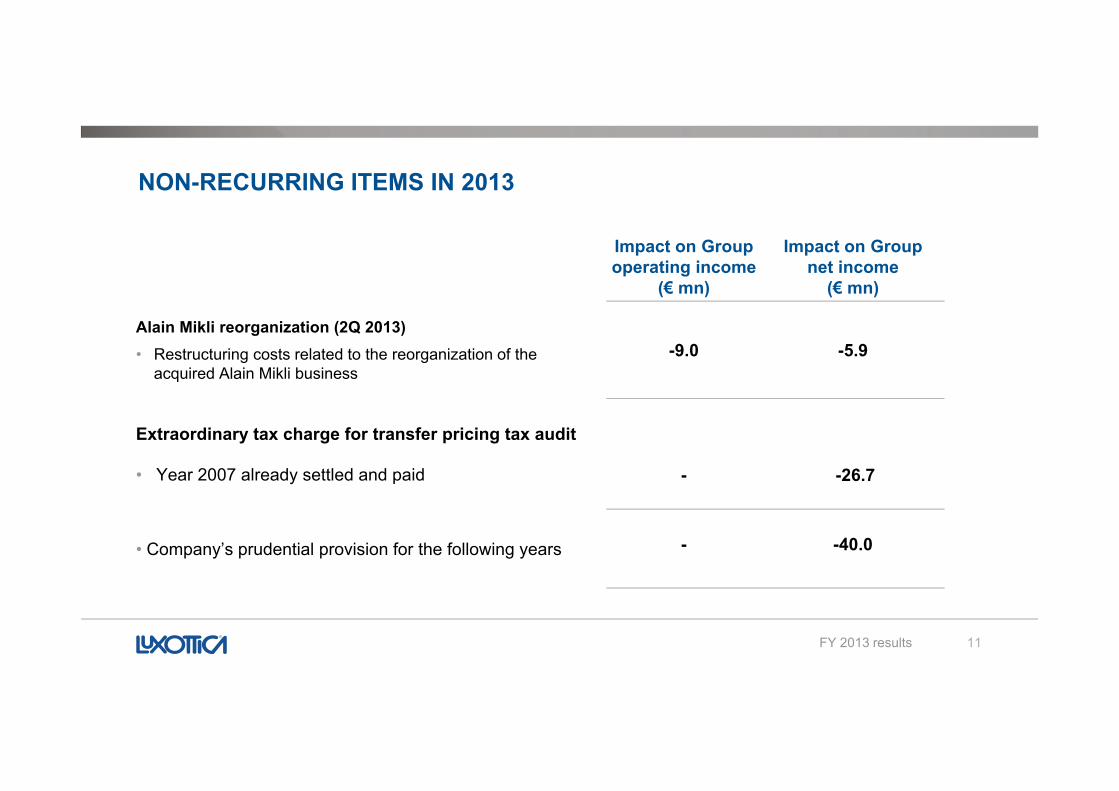
NON-RECURRING ITEMS IN 2013
Impact on Group operating income
(€ mn)
Impact on Group net income
(€ mn)
Alain Mikli reorganization (2Q 2013)• Restructuring costs related to the reorganization of the
acquired Alain Mikli business-9.0 -5.9
Extraordinary tax charge for transfer pricing tax audit
• Year 2007 already settled and paid - -26.7
• Company’s prudential provision for the following years - -40.0
11FY 2013 results
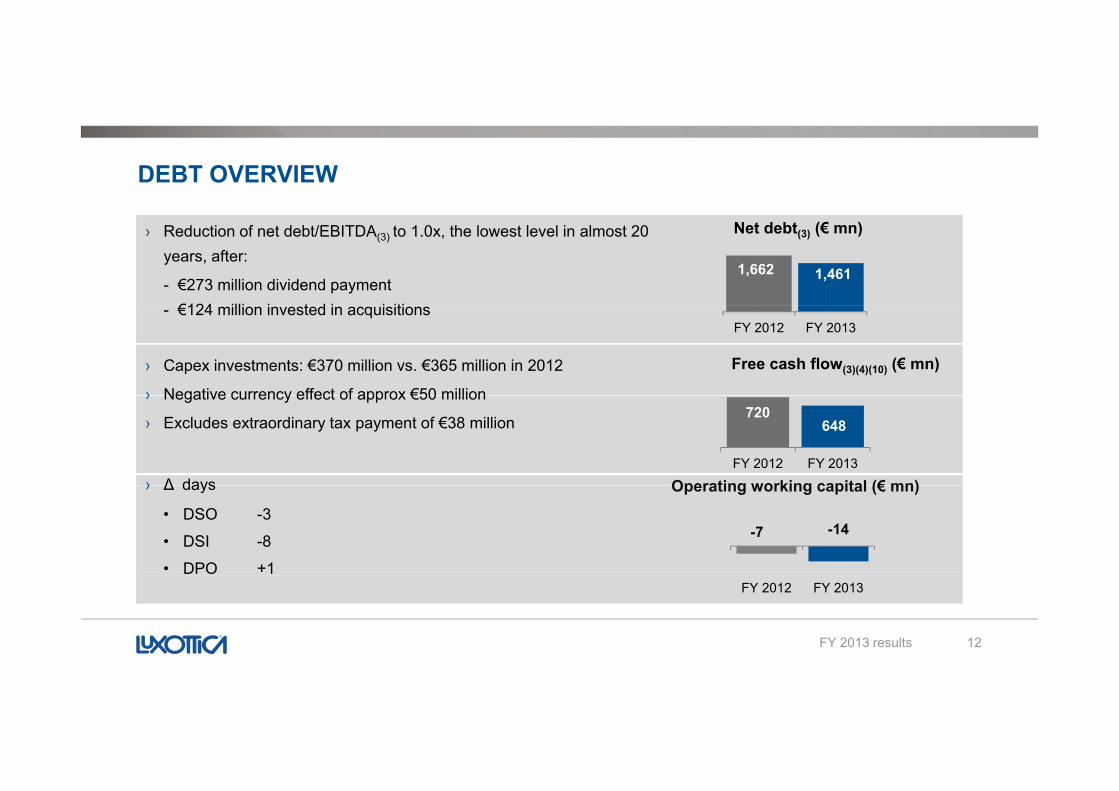
DEBT OVERVIEW
› Reduction of net debt/EBITDA(3) to 1.0x, the lowest level in almost 20 years, after:
- €273 million dividend payment€124 illi i t d i i iti
1,662 1,461
Net debt(3) (€ mn)
- €124 million invested in acquisitions
› Capex investments: €370 million vs. €365 million in 2012
› Negative currency effect of approx €50 million
FY 2012 FY 2013
Free cash flow(3)(4)(10) (€ mn)
› Negative currency effect of approx €50 million
› Excludes extraordinary tax payment of €38 million
› ∆ days Operating working capital (€ mn)
720648
FY 2012 FY 2013› ∆ days
• DSO -3
• DSI -8
• DPO +1
-14
Operating working capital (€ mn)
-7
12
FY 2012 FY 2013
FY 2013 results
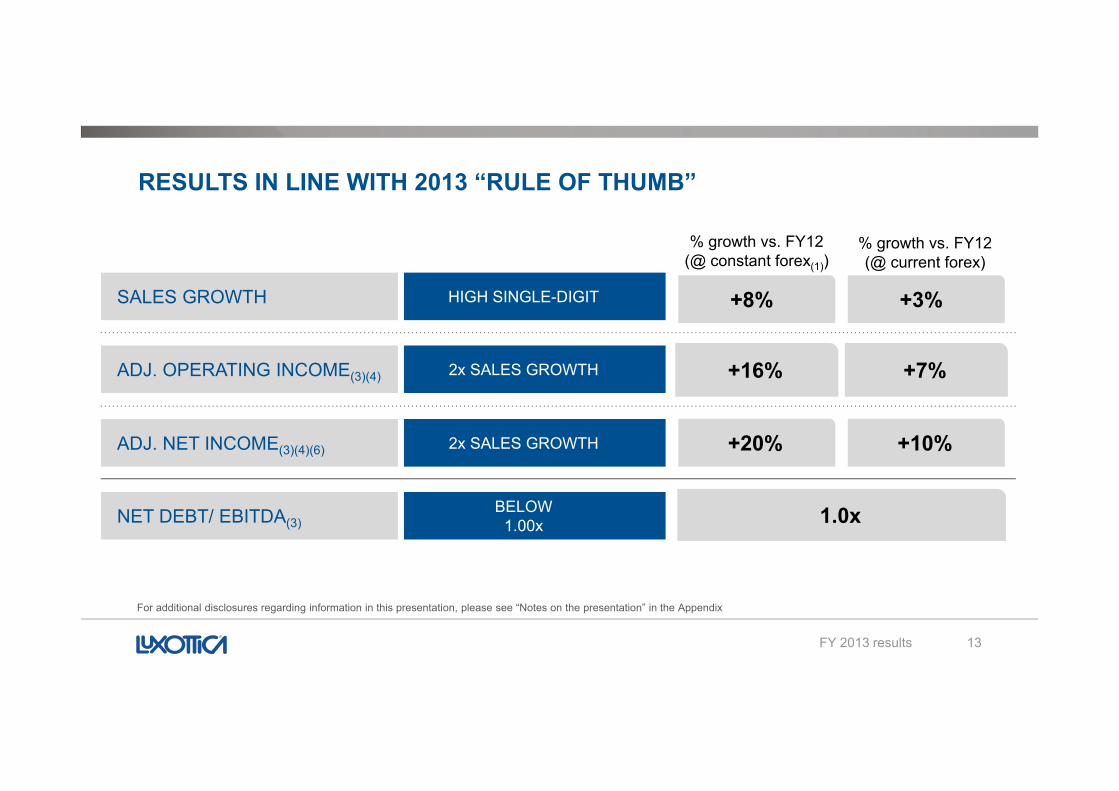
RESULTS IN LINE WITH 2013 “RULE OF THUMB”
+3%HIGH SINGLE-DIGIT
% growth vs. FY12 (@ current forex)
SALES GROWTH +8%
% growth vs. FY12 (@ constant forex(1))
3%
+7%2x SALES GROWTHADJ. OPERATING INCOME(3)(4)
8%
+16%
+10%2x SALES GROWTHADJ. NET INCOME(3)(4)(6) +20%
BELOW1.00xNET DEBT/ EBITDA(3) 1.0x
13
For additional disclosures regarding information in this presentation, please see “Notes on the presentation” in the Appendix
FY 2013 results
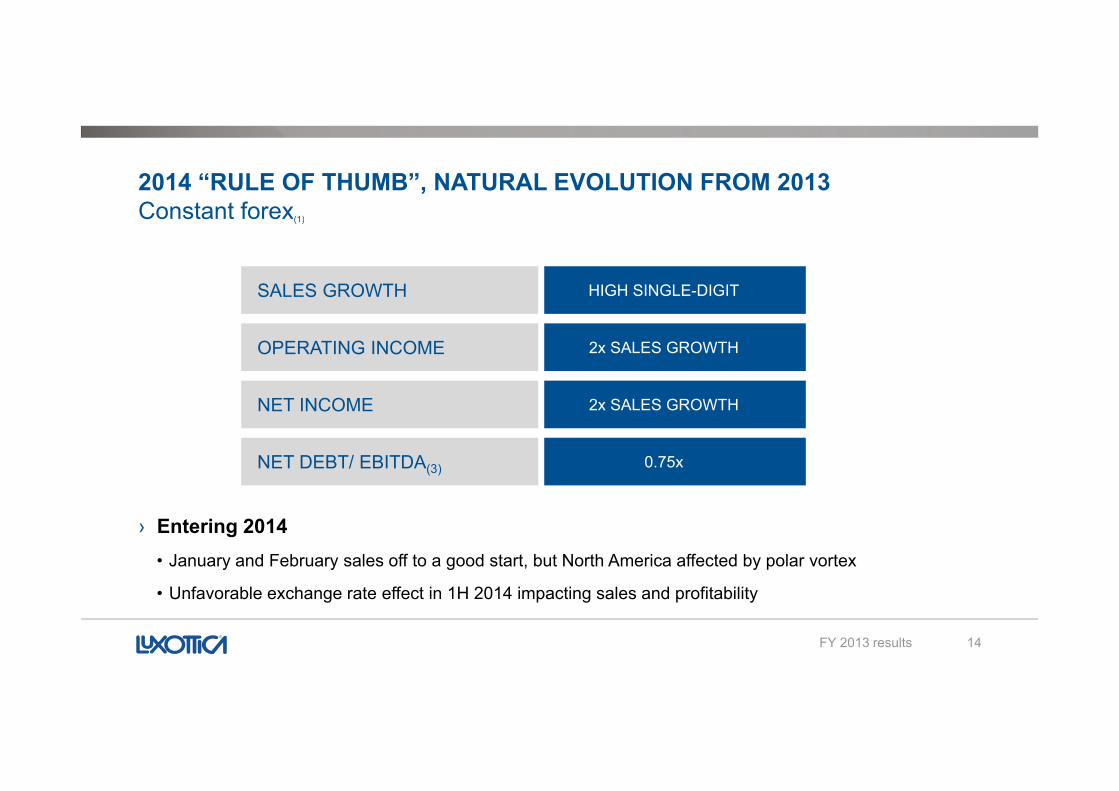
2014 “RULE OF THUMB”, NATURAL EVOLUTION FROM 2013Constant forex(1)Constant forex(1)
HIGH SINGLE-DIGITSALES GROWTH
2x SALES GROWTHOPERATING INCOME
2x SALES GROWTH
0.75x
NET INCOME
NET DEBT/ EBITDA(3)
› Entering 2014• January and February sales off to a good start, but North America affected by polar vortex
14
• Unfavorable exchange rate effect in 1H 2014 impacting sales and profitability
FY 2013 results

BEHIND THE 2014 RULE OF THUMB
Behind the 2014 rule of thumb 15
BEHIND THE 2014 RULE OF THUMB
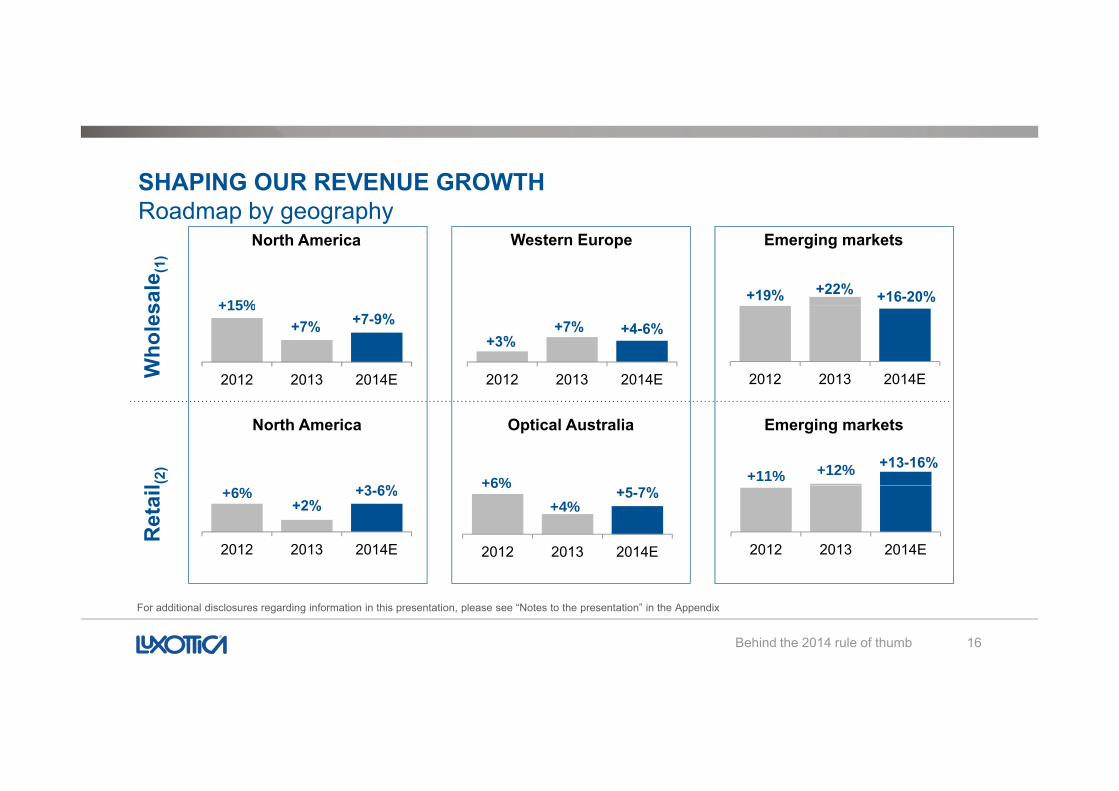
SHAPING OUR REVENUE GROWTHRoadmap by geographyRoadmap by geography
+15%
North America
sale
(1)
Western Europe Emerging markets
+19% +16-20%+22%+15%
2012 2013 2014E
+7-9%+7%
Who
les
+3%
2012 2013 2014E
+4-6%+7%
2012 2013 2014E
(2)
3 6%+11% +12% +13-16%
Optical AustraliaNorth America Emerging markets
+6%
+15Ret
ail +6%
+2%
2012 2013 2014E
+3-6%
2012 2013 2014E
+6%+4%
2012 2013 2014E
+5-7%
Behind the 2014 rule of thumb 16
For additional disclosures regarding information in this presentation, please see “Notes to the presentation” in the Appendix
SHAPING OUR REVENUE GROWTHProactively facing currency headwindsProactively facing currency headwinds
› Reacting to currency swings with› Reacting to currency swings with price adjustments in most emerging markets from August 2013 to February 20142013 to February 2014
› Currently evaluating pricereadjustments in some western countries
Behind the 2014 rule of thumb 17
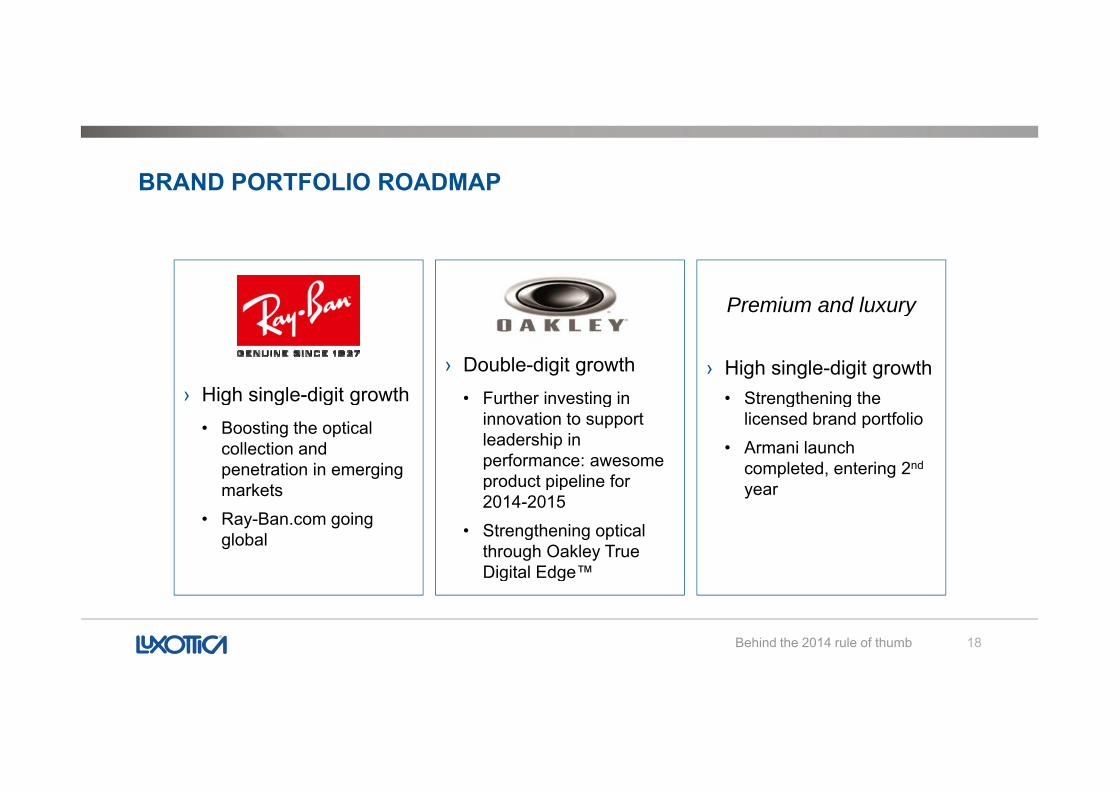
BRAND PORTFOLIO ROADMAP
Premium and luxuryPremium and luxury
› High single-digit growthStrengthening the
› Double-digit growthFurther investing in› High single-digit growth • Strengthening the
licensed brand portfolio• Armani launch
completed, entering 2nd
• Further investing in innovation to support leadership in performance: awesome product pipeline for
› High single-digit growth• Boosting the optical
collection and penetration in emerging
k t yearproduct pipeline for 2014-2015
• Strengthening optical through Oakley True Digital Edge™
markets• Ray-Ban.com going
global
18Behind the 2014 rule of thumb
Digital Edge
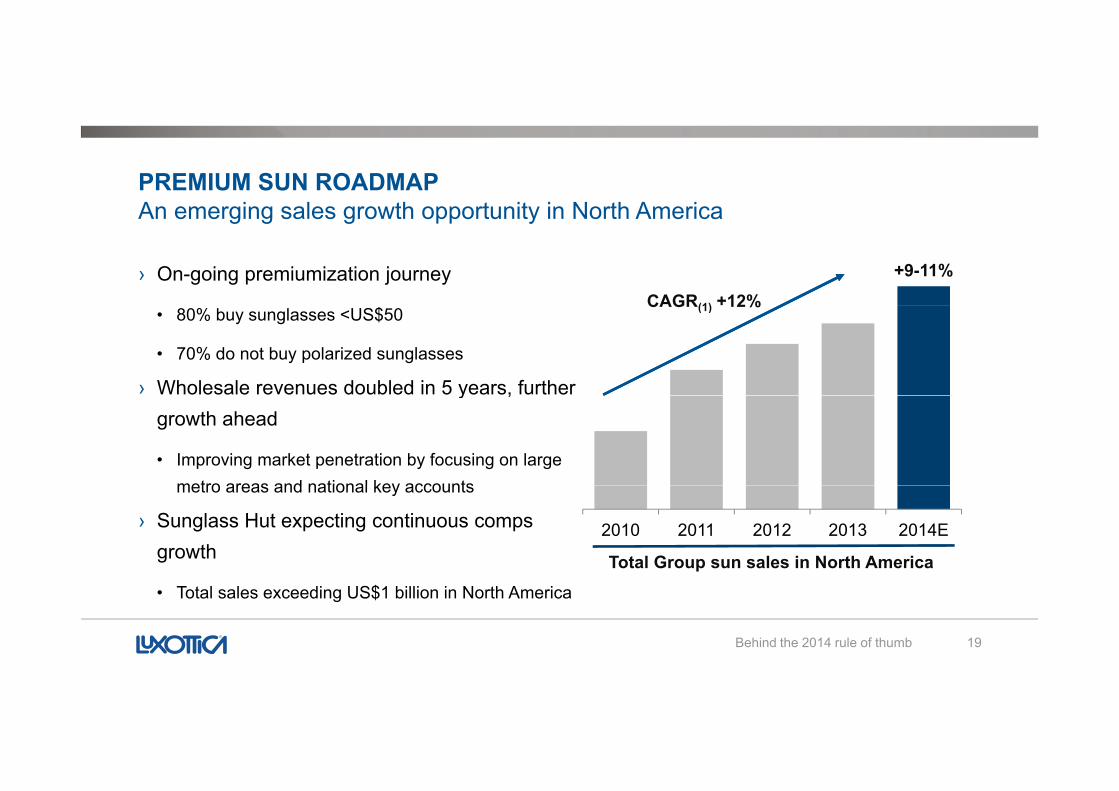
PREMIUM SUN ROADMAPAn emerging sales growth opportunity in North AmericaAn emerging sales growth opportunity in North America
› On-going premiumization journeyCAGR(1) +12%
+9-11%
• 80% buy sunglasses <US$50
• 70% do not buy polarized sunglasses
› Wholesale revenues doubled in 5 years, further
CAGR(1) 12%
y ,growth ahead
• Improving market penetration by focusing on large metro areas and national key accountsmetro areas and national key accounts
› Sunglass Hut expecting continuous comps growth
2010 2011 2012 2013 2014E
Total Group sun sales in North America
19
• Total sales exceeding US$1 billion in North America
Behind the 2014 rule of thumb
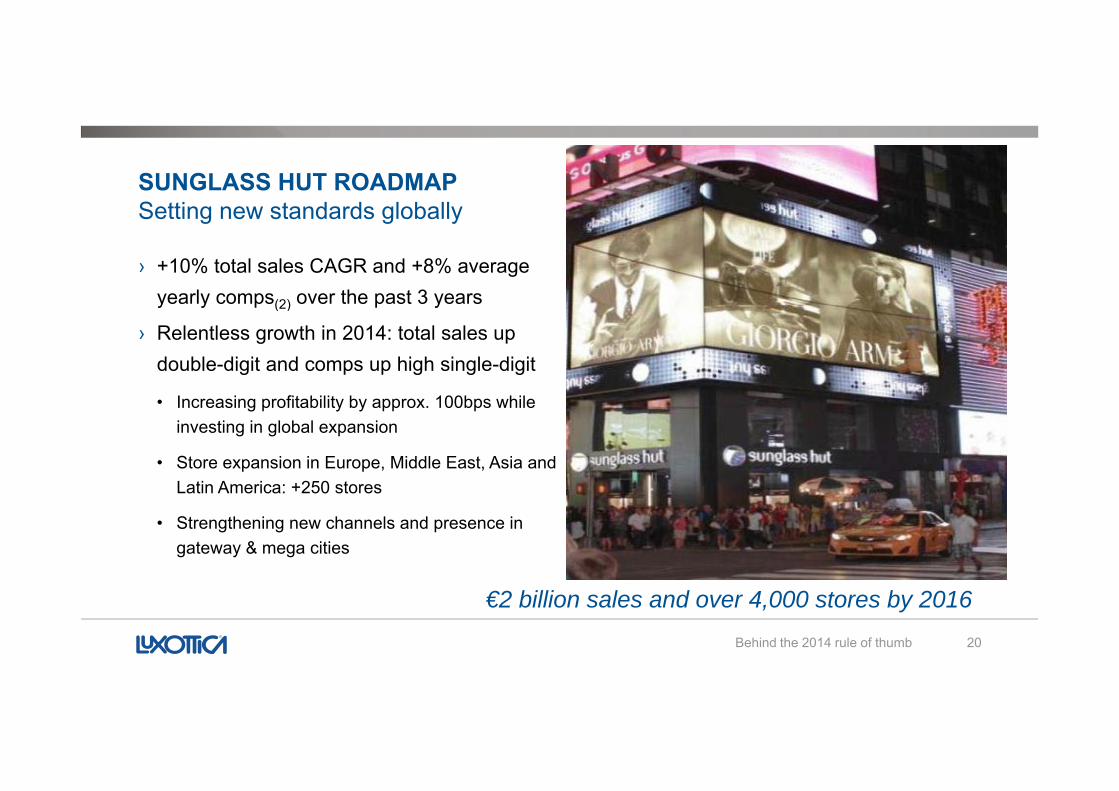
SUNGLASS HUT ROADMAPSetting new standards globallySetting new standards globally
› +10% total sales CAGR and +8% average yearly comps(2) over the past 3 yearsy y p (2) p y
› Relentless growth in 2014: total sales up double-digit and comps up high single-digit
I i fi bili b 100b hil• Increasing profitability by approx. 100bps whileinvesting in global expansion
• Store expansion in Europe, Middle East, Asia and Latin America: +250 storesLatin America: +250 stores
• Strengthening new channels and presence in gateway & mega cities
Behind the 2014 rule of thumb 20
€2 billion sales and over 4,000 stores by 2016
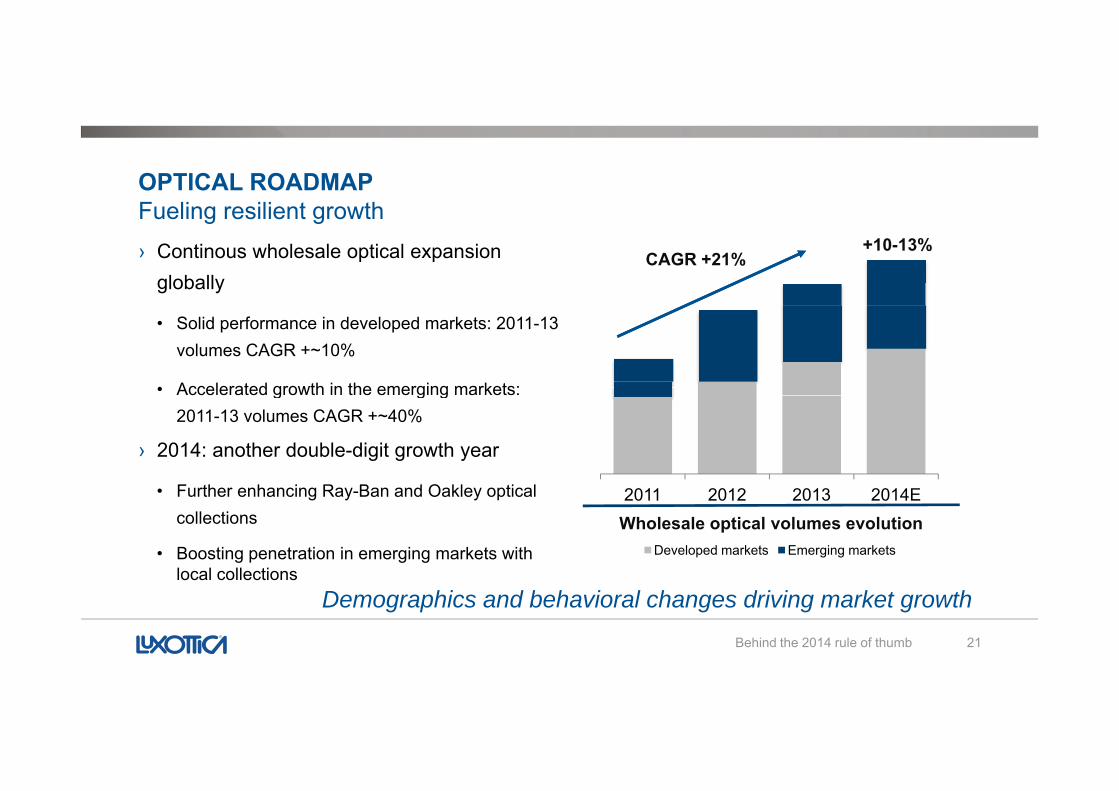
OPTICAL ROADMAPFueling resilient growth› Continous wholesale optical expansion
globally
Fueling resilient growth
CAGR +21%+10-13%
• Solid performance in developed markets: 2011-13 volumes CAGR +~10%
• Accelerated growth in the emerging markets: g g g2011-13 volumes CAGR +~40%
› 2014: another double-digit growth year
F th h i R B d O kl ti l• Further enhancing Ray-Ban and Oakley optical collections
• Boosting penetration in emerging markets with local collections
2011 2012 2013 2014E
Developed markets Emerging markets
Wholesale optical volumes evolution
21
local collections
Behind the 2014 rule of thumb
Demographics and behavioral changes driving market growth
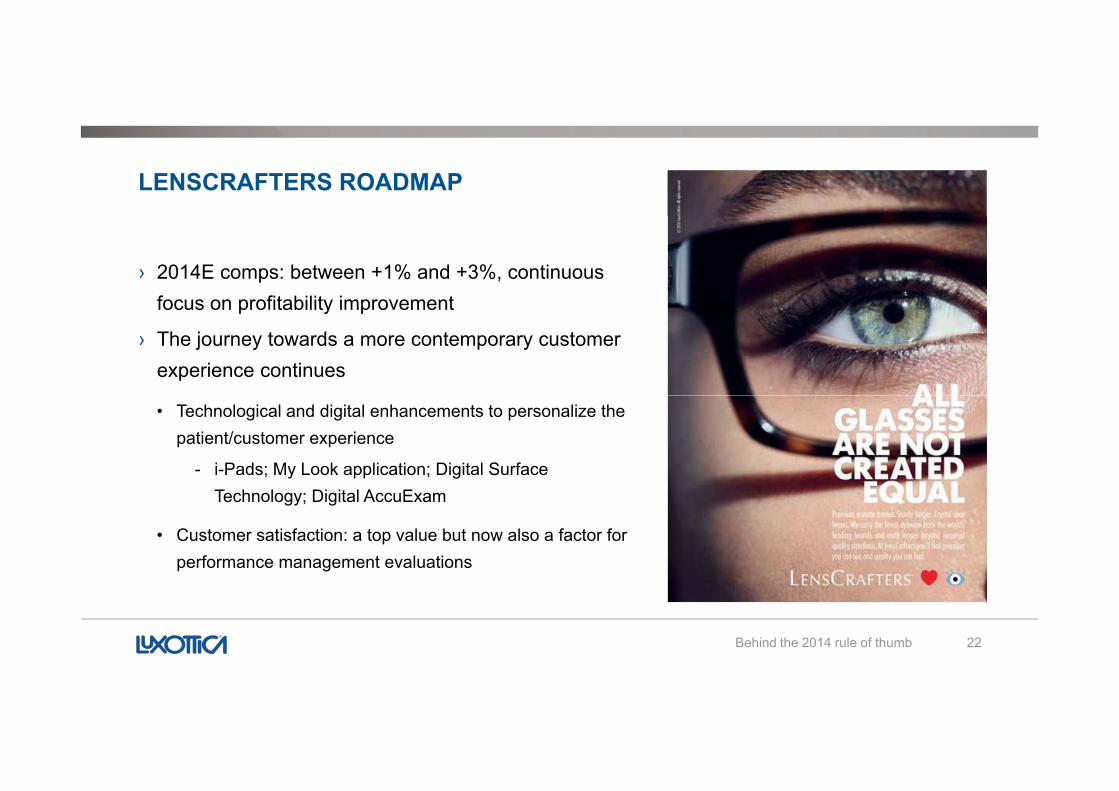
LENSCRAFTERS ROADMAP
› 2014E comps: between +1% and +3%, continuous focus on profitability improvementfocus on profitability improvement
› The journey towards a more contemporary customer experience continues
• Technological and digital enhancements to personalize the patient/customer experience
- i-Pads; My Look application; Digital Surface Technology; Digital AccuExam
• Customer satisfaction: a top value but now also a factor for performance management evaluations
22Behind the 2014 rule of thumb
EFFICIENCIES ROADMAPAcceleration aheadAcceleration ahead
› Rebalancing investments› Rebalancing investments
• Redesigned Europe from a country-approach to a focus on macro regions
M i t iti t i- Managing gateway cities as countries
• IT: moved from “transformation program” to competence center and new Asian hub
• Shared service model: from Europe to US and now Asia
Behind the 2014 rule of thumb 23
Approx. €50 million of savings per year
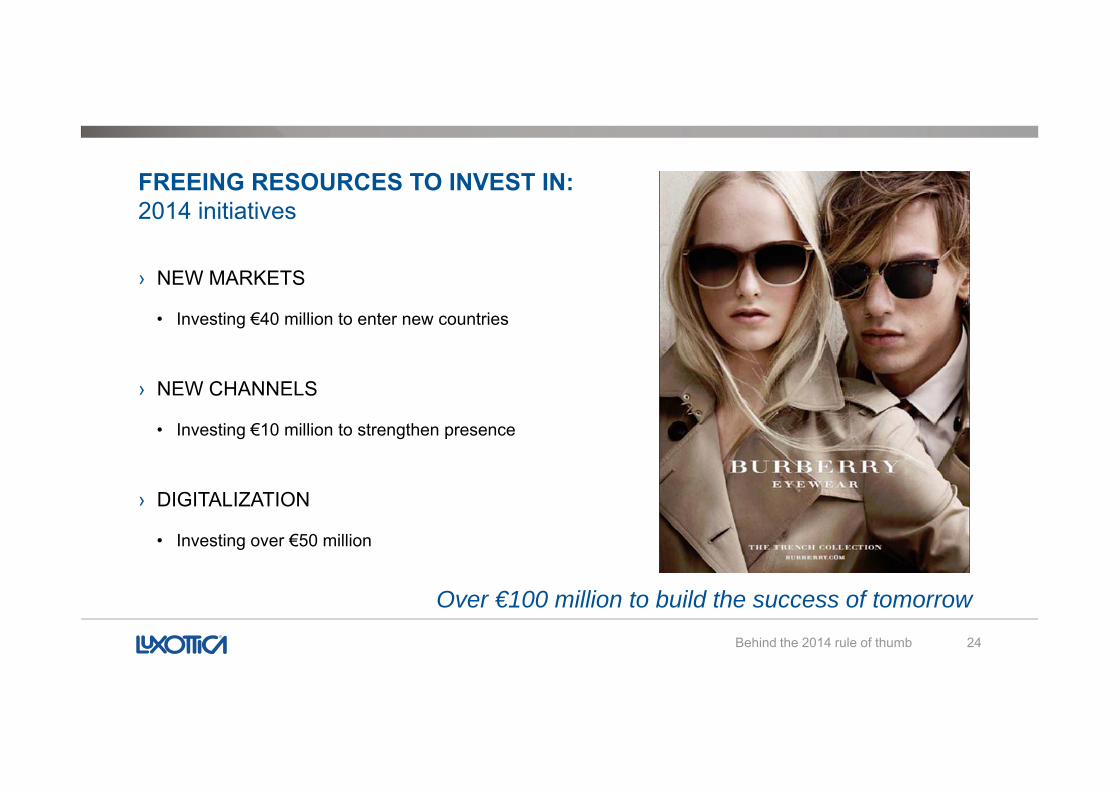
FREEING RESOURCES TO INVEST IN: 2014 initiatives2014 initiatives
› NEW MARKETS
• Investing €40 million to enter new countries
› NEW CHANNELSC S
• Investing €10 million to strengthen presence
› DIGITALIZATION
• Investing over €50 million
Behind the 2014 rule of thumb 24
Over €100 million to build the success of tomorrow

BUILDING THE SUCCESS OF TOMORROW
Building the success of tomorrow 25
TOMORROW
BUILDING THE SUCCESS OF TOMORROW Clear growth trajectory and ambitious goals for each businessClear growth trajectory and ambitious goals for each business
› Further leveraging our customer-centric organizationg g g
› Promoting a cultural shift in an ever-changing world
› Continuously identifying and seizing new opportunities
F i th t iti t ti ti d i t t
26
From mapping the opportunities to executing actions and investments
Building the success of tomorrow
SECULAR GROWTH DRIVERSEyewear significantly under-penetratedEyewear, significantly under penetrated
PENETRATION
DEMOGRAPHICS NEW CHANNELS
GATEWAY AND MEGA CITIES
PREMIUMIZATION EMERGING MARKETS
27
External drivers supporting Luxottica’s effective execution of its growth engines
Building the success of tomorrow
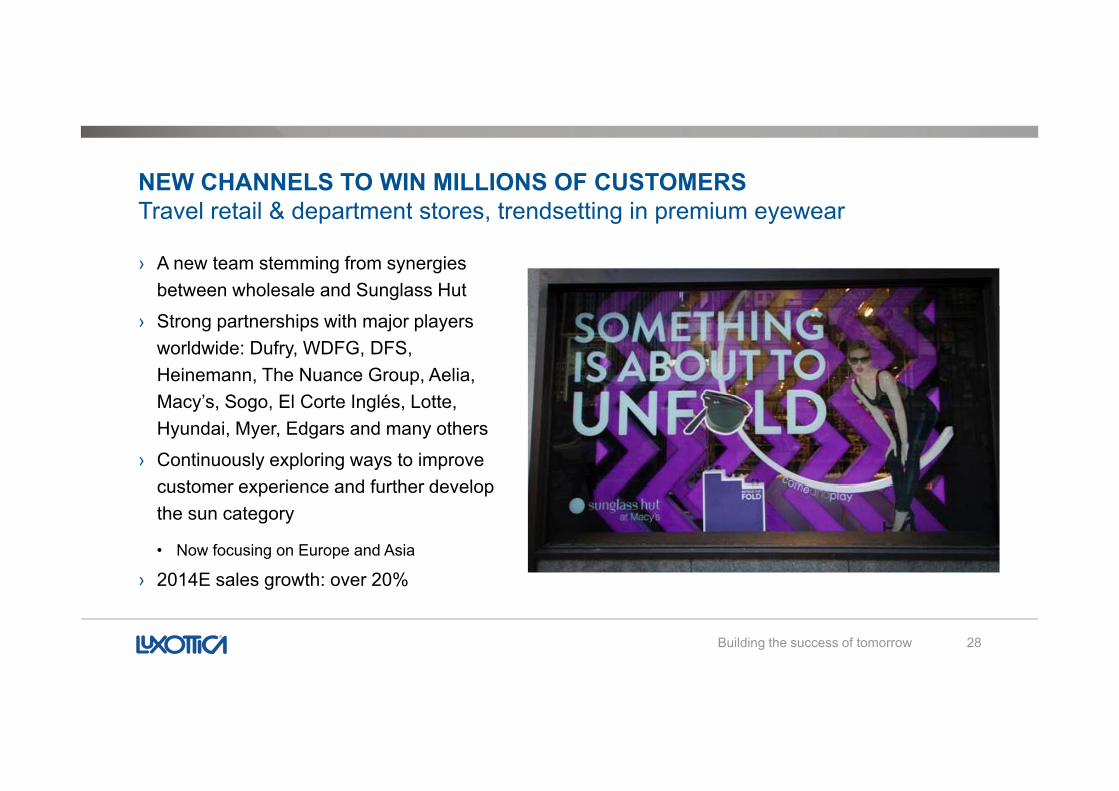
NEW CHANNELS TO WIN MILLIONS OF CUSTOMERSTravel retail & department stores trendsetting in premium eyewearTravel retail & department stores, trendsetting in premium eyewear
› A new team stemming from synergies between wholesale and Sunglass Hut
› Strong partnerships with major players worldwide: Dufry, WDFG, DFS, Heinemann, The Nuance Group, Aelia, M ’ S El C t I lé L ttMacy’s, Sogo, El Corte Inglés, Lotte, Hyundai, Myer, Edgars and many others
› Continuously exploring ways to improve customer experience and further developcustomer experience and further develop the sun category
• Now focusing on Europe and Asia
2014E l th 20%
Building the success of tomorrow 28
› 2014E sales growth: over 20%
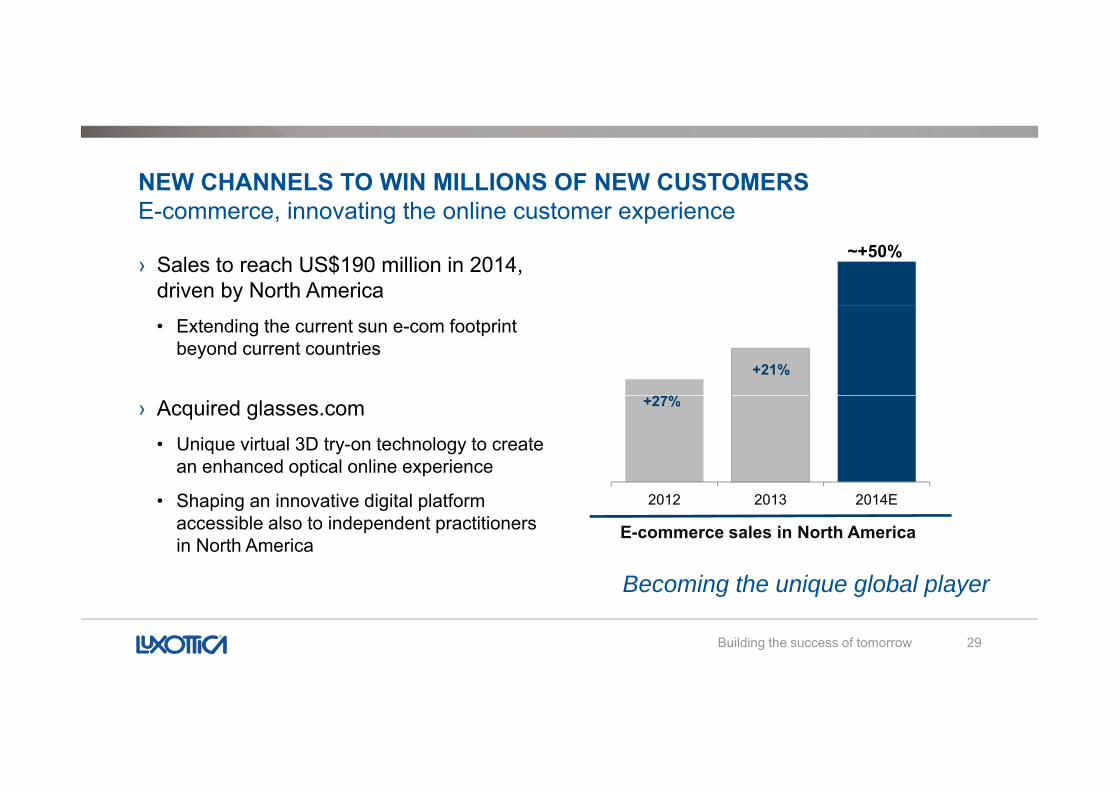
NEW CHANNELS TO WIN MILLIONS OF NEW CUSTOMERSE-commerce innovating the online customer experienceE commerce, innovating the online customer experience
› Sales to reach US$190 million in 2014, driven by North America
~+50%
• Extending the current sun e-com footprint beyond current countries
+21%
%› Acquired glasses.com • Unique virtual 3D try-on technology to create
an enhanced optical online experience
+27%
• Shaping an innovative digital platform accessible also to independent practitioners in North America
B i th i l b l l
2012 2013 2014E
E-commerce sales in North America
29
Becoming the unique global player
Building the success of tomorrow
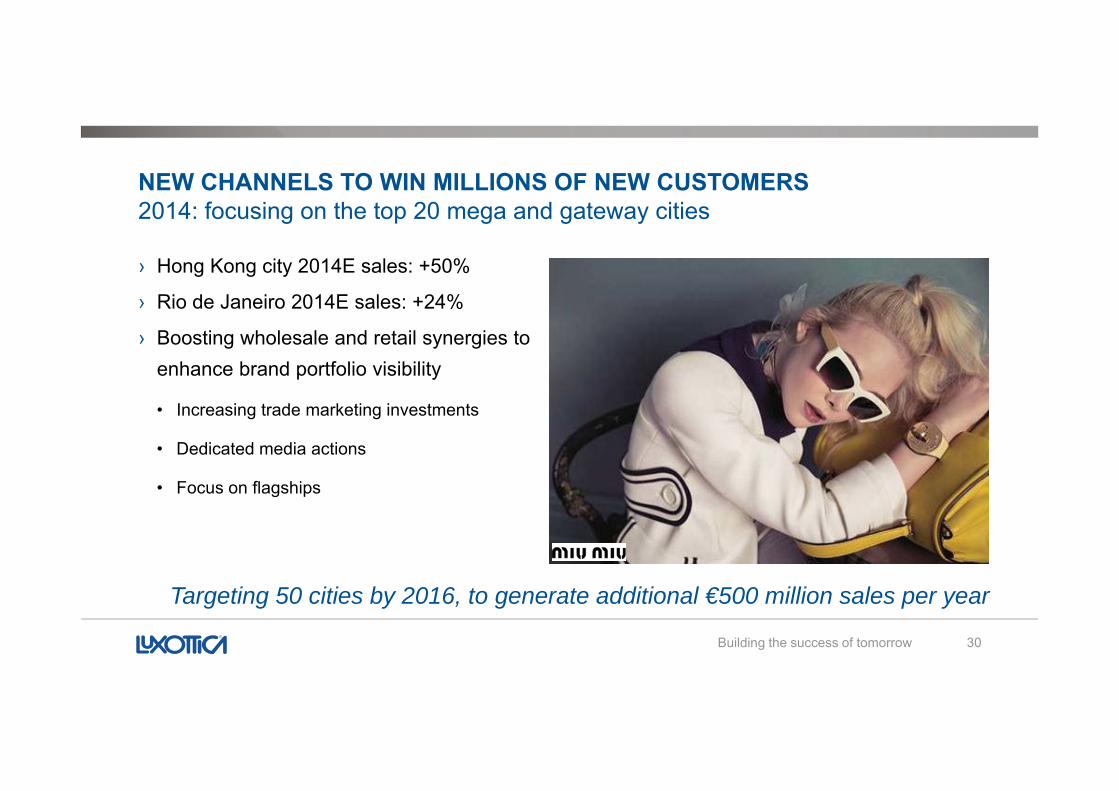
NEW CHANNELS TO WIN MILLIONS OF NEW CUSTOMERS2014: focusing on the top 20 mega and gateway cities2014: focusing on the top 20 mega and gateway cities
› Hong Kong city 2014E sales: +50%
› Rio de Janeiro 2014E sales: +24%› Rio de Janeiro 2014E sales: +24%
› Boosting wholesale and retail synergies to enhance brand portfolio visibility
• Increasing trade marketing investments
• Dedicated media actions
• Focus on flagships• Focus on flagships
Building the success of tomorrow 30
Targeting 50 cities by 2016, to generate additional €500 million sales per year
EMERGING MARKETS A i l d
Emerging markets 31
An unrivaled presence
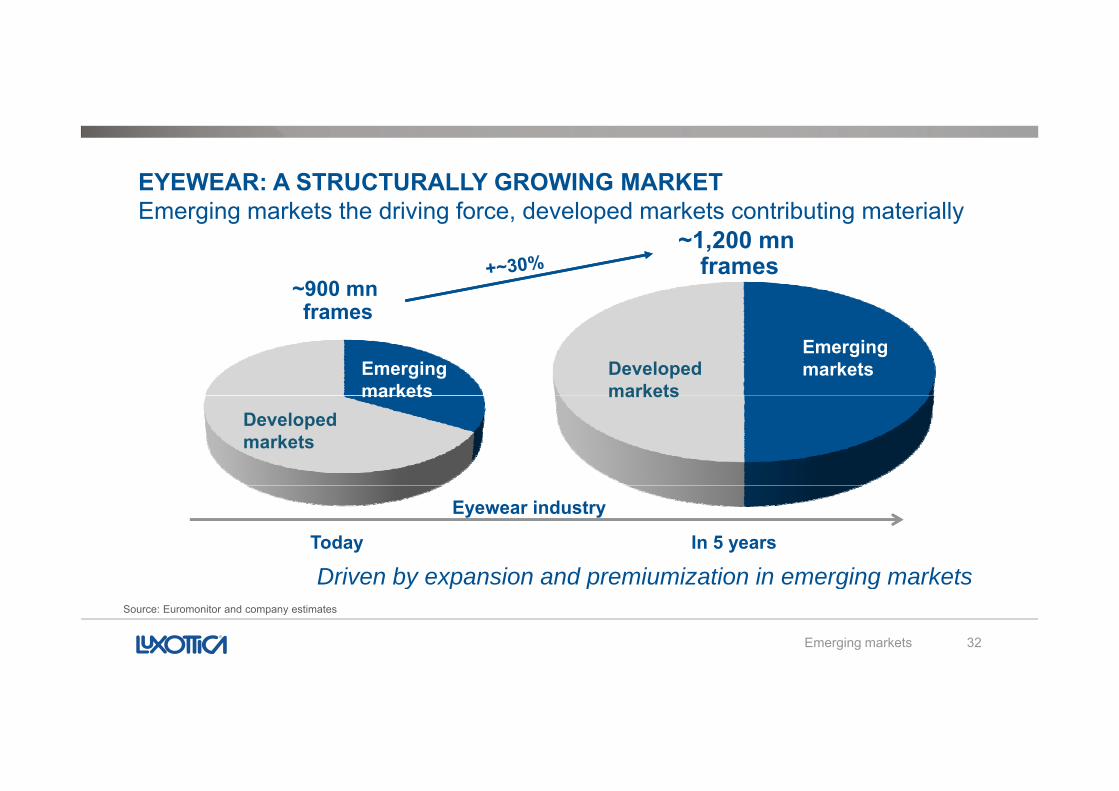
EYEWEAR: A STRUCTURALLY GROWING MARKETEmerging markets the driving force developed markets contributing materiallyEmerging markets the driving force, developed markets contributing materially
~900 mnf
~900 mnf
~1,200 mnframes
~1,200 mnframes
framesframes
Emerging markets
Emerging marketsDeveloped
marketsmarketsDeveloped markets
markets
Today In 5 years
Driven by expansion and premiumization in emerging markets
Eyewear industry
Emerging markets 32
Driven by expansion and premiumization in emerging marketsSource: Euromonitor and company estimates
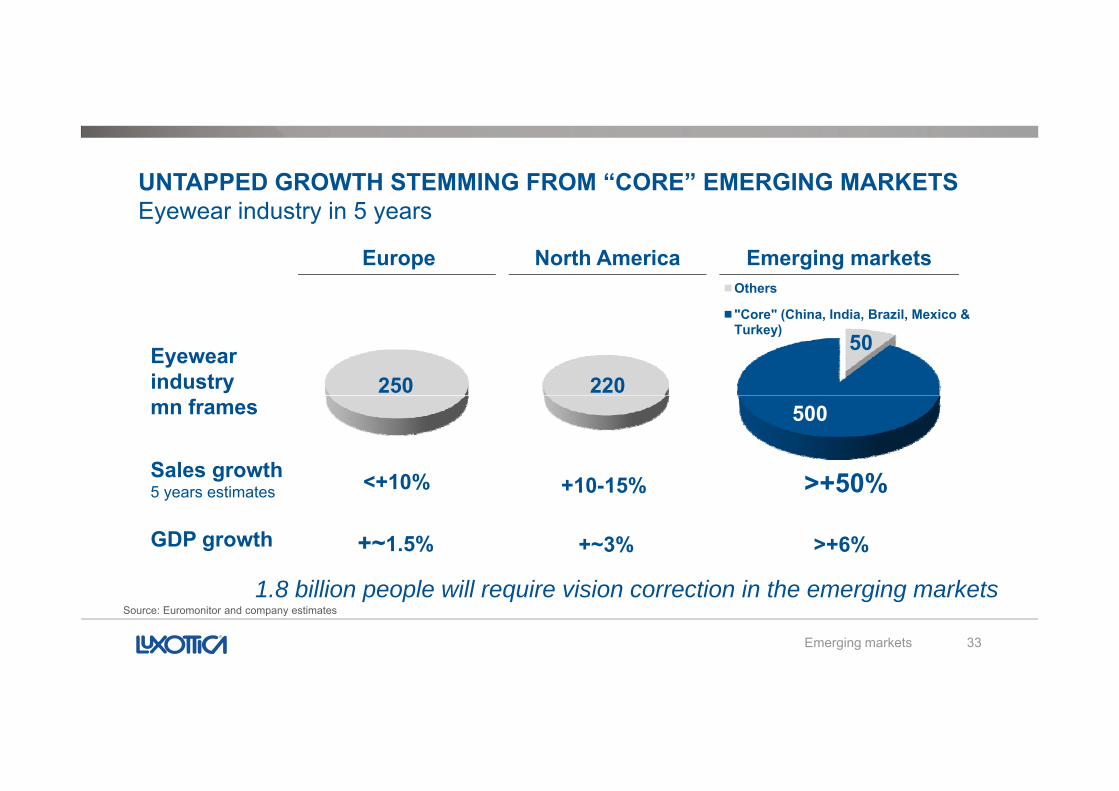
UNTAPPED GROWTH STEMMING FROM “CORE” EMERGING MARKETSEyewear industry in 5 yearsEyewear industry in 5 years
Europe North America Emerging marketsOthers
Eyewear industry 250 220
50"Core" (China, India, Brazil, Mexico & Turkey)
mn frames
Sales growth
500
<+10%<+10% +10 15%+10 15% >+50%>+50%
500
+~1.5% +~3% >+6%
5 years estimates
GDP growth
<+10%<+10% +10-15%+10-15% >+50%>+50%
Emerging markets 33
1.8 billion people will require vision correction in the emerging markets Source: Euromonitor and company estimates
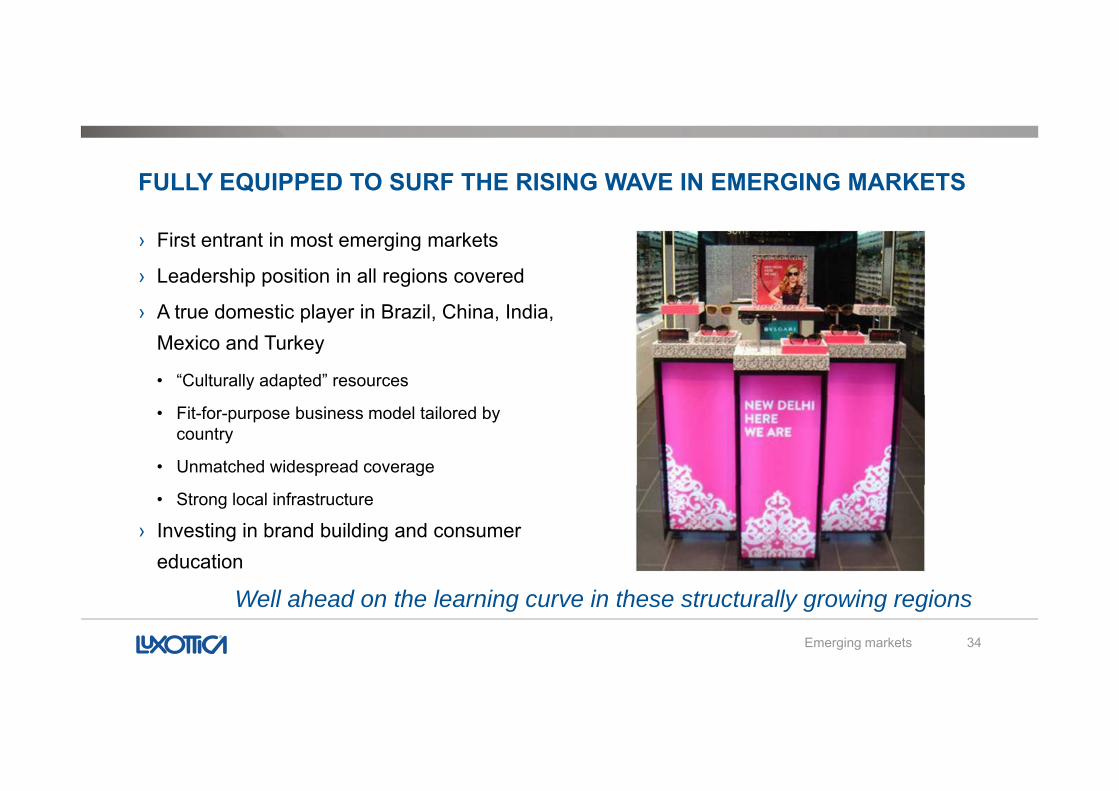
FULLY EQUIPPED TO SURF THE RISING WAVE IN EMERGING MARKETS
› First entrant in most emerging markets
› Leadership position in all regions covered
A t d ti l i B il Chi I di› A true domestic player in Brazil, China, India, Mexico and Turkey
• “Culturally adapted” resources
• Fit-for-purpose business model tailored by country
• Unmatched widespread coverage
• Strong local infrastructure
› Investing in brand building and consumereducation
Emerging markets 34
Well ahead on the learning curve in these structurally growing regions
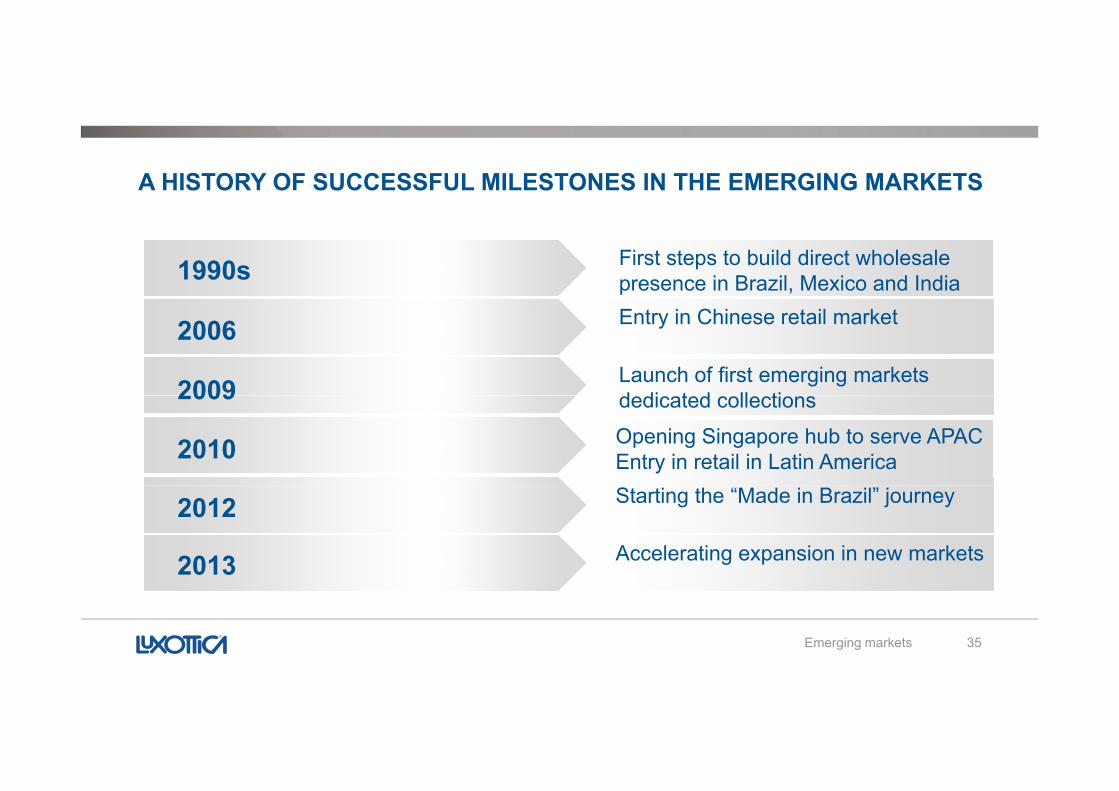
A HISTORY OF SUCCESSFUL MILESTONES IN THE EMERGING MARKETS
1990s First steps to build direct wholesale presence in Brazil, Mexico and India
Launch of first emerging markets d di t d ll ti2009
2006 Entry in Chinese retail market
dedicated collections2009Opening Singapore hub to serve APAC Entry in retail in Latin America2010
2012 Starting the “Made in Brazil” journey
2013 Accelerating expansion in new markets
Emerging markets 35
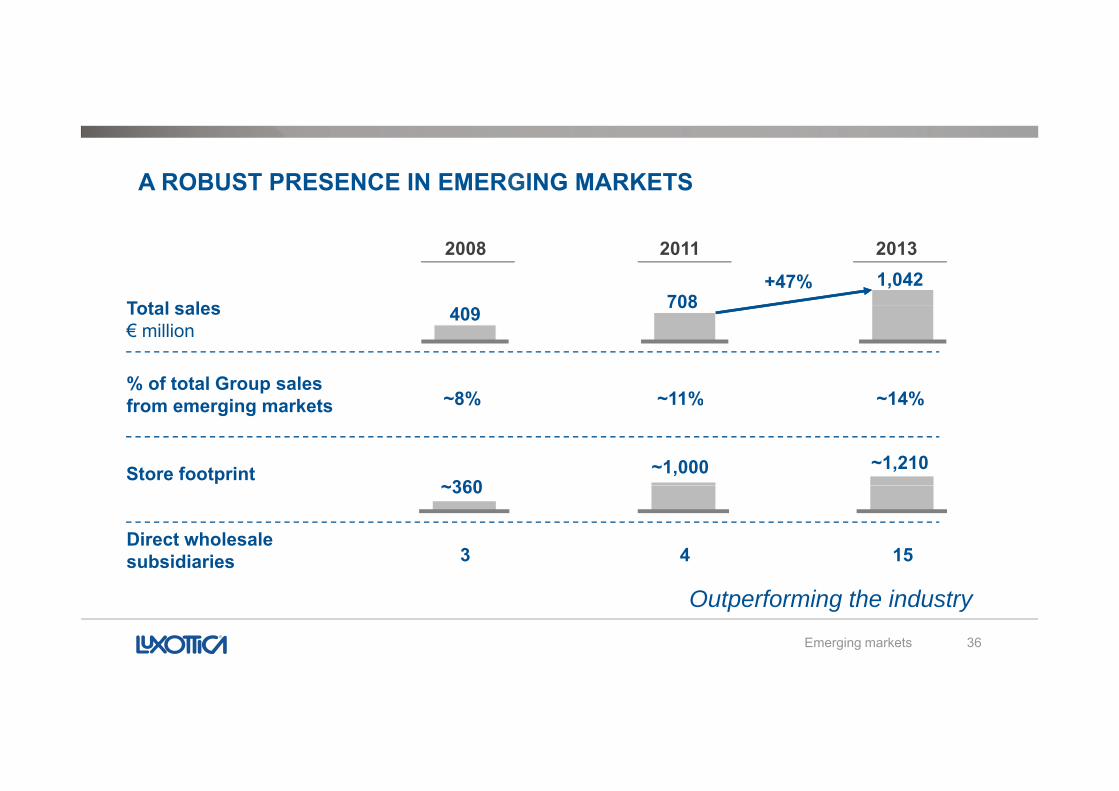
A ROBUST PRESENCE IN EMERGING MARKETS
2008 2011 2013
Total sales 7081,042+47%
% of total Group sales
Total sales€ million
8% 11% 14%
409 708
from emerging markets ~8% ~11% ~14%
Store footprint~360
~1,000 ~1,210
Direct wholesale subsidiaries 33 44 1515
~360
Emerging markets 36
Outperforming the industry
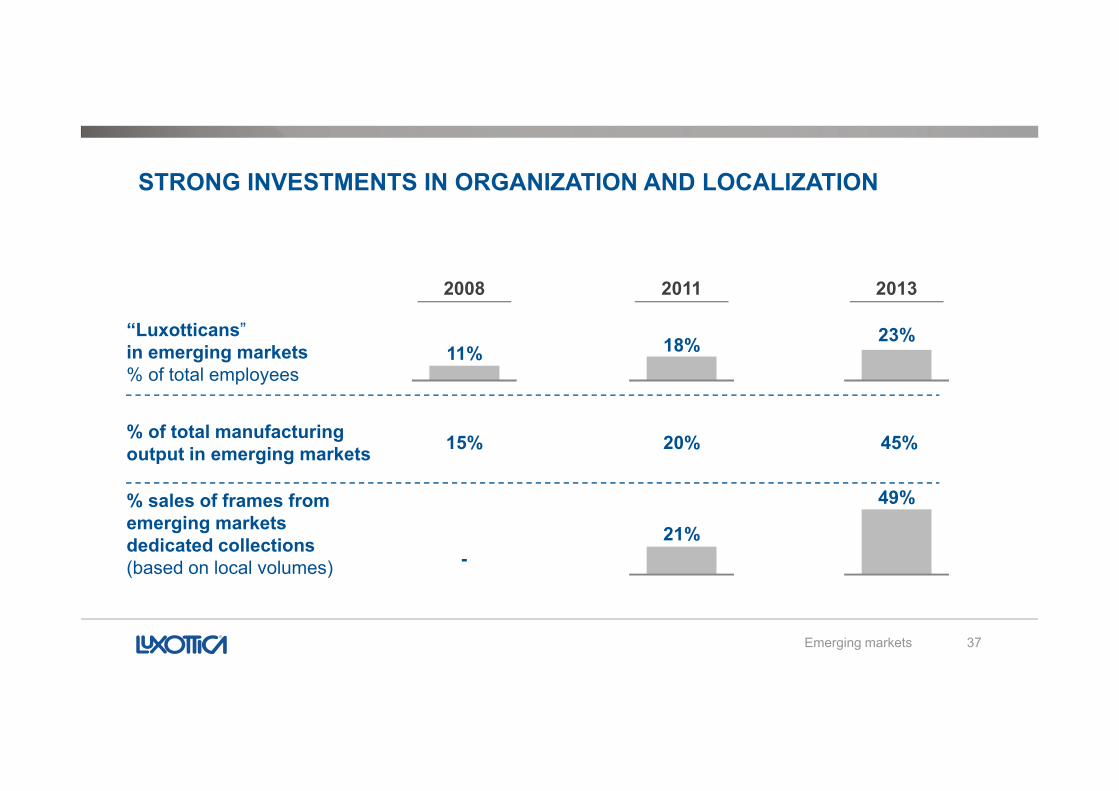
STRONG INVESTMENTS IN ORGANIZATION AND LOCALIZATION
2008 2011 2013
23%“Luxotticans”in emerging markets% of total employees
11% 18%
% of total manufacturing output in emerging markets 15%15% 20%20% 45%45%
% sales of frames from emerging markets dedicated collections (based on local volumes) -
21%
49%
Emerging markets 37
( )
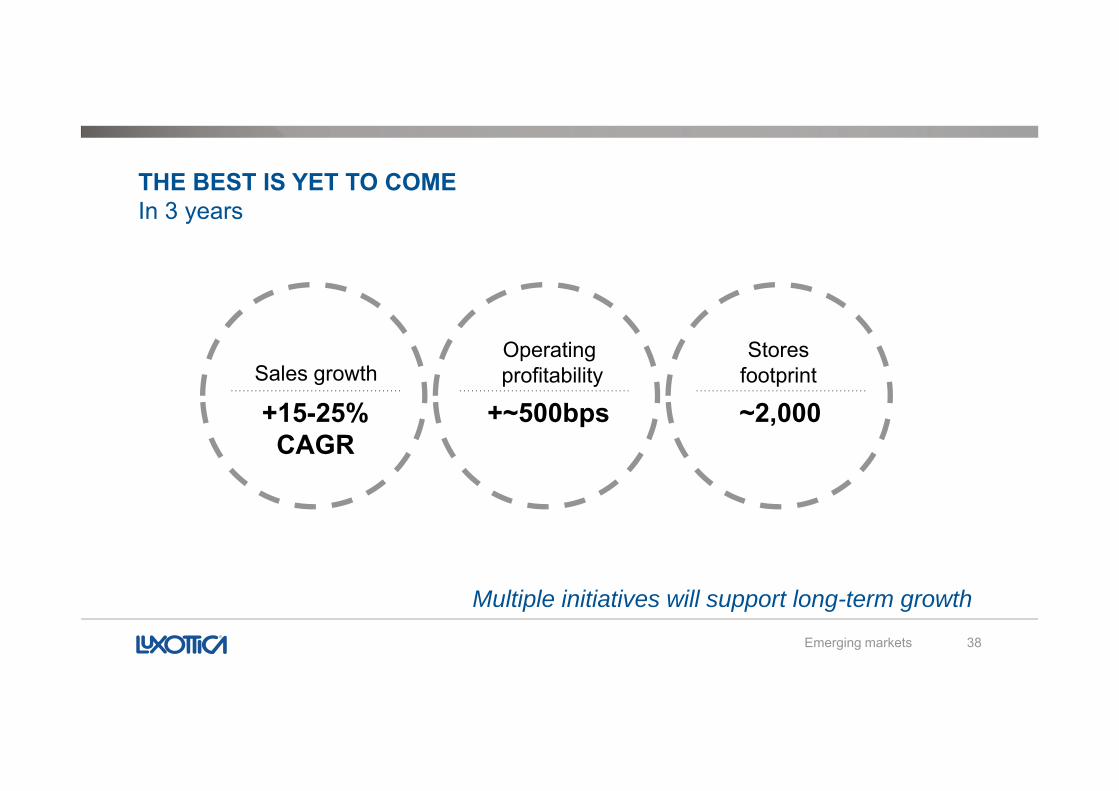
THE BEST IS YET TO COMEIn 3 yearsIn 3 years
Sales growthOperating profitability
Storesfootprint
+15-25%CAGR
+~500bps ~2,000
Emerging markets 38
Multiple initiatives will support long-term growth
BRAZILPR Campaign 2013
Brazil 39
A truly domestic player
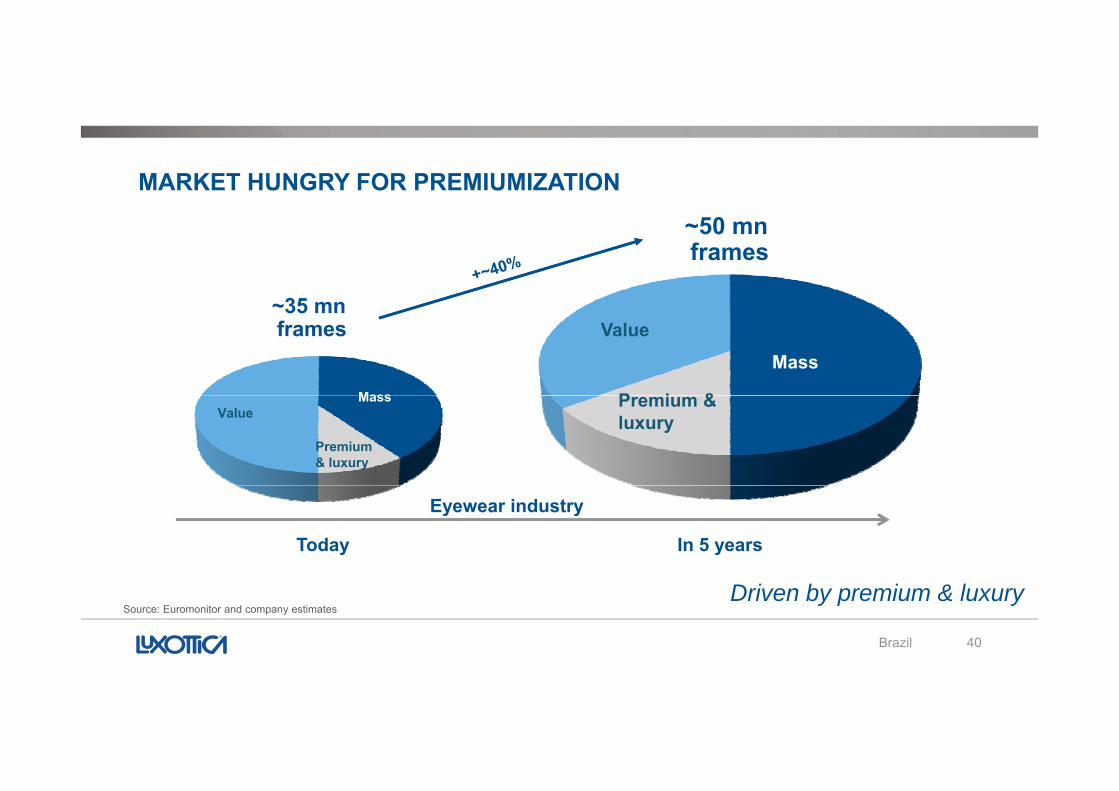
MARKET HUNGRY FOR PREMIUMIZATION
~35 mn~35 mn
~50 mnframes~50 mnframes
Mass
Mass
P i &
Value~35 mnframes~35 mnframes
MassValue
Premium & luxury
Premium & luxury
Today In 5 years
Eyewear industry
Brazil 40
Driven by premium & luxurySource: Euromonitor and company estimates
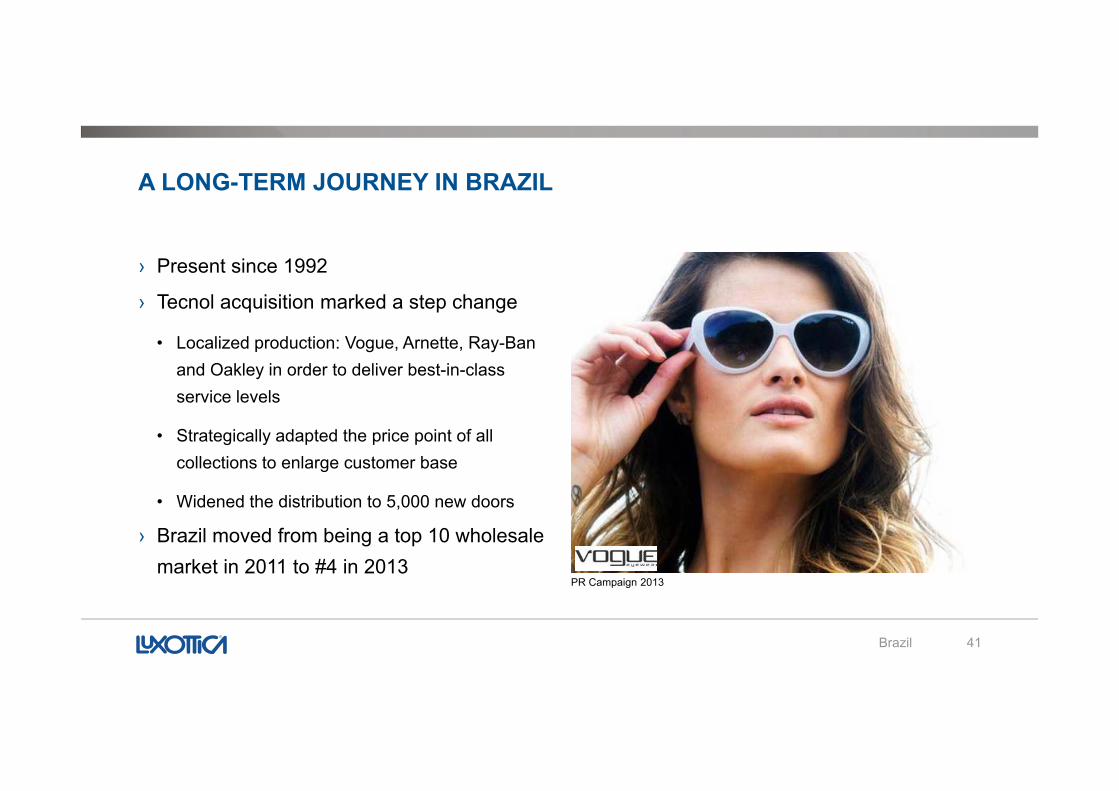
A LONG-TERM JOURNEY IN BRAZIL
› Present since 1992
› Tecnol acquisition marked a step change› Tecnol acquisition marked a step change
• Localized production: Vogue, Arnette, Ray-Ban and Oakley in order to deliver best-in-class service levelsservice levels
• Strategically adapted the price point of all collections to enlarge customer base
• Widened the distribution to 5,000 new doors
› Brazil moved from being a top 10 wholesale market in 2011 to #4 in 2013
Brazil 41
PR Campaign 2013
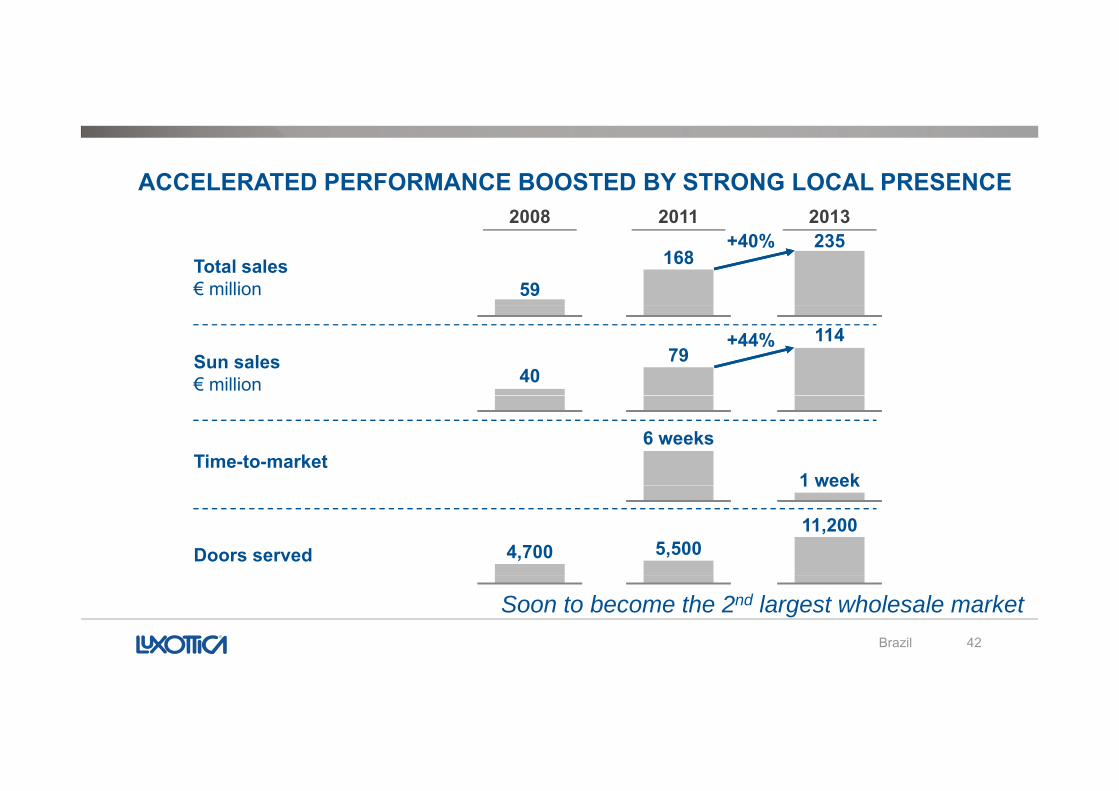
ACCELERATED PERFORMANCE BOOSTED BY STRONG LOCAL PRESENCE 2008 2011 20132008 2011 2013
Total sales € million 59
168235+40%
Sun sales € million 40
79114+44%
Time-to-market6 weeks
1 week
Doors served
1 week
4,700 5,50011,200
Brazil 42
Soon to become the 2nd largest wholesale market
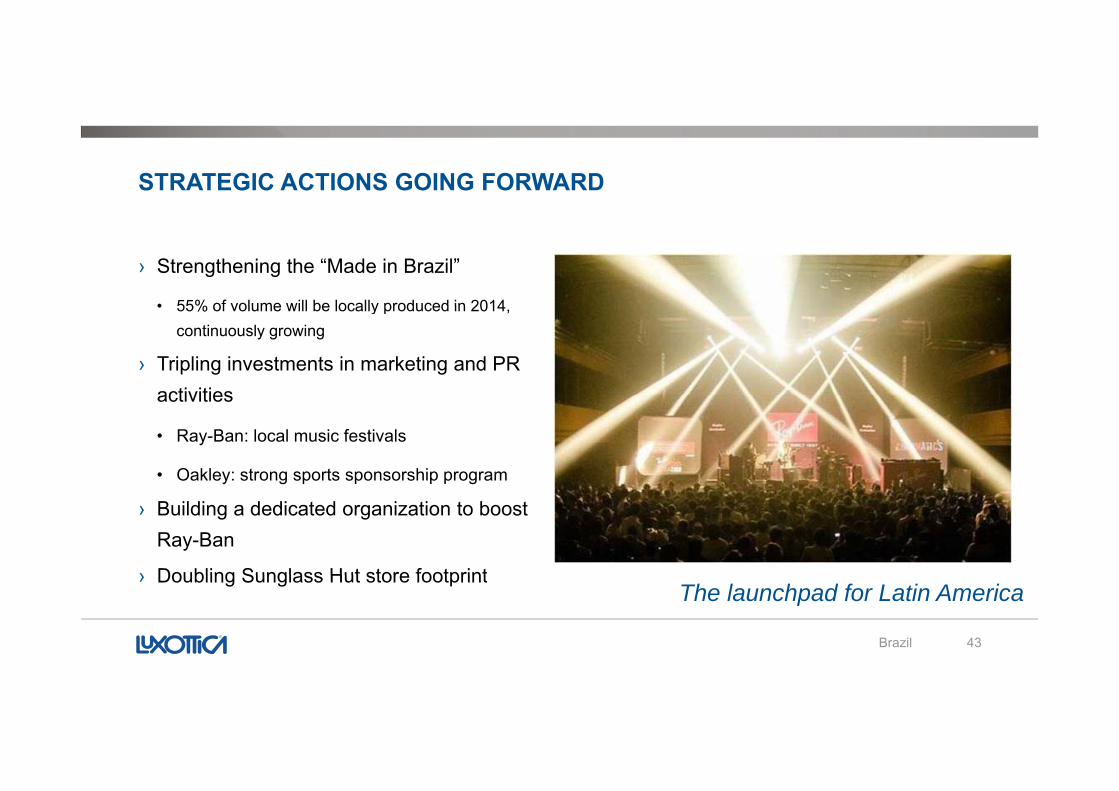
STRATEGIC ACTIONS GOING FORWARD
› Strengthening the “Made in Brazil”
• 55% of volume will be locally produced in 2014• 55% of volume will be locally produced in 2014, continuously growing
› Tripling investments in marketing and PR activitiesactivities
• Ray-Ban: local music festivals
• Oakley: strong sports sponsorship program
› Building a dedicated organization to boost Ray-Ban
› Doubling Sunglass Hut store footprint
Brazil 43
› Doubling Sunglass Hut store footprintThe launchpad for Latin America
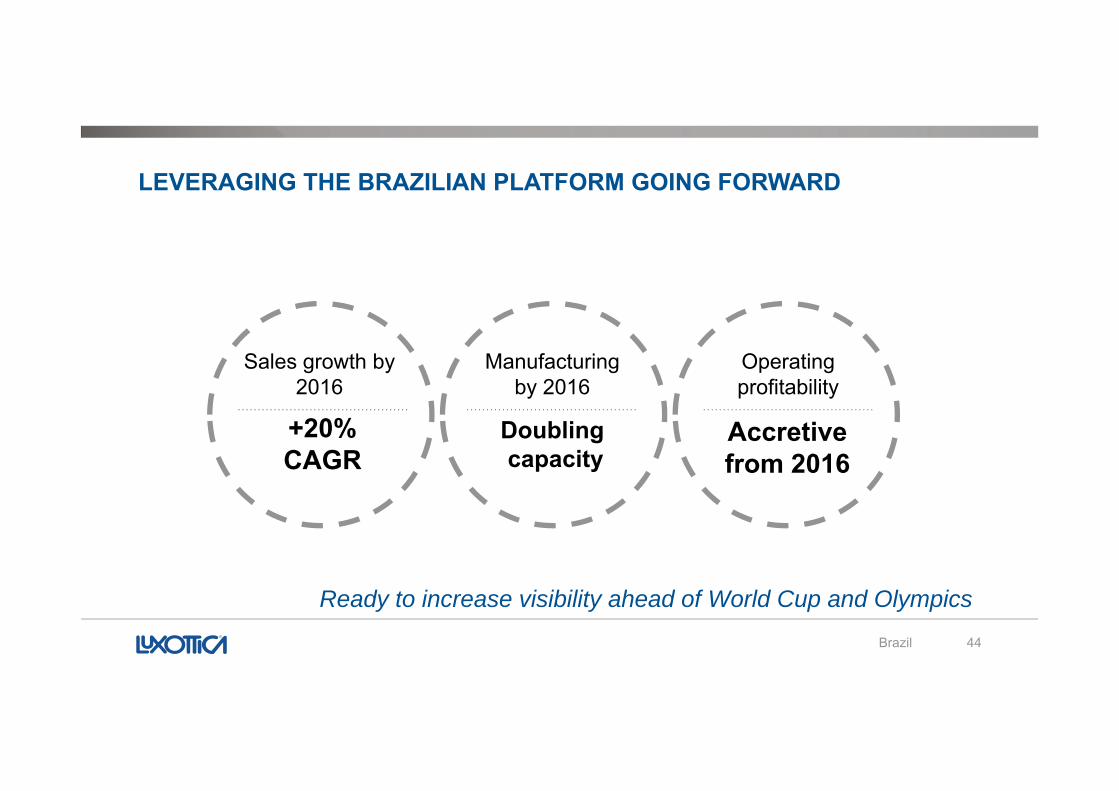
LEVERAGING THE BRAZILIAN PLATFORM GOING FORWARD
Sales growth by2016
Manufacturing by 2016
Operatingprofitability
+20%CAGR
y
Doublingcapacity
p y
Accretivefrom 2016
Brazil 44
Ready to increase visibility ahead of World Cup and Olympics
CHINA Growth at full throttle
China 45
Growth at full throttle
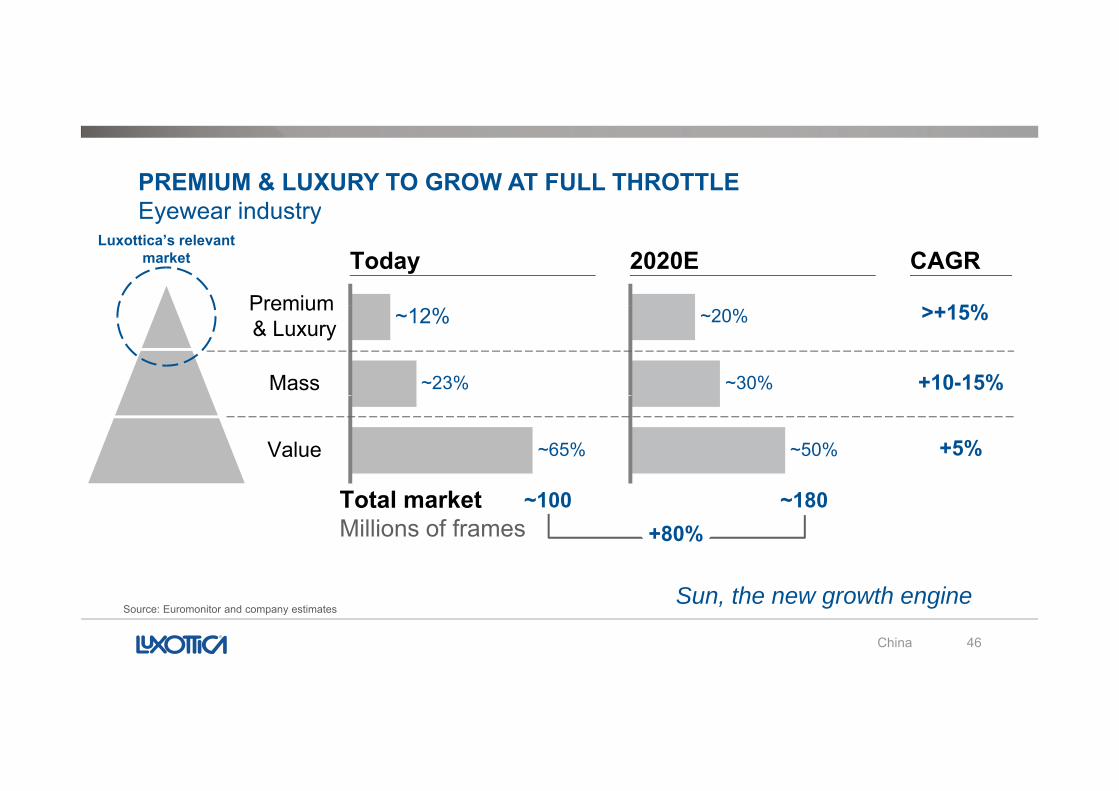
PREMIUM & LUXURY TO GROW AT FULL THROTTLEEyewear industryEyewear industry
15%15%Premium
Today 2020E CAGRLuxottica’s relevant
market
~30%
~20% >+15%>+15%
+10-15%+10-15%Mass ~23%
Premium & Luxury ~12%
~50% +5%+5%~65%Value
Total marketMillions of frames
~100~100 ~180~180+80%+80%
China 46
Sun, the new growth engineSource: Euromonitor and company estimates
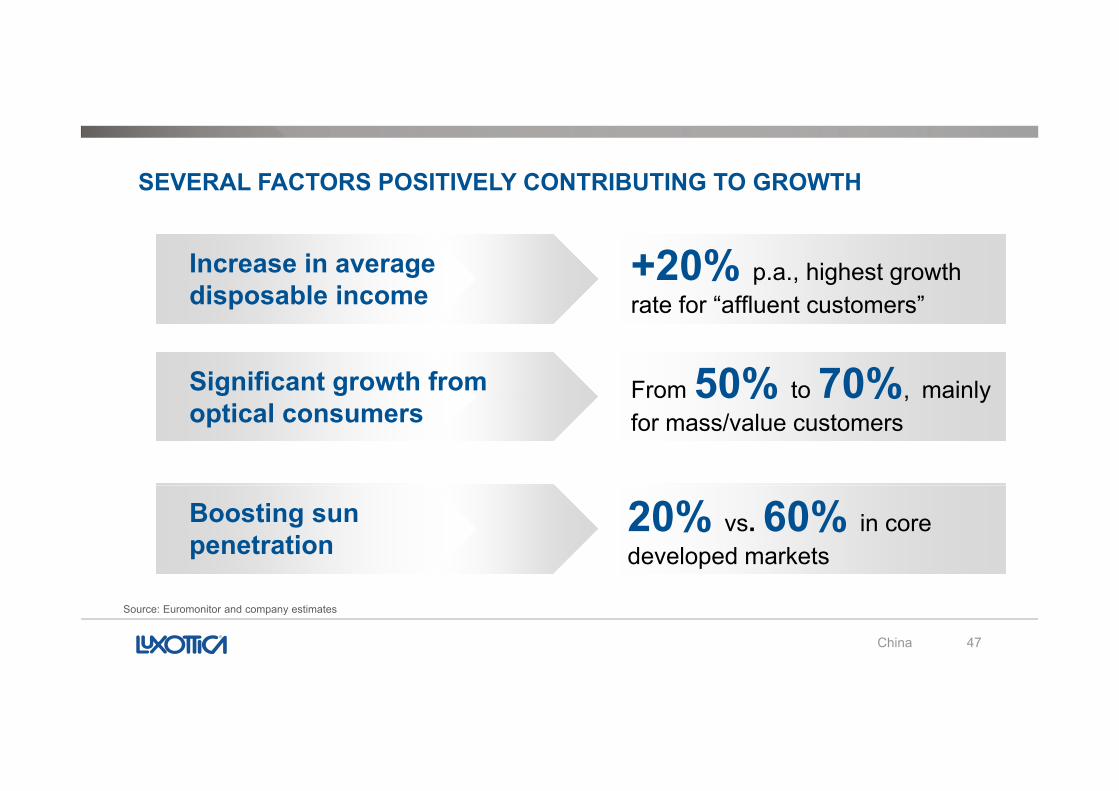
SEVERAL FACTORS POSITIVELY CONTRIBUTING TO GROWTH
Increase in average disposable income
+20% p.a., highest growth rate for “affluent customers”p
Significant growth from
rate for affluent customers
From 50% to 70%, mainlyg goptical consumers
From 50% to 70%, mainly for mass/value customers
Boosting sun penetration
20% vs. 60% in core developed markets
China 47
Source: Euromonitor and company estimates
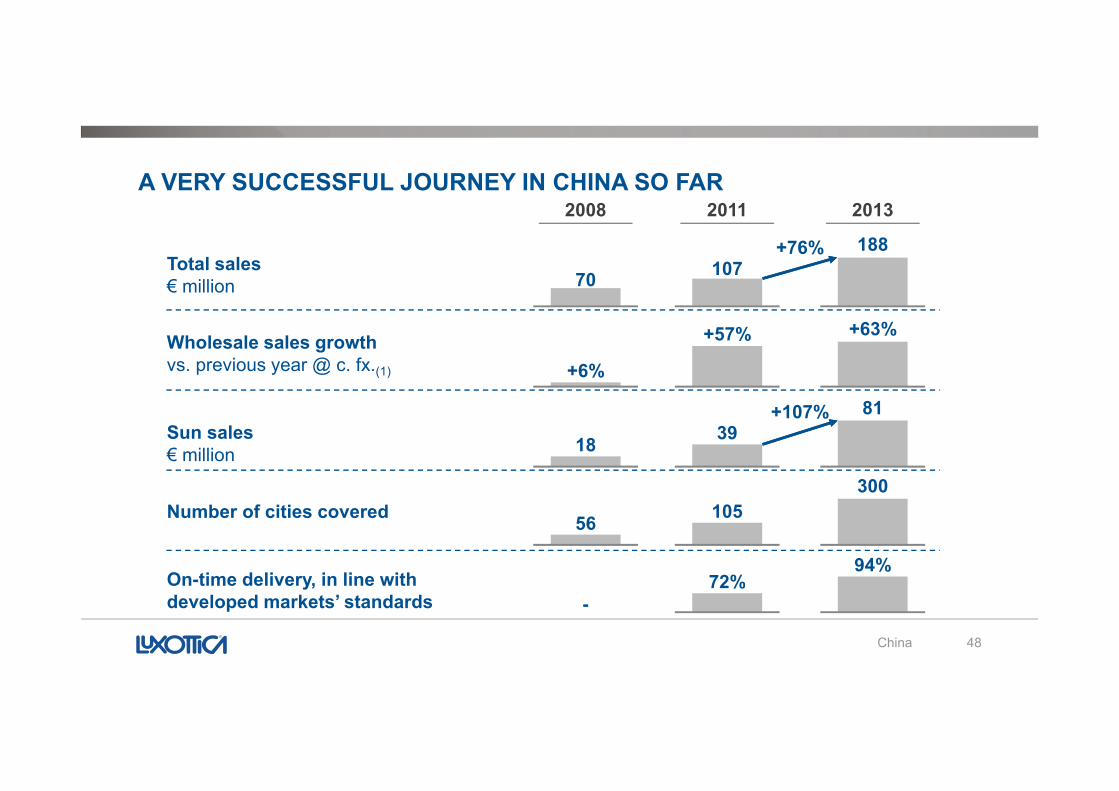
A VERY SUCCESSFUL JOURNEY IN CHINA SO FAR2008 2011 2013
Total sales€ million
2008 2011 2013
70 107188+76%
Wholesale sales growth vs. previous year @ c. fx.(1) +6%
+57% +63%
Sun sales€ million 18 39
81
300
+107%
Number of cities covered
O ti d li i li ith
56 105300
94%72%
China 48
On-time delivery, in line with developed markets’ standards -
72%
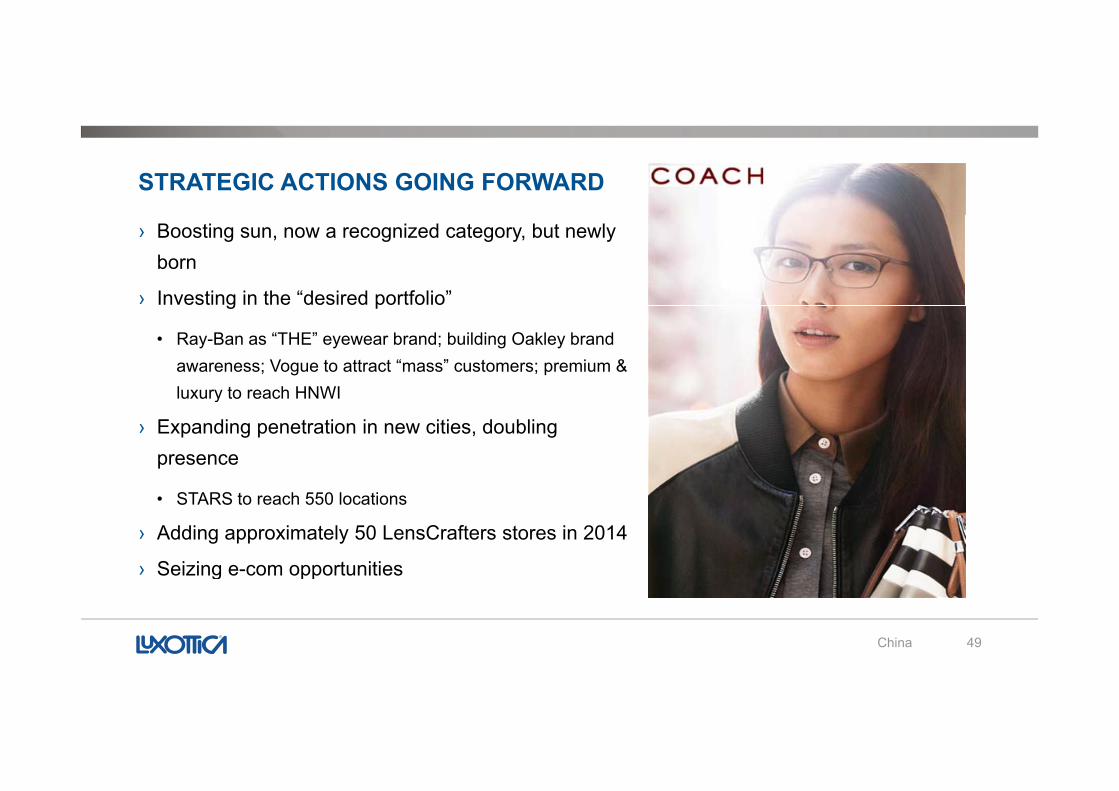
STRATEGIC ACTIONS GOING FORWARD
› Boosting sun, now a recognized category, but newly born
› Investing in the “desired portfolio”g p
• Ray-Ban as “THE” eyewear brand; building Oakley brand awareness; Vogue to attract “mass” customers; premium & luxury to reach HNWIluxury to reach HNWI
› Expanding penetration in new cities, doubling presence
• STARS to reach 550 locations
› Adding approximately 50 LensCrafters stores in 2014
› Seizing e-com opportunities
China 49
Seizing e com opportunities
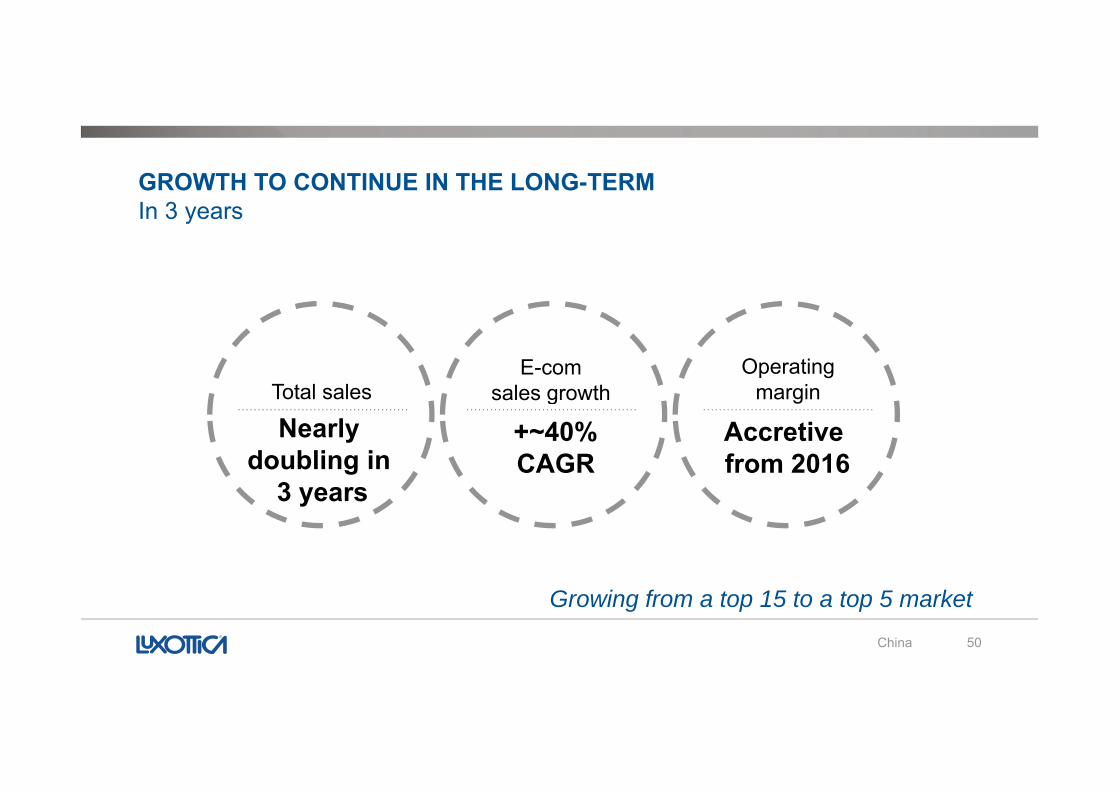
GROWTH TO CONTINUE IN THE LONG-TERMIn 3 yearsIn 3 years
Total salesE-com
sales growthOperating
marginTotal sales
Nearlydoubling in
3
sales growth
+~40%CAGR
margin
Accretivefrom 2016
3 years
China 50
Growing from a top 15 to a top 5 market

INDIAR d t t k ff
India 51
Ready to take off
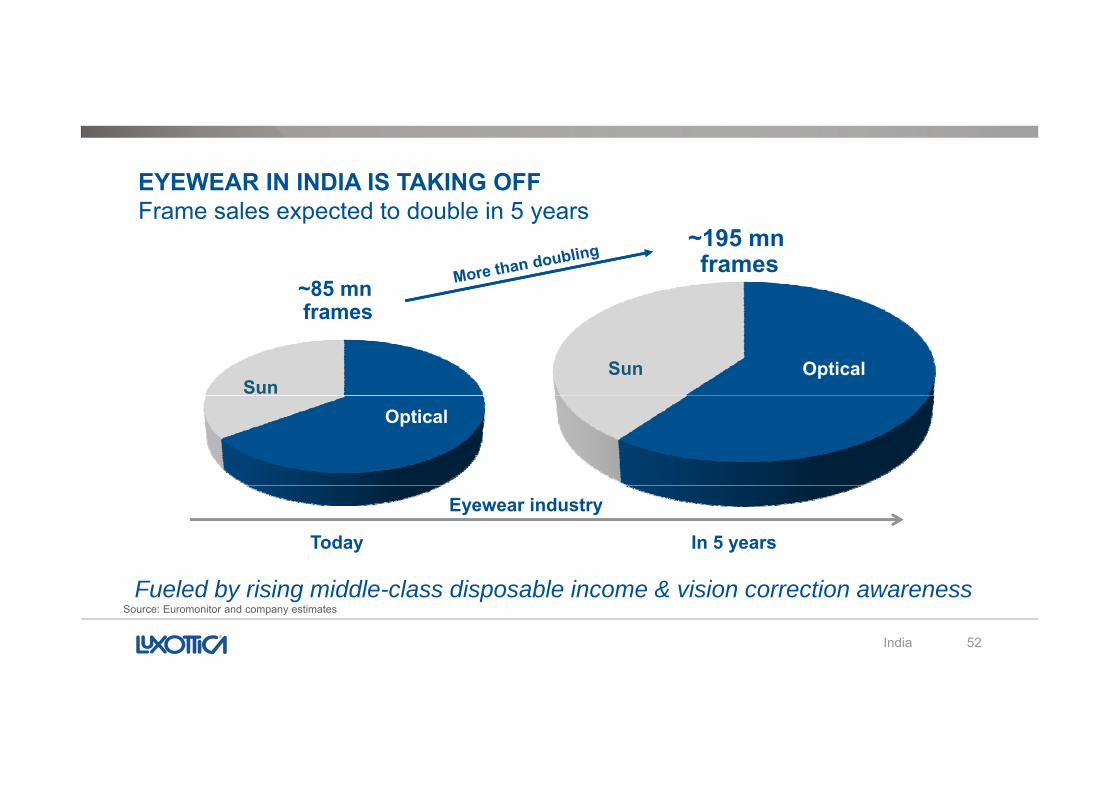
EYEWEAR IN INDIA IS TAKING OFFFrame sales expected to double in 5 yearsFrame sales expected to double in 5 years
~85 mnf~85 mnf
~195 mnframes
~195 mnframes
Sun OpticalSun
framesframes
Optical
Today In 5 years
Eyewear industry
India 52
Fueled by rising middle-class disposable income & vision correction awarenessSource: Euromonitor and company estimates
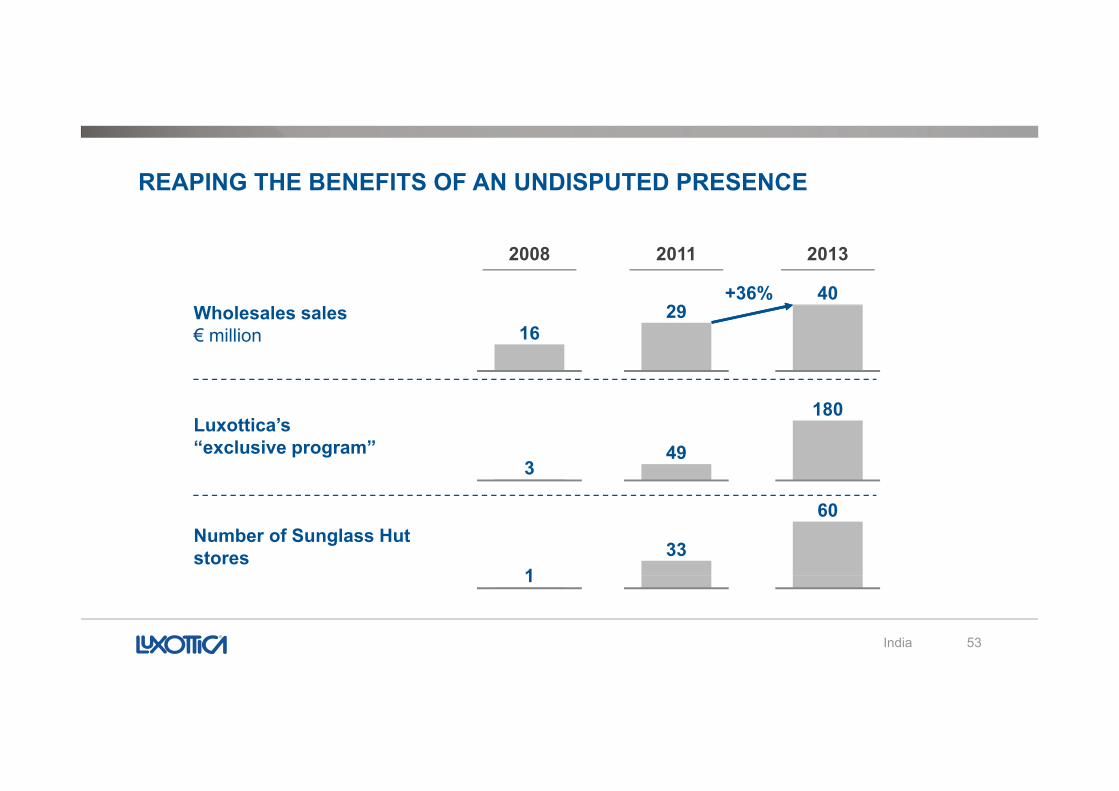
REAPING THE BENEFITS OF AN UNDISPUTED PRESENCE
2008 2011 2013
2940+36%
Wholesales sales € million 16
29
Luxottica’s “exclusive program”
349
180
Number of Sunglass Hut stores
133
60
India 53
1
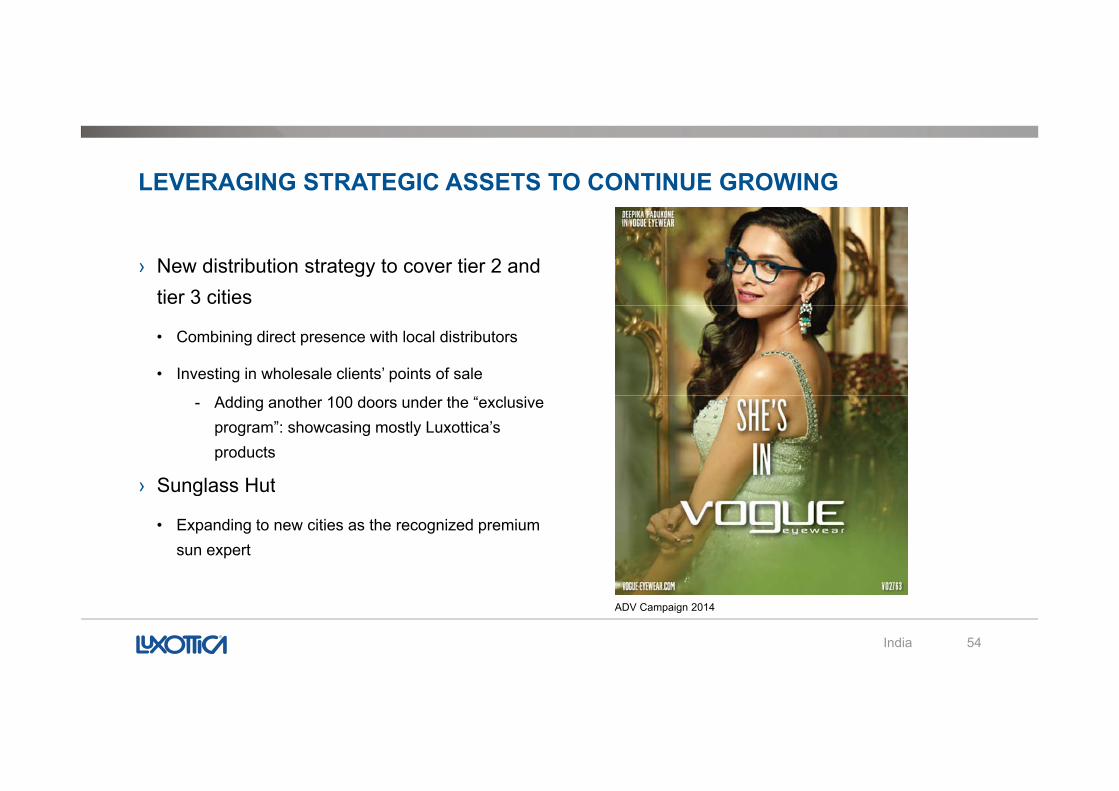
LEVERAGING STRATEGIC ASSETS TO CONTINUE GROWING
› New distribution strategy to cover tier 2 and tier 3 cities
• Combining direct presence with local distributors
• Investing in wholesale clients’ points of sale
- Adding another 100 doors under the “exclusiveprogram”: showcasing mostly Luxottica’sproducts
› Sunglass Hut› Sunglass Hut
• Expanding to new cities as the recognized premium sun expert
India 54
ADV Campaign 2014
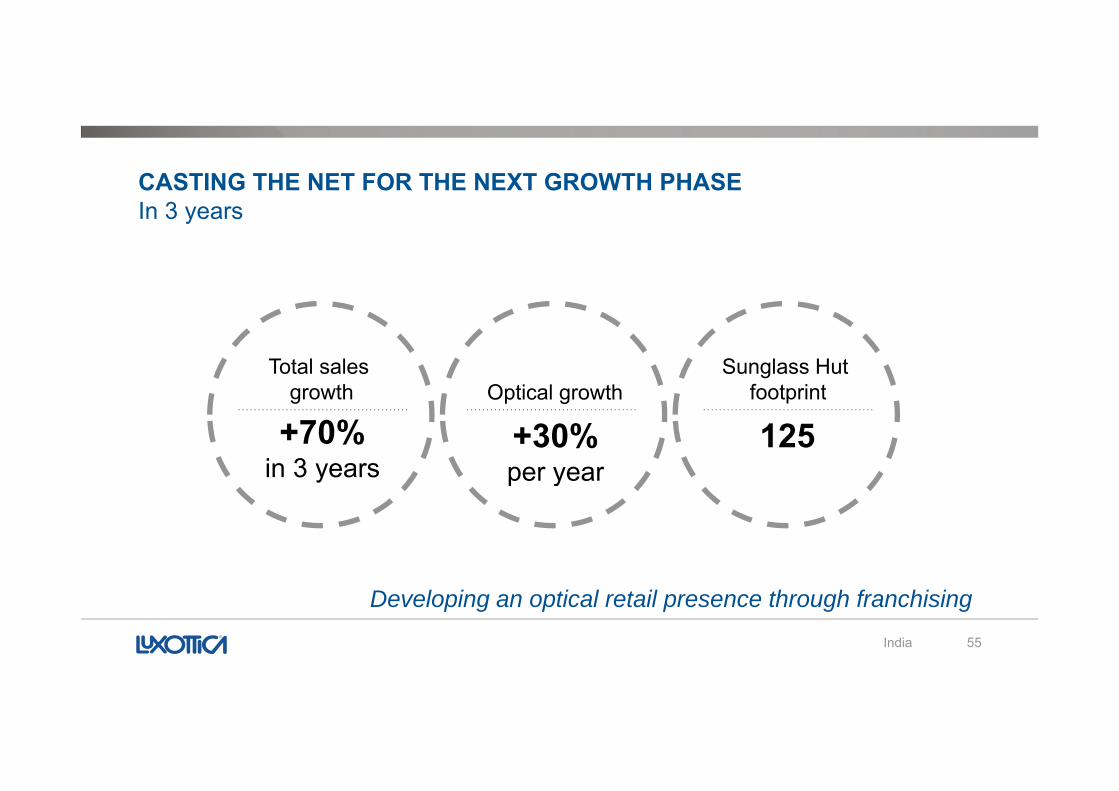
CASTING THE NET FOR THE NEXT GROWTH PHASEIn 3 yearsIn 3 years
Total sales growth Optical growth
Sunglass Hutfootprintgrowth
+70%in 3 years
Optical growth
+30%per year
footprint
125p y
India 55
Developing an optical retail presence through franchising
SOUTHEAST ASIA
Southeast Asia 56
Investing for tomorrow
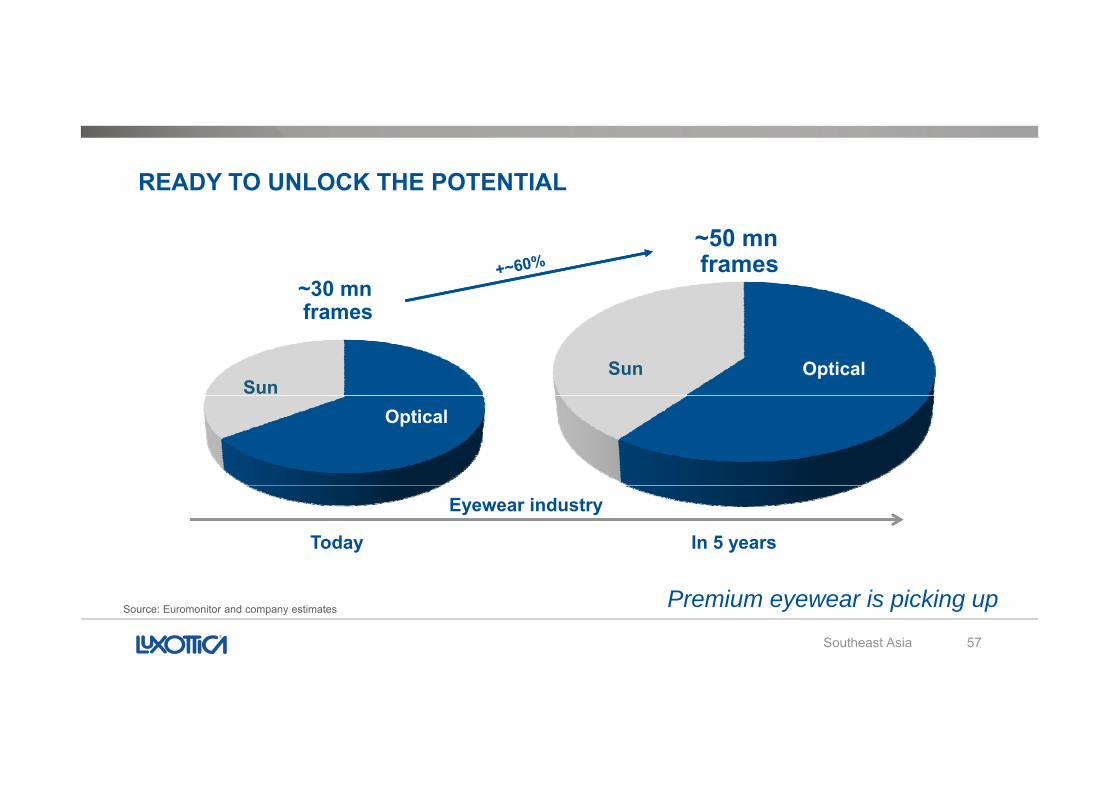
READY TO UNLOCK THE POTENTIAL
~30 mnf~30 mnf
~50 mnframes~50 mnframes
Sun OpticalSun
framesframes
Optical
Today In 5 years
Eyewear industry
Southeast Asia 57
Premium eyewear is picking upSource: Euromonitor and company estimates
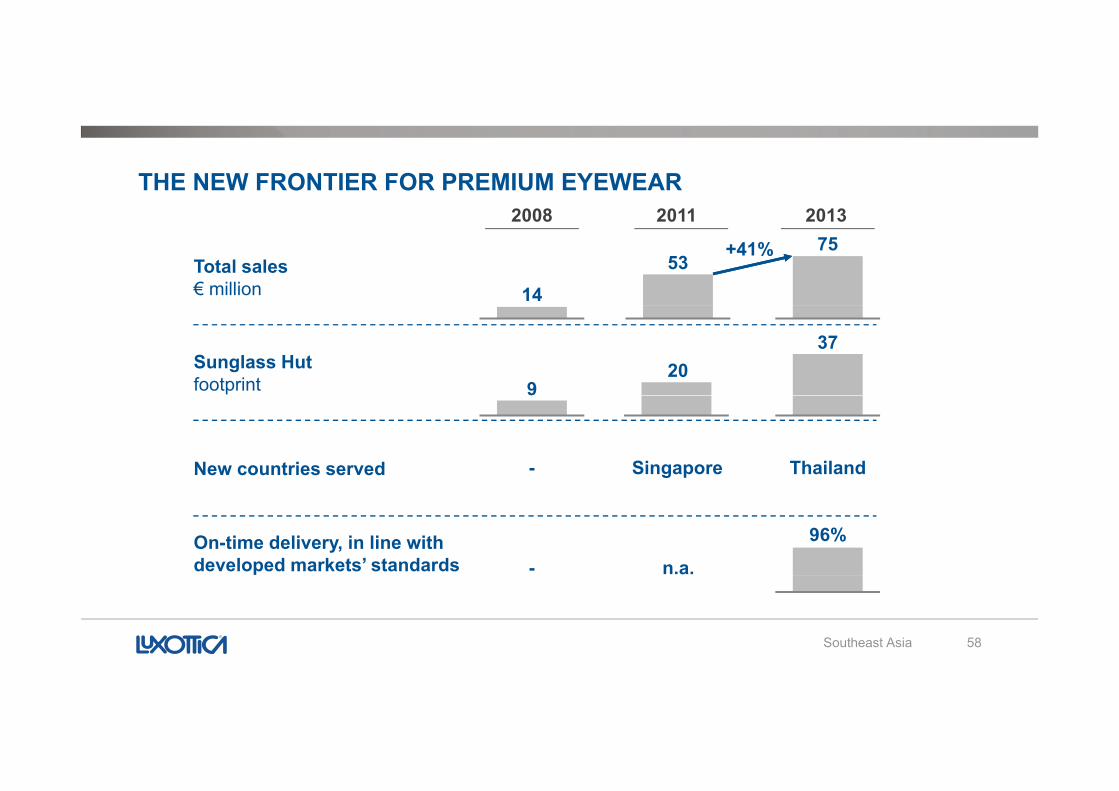
THE NEW FRONTIER FOR PREMIUM EYEWEAR2008 2011 20132008 2011 2013
Total sales € million 14
5375+41%
Sunglass Hutfootprint 9
2037
New countries served - Singapore Thailand
On-time delivery, in line with developed markets’ standards - n.a.
96%
Southeast Asia 58
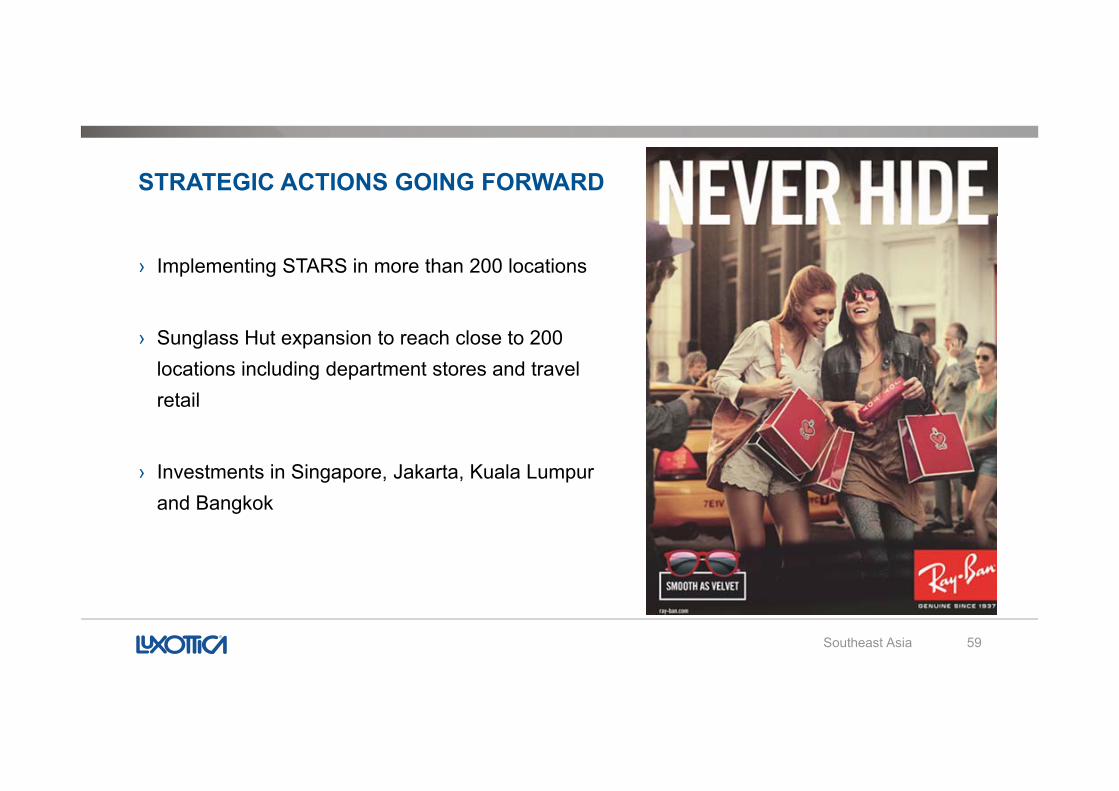
STRATEGIC ACTIONS GOING FORWARD
› Implementing STARS in more than 200 locations
› Sunglass Hut expansion to reach close to 200 locations including department stores and travel
t ilretail
› Investments in Singapore, Jakarta, Kuala Lumpur and Bangkok
Southeast Asia 59
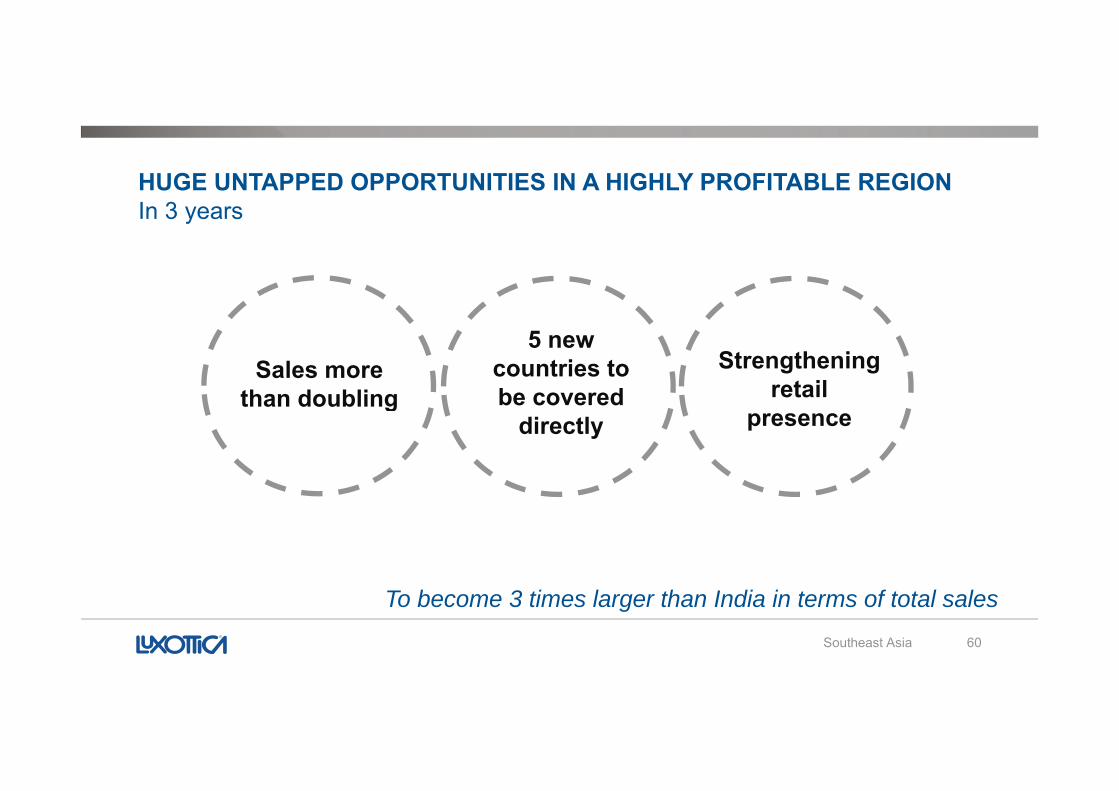
HUGE UNTAPPED OPPORTUNITIES IN A HIGHLY PROFITABLE REGIONIn 3 yearsIn 3 years
Strengthening retail
5 new countries to be covered
Sales more than doubling retail
presencebe covered
directly than doubling
Southeast Asia 60
To become 3 times larger than India in terms of total sales
2014 AND BEYOND
Delivering sustainable sales growth &
i i b l i thmargin expansion by leveraging the
i d t ’ t l d iindustry’s strong secular drivers
2014 and beyond 61
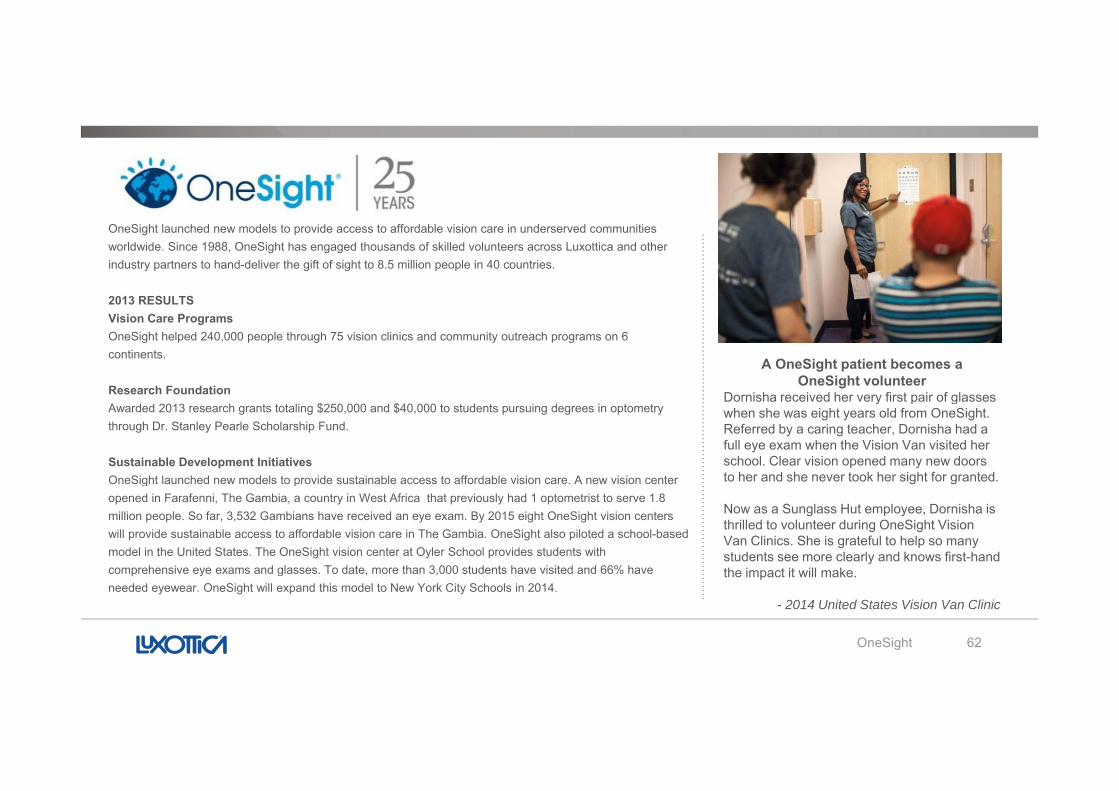
OneSight launched new models to provide access to affordable vision care in underserved communities worldwide. Since 1988, OneSight has engaged thousands of skilled volunteers across Luxottica and other industry partners to hand-deliver the gift of sight to 8.5 million people in 40 countries.
2013 RESULTS Vision Care ProgramsOneSight helped 240,000 people through 75 vision clinics and community outreach programs on 6 continents.
Research Foundation
A OneSight patient becomes a OneSight volunteer
Dornisha received her very first pair of glassesAwarded 2013 research grants totaling $250,000 and $40,000 to students pursuing degrees in optometry through Dr. Stanley Pearle Scholarship Fund.
Sustainable Development InitiativesOneSight launched new models to provide sustainable access to affordable vision care. A new vision center
Dornisha received her very first pair of glasses when she was eight years old from OneSight. Referred by a caring teacher, Dornisha had a full eye exam when the Vision Van visited her school. Clear vision opened many new doors to her and she never took her sight for granted. g p
opened in Farafenni, The Gambia, a country in West Africa that previously had 1 optometrist to serve 1.8 million people. So far, 3,532 Gambians have received an eye exam. By 2015 eight OneSight vision centers will provide sustainable access to affordable vision care in The Gambia. OneSight also piloted a school-based model in the United States. The OneSight vision center at Oyler School provides students with comprehensive eye exams and glasses. To date, more than 3,000 students have visited and 66% have
Now as a Sunglass Hut employee, Dornisha is thrilled to volunteer during OneSight Vision Van Clinics. She is grateful to help so many students see more clearly and knows first-hand the impact it will makep y g , ,
needed eyewear. OneSight will expand this model to New York City Schools in 2014. the impact it will make.
- 2014 United States Vision Van Clinic
OneSight 62
APPENDIX
63Appendix
NOTES ON THE PRESENTATION1 Fi t t t h t l l t d 3 N t d bt/EBITDA t d bt/ dj t d EBITDA t d bt› 1 Figures at constant exchange rates are calculatedusing the average exchange rates in effect during thecorresponding period of the previous year. Please referto the “Major currencies” table in the press release titled“Luxottica completes 2013 with record results” dated
› 3 Net debt/EBITDA, net debt/adjusted EBITDA, net debt,EBITDA, adjusted EBITDA, adjusted operating income,adjusted operating margin, adjusted net income,adjusted earnings per share and free cash flow are notmeasures in accordance with IAS/IFRS For additionalLuxottica completes 2013 with record results dated
February 27, 2014 available at the www.luxottica.comwebsite under the Investors tab.
› 2 Comparable store sales reflect the change in salesfrom one period to another that for comparison
measures in accordance with IAS/IFRS. For additionaldisclosure, see the press release titled “Luxotticacompletes 2013 with record results” dated February 27,2014 available at the www.luxottica.com website underthe Investors tab.from one period to another that, for comparison
purposes, includes in the calculation only stores open inthe more recent period that also were open during thecomparable prior period, and applies to both periods theaverage exchange rate for the prior period and the
› 4 Excluding non-recurring items› 5 Equals interest income minus interest expenses› 6 Excludes tax charge
7 Equals extraordinary income minus extraordinaryg g
same geographic area. Commencing 2Q12, retailcomparable store sales exclude Pearle Vision results.See “retail comparable store sales” included in thisappendix.
› 7 Equals extraordinary income minus extraordinaryexpenses
› 8 Net debt figures are calculated using the averageexchange rates used to calculate EBITDA figures
Appendix 64
NOTES ON THE PRESENTATION9› 9 All comparisons, including percentage changes, referto the three-month and twelve-month periods ended asof December 31, 2013 and December 31, 2012,respectively. Starting January 1, 2013, the Groupp y g y padopted the revised IAS 19 “Employee Benefits”standard and the Group’s results for previous periodshave been restated in accordance with new standard.As a result of an increase in employee benefits relatedAs a result of an increase in employee benefits relatedexpenses, (i) the Group’s operating income and netincome for the fourth quarter of 2012 was reduced byEuro 2.9 million and Euro 1.8 million, respectively and(ii) the Group’s operating income and net income forfiscal year 2012 declined by Euro 11.9 million and Euro7.3 million, respectively.
› 10 Excludes tax payment of €38 million
Appendix 65
› 10 Excludes tax payment of €38 million
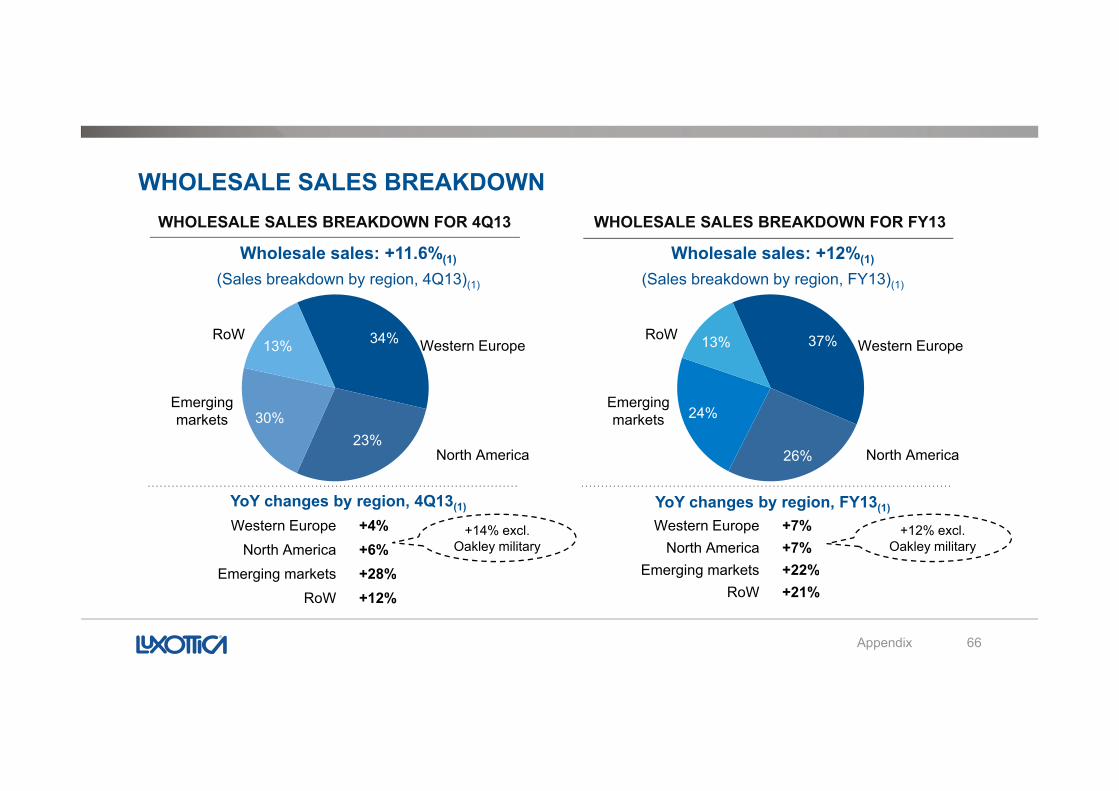
WHOLESALE SALES BREAKDOWNWHO ESA E SA ES BREAKDOWN FOR 4Q13 WHO ESA E SA ES BREAKDOWN FOR FY13
Wholesale sales: +11.6%(1)
(Sales breakdown by region, 4Q13)(1)
Wholesale sales: +12%(1)
(Sales breakdown by region, FY13)(1)
WHOLESALE SALES BREAKDOWN FOR 4Q13 WHOLESALE SALES BREAKDOWN FOR FY13
37%13%34%13%RoW
Western EuropeRoW
Western Europe
26%
24%
23%30%
North America
Emergingmarkets
North America
Emergingmarkets
YoY changes by region, 4Q13(1) YoY changes by region, FY13(1)
Western Europe +4%North America +6%
Emerging markets +28%
Western Europe +7%North America +7%
Emerging markets +22%
+12% excl. Oakley military
+14% excl. Oakley military
Appendix 66
Emerging markets +28%RoW +12%
g g %RoW +21%
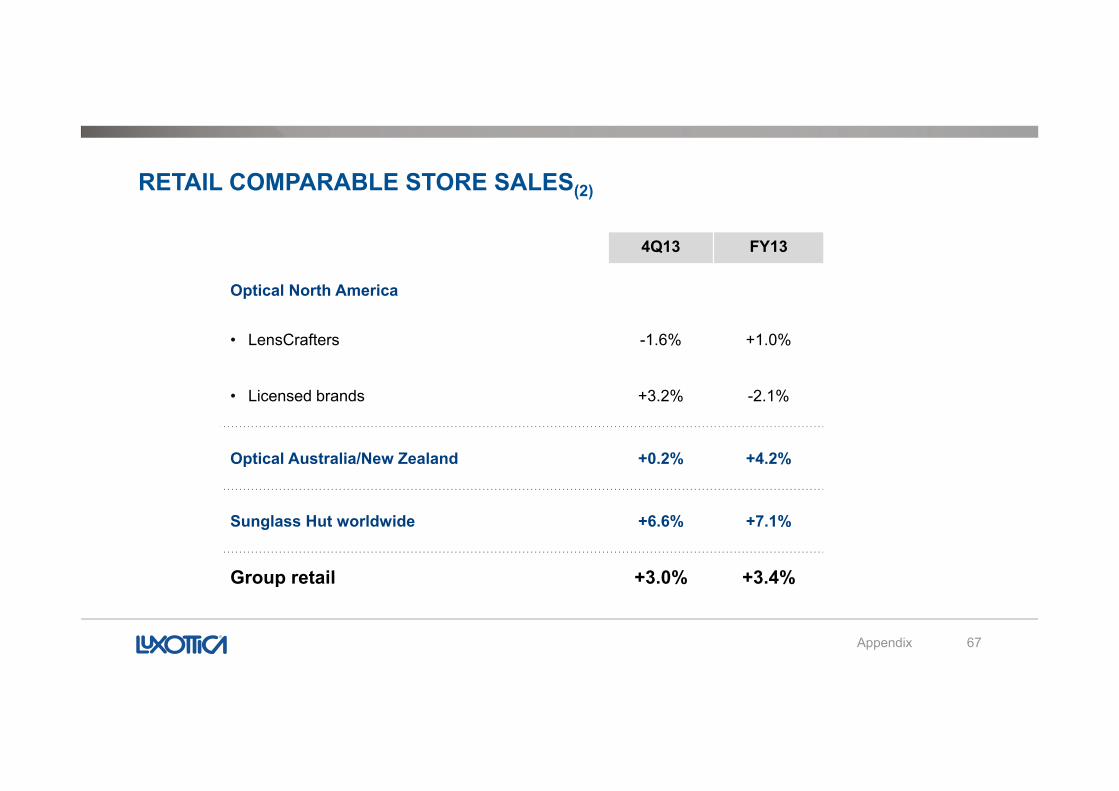
RETAIL COMPARABLE STORE SALES(2)
4Q13 FY13
Optical North America
• LensCrafters -1.6% +1.0%
• Licensed brands +3 2% 2 1%• Licensed brands +3.2% -2.1%
Optical Australia/New Zealand +0.2% +4.2%
Sunglass Hut worldwide +6.6% +7.1%
Group retail +3 0% +3 4%
Appendix 67
Group retail +3.0% +3.4%
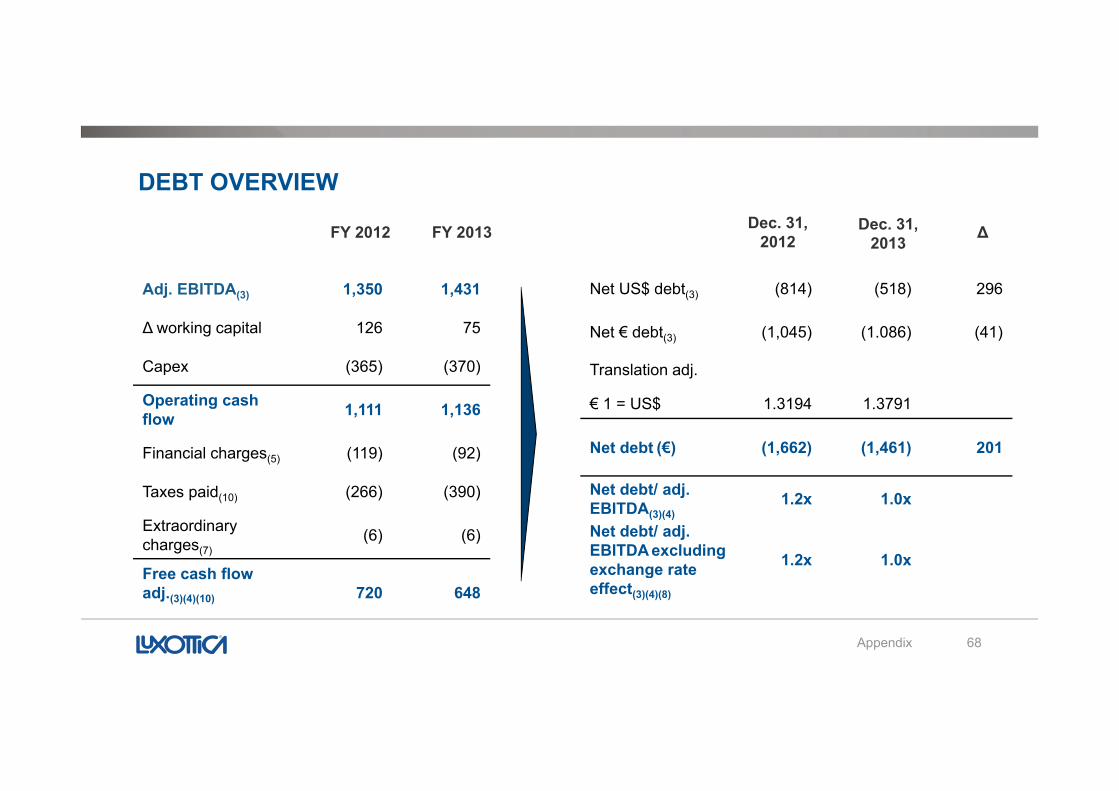
DEBT OVERVIEW
Adj. EBITDA(3) 1,350 1,431 Net US$ debt(3) (814) (518) 296
FY 2012FY 2012 FY 2013FY 2013 Dec. 31,2012
Dec. 31,2012
Dec. 31,2013
Dec. 31,2013 ∆∆
∆ working capital 126 75
Capex (365) (370)
O ti h
Net € debt(3) (1,045) (1.086) (41)
Translation adj.
Operating cashflow 1,111 1,136
Financial charges(5) (119) (92)
€ 1 = US$ 1.3194 1.3791
Net debt (€) (1,662) (1,461) 201
N t d bt/ djTaxes paid(10) (266) (390)
Extraordinarycharges(7)
(6) (6)
Free cash flow
Net debt/ adj. EBITDA(3)(4)
1.2x 1.0x
Net debt/ adj. EBITDA excludingexchange rate 1.2x 1.0x
Appendix 68
Free cash flow adj.(3)(4)(10) 720 648
geffect(3)(4)(8)
INVESTOR RELATIONS TEAM
Alessandra SeniciTel. +39 (02) 8633 - 4662 [email protected]
Upcoming events
› April 29 – AGM and 1Q 2014 results
› July 24 – 2Q 2014 results
Nicoletta RussoTel. +39 (02) 8633 - [email protected]
Elena Dimichino
› October 29 – 3Q 2014 results
http://www.luxottica.com/en/company/investors/financial-calendar
Elena DimichinoTel. +39 (02) 8633 - 4038 [email protected]
Elisa CattaruzzaTel. +39 (02) 8633 - 4870 [email protected]
www.luxottica.com
Contacts 69
SOCIAL MEDIA CONTACTS
http://www.luxottica.com pinterest.com/Luxotticagroup
@Luxottica
Like our LuxotticaGroup page
instagram.com\Luxotticagroup
slideshare.net\LuxotticaGroup
youtube.com/luxotticagroup
LinkedIn.com/company/Luxottica_Group
Contacts 70