luxottica group: net sales up 4.2%...leader in the design, manufacture, distribution and sale of...
TRANSCRIPT

Luxottica Group: net sales up 4.2%
and reported net profit up 18% in first half of 20171
The ongoing strategic renewal supports the quality of sales and profits • Luxottica Group’s net sales increased to Euro 4,917 million (+4.2% at current exchange rates and
+1.8% at constant exchange rates2) • Operating income:
- adjusted3,5: increased to Euro 899 million (+4.9% at current exchange rates and +1.9% at constant exchange rates2) and operating margin to 18.3%, up 10 basis points
- reported: increased to Euro 868 million (+10.1% at current exchange rates and +6.9% at constant exchange rates2) and operating margin to 17.6%, up 90 basis points
• Net income: - adjusted3,5: increased to Euro 567 million (+6.7% at current exchange rates and +3.5% at
constant exchange rates2) and net margin to 11.5% - reported: increased to Euro 562 million (+18.1% at current exchange rates and +14.7% at
constant exchange rates2) and net margin to 11.4% • Free cash flow3 generation increased to Euro 535 million • Outlook confirmed for 2017
Milan (Italy), July 24, 2017 – The Board of Directors of Luxottica Group S.p.A. (MTA: LUX), a leader in the design, manufacture, distribution and sale of fashion, luxury and sports eyewear, met today to review the consolidated net sales for the second quarter and preliminary results for the six months ended June 30, 2017, in accordance with International Financial Reporting Standards (IFRS) as issued by the International Accounting Standards Board. Preliminary reported results for the first half 20171
(Millions of Euro) 1H 2016 1H 2017 Change at current exchange rates
Change at constant exchange rates2
Group net sales 4,719 4,917 +4.2% +1.8% Wholesale division 1,970 1,981 +0.5% -1.2%
Retail division 2,749 2,937 +6.8% +4.0%
Adjusted3,5 operating income 857 899 +4.9% +1.9% Reported operating income 788 868 +10.1% +6.9% Adjusted3,5 net income attributable to Luxottica stockholders 532 567 +6.7% +3.5%
Reported net income attributable to Luxottica stockholders 476 562 +18.1% +14.7%
Adjusted3,5 earnings per share 1.11 1.19 +7.3% +4.1% Adj.3,5 earnings per share in US$ 1.23 1.29 +4.1% +4.1%
1

Net sales for the second quarter 20171 (Millions of Euro) 2Q 2016 2Q 2017 Change at current
exchange rates Change at constant
exchange rates2
Group net sales 2,454 2,533 +3.2% +1.8% Wholesale division 1,036 1,022 -1.3% -2.4%
Retail division 1,418 1,511 +6.6% +4.8% Luxottica's net sales grew by 4.2% (+1.8% at constant exchange rates2) in the first half of 2017, with sustained profitability for both divisions and record free cash flow3 generation. The Group’s performance in the first six months is the result of its profound transformation and a strategic renewal aimed at promoting consistency and transparency in commercial policies, a more direct relationship with consumers, and an extensive digitization of the business. Early results of this strategy are visible and laying the foundation for future developments. In the first six months, the Group continued to invest in improving its sales quality and a renewed focus on consumers and its brands’ positioning. Initiatives include the launch of successful new collections and the debut of Ray-Ban ophthalmic lenses, the reduction of discounts across all sales channels, and key collaborations such as Ray-Ban with Ferrari, Gigi Hadid for Vogue Eyewear and Oakley with Dorna for the Italian Grand Prix at Mugello. New stores, a favorable price mix and cost discipline positively contributed to the results of the period. In the first six months of the year, the Wholesale division recorded sales in line with the previous year (+0.5% at current exchange rates, -1.2% at constant exchange rates2). Europe and Latin America were strong contributors and North America saw a return to growth in the second quarter, despite the residual impact of the "MAP policy" (Minimum Advertised Price). The segment was also affected by business decisions undertaken in Asia-Pacific and in particular in China, where the Group has completed the restructuring of its distribution strategy in the second quarter, focusing almost exclusively on direct and digital channels to better combat counterfeiting and parallel markets. The Retail division, with sales up 6.8% (+4.0% at constant exchange rates2), benefited from the Group's new strategy focusing on service quality and brand equity, including a strong reduction of in-store promotions and discounts. New stores, optical retail results in all geographies, Ray-Ban stores in China and the consolidation of Salmoiraghi & Viganò in Europe contributed to the positive performance in the period. In addition, Sunglass Hut posted a +1%2 growth in sales in the second quarter, despite a reduction in store count designed to improve geographic allocation and promote store productivity. In North America, the Group’s focus on in-store execution, quality of service, and omnichannel experiences began to pay off with improved comparable store sales4 and profitability in all retail brands. Innovation drove the growth of proprietary e-commerce platforms (+6% in sales at constant exchange rates2) and in particular of Ray-Ban.com, a symbol of excellence for the world's eyewear industry, with new user experiences, improved customization and service levels, an evolution of its Virtual Try-on technology and the launch of exclusive collections online.
2

"We are very pleased with the results of the first six months. The new strategies and the reorganization of the Group are already producing expected results: increased sales, accelerating profitability and strong cash generation", Leonardo Del Vecchio, Executive Chairman, and Massimo Vian, CEO for Products and Operations of Luxottica Group, stated. "We have abandoned any promotional approach by bringing the product and service quality, brand and purchasing experience to the core of our offer. It's an investment that we made in the future of our retail and eyewear brands as well as the whole industry. Luxottica is becoming a fully digital company, able to develop in-house technologies and state-of-the-art solutions in the eyewear market. The feedback we have received so far from our consumers and customers is full of enthusiasm and appreciation.” "We continue to innovate our business models. The great work we are doing in North America and on our stores, the courage to redesign distribution in China, where we have declared war on the parallel market, and our investment to launch new Ray-Ban ophthalmic lenses all confirm the Group's commitment to innovation, quality and customer satisfaction as our path to growth. In light of the results of the first six months, we confirm the outlook for 2017." Group’s performance in the first half of 20171
In the first six months of 2017, the Group’s net sales rose by 4.2% (+1.8% at constant exchange rates2). Both divisions contributed to the positive performance of the period, despite the implementation of stricter commercial policies in North America and China and reducing discounts in all sales channels. The Group's e-commerce results were solid in the first half of the year, with revenues increasing by 6% at constant exchange rates2. In the second quarter, sales grew by 3.2% (+1.8% at constant exchange rates2), with the Wholesale division’s net sales down by -1.3% (-2.4% at constant exchange rates2), mainly due to the reclassification of Salmoiraghi & Viganò sales from wholesale to retail, and the Retail division’s net sales up 6.6% (+4.8% at constant exchange rates2). The Group's operating income grew on an adjusted basis3.5 by 4.9% to Euro 899 million in the first half of the year (+10.1% to Euro 868 million on a reported basis), with an operating margin of 18.3%, up 10 basis points. On a reported basis, operating margin was 17.6%, up by 90 basis points. Considering the two divisions, the adjusted3,5 operating margin grew by 50 basis points in both divisions, up to 29.2% in Wholesale and 14.5% in Retail. The organizational simplification and restructuring of certain business areas resulted in extraordinary costs of approximately Euro 31 million5 for the first half of the year at operating income level. The adjusted3,5 net income of the Group in the first half of 2017 grew by 6.7% to Euro 567 million (+18.1% to Euro 562 million on a reported basis), corresponding to an adjusted3,5 EPS (earnings per share) of Euro 1.19 (US$ 1.29 at the average exchange rate of €/US$ of 1.0830).
3

In the first half of the year, cash generation3 reached a record level of Euro 535 million. Net debt3 as of June 30, 2017 was Euro 1,113 million, down 1.2% compared to the same period last year, with a net debt/adjusted3,5 EBITDA ratio of 0.5x. Geographic segments: net sales and trends Net sales (Millions of Euro)
1H 2016 % 1H 2017 % Change at current exchange rates
Change at constant exchange rates2
North America 2,743 58% 2,796 57% +1.9% -1.0%
Wholesale 559 12% 578 12% +3.5% +0.5%
Retail 2,184 46% 2,218 45% +1.5% -1.4%
Europe 1,014 21% 1,145 23% +13.0% +14.9%
Asia-Pacific 608 13% 595 12% -2.1% -5.6%
Latin America 253 5% 288 6% +13.5% +4.6%
Rest of the world 101 3% 93 2% -8.3% -13.4%
Group’s total 4,719 100% 4,917 100% +4.2% +1.8%
1H 2016 sales breakdown has been revised to reflect a market reclassification for the travel retail business
Net sales (Millions of Euro)
2Q 2016 % 2Q 2017 % Change at current exchange rates
Change at constant exchange rates2
North America 1,389 57% 1,427 56% +2.7% +0.4%
Wholesale 270 11% 289 11% +6.8% +4.6%
Retail 1,118 46% 1,138 45% +1.8% -0.6%
Europe 566 23% 628 25% +11.0% +12.9%
Asia-Pacific 319 13% 289 11% -9.5% -11.1%
Latin America 130 5% 142 6% +9.6% +3.8%
Rest of the world 50 2% 47 2% -5.7% -10.0%
Group’s total 2,454 100% 2,533 100% +3.2% +1.8%
2Q 2016 sales breakdown has been revised to reflect a market reclassification for the travel retail business North America In North America, the Group's net sales in the first half rose by 1.9% (-1.0% at constant exchange rates2), with a return to growth in the second quarter due to its distribution discipline and the strong performance of its brand portfolio. The wholesale business, with sales up 3.5% (+0.5% at constant exchange rates2), was driven by sales to independent opticians and key accounts that have more than offset the weakness of the department store and sports channels. The MAP policy continues to have an impact on sales to online operators, but over the course of the year it has resulted in a sharp reduction in the average discount applied by third-party e-commerce platforms and supported the growth of the optical business.
4

The Retail division, up 1.5% (-1.4% at constant exchange rates2), has begun to reap the benefits of a transformed operating model, aimed at improving in-store execution and the quality of the consumer experience. At LensCrafters, in particular, new training and incentive tools for the sales staff, the new store-showroom format and an offer of more digital and personalized lenses are the cornerstones of the new strategy of transformation and growth of the retail brand. The reshaping of the retail network and the strong reduction of promotional activities weighed on Sunglass Hut's results over the period. While comparable store sales4 for both LensCrafters and Sunglass Hut were negative in the first half, both showed an improvement in the second quarter. Europe In the first half of the year, Europe continued to be a bright spot for the Group with sales increasing by 13.0% (+14.9% at constant exchange rates2) and experienced solid growth even when excluding Salmoiraghi & Viganò’s contribution. The region's growth was driven by Germany, Italy, Spain, Portugal and Eastern Europe, thanks to the success of the latest spring-summer collections and the continuous improvement of service levels. The Retail Division benefited from the consolidation of approximately 430 Salmoiraghi & Viganò stores in Italy and Sunglass Hut's growth thanks to the good start of the sun season and the contribution of 50 new stores. Asia-Pacific The performance in Asia-Pacific, even if not positive as a whole (-2.1% at current exchange rates, -5.6% at exchange rates2 in the first half), is the result of a series of commercial decisions designed to propel future growth in an area of the world that is increasingly key to the Company’s business strategies. Particularly in China during the second quarter, the radical revision of the distribution model was completed and almost exclusively refocused on direct sales to the final consumer. The positive effects of this action are already visible in the retail and online business which is strongly growing also due to the success of over 70 Ray-Ban stores in China. These results do not yet wholly compensate for the decline in net sales from the termination of business relationships with numerous wholesale customers. In other key geographies, Japan was positive, Korea was still affected by the contraction of Chinese tourism and India was impacted by a new goods and services tax. In Australia, the business continued to grow driven by optical retail and despite the decline in sales of Sunglass Hut. This decline was primarily due to the reduction of in-store promotional activities. Latin America Latin America continued to grow in the first half of the year with a 13.5% increase in sales (+4.6% at constant exchange rates2), with the positive contribution of all countries. Brazil benefited from the favorable trend in exchange rates, with net sales in the first half slightly lower than last year at constant exchange rates2. At the beginning of July, Luxottica completed the acquisition of Óticas Carol, entering into the Brazilian optical retail market and confirming the Group’s growth strategy in the country.
5
Mexico, one of the most vital markets for the Group, maintained its double digit growth trend, also thanks to the strong contribution of Sunglass Hut, which reported solid comparable store sales4 growth and the further expansion of its retail network to over 200 stores. GMO’s net sales continued to grow and the first Ray-Ban concept store in Chile was successfully tested.
§ Results for the first half 2017 will be available via audio webcast on Monday, July 24, 2017 at 12:30PM EDT (5:30PM BST, 6:30PM CEST). The audio webcast will be available to the financial community and the media from Luxottica Group’s corporate website at http://www.luxottica.com/en/investors/results-and-presentations/webcasts. The presentation will be available for download from Luxottica Group’s Investor Relations website at http://www.luxottica.com/en/investors/results-and-presentations shortly before the start of the audio webcast. The officer responsible for preparing the Company’s financial reports, Stefano Grassi, declares, pursuant to Article 154-bis, Section 2 of the Consolidated Law on Finance, that the accounting information contained in this press release is consistent with the data in the supporting documents, books of accounts and other accounting records. Contacts Alessandra Senici Group Investor Relations and Corporate Communications Director Tel.: +39 (02) 8633 4870 Email: [email protected] http://www.luxottica.com/en/investors/contacts
Marco Catalani Group Corporate Media Relations Senior Manager Tel.: +39 (02) 8633 4470 Email: [email protected] Notes to the press release 1 Comparisons, including percentage changes, are between the three and six-month periods ended June 30, 2017 and 2016. 2 Figures at constant exchange rates have been calculated using the average exchange rates in effect for the corresponding period in the previous year. For further information, please refer to the attached tables. 3 Adjusted data, EBITDA, EBITDA margin, free cash flow and net debt are not measures in accordance with IFRS. For further information, please refer to the attached tables. 4 “Comps” or “Comparable store sales” reflect the change in sales from one period to another that, for comparison purposes, includes in the calculation only stores open in the more recent period that also were open during the comparable prior period, and applies to both periods the average exchange rate for the prior period and the same geographic area.
6

5 The adjusted data for the six-month period ended June 30, 2017 take into account: (i) restructuring and reorganization costs of Euro 22.9 million (Euro 15.8 million net of taxes and Euro 0.03 impact on EPS), (ii) non-recurring expenses of Euro 38.6 million (Euro 24.5 million net of taxes and Euro 0.05 impact on EPS) related to the early repayment of financial liabilities for Euro 30.8 million (Euro 19.0 million net of taxes) and the pending combination with Essilor for Euro 7.9 million (Euro 5.5 million net of taxes), and (iii) non-recurring income of Euro 48.7 Million (Euro 34.9 net of taxes and Euro -0.07 impact on EPS) related to a gain on the sales of a building owned by the Group. The combined effect of (i), (ii) and (iii) for the six-month period ended June 30, 2017, was extraordinary costs of approximately Euro 31 million at operating income level, Euro 12.9 million at an income before provision for income taxes level, and Euro 5.4 million at net income level. The adjusted data for the six-month period ended June 30, 2016 take into account: (i) restructuring and reorganization costs of Euro 24.7 million (Euro 16.4 million net of taxes and Euro 0.03 impact on EPS), and (ii) non-recurring expenses of Euro 43.9 million (Euro 39.4 million net of taxes and Euro 0.08 impact on EPS) related to the departure of Adil Mehboob-Khan as CEO for markets, the Oakley integration and an accrual for a litigation matter. Luxottica Group S.p.A. Luxottica is a leader in the design, manufacture and distribution of fashion, luxury and sports eyewear. Its portfolio includes proprietary brands such as Ray-Ban, Oakley, Vogue Eyewear, Persol, Oliver Peoples and Alain Mikli, as well as licensed brands including Giorgio Armani, Burberry, Bulgari, Chanel, Coach, Dolce&Gabbana, Ferrari, Michael Kors, Prada, Ralph Lauren, Tiffany & Co., Valentino and Versace. The Group’s global wholesale distribution network covers more than 150 countries and is complemented by an extensive retail network of approximately 9,000 stores, with LensCrafters and Pearle Vision in North America, OPSM and LensCrafters in Asia-Pacific, GMO and Óticas Carol in Latin America, Salmoiraghi & Viganò in Italy and Sunglass Hut worldwide. In 2016, with more than 80,000 employees, Luxottica posted net sales of over Euro 9 billion. Additional information on the Group is available at www.luxottica.com. Forward-looking statements This press release includes forward-looking statements, including forward-looking statements within the meaning of the Private Securities Litigation Reform Act of 1995. These forward-looking statements include, but are not limited to, statements regarding the proposed business combination between Essilor and Luxottica (including the benefits, results, effects and timing of a transaction), all statements regarding Luxottica’s (and Essilor’s and Luxottica’s combined) expected future financial position, results of operations, cash flows, dividends, financing plans, business strategy, budgets, capital expenditures, competitive positions, growth opportunities, plans and objectives of management, and statements containing the words such as “anticipate,” “approximate,” “believe,” “plan,” “estimate,” “expect,” “project,” “could,” “would,” “should,” “will,” “intend,” “may,” “potential,” “upside,” and other similar expressions. Statements in this press release concerning the business outlook or future economic performance, anticipated profitability, revenues, expenses, dividends or other financial items, and product or services line growth of Luxottica (and the combined businesses of Essilor and Luxottica), together with other statements that are not historical facts, are forward-looking statements that are estimates reflecting the best judgment of Luxottica based upon currently available information. Such forward-looking statements are inherently uncertain, and stockholders and other potential investors must recognize that actual results may differ materially from Luxottica’s expectations as a result of a variety of factors. Such forward-looking statements are based upon management’s current expectations and are subject to a significant business, economic and competitive risks, uncertainties and contingencies, many of which are unknown and many of which Luxottica is unable to predict or control. Such factors may cause Luxottica’s actual results, performance or plans, or results, performance or plans with respect to the combined Essilor and Luxottica group, to differ materially from any future results, performance or plans expressed or implied by such forward-looking statements. These risks and uncertainties include, but are not limited to, the risk factors discussed or identified in public filings that have been, or will be, made by Essilor or Luxottica from time to time. Luxottica cautions investors that any forward-looking statements made by Luxottica are not guarantees of future performance. Luxottica disclaims any obligation to update any such factors or to announce publicly the results of any revisions to any of the forward-looking statements to reflect future events or developments. Important information This press release does not constitute or form a part of any offer or solicitation to purchase or subscribe for securities in the United States or any other jurisdiction. Securities may not be offered or sold in the United States unless they have been registered under the U.S. Securities Act of 1933, as amended (the “Securities Act”), or are exempt from registration. The securities that may be offered in any transaction have not been and will not be registered under the Securities Act and it is not intended that any public offering of any such securities will be made in the United States.
7

This press release is only being distributed to and is only directed at (i) persons who are outside the United Kingdom or (ii) investment professionals falling within Article 19(5) of the Financial Services and Markets Act 2000 (Financial Promotion) Order 2005 (the “Order”) or (iii) high net worth companies, and other persons to whom it may lawfully be communicated, falling within Article 49(2)(a) to (d) of the Order (all such persons together being referred to as “relevant persons”). The securities which are referred to herein are only available to, and any invitation, offer or agreement to subscribe, purchase or otherwise acquire such securities will be engaged in only with, relevant persons. Any person who is not a relevant person should not act or rely on this document or any of its contents.
- APPENDIX FOLLOWS –
Retail comparable store sales4 2Q 2017 1H 2017
Optical North America
LensCrafters -1.2% -2.1%
Licensed Brands -1.2% -2.9%
Australia/New Zealand +0.5% +2.4%
Sunglass Hut worldwide -1.4% -3.1%
Group’s Retail -1.7% -2.5% Figures at constant exchange rates are calculated using the average exchange rate of the respective comparative period. For more information, please refer to the table below.
8
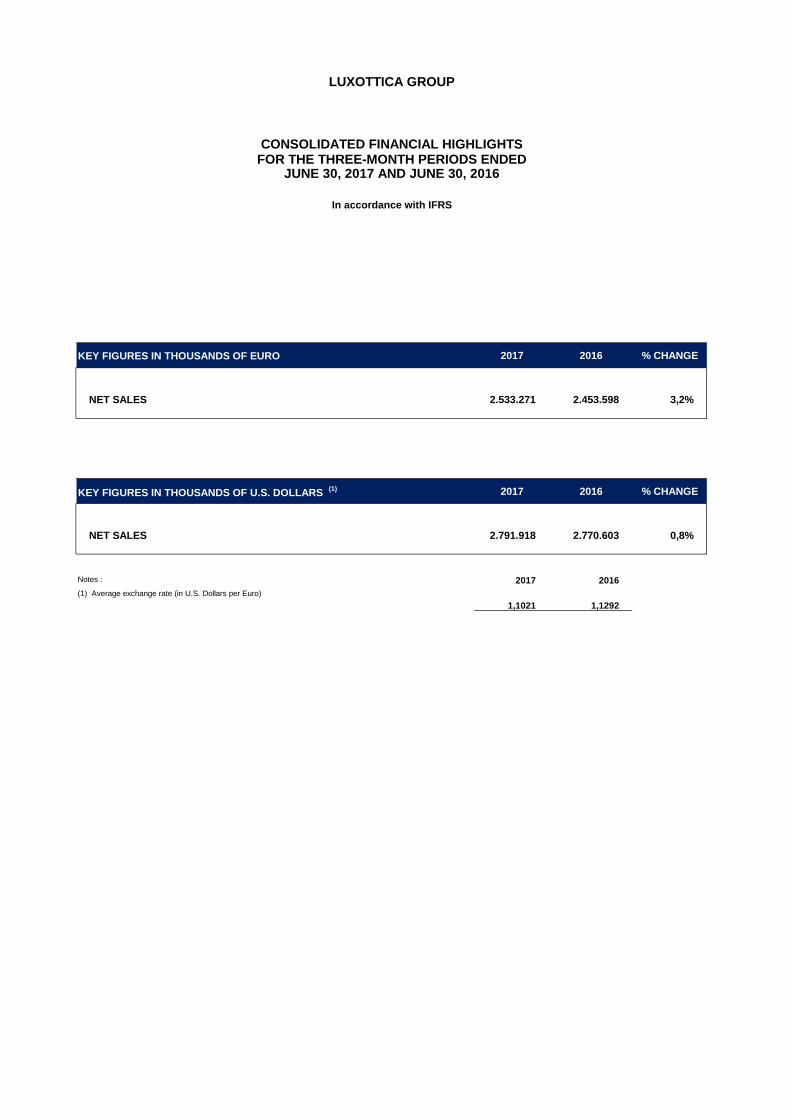
KEY FIGURES IN THOUSANDS OF EURO 2017 2016 % CHANGE
NET SALES 2.533.271 2.453.598 3,2%
KEY FIGURES IN THOUSANDS OF U.S. DOLLARS (1) 2017 2016 % CHANGE
NET SALES 2.791.918 2.770.603 0,8%
Notes : 2017 2016(1) Average exchange rate (in U.S. Dollars per Euro)
1,1021 1,1292
LUXOTTICA GROUP
CONSOLIDATED FINANCIAL HIGHLIGHTSFOR THE THREE-MONTH PERIODS ENDED
JUNE 30, 2017 AND JUNE 30, 2016
In accordance with IFRS
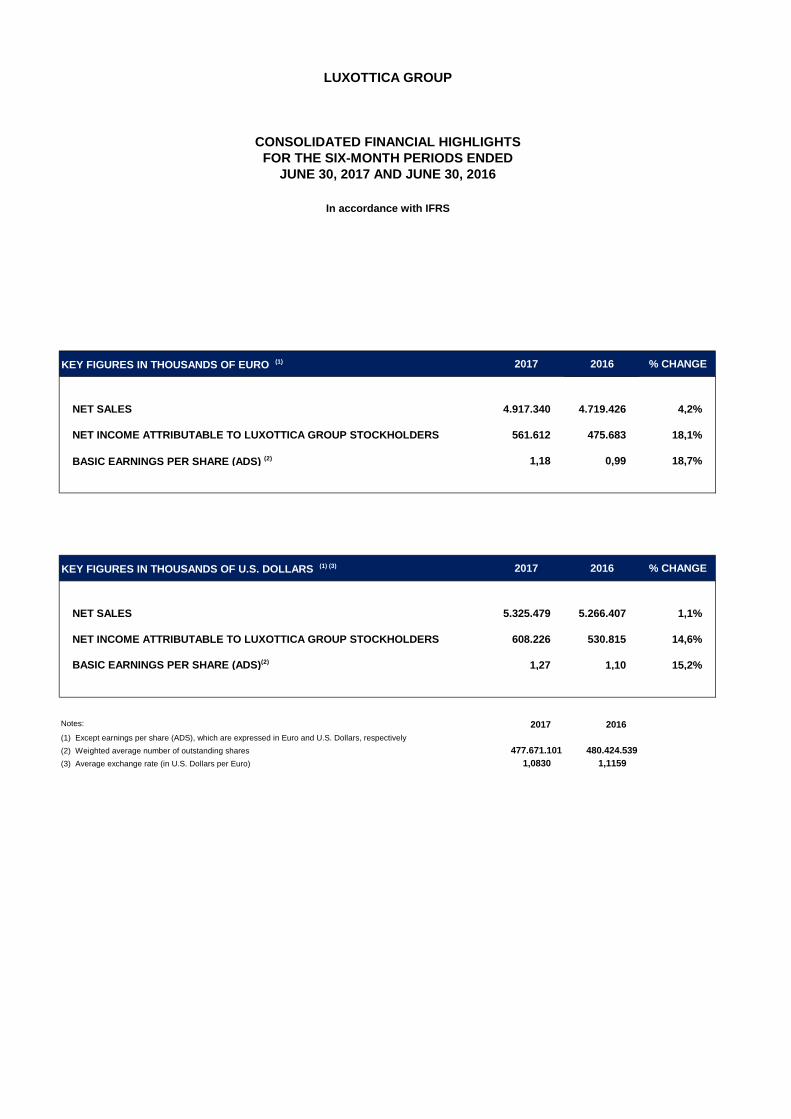
KEY FIGURES IN THOUSANDS OF EURO (1) 2017 2016 % CHANGE
NET SALES 4.917.340 4.719.426 4,2%
NET INCOME ATTRIBUTABLE TO LUXOTTICA GROUP STOCKHOLDERS 561.612 475.683 18,1%
BASIC EARNINGS PER SHARE (ADS) (2) 1,18 0,99 18,7%
KEY FIGURES IN THOUSANDS OF U.S. DOLLARS (1) (3) 2017 2016 % CHANGE
NET SALES 5.325.479 5.266.407 1,1%
NET INCOME ATTRIBUTABLE TO LUXOTTICA GROUP STOCKHOLDERS 608.226 530.815 14,6%
BASIC EARNINGS PER SHARE (ADS)(2) 1,27 1,10 15,2%
Notes: 2017 2016(1) Except earnings per share (ADS), which are expressed in Euro and U.S. Dollars, respectively (2) Weighted average number of outstanding shares 477.671.101 480.424.539(3) Average exchange rate (in U.S. Dollars per Euro) 1,0830 1,1159
LUXOTTICA GROUP
In accordance with IFRS
CONSOLIDATED FINANCIAL HIGHLIGHTSFOR THE SIX-MONTH PERIODS ENDED
JUNE 30, 2017 AND JUNE 30, 2016

KEY FIGURES IN THOUSANDS OF EURO (1) 2017 % OF SALES 2016 % OF
SALES % CHANGE
NET SALES 4.917.340 100,0% 4.719.426 100,0% 4,2%COST OF SALES (1.716.191) (1.620.578)
GROSS PROFIT 3.201.149 65,1% 3.098.848 65,7% 3,3%
OPERATING EXPENSES:SELLING EXPENSES (1.549.506) (1.428.173)ROYALTIES (89.126) (88.585)ADVERTISING EXPENSES (252.099) (282.850)GENERAL AND ADMINISTRATIVE EXPENSES (442.523) (511.165)
TOTAL (2.333.255) (2.310.773)
OPERATING INCOME 867.894 17,6% 788.076 16,7% 10,1%
OTHER INCOME (EXPENSE):INTEREST INCOME 8.458 6.207INTEREST EXPENSES (70.746) (39.163)OTHER - NET 45.524 2.526
OTHER INCOME (EXPENSES)-NET (16.763) (30.430)
INCOME BEFORE PROVISION FOR INCOME TAXES 851.131 17,3% 757.646 16,1% 12,3%PROVISION FOR INCOME TAXES (288.060) (280.621)
NET INCOME 563.071 11,5% 477.024 10,1% 18,0%OF WHICH ATTRIBUTABLE TO:- LUXOTTICA GROUP STOCKHOLDERS 561.612 11,4% 475.683 10,1% 18,1%- NON-CONTROLLING INTERESTS 1.459 0,0% 1.341 0,0%
NET INCOME 563.071 11,5% 477.024 10,1% 18,0%
BASIC EARNINGS PER SHARE (ADS): 1,18 0,99
FULLY DILUTED EARNINGS PER SHARE (ADS): 1,17 0,99
WEIGHTED AVERAGE NUMBER OF OUTSTANDING SHARES 477.671.101 480.424.539
FULLY DILUTED AVERAGE NUMBER OF SHARES 478.130.884 481.377.070
Notes:(1) Except earnings per share (ADS), which are expressed in Euro
LUXOTTICA GROUP
FOR THE SIX-MONTH PERIODS ENDEDJUNE 30, 2017 AND JUNE 30, 2016
CONSOLIDATED INCOME STATEMENT
In accordance with IFRS
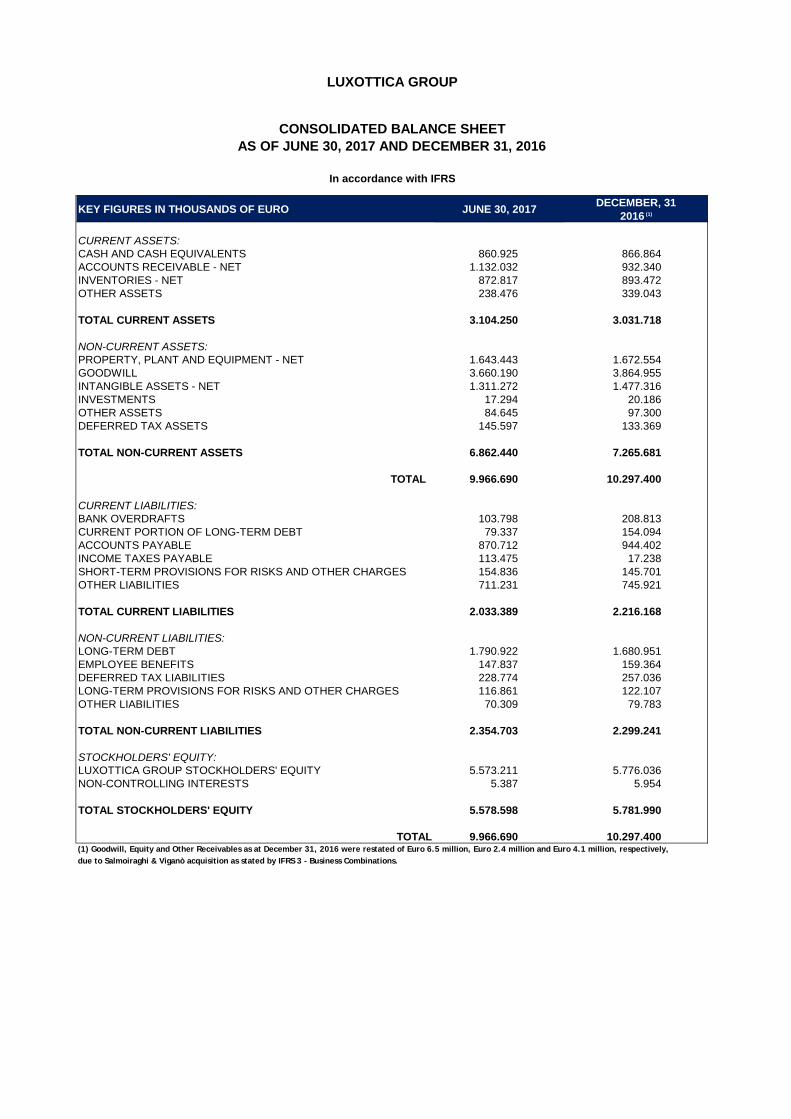
KEY FIGURES IN THOUSANDS OF EURO JUNE 30, 2017 DECEMBER, 31 2016 (1)
CURRENT ASSETS:CASH AND CASH EQUIVALENTS 860.925 866.864ACCOUNTS RECEIVABLE - NET 1.132.032 932.340INVENTORIES - NET 872.817 893.472OTHER ASSETS 238.476 339.043
TOTAL CURRENT ASSETS 3.104.250 3.031.718
NON-CURRENT ASSETS:PROPERTY, PLANT AND EQUIPMENT - NET 1.643.443 1.672.554GOODWILL 3.660.190 3.864.955INTANGIBLE ASSETS - NET 1.311.272 1.477.316INVESTMENTS 17.294 20.186OTHER ASSETS 84.645 97.300DEFERRED TAX ASSETS 145.597 133.369
TOTAL NON-CURRENT ASSETS 6.862.440 7.265.681
TOTAL 9.966.690 10.297.400
CURRENT LIABILITIES:BANK OVERDRAFTS 103.798 208.813CURRENT PORTION OF LONG-TERM DEBT 79.337 154.094ACCOUNTS PAYABLE 870.712 944.402INCOME TAXES PAYABLE 113.475 17.238SHORT-TERM PROVISIONS FOR RISKS AND OTHER CHARGES 154.836 145.701OTHER LIABILITIES 711.231 745.921
TOTAL CURRENT LIABILITIES 2.033.389 2.216.168
NON-CURRENT LIABILITIES:LONG-TERM DEBT 1.790.922 1.680.951EMPLOYEE BENEFITS 147.837 159.364DEFERRED TAX LIABILITIES 228.774 257.036LONG-TERM PROVISIONS FOR RISKS AND OTHER CHARGES 116.861 122.107OTHER LIABILITIES 70.309 79.783
TOTAL NON-CURRENT LIABILITIES 2.354.703 2.299.241
STOCKHOLDERS' EQUITY:LUXOTTICA GROUP STOCKHOLDERS' EQUITY 5.573.211 5.776.036NON-CONTROLLING INTERESTS 5.387 5.954
TOTAL STOCKHOLDERS' EQUITY 5.578.598 5.781.990
TOTAL 9.966.690 10.297.400(1) Goodwill, Equity and Other Receivables as at December 31, 2016 were restated of Euro 6.5 million, Euro 2.4 million and Euro 4.1 million, respectively, due to Salmoiraghi & Viganò acquisition as stated by IFRS 3 - Business Combinations.
In accordance with IFRS
LUXOTTICA GROUP
CONSOLIDATED BALANCE SHEETAS OF JUNE 30, 2017 AND DECEMBER 31, 2016

KEY FIGURES IN THOUSANDS OF EURO MANUFACTURINGAND WHOLESALE RETAIL
INTER-SEGMENTTRANSACTIONS AND
CORPORATE ADJ.CONSOLIDATED
2017
NET SALES 1.980.578 2.936.762 4.917.340
OPERATING INCOME 563.521 417.278 (112.905) 867.894
% OF SALES 28,5% 14,2% 17,6%
CAPITAL EXPENDITURES 131.873 99.720 231.594
DEPRECIATION AND AMORTIZATION 90.852 140.910 45.347 277.110
2016
NET SALES 1.970.406 2.749.020 4.719.426
OPERATING INCOME 524.856 365.018 (101.798) 788.076
% OF SALES 26,6% 13,3% 16,7%
CAPITAL EXPENDITURES 147.246 137.461 284.707
DEPRECIATION AND AMORTIZATION 80.239 125.900 42.840 248.979
LUXOTTICA GROUP
CONSOLIDATED FINANCIAL HIGHLIGHTS
In accordance with IFRS
JUNE 30, 2017 AND JUNE 30, 2016- SEGMENTAL INFORMATION -
FOR THE SIX-MONTH PERIODS ENDED

LUXOTTICA GROUP
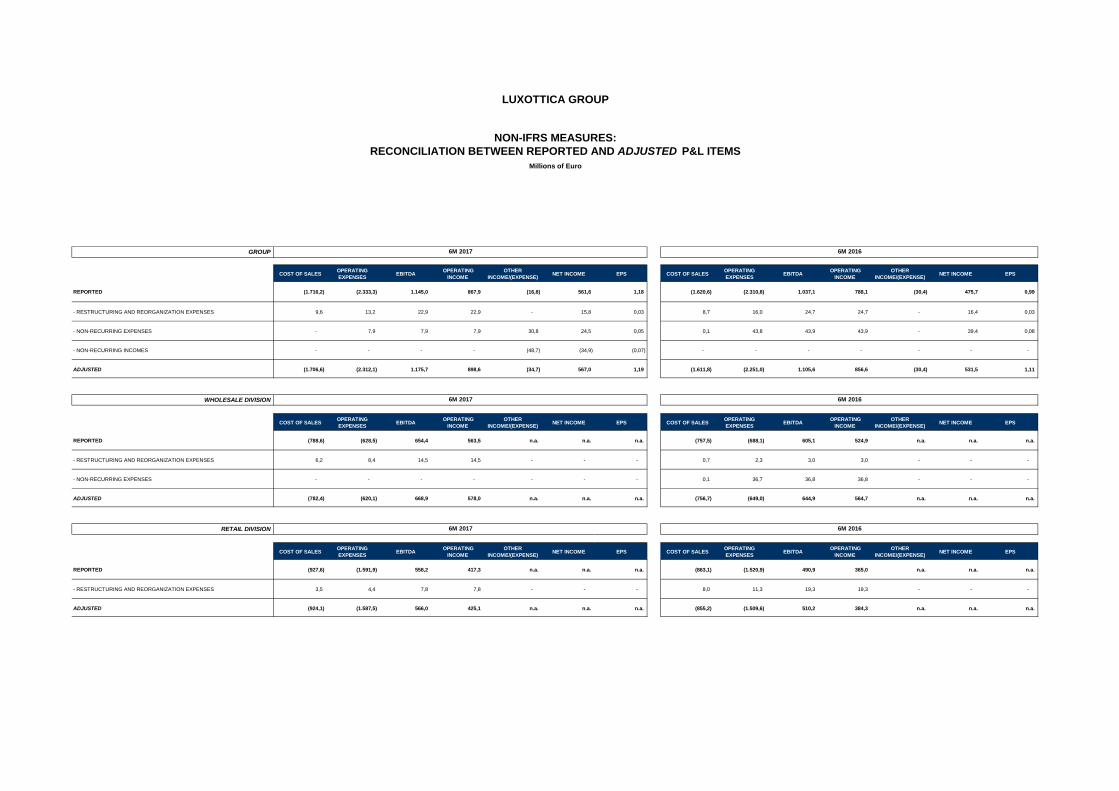
NON-IFRS MEASURES: ADJUSTED MEASURES
In order to provide a supplemental comparison of current period results of operations to prior periods, we have adjusted for certain transactionsor events.
We have made such adjustments to the following measures: cost of sales, operating expenses, operating income, EBITDA, otherincome/(expense), income before provision for income taxes, provision for income taxes, net income and earnings per share.
For comparative purposes, management has adjusted each of the foregoing measures. The adjusted data for the six-month period ended June30, 2017 take into account: (i) restructuring and reorganization costs of Euro 22.9 million (Euro 15.8 million net of taxes and Euro 0.03 impacton EPS), (ii) non-recurring expenses of Euro 38.6 million (Euro 24.5 million net of taxes and Euro 0.05 impact on EPS) related to the earlyrepayment of financial liabilities for Euro 30.8 million (Euro 19.0 million net of taxes) and the pending combination with Essilor for Euro 7.9million (Euro 5.5 million net of taxes), and (iii) non-recurring income of Euro 48.7 million (Euro 34.9 net of taxes and Euro -0.07 impact on EPS)related to a gain on the sales of a building owned by the Group. The combined effect of (i), (ii) and (iii) for the six-month period ended June 30,2017, was extraordinary costs of approximately Euro 31 million at operating income level, Euro 12.9 million at an income before provision forincome taxes level, and Euro 5.4 million at net income level.The adjusted data for the six-month periods ended June 30, 2016 take into account: (i) restructuring and reorganization costs of Euro 24.7million (Euro 16.4 million net of taxes and Euro 0.03 impact on EPS), and (ii) non-recurring expenses of Euro 43.9 million (Euro 39.4 million netof taxes and Euro 0.08 impact on EPS) related to the departure of Adil Mehboob-Khan as CEO for markets, the Oakley integration and anaccrual for a litigation matter.
The Company believes that these adjusted measures are useful to both management and investors in evaluating the Company’s operatingperformance compared with that of other companies in its industry because they exclude the impact of certain items that are not relevant to theCompany’s operating performance.
The adjusted measures referenced above are not measures of performance in accordance with International Financial Reporting Standards asissued by the International Accounting Standards Board (IFRS). We include these adjusted measures in this presentation in order to provide asupplemental view of operations.
These adjusted measures are not meant to be considered in isolation or as a substitute for items appearing on our financial statementsprepared in accordance with IFRS. Rather, these non/IFRS measures should be used as a supplement to IFRS results to assist the reader inbetter understanding the operational performance of the Company. The Company cautions that these adjusted measures are not defined termsunder IFRS and their definitions should be carefully reviewed and understood by investors. Investors should be aware that Luxottica Group’smethod of calculating these adjusted measures may differ from methods used by other companies.
The Company recognizes that there are limitations in the usefulness of adjusted measures due to the subjective nature of items excluded bymanagement in calculating adjusted comparisons. We compensate for the foregoing limitations by using these adjusted measures as acomparative tool, together with IFRS measures, to assist in the evaluation of our operating performance.
See the tables on the following pages for a reconciliation of the adjusted measures discussed above to their most directly comparable IFRSfinancial measures or, in the case of adjusted EBITDA and adjusted EBITDA margin, to EBITDA and EBITDA margin, respectively, which arealso non-IFRS measures. For a discussion of EBITDA and EBITDA margin and a reconciliation of EBITDA and EBITDA margin to their mostdirectly comparable IFRS financial measures, see the tables on the pages immediately following the reconciliation of the adjusted measures.
GROUP
COST OF SALES OPERATING EXPENSES EBITDA OPERATING
INCOMEOTHER
INCOME/(EXPENSE) NET INCOME EPS COST OF SALES OPERATING EXPENSES EBITDA OPERATING
INCOMEOTHER
INCOME/(EXPENSE) NET INCOME EPS
REPORTED (1.716,2) (2.333,3) 1.145,0 867,9 (16,8) 561,6 1,18 (1.620,6) (2.310,8) 1.037,1 788,1 (30,4) 475,7 0,99
- RESTRUCTURING AND REORGANIZATION EXPENSES 9,6 13,2 22,9 22,9 - 15,8 0,03 8,7 16,0 24,7 24,7 - 16,4 0,03
- NON-RECURRING EXPENSES - 7,9 7,9 7,9 30,8 24,5 0,05 0,1 43,8 43,9 43,9 - 39,4 0,08
- NON-RECURRING INCOMES - - - - (48,7) (34,9) (0,07) - - - - - - -
ADJUSTED (1.706,6) (2.312,1) 1.175,7 898,6 (34,7) 567,0 1,19 (1.611,8) (2.251,0) 1.105,6 856,6 (30,4) 531,5 1,11
WHOLESALE DIVISION
COST OF SALES OPERATING EXPENSES EBITDA OPERATING
INCOMEOTHER
INCOME/(EXPENSE) NET INCOME EPS COST OF SALES OPERATING EXPENSES EBITDA OPERATING
INCOMEOTHER
INCOME/(EXPENSE) NET INCOME EPS
REPORTED (788,6) (628,5) 654,4 563,5 n.a. n.a. n.a. (757,5) (688,1) 605,1 524,9 n.a. n.a. n.a.
- RESTRUCTURING AND REORGANIZATION EXPENSES 6,2 8,4 14,5 14,5 - - - 0,7 2,3 3,0 3,0 - - -
- NON-RECURRING EXPENSES - - - - - - - 0,1 36,7 36,8 36,8 - - -
ADJUSTED (782,4) (620,1) 668,9 578,0 n.a. n.a. n.a. (756,7) (649,0) 644,9 564,7 n.a. n.a. n.a.
RETAIL DIVISION
COST OF SALES OPERATING EXPENSES EBITDA OPERATING
INCOMEOTHER
INCOME/(EXPENSE) NET INCOME EPS COST OF SALES OPERATING EXPENSES EBITDA OPERATING
INCOMEOTHER
INCOME/(EXPENSE) NET INCOME EPS
REPORTED (927,6) (1.591,9) 558,2 417,3 n.a. n.a. n.a. (863,1) (1.520,9) 490,9 365,0 n.a. n.a. n.a.
- RESTRUCTURING AND REORGANIZATION EXPENSES 3,5 4,4 7,8 7,8 - - - 8,0 11,3 19,3 19,3 - - -
ADJUSTED (924,1) (1.587,5) 566,0 425,1 n.a. n.a. n.a. (855,2) (1.509,6) 510,2 384,3 n.a. n.a. n.a.
6M 20166M 2017
6M 2017
6M 2017 6M 2016
LUXOTTICA GROUP
NON-IFRS MEASURES:RECONCILIATION BETWEEN REPORTED AND ADJUSTED P&L ITEMS
Millions of Euro
6M 2016

LUXOTTICA GROUP
NON-IFRS MEASURES: EBITDA AND EBITDA MARGIN
EBITDA represents net income before non-controlling interest, taxes, other income/expense, depreciation andamortization. EBITDA margin means EBITDA divided by net sales. The Company believes that EBITDA is useful to bothmanagement and investors in evaluating the Company’s operating performance compared with that of other companies inits industry. Our calculation of EBITDA allows us to compare our operating results with those of other companies withoutgiving effect to financing, income taxes and the accounting effects of capital spending, which items may vary for differentcompanies for reasons unrelated to the overall operating performance of a company’s business.
EBITDA and EBITDA margin are not measures of performance under International Financial Reporting Standards asissued by the International Accounting Standards Board (IFRS).
We include them in this presentation in order to:
● improve transparency for investors;● assist investors in their assessment of the Company’s operating performance and its ability to refinance its debt asit matures and incur additional indebtedness to invest in new business opportunities;● assist investors in their assessment of the Company’s cost of debt;● ensure that these measures are fully understood in light of how the Company evaluates its operating results andleverage;● properly define the metrics used and confirm their calculation; and● share these measures with all investors at the same time.
EBITDA and EBITDA margin are not meant to be considered in isolation or as a substitute for items appearing on ourfinancial statements prepared in accordance with IFRS. Rather, these non-IFRS measures should be used as asupplement to IFRS results to assist the reader in better understanding the operational performance of the Company. TheCompany cautions that these measures are not defined terms under IFRS and their definitions should be carefullyreviewed and understood by investors. Investors should be aware that Luxottica Group’s method of calculating EBITDAmay differ from methods used by other companies.
The Company recognizes that the usefulness of EBITDA has certain limitations, including:
● EBITDA does not include interest expense. Because we have borrowed money in order to finance our operations,interest expense is a necessary element of our costs and ability to generate profits and cash flows. Therefore, anymeasure that excludes interest expense may have material limitations;● EBITDA does not include depreciation and amortization expense. Because we use capital assets, depreciation andamortization expense is a necessary element of our costs and ability to generate profits. Therefore, any measure thatexcludes depreciation and expense may have material limitations;● EBITDA does not include provision for income taxes. Because the payment of income taxes is a necessaryelement of our costs, any measure that excludes tax expense may have material limitations;● EBITDA does not reflect cash expenditures or future requirements for capital expenditures or contractualcommitments;● EBITDA does not allow us to analyze the effect of certain recurring and non-recurring items that materially affectour net income or loss.
We compensate for the foregoing limitations by using EBITDA as a comparative tool, together with IFRS measures, to assist in the evaluation of our operating performance and leverage.
See the table on the following page for a reconciliation of EBITDA to net income, which is the most directly comparable IFRS financial measure, as well as the calculation of EBITDA margin.

JUNE 30, 2016 JUNE 30, 2017 FY 2016 LTM JUNE 30, 2017
NET INCOME/(LOSS) 475,7 561,6 850,5 936,5 (+)
NET INCOME ATTRIBUTABLE TO NON CONTROLLING INTEREST 1,3 1,5 1,8 1,9 (+)
PROVISION FOR INCOME TAXES 280,6 288,1 466,4 473,8 (+)
OTHER (INCOME)/EXPENSES 30,4 16,8 26,6 12,9 (+)
DEPRECIATION AND AMORTIZATION 249,0 277,1 512,8 541,0 (+)
EBITDA 1.037,1 1.145,0 1.858,1 1.966,1 (=)
NET SALES 4.719,4 4.917,3 9.085,7 9.283,6 (/)
EBITDA MARGIN 22,0% 23,3% 20,5% 21,2%(=)
LUXOTTICA GROUP
NON-IFRS MEASURES:EBITDA and EBITDA margin
Millions of Euro

JUNE 30, 2016 (1, 2) JUNE 30, 2017(3, 4) FY 2016 (5,6) LTM JUNE 30, 2017 (1, 2,3,4)
NET INCOME/(LOSS) 531,5 567,0 881,7 917,3 (+)
NET INCOME ATTRIBUTABLE TO NON CONTROLLING INTEREST 1,3 1,5 1,8 1,9 (+)
PROVISION FOR INCOME TAXES 293,3 295,5 486,3 488,5 (+)
OTHER (INCOME)/EXPENSES 30,4 34,7 62,3 66,5 (+)
DEPRECIATION AND AMORTIZATION 249,0 277,1 512,8 541,0 (+)
Adjusted EBITDA 1.105,6 1.175,7 1.945,0 2.015,2 (=)
NET SALES 4.719,4 4.917,3 9.085,7 9.283,6 (/)
EBITDA MARGIN 23,4% 23,9% 21,4% 21,7%(=)
(1) Exclude restructuring and reorganization expenses of Euro 24.7 million.(2) Exclude for 2016 the non-recurring expenses of Euro 43.9 million (Euro 39.4 million net of taxes) related to the departure of Adil Mehboob-Khan as CEO for Markets, expenses related to the Oakley integration and an accrual for a litigation matter;(3) Exclude restructuring and reorganization expenses of Euro 22.9 million;(4) Exclude for 2017 the non-recurring expenses of Euro 7.9 million related to the pending combination with Essilor;(5) Exclude for 2016 restructuring and reorganization costs of Euro 69.5 million;(6) Exclude for 2017 the non-recurring expenses of Euro 17.4 million related to the departure of Adil Mehboob-Khan as CEO for markets and to the Oakley integration
LUXOTTICA GROUP
The adjusted figures :
NON-IFRS MEASURES:ADJUSTED EBITDA AND ADJUSTED EBITDA MARGIN
Millions of Euro

LUXOTTICA GROUP
NON-IFRS MEASURES: NET DEBT TO EBITDA RATIO
Net debt to EBITDA ratio: Net debt means the sum of bank overdrafts, current portion of long-term debt and long-term debt, lesscash. EBITDA represents net income before non-controlling interests, taxes, other income/expense, depreciation andamortization. The Company believes that EBITDA is useful to both management and investors in evaluating theCompany’s operating performance compared with that of other companies in its industry. Our calculation of EBITDA allows us tocompare our operating results with those of other companies without giving effect to financing, income taxes and the accountingeffects of capital spending, which items may vary for different companies for reasons unrelated to the overall operatingperformance of a company’s business. The ratio of net debt to EBITDA is a measure used by management to assess theCompany’s level of leverage, which affects our ability to refinance our debt as it matures and incur additional indebtedness toinvest in new business opportunities. The ratio also allows management to assess the cost of existing debt since it affects theinterest rates charged by the Company’s lenders.
EBITDA and ratio of net debt to EBITDA are not measures of performance under International Financial Reporting Standards asissued by the International Accounting Standards Board (IFRS). We include them in this presentation in order to:
● improve transparency for investors;● assist investors in their assessment of the Company’s operating performance and its ability to refinance its debt as itmatures and incur additional indebtedness to invest in new business opportunities;● assist investors in their assessment of the Company’s cost of debt;
● ensure that these measures are fully understood in light of how the Company evaluates its operating results and leverage;
● properly define the metrics used and confirm their calculation; and● share these measures with all investors at the same time.
EBITDA and ratio of net debt to EBITDA are not meant to be considered in isolation or as a substitute for items appearing on ourfinancial statements prepared in accordance with IFRS. Rather, these non-IFRS measures should be used as a supplement toIFRS results to assist the reader in better understanding the operational performance of the Company. The Company cautions that these measures are not defined terms under IFRS and their definitions should be carefully reviewed and understood by investors.Investors should be aware that Luxottica Group’s method of calculating EBITDA and the ratio of net debt to EBITDA may differfrom methods used by other companies.The Company recognizes that the usefulness of EBITDA and the ratio of net debt toEBITDA as evaluative tools may have certain limitations, including:
● EBITDA does not include interest expense. Because we have borrowed money in order to finance our operations, interestexpense is a necessary element of our costs and ability to generate profits and cash flows. Therefore, any measure that excludesinterest expense may have material limitations;● EBITDA does not include depreciation and amortization expense. Because we use capital assets, depreciation andamortization expense is a necessary element of our costs and ability to generate profits. Therefore, any measure that excludesdepreciation and expense may have material limitations;● EBITDA does not include provision for income taxes. Because the payment of income taxes is a necessary element of ourcosts, any measure that excludes tax expense may have material limitations;
● EBITDA does not reflect cash expenditures or future requirements for capital expenditures or contractual commitments;
● EBITDA does not reflect changes in, or cash requirements for, working capital needs;● EBITDA does not allow us to analyze the effect of certain recurring and non-recurring items that materially affect our netincome or loss; and● The ratio of net debt to EBITDA is net of cash and cash equivalents, restricted cash and short-term investments, therebyreducing our debt position.
Because we may not be able to use our cash to reduce our debt on a dollar-for-dollar basis, this measure may have materiallimitations. We compensate for the foregoing limitations by using EBITDA and the ratio of net debt to EBITDA as two of severalcomparative tools, together with IFRS measures, to assist in the evaluation of our operating performance and leverage.
See the table on the following page for a reconciliation of net debt to long-term debt, which is the most directly comparable IFRS financial measure, as well as the calculation of the ratio of net debt to EBITDA. For a reconciliation of EBITDA to net income, which is the most directly comparable IFRS financial measure, see the table on the preceding pages.

DECEMBER 31, 2016 JUNE 30, 2017
LONG-TERM DEBT (+) 1.681,0 1.790,9
CURRENT PORTION OF LONG TERM DEBT (+) 154,1 79,3
BANK OVERDRAFTS (+) 208,8 103,8
CASH (-) (866,9) (860,9)
NET DEBT (=) 1.177,0 1.113,1
EBITDA (LTM) 1.858,1 1.966,1
NET DEBT/EBITDA 0,6x 0,6x
NET DEBT @ AVG. EXCHANGE RATES (1) 1.172,2 1.108,1
NET DEBT @ AVG. EXCHANGE RATES (1)/EBITDA 0,6x 0,6x
Notes:(1) Net debt figures are calculated using the average exchange rates used to calculate the EBITDA figures.
LUXOTTICA GROUP
NON-IFRS MEASURES: NET DEBT AND NET DEBT/EBITDA
Millions of Euro

DECEMBER 31, 2016 (1,3) JUNE 30, 2017 (1,2)
LONG-TERM DEBT (+) 1.681,0 1.790,9
CURRENT PORTION OF LONG TERM DEBT (+) 154,1 79,3
BANK OVERDRAFTS (+) 208,8 103,8
CASH (-) (866,9) (860,9)
NET DEBT (=) 1.177,0 1.113,1
ADJUSTED EBITDA (LTM and FY 2015) 1.945,0 2.015,2
NET DEBT/LTM ADJUSTED EBITDA 0,6x 0,6x
NET DEBT @ AVG. EXCHANGE RATES (1) 1.172,2 1.108,1
NET DEBT @ AVG. EXCHANGE RATES (1)/LTM ADJUSTED EBITDA 0,6x 0,5x
Notes:
(3) Adjusted figures exclude: (i) restructuring and reorganization expenses of Euro 69.5 million; (ii) Non-recurring expenses of Euro 17.4 million related to the departure of Adil Mehboob-Khan as CEO for markets and to the Oakley integration.
LUXOTTICA GROUP
NON-IFRS MEASURES: NET DEBT AND NET DEBT/ADJUSTED EBITDA
Millions of Euro
(1) Net debt figures are calculated using the average exchange rates used to calculate the EBITDA figures.(2) Adjusted figures exclude: (i) restructuring and reorganization expenses of Euro 22.9 million; (ii) Non-recurring expenses of Euro 7.9 million related to the pending combination with Essilor;

LUXOTTICA GROUP
NON-IFRS MEASURES: FREE CASH FLOW
Free cash flow represents net income before non-controlling interests, taxes, other income/expense, depreciation andamortization (i.e. EBITDA – see table on the earlier page) plus or minus the decrease/(increase) in working capital overthe prior period, less capital expenditures, plus or minus interest income/(expense) and extraordinary items, minus taxespaid. The Company believes that free cash flow is useful to both management and investors in evaluating the Company’soperating performance compared with other companies in its industry. In particular, our calculation of free cash flowprovides a clearer picture of the Company’s ability to generate net cash from operations, which is used for mandatory debtservice requirements, for funding discretionary investments, for paying dividends or pursuing other strategic opportunities.
Free cash flow is not a measure of performance under International Financial Reporting Standards as issued by theInternational Accounting Standards Board (IFRS).
We include it in this presentation in order to:
● Improve transparency for investors;● Assist investors in their assessment of the Company’s operating performance and its ability to generate cash fromoperations in excess of its cash expenses;● Ensure that this measure is fully understood in light of how the Company evaluates its operating results;● Properly define the metrics used and confirm their calculation; and● Share this measure with all investors at the same time.
Free cash flow is not meant to be considered in isolation or as a substitute for items appearing on our financial statementsprepared in accordance with IFRS. Rather, this non-IFRS measure should be used as a supplement to IFRS results toassist the reader in better understanding the operational performance of the Company. The Company cautions that thismeasure is not a defined term under IFRS and its definition should be carefully reviewed and understood by investors.Investors should be aware that Luxottica Group’s method of calculation of free cash flow may differ from methods used byother companies. The Company recognizes that the usefulness of free cash flow as an evaluative tool may have certainlimitations, including:
● The manner in which the Company calculates free cash flow may differ from that of other companies, which limitsits usefulness as a comparative measure;● Free cash flow does not represent the total increase or decrease in the net debt balance for the period since itexcludes, among other things, cash used for funding discretionary investments and to pursue strategic opportunitiesduring the period and any impact of the exchange rate changes; and● Free cash flow can be subject to adjustment at the Company’s discretion if the Company takes steps or adoptspolicies that increase or diminish its current liabilities and/or changes to working capital.
Because we may not be able to use our cash to reduce our debt on a dollar-for-dollar basis, this measure may havematerial limitations. We compensate for the foregoing limitations by using EBITDA and the ratio of net debt to EBITDA astwo of several comparative tools, together with IFRS measures, to assist in the evaluation of our operating performanceand leverage.
See the table on the following page for a reconciliation of net debt to long-term debt, which is the most directly comparableIFRS financial measure, as well as the calculation of the ratio of net debt to EBITDA. For a reconciliation of EBITDA to netincome, which is the most directly comparable IFRS financial measure, see the table on the preceding page.

JUNE 2017
ADJUSTED EBITDA (1) 1.175,7
Δ WORKING CAPITAL (227,4)
CAPEX (231,6)
OPERATING CASH FLOW 716,8
FINANCIAL CHARGES (2) (62,3)
TAXES (164,0)
EXTRAORDINARY CHARGES (3) 44,6
Free cash flow 535,0
Notes:(1) Adjusted EBITDA is not an IAS/IFRS measure; please see table on the earlier page for a reconciliation of adjusted EBITDA to EBITDA and EBITDA to net income(2) Equals interest income minus interest expense(3) Equals extraordinary income minus extraordinary expense
LUXOTTICA GROUP
NON-IFRS MEASURES:FREE CASH FLOW
Millions of Euro

Three months ended Six months ended Twelve months ended Three months ended Six months endedJune 30, 2017 June 30, 2017 December 31, 2016 June 30, 2016 June 30, 2016
Average exchange ratesper € 1
US$ 1,10213 1,08302 1,10690 1,12924 1,11594
AUD 1,46869 1,43642 1,48828 1,51504 1,52198
GBP 0,86112 0,86059 0,81948 0,78678 0,77877
CNY 7,55970 7,44483 7,35222 7,37878 7,29646
JPY 122,58403 121,78039 120,19665 121,94923 124,41362
MXN 20,44375 21,04407 20,66731 20,43529 20,17313
BRL 3,54413 3,44311 3,85614 3,96310 4,12955
LUXOTTICA GROUPMajor currencies