luxury hotel and residences - dspace home plan and scalable pro forma model luxury hotel and...
TRANSCRIPT

BUSINESS PLAN AND SCALABLE PRO FORMA MODEL
LUXURY HOTEL AND RESIDENCES
VANCOUVER, BRITISH COLUMBIA
PRACTICUM
MASTER OF SCIENCE
EDWARD ST. JOHN DEPARTMENT OF REAL ESTATE
JOHNS HOPKINS UNIVERSITY
PREPARED BY:
JENNIFER CONNELL
MARCH 17, 2009

TABLE OF CONTENTS
ABSTRACT………………………………………………………………………………. 1
EXECUTIVE SUMMARY……………………………………………………………… 1
PRODUCT/SERVICE OFFERING…………………………………………………….. 4 Location Summary………………………………………………………………………. 5 Hotel Product and Service Offering....………………………………………………….. 6 Residential Product and Service Offering………………………………………………. 7
VANCOUVER MARKET OVERVIEW……………………………………………….. 8 General…………………………………………………………………………………... 8 Tourism and Transportation…………………………………………………………….. 8 Housing and Population…………………………………………………………………. 9
MARKET PLAN………………………………………………………………………… 12 Hotel ……………………………………………………………………………………. 12 Residential………………………………………………………………………………. 14
COMPETITION…………………………………………………………………………. 17 Hotel…………………………………………………………………………………….. 17 Residential………………………………………………………………………………. 20
PRICING…………………………………………………………………………………. 25 Hotel…………………………………………………………………………………….. 25 Residential………………………………………………………………………………. 28
MANAGEMENT PLAN………………………………………………………………… 30
FINANCIAL MANAGEMENT PLAN…………………………………………………. 32 Development Budget……………………………………………………………………. 32 Development Financing…………………………………………………………………. 32 Permanent Financing……………………………………………………………………. 33 Projected Hotel Performance……………………………………………………………. 34 Projected Residential Performance…….………………………………………………... 36 Tax Calculations………………………………………………………………………… 37 Expected Equity Returns………………………………………………………………... 37 Sensitivity Analysis……………………………………………………………………... 39
RISK MANAGEMENT…………………………………………………………………. 41
CONCLUSION…………………………………………………………………………... 43
EXHIBITS………………………………………………………………………………... 44
APPENDIX I – HOTEL PRICE GROWTH REGRESSION ANALYSIS…………... 62
APPENDIX II – CONDOMINIUM SALES PRICE REGRESSION ANALYSIS…... 66
APPENDIX III – CRYSTAL BALL REPORT………………………………………... 70
SOURCES………………………………………………………………………………… 72
SCALABLE PRO FORMA MODEL…………………………………………………... Attached

ABSTRACT IronGate Fund, LLC (“IronGate”) is an investment fund that partners with local developers in international gateway cities to develop mixed-use projects. Most of the company’s projects feature a luxury hotel component. IronGate has acquired a 0.6-acre site in downtown Vancouver, British Columbia on which it plans to develop a 60-story tower comprising a 150-room branded luxury hotel and 150 branded luxury condominiums. Possible brands being considered include Four Seasons, Ritz-Carlton, St. Regis, and Mandarin Oriental. The project will be located in the vibrant downtown core of Vancouver, British Columbia, an international gateway city and home to the 2010 Winter Olympics. The city is economically-diverse, has a strong tourism base, and boasts one of the most densely populated downtown areas in North America. The project’s location proximate to the Robson Street entertainment and shopping district and the Coal Harbour waterfront make it well-positioned to attract corporate and leisure lodging demand and luxury condominium buyers. The project will open in January 2012 based on a 36 month development timeline. Total development costs are projected to be $362.8 million. IronGate is seeking debt and equity financing for the project as presented below.
Project Development Funding Funding Source Amount
(mil) % of Total
Costs Senior Construction Loan $ 217.7 60% Mezzanine Construction Loan 54.4 15% IronGate Equity 27.2 7.5% Common Equity 63.5 17.5% Total $362.8 100%
The 150 luxury condominiums are projected to sell at an average pace of 3 units per month and achieve an average sales price of $1,450 per square foot, generating $478.5 million in gross sales proceeds. The 150-room luxury hotel is projected to stabilize at an occupancy of 75% with an average daily rate of $300 (2008 $) and achieve a stabilized EBITDA of $3.1 million. The hotel is assumed to be sold 10 years after opening at a gross sales price of $35.1 million based upon a 9% terminal capitalization rate. (All amounts in the business plan are presented in Canadian $.) IronGate’s financial analysis for the project is somewhat conservative given the current sluggish economic environment and the strained debt markets. Nevertheless, the project is expected to generate healthy returns to investors, with a total equity before-tax IRR of 18.9%. Due to a promote on any equity distributions above a 15% cumulative current return, IronGate’s IRR is estimated to be 19.4%, while the remaining equity investors are expected to realize an 18.7% IRR. EXECUTIVE SUMMARY IronGate is a Northern Virginia-based real estate investment fund that partners with local developers in international gateway cities to develop mixed-use projects. Most of the company’s projects feature a luxury hotel component. The company’s executive team is comprised of four principals, each of whom has over 15 years in real estate development, operations, and transaction experience. IronGate has acquired a 0.6-acre site at the northwest quadrant of West Georgia Street and Thurlow Street in downtown Vancouver on which it plans to build a 60-story luxury mixed-use tower. The

lower 20 floors of the building will contain a 150-room branded luxury hotel. The upper 40 floors will contain 150 branded luxury condominiums. Possible brands being considered include Four Seasons, Ritz-Carlton, St. Regis, and Mandarin Oriental. IronGate is seeking equity partners to form a joint venture which will undertake development of the project. IronGate will contribute equity in the form of land and design costs and as managing member will be responsible for the day-to-day development, residential sales and marketing, and asset management duties for the project. The project represents an unparalleled opportunity to develop a luxury hotel and condominiums in an international gateway city with a strong U.S. and Asian demand base, capitalizing on the anticipated demand growth resulting from the upcoming 2010 Winter Olympic Games and the expansion of the Vancouver Convention and Exhibition Center. The project’s location within the CBD and proximity to the Robson Street entertainment and shopping district and the waterfront make it well-positioned to attract corporate and leisure lodging demand. Furthermore, downtown Vancouver is the most densely populated city center in Canada and represents one of the highest-populated urban areas in the world. Strong demand for luxury residences is generated by current residents of British Columbia and nearby provinces as well as international residents seeking a second home or pied-a-terre in Canada’s most vibrant west coast city. Hotel The luxury hotel will offer 150 guest rooms featuring the highest quality finishes in a contemporary style. The hotel will also feature 10,000 square feet of meeting space, a 7,500 square foot luxury spa, fitness center, outdoor pool, and a celebrity-chef restaurant. The subject hotel’s primary competitors comprise three 3 hotels, the 97-room Opus Hotel, the 83-room Wedgewood Hotel, and the 376-room Four Seasons. Overall, the downtown Vancouver lodging market is strong, with luxury hotels achieving average occupancies between 70% and 85% at average rates ranging from $210 to $250 (2008 $). (All amounts in the business plan are presented in Canadian $.) The primary competitive addition in the market is the 119-room Shangri-La, which will open on an adjacent site in early 2009.
Given the strength of the downtown Vancouver lodging market and the hotel’s luxury brand affiliation, new luxury product, location in an iconic 60-story tower, and above-average room size, the subject hotel is projected to successfully penetrate existing luxury demand currently being accommodated at the high-end boutique and luxury hotels. In addition, the subject hotel is expected to induce new demand into the market due to its new luxury brand. The hotel’s projected performance is summarized below:
Projected Hotel Performance (2008 $) Opening Date: January 2012 Occupancy: 68/72/75% ADR (2008 $): C$300.00 Stabilized Total Revenue $24.3 million Stabilized House Profit $6.2 million Stabilized EBITDA $3.1 million
The hotel is assumed to be sold 10 years after opening at a gross sales price of $35.1 million based upon a 9% terminal capitalization rate.
2

Residences
The condominium residences will comprise 150 luxury units ranging from one-bedroom units at 1,450 square feet to the six-bedroom penthouse at 6,025 square feet. The project will be positioned as the most desirable luxury address in Vancouver and will benefit from its association with an international luxury hotel brand and access to five-star hotel facilities and amenities. Buyers are likely to be between 45 and 75 years of age with incomes above $150,000. Target buyer profiles include wealthy empty-nesters and retirees, residents of older downtown high-rise condominiums, young professionals, and both Canadian and international second home buyers.
Residential competitors comprise five luxury and upscale projects in downtown Vancouver—the 175-unit Fairmont Pacific Rim, the 300-unit Shangri-La, the 150-unit Jameson House, the 200-unit L’Hermitage en Ville, and the 81-unit Three Harbour Green. These competitors have achieved average sales prices ranging from $700 per square foot to $1,600 per square foot with early sales pace ranging from 10 to 20 units per month. Most of the competitive projects are near sold-out, with a combined total of 103 units remaining to be sold. The subject condominiums are projected to sell out over 50 months, representing an average sales pace of 3 units per month. This sales pace is significantly lower than the sales pace achieved by recent luxury competitors due to the recent cooling in the housing market. The subject condominiums are projected to achieve an average sales price of $1,450 per square foot, which is similar to the current pricing at Three Harbour Place and slightly above the $1,329 per square foot average for recent luxury sales. Sources and Uses Total development costs for the project are projected to be $362.8 million. Approximately $238 million, or 66% of total development cost, is allocable to the condominium component, resulting in a cost of $1.6 million per unit. Approximately $125 million, or 34% of total development cost, is allocable to the hotel component, resulting in a cost of slightly more than $834,000 per hotel key. A 36-month development timeline is expected. The project will be financed with a combination of debt and equity. A sources and uses table for the project is presented below.
SOURCES AND USES
Senior Loan $217,709,072 Land & Related $20,000,000Mezzanine Loan $54,427,268 General & Administrative $12,000,000Preferred Equity $0 Design & Consultants $15,300,000Common Equity 1 - IronGate $27,213,634 Development Charges & Municipal Costs $5,300,000Common Equity 2 $63,498,479 Sales, Marketing, and Advertising $15,000,000
Hard Construction Costs $251,600,000Building Operations $4,700,000Financing Costs $38,948,454
Total Sources $362,848,454 Total Uses 362,848,454$
TOTAL PROJECT
Sources Uses
The non-recourse senior construction loan is estimated to be $217.7 million with an interest rate of approximately 400 basis points over 30-day LIBOR. The $54.4 million mezzanine loan is expected to
3

have an interest rate of 1400 basis points over 30-day LIBOR. The loans will be interest-only, and principal will be repaid from condominium sales proceeds and hotel profit. Total equity funding needed for construction is approximately $90.7 million. IronGate will contribute approximately $27.2 million in the form of entitled land and design costs and is seeking the remaining equity from joint venture partners. Expected Financial Returns Based on a hold period of 10 years, the project is expected to generate a total equity before-tax IRR of 18.9%, and a net present value of $12.9 million (using a 15% discount rate). Furthermore, sensitivity analysis incorporating upside and downside risks in the more material pro forma assumptions shows a 50% probability that the total equity IRR will exceed 18%. Due to a promote on any equity distributions above a 15% cumulative current return, IronGate’s IRR is estimated to be 19.4%, while the remaining equity investors are expected to realize an 18.7% IRR. A summary of projected equity returns is presented below.
SUMMARY OF PROJECTED EQUITY RETURNS
Total Equity Return IRR 18.9% NPV at 15% 12,904,540
Common Equity 1 (IronGate) Return IRR 19.4% NPV at 15% 4,420,482
Common Equity 2 Return IRR 18.7% NPV at 15% 8,498,991
In conclusion, despite the volatile economic environment, the project is well-positioned to succeed given the strong management, ideal location, luxury brand potential, and the fundamental strength of the Vancouver economy.
PRODUCT/SERVICE OFFERING The development will comprise a 60-story luxury mixed-use building in downtown Vancouver, British Columbia. The building is expected to be designed by a world-renown architect and will be the second tallest structure in Vancouver. (The tallest is the adjacent Shangri-La tower.) The lower 20 floors of the building will contain a 150-room luxury hotel. The upper 40 floors will contain 150 branded luxury condominiums. The height and unique architecture of the building will give it prominence in the city skyline, an ideal characteristic for a luxury product. The hotel and residential components will be marketed under an internationally-recognized luxury brand. A hotel brand provides access to a large customer base that cannot be efficiently penetrated through traditional marketing channels. Furthermore, customers continue to patronize hotels and brands which consistently provide superior service and product quality. Brands are more easily able to deliver this consistency compared to independent hotels due to their sophisticated operational and marketing systems as well as their focus on customer and market research. Based on these factors, branded hotels generally outperform their non-branded competition by 20-30%. A luxury brand is able to achieve a higher premium due to its superior finishes, higher service levels, and exclusive cache.
4

Extending a luxury hotel brand to residential condominiums will allow investors to capitalize on the brand’s reputation and services, which are expected to generate higher sales proceeds. Branded luxury condominiums have historically realized pricing premiums of 25-35% compared to non-branded residential competitors. Brands being considered for the subject development include Ritz-Carlton, Four Seasons, St. Regis, and Mandarin Oriental. These luxury brands offer both hotel and residential management services as well as residential sales licenses. Furthermore, none of these brands have comparable representation in the Vancouver market to date. The hotel and condominium customers are largely expected to be distinct. However, the co-location of these components will be mutually beneficial. Residential buyers will have access to hotel fitness, spa, and restaurant facilities and will be able to utilize the hotel’s room service, concierge, and housekeeping services. The Hotel will benefit from revenues and fees from these offerings as well as room night demand from guests of residents.
Location Summary The subject development will be located within the vibrant Vancouver CBD, approximately two blocks from the upscale Robson Street shopping, restaurant, and entertainment district. The site is located approximately 0.5 miles from the Coal Harbour waterfront and the popular Stanley Park recreational district. The immediate area surrounding the development contains a mix of high-rise and mid-rise multi-family residential buildings, retail buildings and office towers. A summary of surrounding uses and a map of the area are presented below. • Location/Intersection: NWQ of West Georgia Street and Thurlow Street
• Current Land Use: Vacant
• Surrounding Land Uses:
North: Alley; residential; office building; Melville Street South: West Georgia Street; Shangri-La tower (u/c)
East: Office tower; alley; office building; Thurlow Street West: Office building; West Georgia Street; church; Bute Street
5
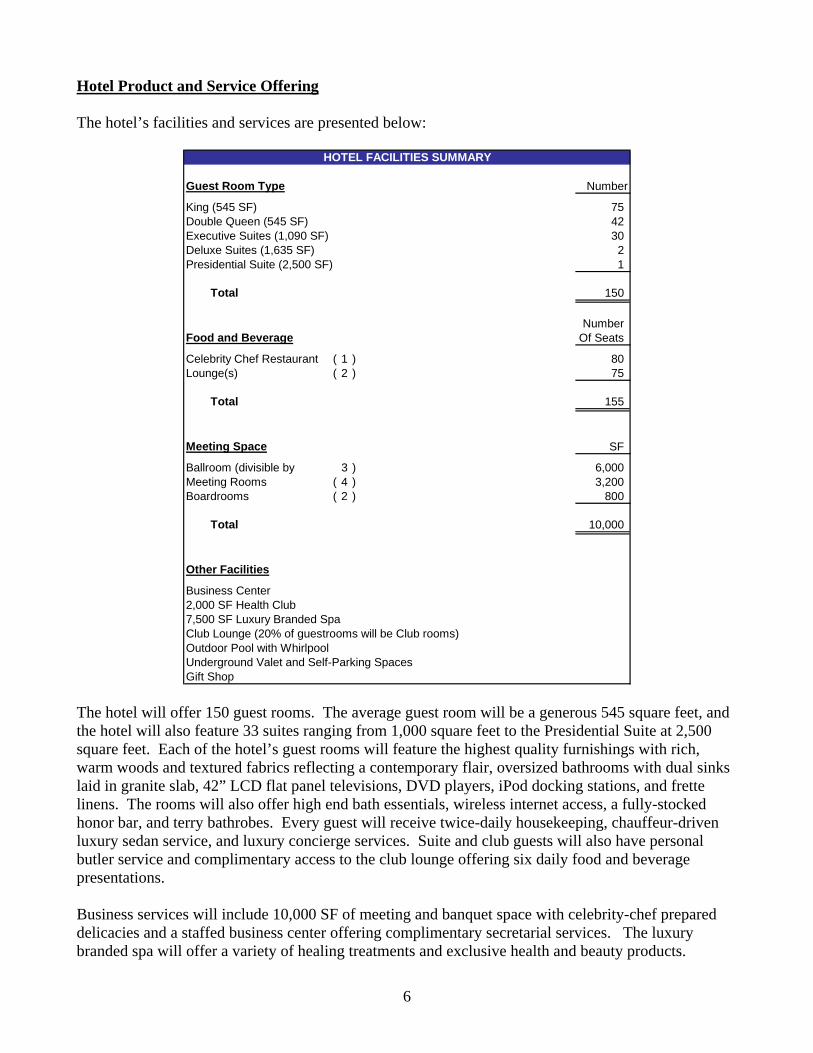
Hotel Product and Service Offering The hotel’s facilities and services are presented below:
Guest Room Type Number
King (545 SF) 75 Double Queen (545 SF) 42 Executive Suites (1,090 SF) 30 Deluxe Suites (1,635 SF) 2 Presidential Suite (2,500 SF) 1
Total 150
NumberFood and Beverage Of Seats
Celebrity Chef Restaurant ( 1 ) 80 Lounge(s) ( 2 ) 75
Total 155
Meeting Space SF
Ballroom (divisible by 3 ) 6,000 Meeting Rooms ( 4 ) 3,200 Boardrooms ( 2 ) 800
Total 10,000
Other Facilities
Business Center2,000 SF Health Club7,500 SF Luxury Branded SpaClub Lounge (20% of guestrooms will be Club rooms)Outdoor Pool with WhirlpoolUnderground Valet and Self-Parking SpacesGift Shop
HOTEL FACILITIES SUMMARY
The hotel will offer 150 guest rooms. The average guest room will be a generous 545 square feet, and the hotel will also feature 33 suites ranging from 1,000 square feet to the Presidential Suite at 2,500 square feet. Each of the hotel’s guest rooms will feature the highest quality furnishings with rich, warm woods and textured fabrics reflecting a contemporary flair, oversized bathrooms with dual sinks laid in granite slab, 42” LCD flat panel televisions, DVD players, iPod docking stations, and frette linens. The rooms will also offer high end bath essentials, wireless internet access, a fully-stocked honor bar, and terry bathrobes. Every guest will receive twice-daily housekeeping, chauffeur-driven luxury sedan service, and luxury concierge services. Suite and club guests will also have personal butler service and complimentary access to the club lounge offering six daily food and beverage presentations. Business services will include 10,000 SF of meeting and banquet space with celebrity-chef prepared delicacies and a staffed business center offering complimentary secretarial services. The luxury branded spa will offer a variety of healing treatments and exclusive health and beauty products.
6

Guests of the spa will also have access to sauna and steam room facilities as well as the hotel’s fitness center and pool. The restaurant concept will be created and implemented by a celebrity chef (to be determined) and will offer fine dining for both hotel guests and local residents. Residential Product and Service Offering The condominium’s facilities and services are presented below:
Unit Type SF Number
1 Bedrom, 1 Bath 1,450 151 Bedrom, 1 Bath, Den 1,750 252 Bedroom, 2 Bath 1,950 302 Bedroom, 2.5 Bath, Den 2,300 543 Bedroom, 2.5 Bath, Den 2,725 15Sub Penthouse 3,100 - 3,500 7Penthouse 4,000 3Grand Penthouse 6,025 1
Total 150
Common Element Facilities
3,000 SF Resident Lounge and Billiards Room1,500 SF Resident Lobby and Concierge StationIndoor Lap Pool1,500 SF Fitness Center and Movement StudioManagement Offices and Boardroom
Facilities Shared with Hotel
7,500 SF Luxury Branded SpaCelebrity Chef Restaurant and LoungesOutdoor Pool with WhirlpoolUnderground Valet and Self-Parking SpacesBusiness CenterGift Shop
RESIDENCES AMENITIES SUMMARY
The residences will comprise 150 luxury units ranging from one-bedroom units at 1,450 SF to the six-bedroom penthouse at 6,025 SF. The project will be positioned as the most desirable luxury address in Vancouver. Each residence will offer floor to ceiling windows and open floor plans to maximize natural light. The residences will boast magnificent views—units facing north will feature the Coal Harbour waterfront and cruise port and the North mountains, units facing west will feature Coal Harbour and the Pacific Ocean, and units facing east and south will feature the dramatic Vancouver city skyline. Residents will be able to choose from three luxury finish packages featuring the finest marble or granite tile and countertops, stainless steel Miele or Sub Zero appliances, and a variety of the finest hard wood flooring and carpeting. Master bedrooms will have marble baths with soaking tubs and oversized glass-enclosed showers with multiple shower heads. Lutron controlled lighting systems will allow owners to customize their lighting preferences at the touch of a button. The units have 9 to 9.5 foot ceiling heights. Each one-bedroom unit will feature one deeded parking space, while larger units will feature two parking spaces. The property will have optional valet parking and keyed elevator access to individual residential floors of the condominium tower.
7

In addition to offering access to the hotel facilities and amenities, the condominium will feature a private resident lounge and billiards room, an indoor lap pool and a 1,500 square foot private fitness center. Services available to residents include experienced residential association management, luxury 24-hour concierge services, chauffeur-driven sedan service, same day laundry and dry cleaning services, babysitting and dog walking services, housekeeping and maintenance services, and room service provided by the hotel restaurant. Services will be funded via condominium association dues, and in some cases, a-la-carte fees. VANCOUVER MARKET OVERVIEW General • The Greater Vancouver Regional District (“GVRD”; population of 2.2 million) is the largest
metropolitan area in Western Canada and the third largest in the country. GVRD serves as the commercial, medical, entertainment, and transportation hub for British Columbia and nearby provinces. Major industry sectors comprise mining, forestry, FIRE (financial, insurance, real estate), healthcare, tourism, and film production.
• Vancouver has been selected as the host city for the 2010 Winter Olympic Games. The games, preceding construction projects, and pre- and post-game activities are projected to create over 100,000 jobs, boost the Vancouver GDP by approximately $4.3 billion, and generate significant lodging demand in the area.
• As of Q4 2008, downtown Vancouver contained approximately 24.5 million SF of office space with a vacancy rate of 2.1%. Major employers in the downtown area include: The Jim Pattison Group (8,500), Telus Corporation (8,200), Canadian Imperial Bank (6,100), RBC Financial Group (5,300), HSBC (2,800), and Accenture (2,100). Recent and planned office projects in the downtown market include the following:
− A 145,000 SF office tower is planned for a site located 1.6 miles southeast of the subject site. The project is scheduled to commence in early 2009 with an anticipated completion date of 2011. A second phase is planned, but additional details are not available.
− A 153,000 SF office tower is planned approximately 1.9 miles southeast of the subject site. Timing and details are not available.
• Vancouver is the third largest film and television production center in North America. Between 2003 and 2007, an average of 201 productions were filmed in British Columbia annually (a majority of these were filmed partially within Vancouver) resulting in approximately $1.1 billion in annual spending. The industry supports approximately 30,000 local jobs and generates significant lodging and residential demand in the area.
Tourism & Transportation
• Vancouver has consistently been voted among the top travel destinations in North America due to its natural beauty, cosmopolitan atmosphere, and unique geography. In 2007, approximately 8.9 million tourists visited Vancouver spending approximately $4.6 billion. Demand is seasonal, with visitation peaking between May and September. Increased exposure and marketing efforts leading to the 2010 Winter Olympics should help broaden the city’s leisure demand base.
8

• Vancouver boasts over 14,000 hotel rooms (12,229 of these rooms are located downtown) and a 16-year average occupancy of 68.8% (70.2% for downtown hotels). In 2007, Vancouver hotels achieved an average occupancy of 73.8%. Although 2008 occupancy figures have not yet been released, year to date data suggests that occupancy has declined by approximately 3 points.
• Vancouver is a major point of embarkation for Alaskan cruise itineraries. In 2008, the Port of Vancouver hosted 254 cruise ships and 854,495 passengers. This represents a decline of approximately 22% from the 2002 peak of 1.1 million passengers due to ship attrition to the Port of Seattle. In addition, the Port of Vancouver handles 115 million tons of cargo in 2008, representing a 10% decline from 2007’s 128 million tons. Principal trading economies are China, the United States, China, and Korea.
• The 133,000 SF Vancouver Convention and Exhibition Center (“VCEC”) is located 0.5 miles northeast of the subject site. The center hosts 18-20 citywide events (minimum of 1,000 attendees) annually and generates approximately 100,000 room nights in downtown hotels.
A 335,000 SF expansion of the VCEC is currently under construction on a site adjacent to the existing center. The expansion is scheduled to open in March 2009, at which time the existing center will close for renovations. Upon completion in late 2009, the expanded VCEC will offer 468,000 SF of space and is projected to generate approximately 250,000 room nights annually on a stabilized basis.
• Vancouver International Airport (“VIA”), located 6 miles south of the subject site, is Canada’s second busiest airport and serves as a gateway to Western Canada. The airport offers direct service to 111 destinations worldwide. In 2008, VIA accommodated a record 17.9 million passengers, representing a 2.0% increase over 2007. In 2005, construction began on a $1 billion airport expansion which will feature a $420 million, 9-gate expansion of the international terminal, construction of a rapid transit terminal, and multiple infrastructure upgrades. The expansion will be completed in phases, with a planned final completion date of late 2009.
• Construction is underway on the 12-mile Canada Line, an extension of Vancouver’s SkyTrain rapid transit system, which will connect downtown Vancouver with VIA and the suburb of Richmond. The line is scheduled for completion in November 2009.
Housing and Population
• Downtown Vancouver has approximately 80,000 residents and is the third most densely populated downtown area in North America. The city has experienced significant residential condominium construction since 1997 following the relaxation of building height restrictions. There are currently 3,600 condominium units under construction in downtown Vancouver, of which approximately 80% are under contract.
• According to census data (last completed in 2006), the number of households in the Vancouver CMA increased 16% between 1996 and 2006 and is projected to increase 7% between 2006 and 2011. The trend towards condominiums is evidenced by the rapid increase in multifamily households, which rose 47% between 1996 and 2006. The 2006 Census showed that the average household size in the Vancouver CMA was 2.56, which is projected to decline to 2.49 by 2011. Several key population statistics are presented below.
9

Primary Market Area Greater Vancouver2006 Population by Age - PercentUnder 24 years 26% 30%25 to 34 years 18% 14%35 to 44 years 18% 16%45 to 55 years 15% 16%55 to 65 years 11% 11%Over 65 years 13% 13%
Median Age (in years) 38.5 37.4
2006 Population by Ethnic OriginCanadian Origins 7% 9%United States 2% 2%British Origins 30% 35%French Origins 4% 4%German Origins 5% 6%Other European/Eastern European Origins 17% 18%Southeast Asian Origins 9% 9%Chinese Origins 21% 13%Japanese Origins 1% 1%Korean Origins 1% 1%Middle Eastern Origins 2% 2%
Educational Attainment - 2006 CensusNo Certificate, Diploma or Degree 7% 7%High School Diploma 48% 51%Trades Certificate 3% 4%Non-University Education 7% 8%Some College, No Degree 3% 3%Bachelor's Degree 26% 22%Above Bachelor's Degree 6% 5%
Selected Population CharacteristicsPrimary Market Area and Greater Vancouver Area
The primary market area (“PMA”) for the luxury residences in the subject development comprises downtown Vancouver, West Vancouver, and North Vancouver.
Income Band Number % Number %Under $25,000 48,176 24% 179,975 24%$25,000 to $49,999 52,272 26% 199,360 26%$50,000 to $74,999 37,659 19% 154,330 20%$75,000 to $99,999 23,563 12% 100,785 13%$100,000 to $149,999 22,367 11% 84,820 11%$150,000 and over 17,197 9% 39,450 5%Total 201,234 758,720
Median Household Income2006 $56,678 $55,231
Average Household Income $79,920 $73,2582006
2011 Projection $94,606 $80,734
Primary Market Area Greater Vancouver
2006 Households by Household IncomeCity of Vancouver and Greater Vancouver Area
10

• Housing starts in greater Vancouver have averaged almost 14,000 annually over the last 10 years, peaking at 20,736 in 2008. However, starts in Q4 2008 were 30% below Q4 2007, signaling that 2009 will likely see a decrease in housing starts.
• The below graph reflects changes over time in Vancouver housing demand and pricing. Over the
last several years, demand for housing in Vancouver has been strong, with an average of 75% of new MLS listings resulting in sale and median home prices increasing 78.6% over the 5-year period between 2003 and 2008. During the same period, residential rental rates have increased approximately 24%, while rental vacancies decreased from 2% to 0.5%. However, as can be seen in the graph, the recent global economic turmoil has negatively affected the Vancouver housing market. In January 2009, home sales declined year-over-year by 58.1%, while overall benchmark prices as calculated by the MLSLink Housing Price Index, declined 10.9%.
11

• Despite the global financial crisis and its affect on the Vancouver housing market, the area remains
a fundamentally strong market for development due to its position as an international gateway market to North America (strong trade with Asian countries), growing focus on economic development and job creation, broad tourism appeal, and population growth (Vancouver experienced net migration of 30,000 people in 2008).
MARKET PLAN Hotel Demand for lodging in Vancouver is seasonal, with strong spring and summer demand comprising an ideal balance of corporate, leisure, and convention/group travelers. Leisure demand tapers off in late October due to colder weather and frequent rain; however, corporate and convention demand remains strong. Winter demand is generally soft and is driven primarily by corporate travelers. Despite its seasonal demand patterns, the Vancouver lodging market has historically performed at high occupancy levels. Between 2004 and 2008, the luxury and upscale hotels in downtown Vancouver achieved a 5-year average occupancy of approximately 74%. Given the strength of the lodging market and the hotel’s luxury brand affiliation, new luxury product, location in an iconic 60-story tower, and above-average room size, the hotel is projected to successfully penetrate existing luxury demand currently being accommodated at the high-end boutique and luxury hotels. In 2008, there were approximately 139,000 luxury room nights sold in downtown Vancouver at an average daily rate (“ADR”) of $225. In addition, there were approximately 919,000 upscale room nights sold at an ADR of $193 (see below chart). To achieve its projected occupancy of 75%, the hotel would need to capture 41,063 room nights, or 3.9% of existing demand.
12

ROOMS REVENUE
LUXURY COMPETITORSOpus Hotel 26,554 6,558,776Wedgewood Hotel 23,024 5,733,026Four Seasons Vancouver 89,206 18,911,672
Luxury Subtotal 138,784 31,203,474
Luxury Occupancy/Rate 68% $225
UPSCALE COMPETITORSPan Pacific Hotel 141,649 30,454,578Marriott Pinnacle 128,312 21,171,497Fairmont Hotel Vancouver 148,146 25,925,585Fairmont Hotel Waterfront 133,864 28,111,388Westin Bayshore 121,235 24,246,950Westin Grand 58,108 11,331,060Hotel Le Soleil 29,970 5,184,836Metropolitan Hotel 48,895 8,654,486Sutton Place Hotel 108,679 17,388,600
Upscale Subtotal 918,858 172,468,979
Upscale Occupancy/Rate 74% $188
TOTAL 1,057,642 203,672,453
TOTAL OCC/RATE 73% $193
OCCUPIED TOTAL
2008 Luxury/Upscale Demand SummaryOccupied Rooms and Revenue
In addition, due to its international luxury brand affiliation, the hotel is projected to induce new demand into the market via the brand’s marketing channels and customer relationships. Moreover, the hotel is expected to benefit from an increase in demand resulting from the VCEC expansion, the City of Vancouver’s renewed focus on economic development and job growth, and the heightened international awareness from the 2010 Winter Olympic Games. Overall, luxury and upscale lodging demand in downtown Vancouver is projected to increase at a CAGR of 2.1% between 2009 and 2016, compared to a historical CAGR of 1.7% between 2002 and 2008. A market supply and demand growth analysis is presented as Exhibit 2. Approximately 80% of the hotel’s demand will comprise transient (non-group) demand due to its urban location and limited meeting space. However, the hotel will also attract C-level business leaders and celebrity guests attending or presenting at a conference or convention at the VCEC. A demand analysis by market segment is presented below.
13

ROOMNIGHTS MIX
Transient Premium 4,106 10% Corporate 4,928 12% Special Corporate 8,213 20% Package 12,319 30% Other Discount 3,285 8%
Total Transient 32,850 80%
Total Group 8,213 20%
Total 41,063 100%
Luxury Hotel Demand Segmentation
Approximately $1.5 million will be spent in hotel sales and marketing prior to opening. Thereafter, approximately $1 million will be spent annually on sales and marketing activities. The sales strategy for penetrating existing luxury customers in the market comprises primarily direct business to business sales, local customer events, and print and online advertising in both local and source markets. The hotel’s sales staff will include a Director of Sales & Marketing, a sales manager, and a sales coordinator. These staff members will focus on building relationships with local meeting planners as well as convention and tourism leaders in the market. They will also focus on inducing new demand by leveraging existing brand relationships and marketing channels and supplementing this effort with a comprehensive hotel marketing and advertising campaign. The proposed sales and marketing budget for the first year of operation is presented below:
Expense% of
BudgetBudgeted
AmountSalaries and Wages 35% $350,000Brand Marketing & Group Fees 15% $150,000Loyalty Program 15% $150,000Print Advertising 10% $100,000Electronic Advertising 2% $20,000Trade Shows 4% $40,000Customer Events/Entertainment 10% $100,000Sales Collateral 5% $50,000Miscellaneous 4% $40,000
Total 100% $1,000,000
Hotel Sales & Marketing Budget
Residential Demand for housing units is generated by an increase in household formation in a market area. These increases may comprise new household formation within the existing population or in-migration of households from other areas. Demand for luxury residences is driven by the number of households in the market area having sufficiently high disposable income and/or net worth to support the purchase of a high-priced home.
14

Based on proximity and wealth profile, the primary market area (“PMA”) for the luxury residences in the subject development comprises downtown Vancouver, West Vancouver, and North Vancouver. In addition, demand for luxury units is also generated by wealthy buyers living outside of the area who are seeking a second home in an international gateway city such as Vancouver.
The City of Vancouver, especially the downtown core, is experiencing strong increases in both population and the number of households, trends which are expected to continue during the next five years. The area boasts a strong economic base, a variety of cultural and entertainment offerings, and popular recreational activities. Market research indicates that the specific location of the subject site located offers a number of advantages, including pedestrian friendly streets, ease of access to Vancouver services and amenities, a number of entertainment and shopping options, and proximity to the Coal Harbour waterfront.
Based on the urban location of the site, luxury brand affiliation, unit pricing, and services and amenities offered, buyers are likely to be 45 to 75 years old with high net worth and annual income greater than $150,000. The below age and income analysis completed by Real Estate Strategies shows that the total universe of target households is approximately 8,200. The subject development would need to capture 1.7% of these households to sell all of the proposed units.
15-24 25-44 45-64 65-74 75+Income BandUnder $25,000 4,894 17,262 13,268 5,656 8,009$25,000-$49,999 2,746 24,611 15,759 5,209 5,447$50,000-$74,999 897 18,411 13,095 3,412 2,574$75,000-$99,999 283 10,672 9,184 1,952 1,474$100,000-$149,999 126 9,825 10,976 1,582 541$150,000+ 50 4,073 7,165 1,053 541
Total 8,996 84,854 69,447 18,864 18,586
Households by Age and Household IncomePrimary Market Area
Age Range
Source: Real Estate Strategies, Statistics Canada
In addition to demographic analysis, it is important to gather psychographic data beyond age and income, to understand the comprehensive demand picture. This involves the study of psychological and sociological characteristics of potential consumers (i.e., their values, ideological beliefs, attitudes and emotional responses) and how these characteristics affect purchasing decisions. The inclusion of psychographic analysis will increase the total universe of potential consumers, as some buyers will fall outside of the age and income range defined above.
Overall, considering both demographic and psychographic profiles, target buyers include the below segments. The unit type(s) ideal for each segment are presented in parentheses.
• Wealthy retirees and empty nesters wishing to downsize from larger single-family homes in nearby suburbs (2 bedroom, 3 bedroom, or penthouse units)
• Divorcees and singles seeking a low-maintenance lifestyle near social and cultural activities (1 bedroom or 2 bedroom units)
• Young couples with dual incomes and few or no children seeking an urban lifestyle and the cache of a branded luxury residence (2 bedroom, 3 bedroom, or penthouse units)
15

• International consumers who travel to Vancouver frequently and desire a pied-a-terre in the city (1 bedroom or 2 bedroom units)
• Wealthy Canadians seeking a second home in an urban west coast location (all unit types)
Corporations with long-term executive • housing needs (primarily 1 bedroom units)
e ment es, and pied-a-
e
an experienced residential
In ,
ertising in print publications with affluent readership such as the Robb Report, Architectural Street Journal, and airline in-flight magazines.
• clusive
age
Th condominium unit mix has been designed with these target segments in mind. The developoffers 40 one bedroom units, which are expected to appeal primarily to singles, divorceterre buyers. The 84 two-bedroom units and the 15 three-bedroom units are designed to appeal to retirees, empty-nesters, second home buyers, and young couples. The 11 sub-penthouse and penthousunits are designed to attract extremely wealthy buyers who desire the cache of a penthouse unit locatedin an iconic building atop a 5-star luxury hotel. These buyers will primarily be second home purchasers, many of whom are expected to be sourced internationally.
Over $15 million has been budgeted for residential sales & marketing (in addition to $33.5 million in brokerage and brand license fees). The residences will be marketed bybrokerage firm offering: 1) extensive experience selling luxury condominium projects, and 2) familiarity with the Vancouver market. Sales activities will take place primarily in the local sales center, which will be constructed immediately upon equity funding. The luxury center will include a 2,000 SF model residence, design and décor center, and a 6-foot scale model of the development. addition, 2-day sales campaigns will be held in the following markets: Toronto, Montreal, New YorkSan Francisco, London, Dubai, Rio de Janeiro, Singapore, Hong Kong, Seoul, Shanghai, Beijing, and Tokyo.
Marketing and advertising efforts will also feature:
• AdvDigest, Cigar Aficionado, Wine Spectator, Wall
• Upscale customer events (wine and scotch tastings, exclusive grand opening gala, etc.), and targeted direct mail sent to luxury brand database listings, local residents in affluent neighborhoods, frequent Vancouver luxury travelers, and other customer lists.
Comprehensive marketing to local and source market real estate brokers including exevents, private tours, and targeted sales incentives.
• Direct sales to local corporate executives, sports teams, and music and film industry to encourcelebrity purchases.
• Extensive public relations campaigns to enhance editorial and media coverage.
16

The residential sales and marketing budget is presented below.
Expense% of
BudgetBudgeted
Amount
Sales Center Construction 25% $3,750,000International Customer Events 20% $3,000,000Local Customer Events 16% $2,400,000Staffing (excluding broker fees) 10% $1,500,000Print Advertising 10% $1,500,000Brochures 5% $750,000Direct Mail 5% $750,000Miscellaneous 4% $600,000Overhead 3% $450,000Trade Shows 2% $300,000
Total 100% $15,000,000
Residential Sales & Marketing Budget
COMPETITION
Hotel
Primary Competitors The primary competitive hotel supply consists of 3 hotels representing 556 rooms. These hotels are the highest-rated in Vancouver and are projected to compete directly with the subject hotel based on their downtown locations, healthy rate positioning, and upscale product offerings.
• The 97-room Opus Hotel, located 0.8 miles south of the subject hotel in the Yaletown district, is the newest hotel in the competitive set (opened January 2002) and offers a trendy upscale room product. Despite its rate positioning at the top of the market, the property is not considered a luxury product, as it does not offer luxury finishes, services, or amenities. The Opus Hotel’s unique Yaletown location allows it to attract a significant amount of entertainment demand; however, the subject hotel’s location proximate to shopping, the CBD, and the waterfront is considered superior. The property is expected to compete with the subject hotel for entertainment and high-rated leisure demand.
• The 83-room Wedgewood Hotel, located 0.3 miles south of the subject hotel in the heart of the CBD, is the smallest and highest-rated hotel in the competitive set. The property was built as an apartment building and converted to a hotel in 1984. The Wedgewood recently completed a soft goods renovation of its guestrooms and an expansion and comprehensive renovation of its four penthouse suites. The Wedgewood Hotel offers a traditional, old-world luxury style in a small boutique hotel setting; however, its appeal is expected to be limited compared to the subject hotel’s world-class brand, service, and contemporary luxury style. The hotel reportedly accommodates a balanced mix of corporate and leisure transient demand and is expected to compete with the subject hotel for high-rated business in these segments due to its CBD location.
• The 376-room Four Seasons, built in 1976, is one of four luxury-branded hotels in Vancouver. However, the hotel’s product has deteriorated due to lack of capital investment, which has limited its rate potential. The 28-story hotel is located in the CBD and offers city views from most of its
17

guestrooms and harbour views from a limited number of suites. The property reportedly has a significant mix of high-rated corporate and leisure demand from the United States. The Four Seasons will be competitive with the subject hotel based on its strong luxury brand and its location within the CBD. Specifically, the property is expected to compete with the subject hotel for small group and high-rated corporate and leisure demand, primarily from the United States.
Secondary Competitors
The secondary competitive set consists of 9 hotels representing 3,406 rooms. These hotels are competitive with the subject hotel due to their locations within the trade area and their upscale product offerings. However, the hotels’ large size, different market orientations, and/or inferior product quality preclude them from being considered as primary competitors. A brief description of the secondary competitors is presented below.
• The 504-room Pan Pacific and the 489-room Fairmont Hotel Waterfront are located approximately 0.4 miles east of the subject hotel on the Burrard Inlet. In addition, the 511-room Westin Bayshore is located approximately 0.4 miles north along the inlet. Due to their waterfront locations and superior views, these hotels capture a significant share of high-rated leisure demand. The hotels also accommodate considerable group demand due to their large meeting facilities and locations proximate to the VCEC. The subject hotel is expected to compete with these hotels primarily for high-rated leisure demand and, to a lesser extent, small group demand. In addition, the subject hotel is expected to compete directly with the Fairmont’s 46 Gold Rooms, which reportedly achieve a 65% occupancy at approximately $295-300.
• The 434-room Marriott Pinnacle, located approximately 0.2 miles northeast of the subject hotel near the waterfront, reportedly accommodates more United States customers than any other hotel in the competitive set. Despite its upscale product, the hotel’s ADR lags the competitive set due to its accommodation of airline and contract tour groups. The Marriott is expected to compete on a secondary level with the subject hotel for U.S. leisure and corporate demand during the off-peak season.
• The 556-room Fairmont Hotel Vancouver, which opened in 1939, is the oldest and largest hotel within the competitive set and is considered the city’s historic “grand dame”. The hotel operated as an independent for most of the years leading up to its restoration and conversion to a Fairmont in 1996. While the Fairmont’s primary market segment is large group demand, its 36 Fairmont Gold rooms attract high-rated corporate and leisure transient demand throughout the year. These upgraded rooms reportedly achieve an 80% occupancy at approximately $250-255 and are expected to be directly competitive with the subject hotel.
• The 397-room Sutton Place Hotel is located 0.25 miles south of the Hotel. The property is co-managed with the adjacent 164-unit La Grande Residence furnished apartment tower. Sutton Place completed a soft goods renovation of its hotel guestrooms in 2005 and the La Grande Residence in 2006. Due to the hotel’s 5-star rating, high mix of suites and apartments, and media relationships, Sutton Place accommodates a significant share of entertainment/film industry demand. In addition, the hotel has a high mix of corporate demand due to its location in the CBD. The subject hotel is expected to compete with Sutton Place for high-rated entertainment and corporate demand based on that property’s proximate location, upscale product, and entertainment demand base.
• The 199-room Westin Grand, the 119-room Hotel Le Soleil, and the 197-room Metropolitan Hotel are competitive with the subject hotel due to their small boutique positioning and locations in or
18

near the CBD. Due to their all-suite products, the Westin and Hotel Le Soleil are successful in attracting moderate and high-rated leisure demand. The Metropolitan Hotel was built as a Mandarin Oriental and, although its product has deteriorated, still attracts some high-rated leisure demand. Therefore, these properties are expected to compete with the subject hotel for leisure demand during the off-peak season.
Additions to Hotel Supply
• The 119-room Shangri-La Hotel is under construction on a site adjacent to the subject hotel. The property will feature 3,800 SF of meeting space, a 6,800 SF spa, a 3,500 SF fitness center, and a 3-meal restaurant. The Shangri-La will feature high-end finishes and amenities and offer world-class luxury service. As the newest branded luxury product in the market and due to its low room count, the Shangri-La is expected to achieve the highest rate in the market ($290-295). Approximately 300 condominium units will be located above the hotel, which is scheduled to open in early 2009.
• The 77-room Loden Hotel is under construction approximately 2 blocks north of the subject hotel. The boutique hotel will be operated by Kor Hotels. Although the Loden Hotel is not a luxury product, it is expected to be competitive with the subject hotel on a secondary level due to its upscale product and proximity. Approximately 150 condominium units will be located above the hotel, which is scheduled to open in early 2009.
• The 415-room Fairmont Pacific Rim is under construction approximately 0.4 miles northeast of the subject hotel adjacent to the VCEC expansion site. The property will feature a Willow Stream Spa, a 4,000 SF fitness center, 2 restaurants, a lobby lounge, and an outdoor pool. Details on the hotel’s meeting facilities are not yet available. Although Fairmont is not considered a world-class luxury brand, the Fairmont Pacific Rim is expected to offer more upscale finishes than the two existing Fairmont hotels in the market and appeal to a higher-end traveler. The property’s waterfront location will afford it superior views and proximity to the cruise port and VCEC. Approximately 175 condominium units will be located above the hotel. The property is scheduled to open in July 2009.
Supply Summary and Comparison
Overall, the subject development offers a superior product to existing hotels in the market and is better positioned to attract luxury demand. The Shangri-La is expected to be the subject hotel’s closest competitor and in quality, location, and brand awareness. Furthermore, it should be noted that the hotel’s mix of large suites is significantly higher than those of its competitors, giving it an advantage in attracting high-end leisure demand. A comprehensive competitive analysis is presented below followed by a suite mix summary.
19

Number of Rooms 2008 ADR Location Views
Product Quality Suite Mix Service Amenities
Brand Awareness Overall
Opus Hotel 97 $245-249
Wedgewood Hotel 83 $245-249
Four Seasons Hotel 376 $210-214
Fairmont Waterfront 489 $210-214
Pan Pacific Hotel 504 $215-219
Shangri-La (opens 2009) 119 NA
Fairmont Pacific Rim (opens 2010) 415 NA
Total Rooms/Average Rating 2,083
= inferior to subject property, = comparable to subject property, = superior to subject property
Hotel Competitive Comparison to Subject Development
Total RoomsSuites
650+ SFSuites 900+
SF150 33 33
Mix 22% 22%
Four Seasons 376 55 12Mix 15% 3%
Shangri-La 119 24 1Mix 20% 1%
Wedgewood 83 20 2Mix 24% 2%
Opus 97 2 0Mix 2% 0%
Vancouver Competitor Suite Mix
Subject Hotel
Residential The five residential competitors comprise two luxury branded condominium projects each with a luxury hotel component, one non-branded condominium project with a boutique hotel component, and two non-branded condominium projects with no hotel component. A summary of each competitor is below and is adapted from a residential market study performed by Real Estate Strategies, Inc. Fairmont Pacific Rim Located approximately 0.4 miles northeast of the subject development, the Fairmont Pacific Rim will offer residents dramatic views of Coal Harbour and the North Mountains. When completed, this condominium development will contain 175 residential units situated above a five-star Fairmont Hotel. Amenities that are proposed include 24-hour concierge service, a heated outdoor swimming pool and sun deck, a fitness center, a full-service spa managed by Fairmont Resorts, a multi-function room, a business center and a multi-media theater. In addition, residents will have access to hotel services that will include limousine service, housekeeping and in-room dining. Each unit will have garage parking for one or two cars. The property will have optional valet parking and keyed elevator access to individual residential floors of the condominium tower.
20

The Fairmont will also offer luxury finishes with top-of-the-line kitchen appliances and cabinets. The units are offered with a choice of hardwood floors in the living areas and carpet in the bedrooms. All units will feature master marble baths with soaking tubs and oversized glass-enclosed showers. A limited number of options and upgrades are available.
Fairmont Pacific Rim has been positioned in the market as the most luxurious living in Vancouver. The location of the property overlooking Coal Harbour will offer residents some of the most spectacular views in the city. The price point of this development reflects this competitive advantage over the competition. The main drawback of the Fairmont Pacific Rim is that its location is adjacent to the new VCEC; therefore, traffic and congestion will be issues for residents. Also, the project is not in close proximity to Vancouver’s prime retail shopping along Robson Street. The unit mix, size and fee structure of units at the Fairmont are summarized in the chart below.
Source: Real Estate Strategies, Inc.
The Fairmont Pacific Rim has 160 of the 175 units under contract. The project is under construction with anticipated move-in date of January 2010.
Shangri-La Located directly across West Georgia from the subject development site, the proposed Shangri-La Hotel and Residences encompasses almost an entire city block. The building will be 61 stories in height, making it the tallest in Vancouver. It will include commercial spaces for an Urban Fare grocery store, which will be a convenient amenity for residents of the subject development. Like the Fairmont Pacific Rim and the subject development, this property incorporates residential condominiums in a single structure with a five-star hotel. Owners of the condominiums will have full use of the amenities of the hotel including 24-hour concierge services, a heated outdoor swimming pool, health club, full-service spa, business center, library, game room, media room, in-room dining and housekeeping. The first 15 stories of the building will contain the hotel, and the 300 condominiums will be located on floors 16 through 61. Unlike other competitors, the Shangri-La will have 171 units that are live/work spaces that will allow owners to operate a small business from their condominium unit. Like the Fairmont Pacific Rim and the subject development, the Shangri-La will have luxury interior finishes and features with top-of-the-line kitchen appliances and cabinets. The units are offered with a choice of hardwood floors in the living areas and carpet in the bedrooms. Master bedrooms will have
21

marble baths with soaking tubs and oversized glass-enclosed showers. A limited number of options and upgrades are offered. The unit mix, size and fee structure of the units at the Shangri-La are summarized in the chart below.
Source: Real Estate Strategies, Inc. The Shangri-La began selling condominiums in January 2005. Since that time, all but a few of the units have been sold, with an early absorption rate of approximately 15 units per month. The project is under construction with a completion scheduled for early 2009.
Jameson House Located on West Hastings Street between Howe and Hornby Streets, the Jameson House will be 38 stories high and will contain 150 residential units. Building amenities will include 24-hour concierge and complimentary membership at the adjacent Terminal Club, which includes a full-service spa, fitness facility, restaurants, meeting rooms, billiard room and game room. The Jameson House building will also contain a meeting room and media room for resident use. Units on higher floors will feature views of the water and North Mountains as well as downtown Vancouver. The location is convenient to shopping along West Hastings Street and is only a few blocks from the Robson Street shopping district. The Jameson House offers upscale finishes, which are not as luxurious as the finishes at the Fairmont Pacific Rim or the Shangri- La. Kitchens will have glass cabinetry with Sub Zero refrigerators and Gagggenau ovens, range tops and dishwashers. The master baths will be stone and will incorporate soaking tubs and glass-enclosed showers. Standard units will have nine-foot ceiling heights, with the penthouse units offering ten-foot ceilings. The floors will be travertine tile with wall-to-wall carpet in the bedrooms. Available upgrades include travertine flooring in the bedrooms and a built-in kitchen espresso coffee machine.
22

The unit mix, size and fee structure are summarized in the chart below.
Source: Real Estate Strategies, Inc. Sales of condominiums at Jameson House commenced in March 2006. Since that time, 144 condominiums have been placed under contract. Early absorption rates were strong, averaging approximately 20 units per month. However, with the recent economic uncertainty, sales have slowed. Although construction has commenced, this project has reportedly lost a portion of its financing and is on hold until further financing is secured. The project’s previously announced move-in date was Fall 2009; however, the project has been delayed. An updated completion date is not available.
L’Hermitage en Ville Located at the corner of Robson and Richards Streets, the proposed L’Hermitage en Ville is the only comparable development located in Yaletown. Like the subject development, this project is being developed with a hotel component. This project is not considered to be ultra luxury; however, it is included as a competitor due to its hotel component. The 31-story building will contain 200 condominium units. The hotel will be a 36-room boutique property. The building will include commercial space for retail stores on the first two levels. Like the other developments with hotel and condominium components, the owners of the condominium units will have access to the hotel’s amenities and facilities, including two rooftop gardens, a fitness center, a spa, a lounge, and 24-hour concierge service. The interior finishes of the L’Hermitage en Ville are proposed to be upscale, but not quite meet the luxury standard of aforementioned competitors. The kitchens will feature Sub Zero and Bosch kitchen appliances, Eggersmann cabinets, and polished stone countertops. The units are being offered with a choice of hardwood floors in the living areas and wall-to-wall carpet in the bedrooms. The units will include white marble or limestone tile bathrooms with the master bathrooms incorporating soaking tubs and glass-enclosed showers. Nine-foot ceiling heights are being provided in regular condominium units, and there will be 10.5 foot ceiling heights in the penthouse units. Limited upgrades are available.
23

The unit mix, size and fee structure are summarized in the chart below.
Source: Real Estate Strategies, Inc. Sales of units at L’Hermitage en Ville commenced in March 2005. Since that time 185 condominium units have been sold, with an early absorption rate of 10-13 units per month. The project was completed in June 2008. Three Harbour Green Located at the corner of Cordova and Thurlow Streets, Three Harbour Green will be the final downtown waterfront development along Coal Harbour. The 31-story building will contain 81 luxury residences and is the third residential tower in the Harbour Green development. (All 71 units in Harbour Green Place Two were sold in four weeks.) Although detailed floor plans and pricing is not yet available, the building will offer two to four bedroom units ranging from 1,820 SF to 3,670 SF. Prices range from $1.98 million ($1,088 PSF) to $7.55 million (2,057 PSF). Three Harbour Green will feature luxury interior finishes with top-of-the-line kitchen appliances and dual-toned cabinetry. All units will offer floor to ceiling windows and unobstructed views of Coal Harbour and the North Mountains. Standard flooring includes porcelain tile and wool carpets (hardwood floors are an upgrade). Bathrooms feature Italian-designed vanities, free-standing or deck-mounted tubs and heated basalt or marble tile flooring. The units will also offer Lutron controlled lighting systems, and covered balconies accessible through the living or family rooms. Services will include 24-hour concierge services, billiards, squash, and golf rooms, indoor swimming pool, health club, lounge, and media room. The main drawback of this property is its location (as with the Fairmont Pacific Rim) proximate to the new VCEC and cruise port; therefore, traffic and congestion will be issues for residents. Also, the project is not in close proximity to Vancouver’s prime retail shopping along Robson Street. Approximately 20% of Three Harbour Green’s 81 units have been sold. The property is under construction with an estimated completion date of mid-2012. Additions to the Condominium Supply Due to the recent moratorium on high-rise residential construction in the downtown area, no additional luxury projects are currently in the planning stages.
24

Supply Summary and Comparison Based on the comparable properties surveyed in the primary market area, there is strong long-term demand for ultra luxury condominiums such as those in the subject development. Properties that are currently offered for sale have been largely absorbed. The five properties analyzed offered a total of 906 units, but only 103 units remain available for sale (not including re-sale availability). It is likely that all but the Three Harbour Place units will be sold by the time the subject development opens in 2012. Furthermore, the subject property is considered to be superior to three of the five competitors and comparable to the Fairmont Pacific Rim and Shangri-La (which have a combined 18 units available for sale). A comprehensive comparison analysis is presented below.
Units Available
Average Price PSF Location Views Finishes Floorplans Services Amenities Access Overall
Fairmont Pacific Rim 15 $1,600
Shangri-La 3 $1,200
Jameson House 6 $1,000
L'Hermitage en Ville 15 $700
Three Harbour Place 64 $1,450
Total Available/Average Rating 103 $1,329
= inferior to subject property, = comparable to subject property, = superior to subject property
Residential Competitive Comparison to Subject Development
PRICING
Hotel Based on the subject hotel’s competitive position as outlined in the comparison in the Competition section, the property is projected to achieve the highest average daily rate (“ADR”) in the market upon stabilization. This projected premium is based primarily on the following factors: • The subject hotel will be the newest luxury product in the market with finishes and quality above
or at par with existing competitors in the market. • The subject hotel will benefit from an internationally recognized luxury brand. • The subject hotel will accommodate primarily transient demand, which is generally higher-rated
than group demand. • The subject hotel will benefit from its low room count, allowing it to minimize discounting and
accommodate demand selectively. A demand and rate segmentation analysis is presented below followed by a qualitative description of segment positioning. See Exhibit 5 for a competitive demand and rate segmentation.
25

ROOMNIGHTS MIX RATE (C$)
Transient Premium 4,106 10% $500 Corporate 4,928 12% $400 Special Corporate 8,213 20% $215 Package 12,319 30% $295 Other Discount 3,285 8% $225
Total Transient 32,850 80% $309
Total Group 8,213 20% $260
Total 41,063 100% $300
Total 75% $300Weekday 75% $280Weekend 76% $345
Luxury Hotel Demand And Rate Segmentation
The subject hotel’s ADR is projected to be $300 in 2008 $. (All amounts are presented in Canadian $.) The projected ADR is positioned approximately $50 above the 2008 ADR ($250) for the 83-room Wedgewood Hotel and the 97-room Opus Hotel, the highest-rated competitors in the market. The rate premium is supported by the subject hotel’s international luxury brand affiliation, its new luxury rooms product (including 20% Club level rooms), its high percentage of large suites (22%), and its high-rise location offering superior views of the water, mountains, and surrounding skyline. The subject hotel’s ADR is positioned $90 above the 2008 ADR for the 376-room Four Seasons Hotel despite its internationally recognized luxury brand. This premium is based on the subject hotel’s smaller size (limiting discounting) and superior product quality compared to the older Four Seasons, whose product has been deteriorating due to lack of investment.
During peak season (May through October) when luxury demand is highest, the subject hotel is projected to achieve a significant average rate premium (approximately $100) over the competitive set, which is comprised primarily of larger upscale hotels. A premium of approximately $60 above the competitive set is projected during the remainder of the year due to rate compression as downtown hotels offer discounted rates during lower demand periods.
The subject hotel’s corporate/benchmark rate is projected to be $400, which is approximately $30-50 above quoted rates for the Opus Hotel, Wedgewood Hotel, and Four Seasons. This segment primarily comprises high-end corporate demand and high-rated leisure demand during the peak season. The premium is based on the hotel’s lower room count and high mix of suites, which achieve significantly higher average rates in the peak season than standard rooms.
The subject hotel’s special corporate rate is projected to be $215, which is positioned approximately $5-15 above the estimated special corporate rates for the Wedgewood Hotel and Opus Hotel and approximately $25 above the estimated special corporate rates for the larger upscale competitors in the market. Special corporate demand is projected to serve as the subject hotel’s base business during the off-peak season.
26

The subject hotel’s group rate is projected to be approximately $260. Groups are projected to comprise small corporate executive and film industry gatherings and some social group demand.
Average Rate Growth A statistically significant relationship has been identified between year-over-year growth in airline passenger counts at Vancouver International Airport (“VIA”) and year-over-year growth for Vancouver hotel rates. (See Appendix I for greater detail on the statistical analysis.) The regression equation is presented below:
YOY Change in Vancouver Hotel Rates = 0.632*YOY Change in VIA Passenger Counts + 0.002 Based on Transport Canada’s annual growth projections for Pacific Region airline passenger counts between 2009 and 2020, Vancouver’s annual hotel rate growth is expected to average 2%. Therefore, the subject hotel’s ADR is projected to increase by 2% annually. The below table presents the annual historical and projected change in VIA passenger counts and historical and predicted Vancouver hotel rates.
Year
Historic and Forecasted VIA
Passenger Counts
Historic and Predicted
Average Hotel Rate Growth
1995 10.9% 8.5%1996 16.9% 9.7%1997 5.6% 8.9%1998 4.7% 1.6%1999 1.9% 3.1%2000 1.4% 0.3%2001 -3.5% -0.5%2002 -3.9% -3.7%2003 -3.7% -5.5%2004 9.8% 2.4%2005 4.4% 2.1%2006 3.1% 4.3%2007 3.4% 4.1%
Forecasts Below
Predictions Below
2008 2.0% 1.5%2009 2.0% 1.5%2010 5.7% 3.8%2011 2.7% 1.9%2012 2.7% 1.9%2013 2.7% 1.9%2014 2.7% 1.9%2015 2.7% 1.9%2016 2.7% 1.9%2017 2.7% 1.9%2018 2.7% 1.9%2019 2.7% 1.9%2020 2.7% 1.9%
Avg Projected Hotel ADR Growth Rate 2.0%
Sources: Transport Canada; PKF Trends in the Canadian Hotel Industry
27

A graphical depiction of the relationship of year-over-year changes in VIA passenger counts and Vancouver hotel rates follows.
Change in VIA Passenger Counts and Vancouver Hotel Rates
-10.0%
-5.0%
0.0%
5.0%
10.0%
15.0%
20.0%
1995
1997
1999
2001
2003
2005
2007
2009
2011
2013
2015
2017
2019
Year
% C
hg
Vancouver International AirportPassengersAverage Hotel Rate Growth
Predictions
Residential
The luxury branded condominium units located in the subject development is projected to achieve an average sales price of $1,450 per square foot. (All amounts are presented in Canadian $.) This is positioned above the average sales price for the 300-unit Shangri-La of $1,200 per square foot due to the subject development’s higher mix of large units and superior views (the subject development blocks much of the Shangri-La’s harbour view). The projected price is higher than the average prices for the Jameson House and L’Hermitage en Ville due to their lower quality finishes, lack of brand affiliation, and higher mix of small units.
The subject development’s projected price is positioned below the sales price for the Fairmont Pacific Rim ($1,600 per square foot) primarily due to that development’s sales period occurring during the peak market and its waterfront location and direct harbour views.
The projected average price is similar to the average price for the Three Harbour Place development due to its similar sales period (occurring in a down and recovering market) and similar quality level. Despite the subject property’s brand affiliation and hotel amenities, limiting the subject property’s ability to achieve a premium over Three Harbour Place is its location farther from the waterfront.
A standard pricing summary for the subject development is presented below.
28

Unit Configuration # of UnitsAverage Size
(SF) Total SF Average Price Total Proceeds Price PSF
1 Bedroom, 1 Bath City View 10 1,450 14,500 $1,698,000 $16,980,000 $1,1711 Bedroom, 1 Bath Harbour View 5 1,450 7,250 $2,000,000 $10,000,000 $1,3791 Bedroom, 1 Bath, Den, City 13 1,750 22,750 $2,000,000 $26,000,000 $1,1431 Bedroom, 1 Bath, Den, Harbour 12 1,750 21,000 $2,400,000 $28,800,000 $1,3712 Bedroom, 2 Bath, City View 15 1,950 29,250 $2,500,000 $37,500,000 $1,2822 Bedroom, 2 Bath, Harbour View 15 1,950 29,250 $2,800,000 $42,000,000 $1,4362 Bedroom, 2.5 Bath, Den, City 24 2,300 55,200 $3,180,000 $76,320,000 $1,3832 Bedroom, 2.5 Bath, Den, Harbour 30 2,300 69,000 $3,500,000 $105,000,000 $1,5223 Bedroom, 2.5 Bath, Den, City 7 2,725 19,075 $3,800,000 $26,600,000 $1,3943 Bedroom, 2.5 Bath, Den, Harbour 8 2,725 21,800 $4,100,000 $32,800,000 $1,505Sub Penthouse - City View 4 3,100 12,400 $5,500,000 $22,000,000 $1,774Sub Penthouse - Harbour View 3 3,500 10,500 $6,000,000 $18,000,000 $1,714Penthouse - City View 2 4,000 8,000 $7,000,000 $14,000,000 $1,750Penthouse - Habour View 1 4,000 4,000 $8,500,000 $8,500,000 $2,125Grand Penthouse - Harbour View 1 6,025 6,025 $14,000,000 $14,000,000 $2,324
Total 150 2,200 330,000 $3,190,000 $478,500,000 $1,450
Luxury Residences ProjectPricing Summary
The subject development will offer custom upgrades; however, it is currently unclear whether the developer will be able to sell these upgrades at a premium to cost. Therefore, they have not been included in the pricing analysis. The average projected price is supported by the findings of a multivariate regression analysis, which shows a statistically significant relationship between a) Greater Vancouver population and Vancouver average income per tax filer and b) average condominium (apartment) pricing in the Primary Market Area (See Appendix II for a detailed statistical analysis). The regression equation is presented below: Average Condominium Price=5.845*Average Income Per Tax Filer + 0.19*Greater Vancouver Population - 370983.888
Based on the Province of British Columbia’s population forecasts for Greater Vancouver and estimated changes in income per tax filer, the average sales price for condominiums is expected to range between $349 and $402 per square foot between 2010 and 2013 when the subject development will be in the sales period. Between 2005 and 2008, competitive luxury sales prices have achieved significant premiums over the average condominium sales price on a price per foot basis, ranging from 322-460%. Applying the average premium of 375% to future projections results in an average luxury sales price of $1,405 per square foot. To achieve the subject development’s projected sales price of $1,450 per square foot, a luxury premium of 387% must be applied. This premium is well within the range of luxury premiums realized in recent years. Furthermore, the subject development’s high mix of large units further justifies an increased premium above the 375% average.
29

The below table presents the historical and projected Greater Vancouver population and average income per tax filer and expected condominium prices.
Year
Greater Vancouver Average Income
per Taxpayer
Total Greater Vancouver Population
Primary Market Area Average
Condominium Price (Annual Avg)
Per Square Foot Estimate (based on
1,200 SF average size)
Recent Average Competitive Luxury Sales
PriceLuxury
Premium1994 40,379 1,797,815 198,391 $165 1995 37,827 1,851,623 191,667 $160 1996 29,002 1,906,500 197,565 $165 1997 29,429 1,954,830 200,179 $167 1998 29,664 1,984,798 191,825 $160 1999 30,830 2,012,410 190,036 $158 2000 32,770 2,040,036 189,544 $158 2001 32,691 2,073,662 196,916 $164 2002 32,544 2,102,244 222,629 $186 2003 47,358 2,128,965 255,714 $213 2004 49,857 2,153,998 301,753 $251 2005 52,921 2,188,573 342,878 $286 $1,314 460%2006 57,246 2,221,613 410,031 $342 $1,200 351%2007 61,000 2,249,725 459,019 $383 $1,230 322%2008 63,000 2,293,438 433,121 $361 $1,322 366%
2009 60,000 2,333,513 423,203 $353 $1,365 387%2010 58,000 2,373,933 419,195 $349 $1,352 387%2011 60,000 2,414,772 438,646 $366 $1,415 387%2012 62,000 2,454,686 457,922 $382 $1,477 387%2013 65,000 2,494,292 482,984 $402 $1,558 387%2014 70,000 2,533,976 519,751 $433 $1,676 387%2015 72,000 2,573,727 538,995 $449 $1,738 387%2016 74,000 2,613,470 558,239 $465 $1,800 387%2017 77,000 2,652,982 583,283 $486 $1,881 387%2018 75,000 2,692,324 579,070 $483 $1,868 387%2019 73,000 2,731,391 574,805 $479 $1,854 387%2020 78,000 2,770,030 611,373 $509 $1,972 387%
Average Luxury Premium 2005 - 2008 375%Range of Premium 2005 - 2008 322%-460%Premium Applied 387%Average Luxury Projection during Sales Period $1,450
Sources: BC Stats, Real Estate Board of Greater Vancouver MLSLINK HPI
Projections Below
Condominium association costs are projected to be $3.5 million in 2008 $ with a 5% annual increase. This represents $0.88 per square foot per month. This compares to $0.55 per square foot for the Shangri-La and the Fairmont Pacific Rim and $0.75 for Three Harbour Place. The higher costs are deemed reasonable due to the subject development’s superior brand, amenities, and services.
MANAGEMENT PLAN IronGate is a Northern Virginia-based investment fund that partners with local developers in international gateway cities to develop mixed-use projects. Most of the company’s projects feature a luxury hotel component. IronGate has invested in real estate developments in the United States, Canada, Mexico, Singapore, Hong Kong, and the United Kingdom and has generated returns for investors averaging between 15% and 35%. IronGate’s executive team comprises four principals, each of whom has a minimum of 15 years in luxury real estate development, operations, and transaction experience. Specifically, two of the principals have served as both entrepreneurs and corporate executives involved in the development, operation, and asset management of luxury hotels. The remaining principals have significant
30

experience in the development and sales and marketing of luxury for-sale residential condominium developments. IronGate controls the 0.6-acre site upon which the subject development is to be constructed and will contribute at minimum the land and entitlement costs to the project. IronGate is seeking joint venture partners to contribute the remaining equity needed for the subject development. IronGate will enter into joint venture agreements with the equity partners. Upon the execution of these agreements, a board of directors will be formed comprising members of each equity investor proportionate to equity interest. The board of directors will appoint IronGate as the managing member, subject to certain conditions and controls by the board. In this capacity, IronGate will be responsible for management decisions involving the project including oversight of development activities, the residential sales & marketing effort, and asset management duties for the investment. Major financial and investment decisions for the project will be made by the board of directors with recommendations from IronGate. These decisions include: 1) entering into or refinancing any loan encumbering the property including construction financing, 2) changes to the scope of the project and any major changes to the development budget (over $1 million and not including application of contingency funds), 3) changes to the capital structure, 4) selection, termination, or replacement of major vendors (i.e., general contractor, hotel/residences brand, sales broker, architect), 5) any bulk sale of residential units (more than 5 units), 6) major changes to the pricing of residential units, 7) hotel capital investments over $1 million, and 8) sale of the hotel/exit strategy. Entitlements for the site have already been secured which allow for the 60-story tower containing a 150-room luxury hotel and 150 luxury residences. A world-renown architect has been selected, and design documents are currently being drafted. General contractors are currently being interviewed, and a selection should occur in the near term. All candidates have experience in the Vancouver market and relationships with local building officials. Once chosen, IronGate will have weekly meetings with project managers to discuss status and cost and completion forecasts. Several luxury hotel brands have expressed interest in managing the hotel and condominiums and providing a brand license for the condominiums. Once selected, the manager will be involved in the project design process on a consultative basis, as the building will be required to meet the brand’s design standards. Over time, the management company will be responsible for the day to day operation of the hotel and the management of the condominium association. In its capacity as hotel manager, it will hire and manage staff, perform hotel sales & marketing duties, manage guest services and relations, maintain the hotel building and grounds, generate hotel budgets and forecasts for partner review and approval, and distribute income to IronGate (which income IronGate will be responsible for distributing to joint venture partners as required in the joint venture agreements). Bi-annual operations meetings will be held between IronGate and the hotel management company to discuss financial performance and capital expenditure plans. In its capacity as condominium association manager, the management company will hire and manage staff, provide association governance support, maintain common areas, provide services to residents, and generate budgets and forecast for association board review and approval. IronGate will control the board of the residential association until 50% of the units have been transferred. The joint venture partners will be responsible for all residential sales and marketing, as luxury brands do not typically offer sales & marketing services. The partners will sell the residences under a license from the luxury brand, which will provide brand training and access to brand marketing tools.
31

IronGate, as managing member, will be responsible for generation and approval of all buyer disclosure statements and sales oversight. As previously mentioned, a residential sales broker will be retained to generate and implement a strategic sales and marketing plan for the residences similar to the one presented on in the Market Plan section of this report. IronGate will hold quarterly sales strategy meetings with the broker to discuss sales progress and strategy.
FINANCIAL MANAGEMENT PLAN Development Budget The project development budget was generated using IronGate’s history of developing comparable projects and was adjusted based on comments by the project architect and multiple general contractor candidates. Development costs for the project are projected to total $362.8 million. Of this amount, $251.6 million, or 69%, is estimated for hard construction costs. A 10% contingency is built into this hard estimate. A detailed project development budget is attached as Exhibit 6. All amounts are presented in Canadian $. Approximately $238 million, or 66% of total development cost, is allocable to the condominium component, resulting in a cost of $1.6 million per unit. Approximately $125 million, or 34% of total development cost, is allocable to the hotel component, resulting in a cost of slightly more than $834,000 per hotel key. The budget assumes a development timeline of 36 months beginning in January 2009 and incorporates annual cost inflation of 3%. In addition, the budget incorporates approximately $27 million of funds that have already been expended on the project, including primarily land and entitlement costs as well as a portion of design costs. Development Financing Although in recent years developers were able to secure senior construction financing at loan-to-cost ratios of 80-90%, based on the current strained lending environment it is assumed that a senior construction lender will finance only 60% of development costs for the project. Based on total development costs of $362.8 million, the senior construction loan is estimated to be $217.7 million. The loan is estimated to have an interest rate spread of approximately 400 basis points over an index of 30-day LIBOR. The loan will be interest-only and principal will be repaid as the condominiums are closed/settled. The senior loan will be secured by the project and is not expected to require any additional security or pledge of investor assets. Although the loan will be a single loan secured by the entire project, for repayment purposes it will be allocated between the condominiums and the hotel on a percentage of total cost basis. The condominium loan will be repaid from condominium sales proceeds (upon closing). Release prices (used for loan repayment) are expected to be the gross sales price less concessions and broker/licensor fees. Extra proceeds from condominium sales will be used to pay down the hotel loan allocation. The pro forma model assumes that the construction loan will be repaid prior to the placement of permanent financing. However, should this not occur, any unpaid principal will be taken out by the permanent hotel loan(s) upon maturity. Permanent financing is expected to be placed approximately 2 years after opening to allow time for the hotel’s capitalized value to stabilize. Based on the limited availability of equity, the joint venture must secure a mezzanine loan to cover approximately 15% of development costs, bringing the total debt level to 75% of the total budget.
32

Mezzanine terms are expected to be at 1400 basis points above 30-day LIBOR. A LIBOR floor of 3% has been built into the model. As with the senior construction loan, the mezzanine loan will be parsed between the hotel and the condominiums on a percentage of total cost basis. The mezzanine loan will be funded and retired pari passu with the senior loan, and any remaining principal upon maturity will be taken out by the permanent hotel loan(s). A 4% LIBOR interest rate cap instrument will be purchased for each loan for an estimated cost of $2.5 million ($2 million for the senior debt and $500,000 for the mezzanine). Returns are based on a projected average 30-day LIBOR of 3.5%. Total equity funding needed for construction is approximately $90.7 million. IronGate will contribute approximately $27.2 million in the form of entitled land and costs incurred for schematic design. The remaining $63.5 million in equity funds is currently being sought and will likely be syndicated to several investors. Distributions to equity partners will be realized in several forms: 1) profit from the sale of condominium units, 2) funds from permanent hotel refinancing, 3) profit from hotel operations, and 4) hotel sale. Income taxes will be paid individually by each investor; however, both before and after tax equity return projections are provided (see Projected Equity Returns section below for projected returns). A sources and uses table for the total project is presented below. A sources and uses table for each component of the project is also presented as Exhibit 7. SOURCES AND USES
Senior Loan $217,709,072 Land & Related $20,000,000Mezzanine Loan $54,427,268 General & Administrative $12,000,000Preferred Equity $0 Design & Consultants $15,300,000Common Equity 1 - IronGate $27,213,634 Development Charges & Municipal Costs $5,300,000Common Equity 2 $63,498,479 Sales, Marketing, and Advertising $15,000,000
Hard Construction Costs $251,600,000Building Operations $4,700,000Financing Costs $38,948,454
Total Sources $362,848,454 Total Uses 362,848,454$
TOTAL PROJECT
Sources Uses
Permanent Financing The permanent hotel loan is expected to be funded in December 2013 as the hotel’s performance stabilizes. The loan is expected to have a fixed interest rate of 7.5% and a 30-year amortization period. The amount of the loan is based on the hotel’s value assuming an 8.5% capitalization rate. A maximum loan to value metric of 65% has been assumed, and required debt service coverage from the hotel’s annual net income is 1.4. Given the hotel’s projected performance (discussed below), the permanent loan of $24.1 million is constrained by the 65% loan to value requirement and results in a healthy debt service coverage ratio of 1.56. Due to the current interest rate spreads for mezzanine loans (1200-1500 basis points, no permanent mezzanine financing is assumed. Because the hotel loan will have been paid down to zero through the condominium sales proceeds by August 2013, the permanent hotel loan will provide funds for equity distributions (serving as a delayed distribution for the condominiums proceeds).
33

Projected Hotel Performance The performance of the subject hotel is projected to stabilize in the third year of operation. A summary of the hotel’s projected performance through stabilization is presented below. A complete 10-year hotel pro forma and cash flow analysis is presented as Exhibit 11.
SUMMARY HOTEL INCOME STATEMENTYear Year Year2012 2013 2014
Occupancy 68.0% 72.0% 75.0%Average Daily Rate $300 (2008 $) $303.08 $320.18 $337.85RevPAR $206.10 $230.53 $253.39
Total Revenue $21,907,073 100% $25,517,474 100% $28,769,593 100%
Department Expenses $11,784,372 54% $13,474,592 53% $14,872,724 52%
Gross Operating Profit $10,122,701 46% $12,042,882 47% $13,896,869 48%
Unallocated Departments $6,485,533 30% $6,766,893 27% $7,059,531 25%
House Profit $3,637,168 17% $5,275,989 21% $6,837,337 24%
Other Deductions $2,454,762 11% $3,077,651 12% $3,692,437 13%
EBIDTA $1,182,407 5% $2,198,337 9% $3,144,900 11%
% of Rev
% of Rev
% of Rev
The subject hotel’s occupancy is projected to stabilize at 75% in 2014. The stabilized occupancy is approximately 2 points above the competitive set’s 2008 occupancy and is supported by the 7-year average occupancy (between 2002 and 2008) of the 83-room Wedgewood Hotel and 97-room Opus Hotel, which were 82% and 77%, respectively.
The subject hotel’s peak season occupancy (May through October) is projected to be 84%, which is positioned approximately 1 point below the competitive set’s 2008 peak season occupancy of 85%. Peak season demand is primarily expected to comprise high-rated leisure and entertainment demand. The subject hotel’s off-peak season occupancy (November through April) is projected to be 68%, which is positioned approximately 5 points above the competitive set’s 2008 off-peak season occupancy of 63%. The occupancy premium is based on the subject hotel’s small size and international luxury brand. Off-peak demand is expected to comprise special corporate, entertainment, small group and, to a lesser extent, weekend leisure demand.
Given the hotel’s location in downtown Vancouver and its limited meeting space, it is projected to achieve a strong transient mix of business (80%). The hotel is also expected to be successful in capturing small high-end corporate group due to its location in the CBD.
Due to the subject hotel’s luxury brand affiliation and strong international awareness, its new luxury product, and its above-average room size, the hotel is projected to penetrate existing luxury demand currently being accommodated at the high-end boutique and luxury hotels. In addition, the subject hotel is expected to benefit indirectly from an increase in demand resulting from the VCEC expansion and the City of Vancouver’s renewed focus on economic development and job growth.
The subject hotel’s ADR is projected to stabilize at $300.00 in 2008 $ in year 3. ADR in years 1 and 2 are expected to be discounted by 6.7% and 3.3%, respectively, as the hotel’s mix of demand has not
34

yet been optimized. ADR is expected to increase at 2% annually. See the Pricing section of this report for a detailed rate analysis.
The subject hotel’s projected expenses are based on 1) actual estimates, or 2) actual expenses at comparable luxury and upscale hotels located in the United States and Canada. A comparison of the subject hotel’s expenses to those of five comparable hotels is presented as Exhibit 10 (Hotel Expense Comparison and Notes; note that the exhibit is based on the subject hotel’s projected stabilized performance in constant 2008 $). The exhibit also includes notes on specific expense projections.
Upon stabilization in 2014, the hotel is expected to achieve a house profit of $6.8 million (24% of hotel revenue) and a net house profit (or EBITDA) of $3.1 million, or approximately 11% of hotel revenue. This compares to the average 2008 net house profit margin of 8.4% for the five comparable hotels. The subject’s higher margin can be attributed to higher occupancy and a higher revenue base, low Vancouver utility rates, and low Vancouver tax rates. (Note that the Hotel Expense Comparison reflects a net house profit margin of 12.7%. Due to the assumption that expenses will increase at a higher rate than revenues, the actual margin is projected to be 11% upon stabilization.)
The hotel is expected to complete a soft goods renovation every six years. Soft goods renovation costs are expected to be $3 million (2008 $), increasing at 3% annually. (Although the hotel is expected to be sold after 10 years, note that the pro forma assumes a full renovation every 12 years at a cost of $7.5 million (2008 $).) In addition, each year the hotel is estimated to spend between 0.5% and 2.75% of its revenue on capital maintenance. These renovation and maintenance costs are expected to be funded from the hotel’s capital expenditure reserve and will be depreciated on a 5-year MACRS schedule. The costs for the initial development of the hotel are assumed to be depreciated on various schedules as recommended by US GAAP. (Note that the hotel is located in Canada, which generally has more favorable depreciation treatment for commercial buildings. The use of US GAAP for the purposes of this analysis generates slightly more conservative returns.) A Major Maintenance Schedule and a Hotel Depreciation and Amortization Schedule are presented as Exhibits 12 and 13, respectively.
The hold period for the hotel is expected to be 10 years (beginning from the opening date). The hotel sales price is based upon a terminal capitalization rate of 9%, which is slightly higher (more conservative) than average capitalization rates in the current hotel transaction market (7.5% – 8.5%). Proceeds from the hotel sale in December 2021 are presented in the below graph. A more complete hotel sales proceeds table including after-tax analysis is presented as Exhibit 13.
HOTEL SALES PROCEEDSTerminal Year 2021Terminal Cap Rate 9%Hotel NOI (Year Following Sale) $3,155,221
Sales Price 35,058,008$ Less: Transaction Costs (1,752,900)$ Less: Senior Loan Payoff (21,792,282)$ Less: Mezz Loan Payoff -$ Plus: Return of Unused Reserve 5,385,473$ Before Tax Proceeds from Sale 16,898,299$
A consolidated project income statement including revenues and cash flows from both the condominium and hotel components is presented as Exhibit 15.
35

Projected Residential Performance Soft sales for the condominiums will begin once equity funds are sourced. During the soft sales period, reservations with refundable deposits will be taken to ensure market acceptance of the product and price point. The formal sales period for the condominiums is expected to begin in January 2010 with a major sales office opening event occurring near the start of the 2010 Winter Olympics. This timing gives IronGate a full year to finalize building design and file the public disclosure statement required by the British Columbia Strata Property Act prior to the start of sales. In addition, the celebratory mood and significant number of visitors in Vancouver during that time are expected to heighten awareness and increase the pool of potential buyers. The condominiums are projected to sell out over 50 months, or at an average sales pace of 3 units per month. This sales pace is significantly lower than the sales pace achieved by recent luxury competitors, which ranged from 10 to 20 sales per month. The lower projection takes into account the recent cooling in the housing market. The competitive properties were sold during a rise in the real estate cycle fueled by low interest rates and a flurry of speculative investor activity. While current sales activity is sluggish, demand for luxury housing in Vancouver should regain momentum over time based on the city’s solid economic fundamentals, international gateway location, and attractive downtown residential environment. In addition, mortgage interest rates are forecasted to remain low for the next several years. The below chart reflects projected condominium sales on an annual basis.
Year
Units Sold
SF Sold
C$/SF
Revenue (C$
000’s)
2010 36 79200 $1,450 $114,840.00 2011 36 79200 $1,450 $114,840.00 2012 36 79200 $1,450 $114,840.00 2013 36 79,200 $1,450 $114,840.00 2014 6 13,200 $1,450 $19,140.00
Total 150 330,000 $1,450 $478,500.00
Based on an average sales price of $1,450 per square foot, total gross condominium sales proceeds are projected to be $478.5 million. Over the 50 month sales period, unit sales are expected to average $9.57 million per month less a 4% brand license fee, a 3% broker commission, and a 5% allowance for concessions/incentives. Net sales proceeds are estimated to be $421.1 million. Sales proceeds for each unit will not be recognized or received until settlement, the process for which will begin upon project completion in January 2012. A maximum of 40 closings per month is projected due to the logistical constraints involved in occupying a high-rise tower. The joint venture investors will be required to pay common assessments and property taxes for unsold units. Based on the 50 month sell out period, a total of $2.9 million will be needed to support these costs over the three years after opening ($2.4 million for condominium fees and $500,000 for property taxes). Total condominium EBITDA net of these costs is projected to be $418.1 million over three years. After condominium debt service is paid, a large portion of the remaining proceeds will be used to pay down the hotel portion of the loan.
36

A monthly condominium pro forma and income statement are presented as Exhibits 8 and 9. A summary before tax condominium income statement is presented below.
SUMMARY CONDOMINIUM INCOME STATEMENTYear Year Year Total2012 2013 2014
Months 12 12 12
Condominium Unit Closings 108 36 6 150
Condominium Closings Proceeds $344,520,000 $114,840,000 $19,140,000 $478,500,000
Less Sales Commissions ($24,116,400) ($8,038,800) ($1,339,800) ($33,495,000) Less Concessions ($17,226,000) ($5,742,000) ($957,000) ($23,925,000)
Net Condominium Revenue $303,177,600 $101,059,200 $16,843,200 $421,080,000
Developer Contribution of Condominium Fees, Property Taxes $2,115,150 $813,629 $9,492 $2,938,272
Condominium EBITDA $301,062,450 $100,245,571 $16,833,708 $418,141,728 Tax Calculations As previously stated, all equity distributions are expected to be made on a pre-tax basis. Each investor will be responsible for the payment of income taxes on its share of distributions. However, as a benefit to the investors, taxes for each investor category have been calculated for both the condominium and hotel income. Tax calculations are based on the below tax assumptions.
TAX ASSUMPTIONSMarginal Tax Rate (Federal) 39%Marginal Tax Rate (State/Province) 5%Blended Tax Rate 42%% of Condominium Distributions Taxable as Profit 20%Capital Gains Tax (Recovery of Appreciation) 25%Capital Gains Tax (Appreciable) 15%
Note that condominium revenues will be earned in 2012 but, due to required debt payments, no distributions will be made to investors. This will require investors to pay taxes on condominium revenue from other proceeds. However, in 2014, investors are expected to receive tax-free proceeds from the refinancing of the hotel. Furthermore, in subsequent years, the hotel is expected to generate a negative tax burden (available to offset taxes from investor income not related to the project). The negative tax burden is due to the high depreciation expense for the hotel, which results in negative earnings (despite its positive cash flow). Projected equity returns are presented in the attached exhibits both on a before-tax and after-tax basis. Expected Equity Returns Based on a 10-year hold period, the subject development is expected to generate a total equity IRR of 18.9% on a before-tax basis and 14.5% on an after-tax basis. A table reflecting total equity cash flows and returns is presented as Exhibit 16. Using a 15% pre-tax discount rate and based on a 10-year hold period for the hotel, the project results in an expected net present value (NPV) of $12.9 million (based on a 10-year hold period; Canadian $).
37

A 15% discount rate is considered appropriate for the risk level of the project and appears conservative when compared to the 10.64% average discount rate reported for luxury hotel projects in the 4th Q 2008 PriceWaterhouseCoopers Korpacz Real Estate Investor Survey.
In return for bringing the project to the joint venture, contributing the land and design costs for the project, and managing the development and residential sales processes, IronGate Realty will require an accelerated return or “promote” on distributions above a 15% cumulative current return to equity. Up to a 15% cumulative current return, distributions will be made on a pari passu basis. Between a 15% and 25% cumulative current return, IronGate receives distributions at 5 points above its pari passu share. Above 25% cumulative current return, IronGate receives distributions at 10 points above its pari passu share. A table reflecting the distribution splits is presented below.
SUMMARY OF EQUITY DISTRIBUTION SPLITSEquity Contributed IronGate Contribution 30% Common Equity Contribution 70%
Up to 15% Cumulative Return % Chg IronGate Split 30% 0% Common Equity 2 Split 70% 0%
Between 15% and 25% Cumulative Return IronGate Split 35% 5% Common Equity 2 Split 65% -5%
Above 25% Cumulative Return IronGate Split 40% 5% Common Equity 2 Split 60% -5%
As a result, the expected IRR for IronGate is 19.4%, while remaining equity IRR is 18.7%. Resulting before-tax returns to each equity tranche are quantified below. A complete before-tax and after-tax cash flow and returns analysis for each of the equity tranches is presented as Exhibit 17.
38

SUMMARY OF PROJECTED EQUITY RETURNS
Total Equity Return IRR 18.9% NPV at 15% 12,904,540
Common Equity 1 (IronGate) Return IRR 19.4% NPV at 15% 4,420,482
Common Equity 2 Return IRR 18.7% NPV at 15% 8,498,991
Sensitivity Analysis The expected returns are based on several assumptions and estimates outlined above and in the project’s pro forma model. These assumptions are forward-looking and could vary materially based on changes in market conditions and other factors. Thus, sensitivity analyses have been completed to reflect the impact on total equity IRR resulting from a change in any one of the below material development and pro forma assumptions. A graph of these results is presented below.
Equity IRR % Chg IronGate IRR % ChgCommon
Equity 2 IRR % ChgExpected Results 18.9% -- 19.4% -- 18.7% --
$10 million Increase in Development Costs 17.1% -9.5% 17.3% -10.6% 17.0% -9.2%$100 PSF Decline in Residential Sales Price 13.9% -26.3% 13.9% -28.0% 13.9% -25.5%1-Year Delay of Residential Sell-Out 15.7% -17.1% 15.8% -18.2% 15.6% -16.5%100 Basis Point Spread Increase on Senior Debt 18.2% -3.8% 18.5% -4.2% 18.2% -2.8%5% Decrease in Hotel Revenue 18.1% -4.4% 18.4% -4.8% 17.9% -4.1%1% Increase in Cap Rate (Refinancing & Terminal) 18.6% -1.7% 19.0% -1.8% 18.4% -1.6%
RETURN SENSITIVITY ANALYSIS
The most material effect on IRR results from a negative change in either average residential sales prices or sales pace. A $100 reduction in average sales price negatively affects Total Equity IRR by 5 points (26.3%), and a one-year delay of unit sales decreases the projected IRR by 3.2 points (17.1%). In addition, a Crystal Ball scenario analysis has been completed to present the range of possible Total Equity IRR results given variations in material pro forma assumptions. The scenario analysis incorporates the IRR results for 1,000 trials assuming variations in the following assumptions: 1) development timeline, 2) development costs, 3) residential sales pace, 3) average residential sales price, and 4) hotel revenue. The distribution of scenario results shows that Total Equity IRR may range from 2% to 35%, with 18% being the median and mean IRR. The standard deviation is 6%, resulting in a 68% probability of achieving an IRR between 12% and 24% (within one standard deviation). Further analysis shows that total equity returns are 54% likely to be at or above an 18% IRR and 70% likely to be above the selected 15% discount rate. Below is a frequency chart and scenario summary reflecting the various IRR results. (See Appendix III for the full Crystal Ball report.)
39

Frequency Chart
%
.000
.008
.016
.023
.031
0
7.75
15.5
23.25
31
2% 10% 18% 26% 35%
1,000 Trials 983 Displayed
Forecast: Total Equity IRR
CRYSTAL BALL SCENARIO RESULTS - TOTAL EQUITY IRR
Summary:Display Range is from 2% to 35% Entire Range is from -7% to 38% After 1,000 Trials, the Std. Error of the Mean is 0%
Statistics: ValueTrials 1000Mean 18%Median 18%Mode ---Standard Deviation 6%Variance 0%Skewness -0.34Kurtosis 3.58Coeff. of Variability 0.35Range Minimum -7%Range Maximum 38%Range Width 45%Mean Std. Error 0.20%
The below Crystal Ball sensitivity chart reflects that IRR results are most sensitive to changes in the average residential sales price and residential sales pace, supporting the findings of the simple sensitivity analysis presented at the beginning of this section.
40

Target Forecast: Total Equity IRR
Average Sales Price ($ per square foot) .70
Sales Pace (# units per month) .54
Construction Contingency -.34
Year 3 ADR .16
Development Timeline -.06
-1 -0.5 0 0.5 1
Measured by Rank Correlation
Sensitivity Chart
RISK MANAGEMENT As with any real estate development project, there are risks that could prevent the development from moving forward or materially affect project returns. Possible risks are presented below along with associated risk mitigation plans. Regulatory Risk Although IronGate currently owns the subject site and all entitlements are in place, there is a risk that the City of Vancouver, the Province of British Columbia, or the Federal Canadian government may enact laws or moratoriums that would prevent the project from moving forward with its current uses. To mitigate the risk of edicts based on negative local sentiment, IronGate will continue to meet with officials from the City of Vancouver and the Province of British Columbia as well as local community organizations to promote the project and its benefits to the community. Financing Risk In the current strained lending market, the project may not be able to source construction debt in a timely manner or at the prices assumed in the pro forma. To mitigate the risk of being left with a partially constructed project without debt financing, no hard construction will begin on the project site until a debt commitment letter has been signed and negotiation of loan documents is underway. Also, any residential purchase contracts, general contractor agreements, brand license agreements, and hotel operating agreements entered into prior to construction loan closing will incorporate a joint venture termination right should financing not be sourced by a certain date. This will give the partners more options to rework the project or return investor equity (if this is permitted in the joint venture agreements). Interest Rate Risk The construction and mezzanine loans are expected to have floating interest rates tied to the 30-day LIBOR. To mitigate the volatility of returns associated with fluctuations in LIBOR, a LIBOR cap of
41

3.5% will be purchased. This will result in an ex ante increase in projected development costs, but will eliminate the risk of significant cost overruns due to a rise in the base rate during development. Refinancing Risk The pro forma assumes that the hotel is refinanced two years after hotel opening. This permanent loan would take out any remaining construction debt. There is a risk that no reasonably priced debt will be available to refinance the hotel. The current pro forma assumes that the construction loan is paid down to a zero balance prior to placement of the permanent loan. However, if this does not occur, the construction loan will mature two years after hotel opening, and funds may not be available to retire the debt. In addition, any hotel refinancing proceeds are expected to be returned to investors as non-taxable equity returns. The delay in receipt of these proceeds could materially affect project returns. To mitigate refinancing risk, IronGate will seek to gain an upfront permanent financing commitment from the construction lender. Should this not be possible, IronGate will begin approaching friendly banks as soon as the hotel opens (two years prior to the expected refinance date) to discuss loan opportunities. IronGate will also present a plan to the joint venture partners six months prior to hotel opening detailing a plan to be implemented if financing is not available. This plan will evaluate various options including a sale of the hotel, partner equity buyouts (as permitted in the joint venture agreements), or the pursuit of non-traditional debt financing. Brand Risk There is a risk that no favorable agreement will be reached with a luxury hotel and residences brand. Although the risk is considered to be minor given the number of brands lacking representation in the Vancouver marketplace and the prominent location and design quality of the subject development, steps are being taken to mitigate this risk. IronGate has traveled to the regional or brand headquarters for Ritz-Carlton, Mandarin Oriental, Four Seasons, and St. Regis to promote the subject development. Each brand expressed interest in branding the development. IronGate will send a request for proposal to these and three other brands (Aman Resorts, Waldorf-Astoria, and InterContinental). The request for proposal process will allow IronGate and the joint venture partners to compare brand strength, requirements, and terms side by side and negotiate a favorable agreement. Pricing Risk Equity returns are highly dependent upon the project’s achievement of the residential pricing assumptions in the pro forma. Although the pro forma assumptions are considered reasonable and achievable, there is a risk that these pricing levels will not be reached. To break even (0% IRR), the residential sales price must average a minimum of $1,045 per square foot ($405 below the projected pricing; all other assumptions remaining constant). To mitigate the risk of moving forward with the project without testing for market acceptance, IronGate will launch a soft sales and marketing campaign prior to construction start. Experienced luxury real estate brokers will be given a preview for their high value clients. Market acceptance will be determined based on the number of reservations received with refundable deposits. Should there be a lack of interest in the residential units at the pro forma pricing, the project will be reworked.
42

43
Operating Risk Equity returns are dependent upon a profitable hotel operation. Overall, hotel results are highly volatile compared to other real estate classes due to the transient nature of hotel demand (leased nightly versus annually). In addition, the hotel business is a management-intensive operation, requiring quick responses to market conditions and customer needs. There is a risk that a hotel operator will not be able to achieve the pro forma results due to lack of management expertise and/or a change in economic conditions, including costs for labor, utilities, and property taxes, or a material and adverse change in market lodging demand. Mitigating this risk is the choice of an experienced luxury operator, which has an international base of competent management staff, appropriate management controls, access to relevant market forecasting data, and a history of successful performance. Hotel Sale Risk There is a risk that the hotel sale will not provide the projected proceeds due to a decrease in hotel performance, an increase in capitalization rates, or a lack of interested parties at the forecasted termination date. To mitigate this risk, joint venture partners will be able to evaluate a potential sale of the hotel at any time after refinancing. This will allow the joint venture partners to capitalize on an economic upswing during the forecasted hold period, potentially increasing IRR. Likewise, the terminal date may be extended should unfavorable economic conditions exist at the forecasted terminal date. It should be noted that only 7% of the Total Equity IRR is derived from hotel sales proceeds.
CONCLUSION The subject development presents joint venture partners with an opportunity to invest alongside the successful IronGate Fund in a profitable iconic luxury development in downtown Vancouver, an economically diverse international gateway market. The land on which the subject development will be constructed has all necessary entitlements and is located in a prime entertainment district near the Coal Harbour waterfront. Despite the volatile economic environment, the project is well-positioned to succeed given the strong management, ideal location, and fundamental strength of the Vancouver economy. The development is expected to generate a before-tax IRR of 18.7% to common equity investors, with a 50% probability of IRR upside.

44
EXHIBIT 1 TRADE AREA MAP
LODGING SUPPLY 1. Opus Hotel 2. Wedgewood Hotel 3. Four Seasons Vancouver 4. Pan Pacific Hotel 5. Marriott Pinnacle 6. Fairmont Hotel Vancouver 7. Fairmont Hotel Waterfront 8. Westin Bayshore 9. Westin Grand 10. Hotel Le Soleil 11. Metropolitan Hotel 12. Sutton Place Hotel
CONDOMINIUM SUPPLY 13. Fairmont Pacific Rim 14. Shangri-La 15. Jameson House 16. L’Hermitage en Ville All properties are within 1 mile. North is top of map.
LODGING DEMAND GENERATORS AND PLACES OF INTEREST
A. VCEC
Vancouver Cruise Terminal B. VCEC Expansion Site C. Telus Corporation D. Accenture E. The Jim Pattison Group F. HSBC Canada G. RBC Financial Group H. Canadian Imperial Bank I. Robson Street Shopping District

EXHIBIT 2 LODGING SUPPLY & DEMAND ANALYSIS
2002 2003 2004 2005 2006 2007 2008 2009 2010 2011 2012 2013 2014 Actual Projected
DEMAND
Satisfied Demand: Avg. Daily Rooms Sold 2,622 2,607 2,782 2,903 3,075 3,062 2,898 2,927 3,336 3,136 3,152 3,168 3,168 1.7% 1.5%
Satisfied Demand Growth -0.6% 6.7% 4.3% 5.9% -0.4% -5.4% 1.0% 14.0% -6.0% 0.5% 0.5% 0.0%
Unsatisfied Demand: 50 50 50 70 70 70
Induced Demand: 20 35 35 45 45 45
Total Demand 2,622 2,607 2,782 2,903 3,075 3,062 2,898 2,997 3,421 3,221 3,267 3,283 3,283 1.7% 2.1%
Demand Growth -0.6% 6.7% 4.3% 5.9% -0.4% -5.4% 3.4% 14.2% -5.9% 1.4% 0.5% 0.0%
SUPPLY
Additions: Total
Opus Hotel 97 97 0 0 0 0 0 0 0 0 0 0 0Loden Hotel 77 0 0 0 0 0 0 0 71 6 0 0Shangri-La Vancouver Downtown 119 0 0 0 0 0 0 0 109 10 0 0 0 0Fairmont Pacific Rim 415 0 0 0 0 0 0 0 208 207 0 0
Total Additions 708 97 - - - - - - 388 223 - - - -
Total Daily Rooms Available 3,962 3,962 3,962 3,962 3,962 3,962 3,962 4,350 4,573 4,573 4,573 4,573 4,573 0.0% 2.4%
Supply Growth 0.0% 0.0% 0.0% 0.0% 0.0% 0.0% 10% 5% 0% 0% 0% 0%
SUBJECT HOTEL PENETRATION (A) 2009 2010 2011 2012 2013 2014
Market Occupancy 66.2% 65.8% 70.2% 73.3% 77.6% 77.3% 73.1% 69% 75% 70% 71% 72% 72% #Projected Hotel Occupancy 68% 72% 75% Projected Hotel Penetration 95% 100% 104%
Downtown VancouverLodging Suppy & Demand Analysis
ACTUAL PROJECTED CAGR
45

EXHIBIT 3 COMPETITOR FACILITIES
TOTAL NO. OF DIVISIBLE NO. OF NO. OF CONC CONC BUS. GIFT HLTHROOMS SUITES SF BY SF/RM SF SF/RM REST. LNGE. FLR LNGE CTR SHOP CLUB POOL SPA SALON GOLF OTHER
PRIMARY COMPETITORSOpus Hotel 97 18 922 2 10 922 10 1 1 X XWedgewood Hotel 83 40 1,029 - 12 2,480 30 1 1 X X XFour Seasons Vancouver 376 45 5,560 3 15 18,864 50 2 1 X X X X
Subtotal/Average 2,504 12 7,422 30
SECONDARY COMPETITORSPan Pacific Hotel 504 39 6,808 3 14 29,150 58 2 1 X X X X X XMarriott Pinnacle (A) 434 10 6,632 3 15 14,203 33 2 1 X X X X X XFairmont Hotel Vancouver 556 22 11,400 2 21 31,756 57 2 1 X X X X X XFairmont Hotel Waterfront 489 14 7,050 2 14 17,673 36 1 1 X X X X X XWestin Bayshore 511 40 15,521 7 30 34,000 67 2 2 X X X X XWestin Grand 199 189 1,115 - 6 3,685 19 1 1 X X XHotel Le Soleil (B) 119 119 400 - 3 400 3 1 1 X X XMetropolitan Hotel 197 16 1,929 - 10 7,707 39 1 1 X X XSutton Place Hotel 397 47 3,150 3 8 13,180 33 2 2 X X X X X
Subtotal/Average 6,001 13 16,862 38
TOTAL/AVERAGE 4,252 13 12,142 34
Proposed Subject Luxury Hotel Vancouver Downt 150 32 2,800 3 19 10,000 67 1 2 X X X X X X X
Notes: (A) Converted to a Marriott in July 2003; formerly a Delta.(B) Converted to an independent in 2002; formerly a Sheraton.
Competitive Hotel Supply SummaryCompetitor Facilities
LARGEST ROOM TOTAL SPACE
MEETING SPACE FOOD & BEVERAGE OTHER FACILITIES/AMENITIES
46

EXHIBIT 4 COMPETITOR OCCUPANCY AND AVERAGE DAILY RATE
ROOM YEARCOUNT OPEN 2002 2003 2004 2005 2006 2007 2008 2002 2003 2004 2005 2006 2007 2008
PRIMARY COMPETITORSOpus Hotel 97 1/02 70-74% 70-74% 80-84% 80-84% 80-84% 80-84% 75-79% $185-189 $195-199 $205-209 $225-229 $240-244 $245-249 $245-249Wedgewood Hotel 83 1984 80-84% 80-84% 80-84% 85-90% 80-84% 80-84% 75-79% $195-199 $200-204 $205-209 $235-239 $245-249 $250-254 $245-249Four Seasons Vancouver 376 1976 60-64% 50-54% 60-64% 60-64% 70-74% 70-74% 65-69% $205-209 $210-214 $200-204 $200-204 $210-214 $210-214 $210-214
Subtotal 556 65.6% 61.8% 69.1% 70.9% 74.4% 74.0% 68.4% $201.86 $207.15 $203.31 $214.31 $224.23 $225.94 $224.83
SECONDARY COMPETITORSPan Pacific Hotel 504 1986 70-74% 70-74% 70-74% 75-79% 80-84% 75-79% 75-79% $195-199 $195-199 $205-209 $190-194 $200-204 $210-214 $215-219Marriott Pinnacle (A) 434 2000 55-59% 65-69% 70-74% 75-79% 74-79% 80-84% 80-84% $145-149 $130-134 $130-134 $135-139 $145-149 $160-164 $165-169Fairmont Hotel Vancouver 556 1939 65-69% 60-64% 65-69% 70-74% 75-79% 75-79% 70-74% $180-184 $170-174 $175-179 $170-174 $175-179 $180-184 $175-179Fairmont Hotel Waterfront 489 1991 75-79% 70-74% 75-79% 75-79% 80-84% 80-84% 75-79% $195-199 $185-189 $190-194 $190-194 $200-204 $205-209 $210-214Westin Bayshore 511 1961 60-64% 65-69% 70-74% 70-74% 75-79% 70-74% 65-69% $190-194 $180-184 $175-179 $180-184 $185-189 $190-194 $200-204Westin Grand 199 1999 65-69% 70-74% 75-79% 75-79% 75-79% 80-84% 80-84% $175-179 $170-174 $165-169 $170-174 $190-194 $190-194 $195-199Hotel Le Soleil (B) 119 1999 60-64% 45-49% 60-64% 60-64% 65-69% 70-74% 65-69% $185-189 $130-134 $150-154 $155-159 $160-164 $165-169 $170-174Metropolitan Hotel 197 1984 55-59% 55-59% 65-69% 65-69% 70-74% 70-74% 65-69% $165-169 $155-159 $155-159 $165-169 $170-174 $170-174 $175-179Sutton Place Hotel 397 1985 65-69% 60-64% 60-64% 70-74% 75-79% 80-84% 75-79% $170-174 $150-154 $150-154 $160-164 $160-164 $155-159 $160-164
Subtotal 3,406 66.3% 66.4% 70.4% 73.7% 78.1% 77.8% 73.9% $182.01 $170.29 $173.28 $172.18 $180.16 $185.39 $187.70
TOTAL 3,962 66.2% 65.8% 70.2% 73.3% 77.6% 77.3% 73.1% $184.77 $175.15 $177.43 $177.91 $186.09 $190.84 $192.57
COMPETITIVE SET REVPAR $122.27 $115.24 $124.59 $130.36 $144.44 $147.47 $140.84
Proposed Subject Luxury Hotel Vancouver Downtow 150 CY 2012 68/72/75% $300.00 (2008 $; C$)$225.00 Stab. RevPAR (2008 $)
(A) Converted to a Marriott in July 2003; fomerly a Delta.(B) Converted to an independent in 2002; formerly a Sheraton.(C) Note that YTD June 2007 data was not available for all properties. Available data reflects average ADR increases of 4-8%.
ANNUAL ANNUAL
AVERAGE DAILY RATE (C$)OCCUPANCY
Competitive Hotel Supply SummaryOccupancy and Average Daily Rate
47

48
EXHIBIT 5 COMPETITOR MARKET SEGMENTATION AND QUOTED RATES
AIRLINE SPECIALBUS GROUP PLEAS CONTRACT CORP. CORP. WEEKEND
PRIMARY COMPETITORSOpus Hotel 40% 5% 55% 0% $359 $200 $359Wedgewood Hotel 40% 20% 40% 0% $349 $210 $389Four Seasons Vancouver 30% 40% 30% 0% $370 $180 $320
Subtotal/Average 34% 30% 36% 0%
SECONDARY COMPETITORS Pan Pacific Hotel 15% 55% 25% 5% $359 $180 $359Marriott Pinnacle (A) 26% 27% 35% 12% $289 $165 $289Fairmont Hotel Vancouver 25% 50% 25% 0% $329 $170 $299Fairmont Hotel Waterfront 30% 35% 35% 0% $329 $180 $309Westin Bayshore 35% 40% 25% 0% $289 $170 $299Westin Grand 40% 15% 45% 0% $259 $160 $279Hotel Le Soleil (B) 25% 15% 60% 0% $190 $160 $215Metropolitan Hotel 30% 20% 50% 0% $249 $155 $249Sutton Place Hotel 35% 25% 30% 10% $307 $190 $317
Subtotal/Average 28% 36% 32% 4%
TOTAL/AVERAGE 29% 35% 33% 3%
Proposed Subject Luxury Hotel Vancouver Downtown 40% 20% 40% 0%
Notes: (A) Converted to a Marriott in July 2003; formerly a Delta. (B) Converted to an independent in 2002; formerly a Sheraton.
Competitive Hotel Supply SummaryMarket Segmentation and Quoted Rates
MARKET SEGMENTATION QUOTED RATES FOR SUMMER 2009

EXHIBIT 6 PROJECT DEVELOPMENT BUDGET
Cost Category Total Project Condominium % AllocPer Condo
Unit Hotel % AllocPer Hotel
Room
Land & RelatedLand & Related $20,000,000 $14,000,000 70% $93,333 $6,000,000 30% $40,000Total Land & Related $20,000,000 $14,000,000 70% $93,333 $6,000,000 30% $40,000
General & AdministrativeLegal Fees $2,500,000 $2,000,000 80% $13,333 $500,000 20% $3,333Development Management Fee $4,000,000 $2,800,000 70% $18,667 $1,200,000 30% $8,000Insurance & Warranty $4,000,000 $2,800,000 70% $18,667 $1,200,000 30% $8,000Other General & Administrative $1,500,000 $1,050,000 70% $7,000 $450,000 30% $3,000Total General & Administrative $12,000,000 $8,650,000 72% $57,667 $3,350,000 28% $22,333
Design & ConsultantsArchitectural Design $5,000,000 $3,500,000 70% $23,333 $1,500,000 30% $10,000Interior Design $1,800,000 $1,080,000 60% $7,200 $720,000 40% $4,800Engineering Design & Consulting $3,200,000 $2,240,000 70% $14,933 $960,000 30% $6,400Specialty Consulting $4,500,000 $3,150,000 70% $21,000 $1,350,000 30% $9,000Operator Consulting Services $800,000 $160,000 20% $1,067 $640,000 80% $4,267Total Design & Consultants $15,300,000 $10,130,000 66% $67,533 $5,170,000 34% $34,467
Development Charges & Municipal CostsDevelopment Charges $4,000,000 $2,800,000 70% $18,667 $1,200,000 30% $8,000Building Permits $1,100,000 $770,000 70% $5,133 $330,000 30% $2,200Municipal Costs $200,000 $160,000 80% $1,067 $40,000 20% $267Total Municipal Costs $5,300,000 $3,730,000 70% $24,867 $1,570,000 30% $10,467
Sales, Marketing, and AdvertisingResidential Sales, Marketing, and Advertising Expense $15,000,000 $15,000,000 100% $100,000 $0 0% $0Total Sales, Marketing & Advertising $15,000,000 $15,000,000 100% $100,000 $0 0% $0
Hard Construction CostsDiv 1 - General Costs $17,000,000 $11,900,000 70% $79,333 $5,100,000 30% $34,000Div 2 - Site Work $6,300,000 $4,410,000 70% $29,400 $1,890,000 30% $12,600Div 3 - Concrete Work $50,000,000 $40,000,000 80% $266,667 $10,000,000 20% $66,667Div 4 - Masonry $3,000,000 $2,100,000 70% $14,000 $900,000 30% $6,000Div 5 - Metals $6,000,000 $4,200,000 70% $28,000 $1,800,000 30% $12,000Div 6 - Carpentry & Millwork $15,000,000 $9,000,000 60% $60,000 $6,000,000 40% $40,000Div 7 - Moisture Protection $3,000,000 $2,100,000 70% $14,000 $900,000 30% $6,000Div 8 - Windows & Doors $25,000,000 $17,500,000 70% $116,667 $7,500,000 30% $50,000Div 9 - Finishing $25,000,000 $12,500,000 50% $83,333 $12,500,000 50% $83,333Div 10 - Specialties $3,500,000 $1,750,000 50% $11,667 $1,750,000 50% $11,667Div 11 - Equipment $6,000,000 $2,400,000 40% $16,000 $3,600,000 60% $24,000Div 12 - Furnishings $20,000,000 $2,000,000 10% $13,333 $18,000,000 90% $120,000Div 13 - Special Construction $800,000 $560,000 70% $3,733 $240,000 30% $1,600Div 14 - Conveying System $9,000,000 $6,300,000 70% $42,000 $2,700,000 30% $18,000Div 15 - Mechanical $25,000,000 $17,500,000 70% $116,667 $7,500,000 30% $50,000Div 16 - Electrical Work $14,000,000 $9,800,000 70% $65,333 $4,200,000 30% $28,000Construction Contingency $23,000,000 $16,100,000 70% $107,333 $6,900,000 30% $46,000Total Hard Construction Costs $251,600,000 $160,120,000 64% $1,067,467 $91,480,000 36% $609,867
Building OperationsPre-Opening Expenses $4,000,000 $280,000 7% $1,867 $3,720,000 93% $24,800Working Capital Contribution $700,000 $100,000 14% $667 $600,000 86% $4,000Total Condominium & Building Operations $4,700,000 $380,000 8% $2,533 $4,320,000 92% $28,800
Financing CostsConstruction Loan Interest $31,550,000 $20,507,500 65% $136,717 $11,042,500 35% $73,617Upfront Financing Costs $7,398,454 $5,178,918 70% $34,526 $2,219,536 30% $14,797Total Financing Costs $38,948,454 $25,686,418 66% $171,243 $13,262,036 34% $88,414
Total Project Development Budget $362,848,454 $237,696,418 66% $1,584,643 $125,152,036 34% $834,347
PROJECT DEVELOPMENT BUDGET
49

50
EXHIBIT 7 SOURCES AND USES
SOURCES AND USES
Senior Loan $217,709,072 Land & Related $20,000,000Mezzanine Loan $54,427,268 General & Administrative $12,000,000Preferred Equity $0 Design & Consultants $15,300,000Common Equity 1 - IronGate $27,213,634 Development Charges & Municipal Costs $5,300,000Common Equity 2 $63,498,479 Sales, Marketing, and Advertising $15,000,000
Hard Construction Costs $251,600,000Building Operations $4,700,000Financing Costs $38,948,454
Total Sourc
Senior LoanMezzaninePreferreCommon EqCommon Eq
Total Sourc
Senior LoanMezzaninePreferreCommon EqCommon Eq
Total Sourc
TOTAL PROJECT
Sources Uses
es $362,848,454 Total Uses 362,848,454$
$75,091,222 Land & Related $6,000,000 Loan $18,772,805 General & Administrative $3,350,000
d Equity $0 Design & Consultants $5,170,000uity 1 - IronGate $9,386,403 Development Charges & Municipal Costs $1,570,000uity 2 $21,901,606 Sales, Marketing, and Advertising $0
Hard Construction Costs $91,480,000Building Operations $4,320,000Financing Costs $13,262,036
es $125,152,036 Total Uses 125,152,036$
$142,617,851 Land & Related $14,000,000 Loan $35,654,463 General & Administrative $8,650,000
d Equity $0 Design & Consultants $10,130,000uity 1 - IronGate $17,827,231 Development Charges & Municipal Costs $3,730,000uity 2 $41,596,873 Sales, Marketing, and Advertising $15,000,000
Hard Construction Costs $160,120,000Building Operations $380,000Financing Costs $25,686,418
es $237,696,418 Total Uses 237,696,418$
CONDO PROJECT
Sources Uses
HOTEL PROJECT
Sources Uses

EXHIBIT 8 MONTHLY CONDOMINIUM PRO FORMA
MONTHLY CONDOMINIUM PRO FORMA
Sales Month Sales Month Sales Month Sales Month Sales Month Sales Month Sales Month Sales Month Sales Month Sales Month Sales Month Sales Month1 2 3 4 5 6 7 8 9 10 11 12
Jan-10 Feb-10 Mar-10 Apr-10 May-10 Jun-10 Jul-10 Aug-10 Sep-10 Oct-10 Nov-10 Dec-10
Condominium Unit Contracts 3 3 3 3 3 3 3 3 3 3 3 3Condominium Sales Proceeds Under Contract 9,570,000$ 9,570,000$ 9,570,000$ 9,570,000$ 9,570,000$ 9,570,000$ 9,570,000$ 9,570,000$ 9,570,000$ 9,570,000$ 9,570,000$ 9,570,000$
Cumulative Condominium Unit Contracts 3 6 9 12 15 18 21 24 27 30 33 36 Cumulative Condominium Sales Proceeds Under Contract 9,570,000$ 19,140,000$ 28,710,000$ 38,280,000$ 47,850,000$ 57,420,000$ 66,990,000$ 76,560,000$ 86,130,000$ 95,700,000$ 105,270,000$ 114,840,000$
Condominium Unit Closings 0 0 0 0 0 0 0 0 0 0 0 0Condominium Closings Proceeds -$ -$ -$ -$ -$ -$ -$ -$ -$ -$ -$ -$
Cumulative Condominium Closings 0 0 0 0 0 0 0 0 0 0 0 0Cumulative Closings Proceeds -$ -$ -$ -$ -$ -$ -$ -$ -$ -$ -$ -$
Developer Held Units 150 150 150 150 150 150 150 150 150 150 150 150
Gross Condominium Revenue -$ -$ -$ -$ -$ -$ -$ -$ -$ -$ -$ -$ Less Sales Commissions -$ -$ -$ -$ -$ -$ -$ -$ -$ -$ -$ -$ Less Concessions -$ -$ -$ -$ -$ -$ -$ -$ -$ -$ -$ -$
Net Condominium Revenue -$ -$ -$ -$ -$ -$ -$ -$ -$ -$ -$ -$
Developer Contribution of Condominium Fees, Property Taxes -$ -$ -$ -$ -$ -$ -$ -$ -$ -$ -$ -$
Condominium EBITDA -$ -$ -$ -$ -$ -$ -$ -$ -$ -$ -$ -$
Total Debt Payments -$ -$ -$ -$ -$ -$ -$ -$ -$ -$ -$ -$
Before Tax Cash Flow to Equity from Condominiums -$ -$ -$ -$ -$ -$ -$ -$ -$ -$ -$ -$
MONTHLY CONDOMINIUM PRO FORMA
Sales Month Sales Month Sales Month Sales Month Sales Month Sales Month Sales Month Sales Month Sales Month Sales Month Sales Month Sales Month13 14 15 16 17 18 19 20 21 22 23 24
Jan-11 Feb-11 Mar-11 Apr-11 May-11 Jun-11 Jul-11 Aug-11 Sep-11 Oct-11 Nov-11 Dec-11
Condominium Unit Contracts 3 3 3 3 3 3 3 3 3 3 3 3Condominium Sales Proceeds Under Contract 9,570,000$ 9,570,000$ 9,570,000$ 9,570,000$ 9,570,000$ 9,570,000$ 9,570,000$ 9,570,000$ 9,570,000$ 9,570,000$ 9,570,000$ 9,570,000$
Cumulative Condominium Unit Contracts 39 42 45 48 51 54 57 60 63 66 69 72 Cumulative Condominium Sales Proceeds Under Contract 124,410,000$ 133,980,000$ 143,550,000$ 153,120,000$ 162,690,000$ 172,260,000$ 181,830,000$ 191,400,000$ 200,970,000$ 210,540,000$ 220,110,000$ 229,680,000$
Condominium Unit Closings 0 0 0 0 0 0 0 0 0 0 0 0Condominium Closings Proceeds -$ -$ -$ -$ -$ -$ -$ -$ -$ -$ -$ -$
Cumulative Condominium Closings 0 0 0 0 0 0 0 0 0 0 0 0Cumulative Closings Proceeds -$ -$ -$ -$ -$ -$ -$ -$ -$ -$ -$ -$
Developer Held Units 150 150 150 150 150 150 150 150 150 150 150 150
Gross Condominium Revenue -$ -$ -$ -$ -$ -$ -$ -$ -$ -$ -$ -$ Less Sales Commissions -$ -$ -$ -$ -$ -$ -$ -$ -$ -$ -$ -$ Less Concessions -$ -$ -$ -$ -$ -$ -$ -$ -$ -$ -$ -$
Net Condominium Revenue -$ -$ -$ -$ -$ -$ -$ -$ -$ -$ -$ -$
Developer Contribution of Condominium Fees, Property Taxes -$ -$ -$ -$ -$ -$ -$ -$ -$ -$ -$ -$
Condominium EBITDA -$ -$ -$ -$ -$ -$ -$ -$ -$ -$ -$ -$
Total Debt Payments -$ -$ -$ -$ -$ -$ -$ -$ -$ -$ -$ -$
Before Tax Cash Flow to Equity from Condominiums -$ -$ -$ -$ -$ -$ -$ -$ -$ -$ -$ -$
51

EXHIBIT 8, CONT.
MONTHLY CONDOMINIUM PRO FORMA
Sales Month Sales Month Sales Month Sales Month Sales Month Sales Month Sales Month Sales Month Sales Month Sales Month Sales Month Sales Month25 26 27 28 29 30 31 32 33 34 35 36
Jan-12 Feb-12 Mar-12 Apr-12 May-12 Jun-12 Jul-12 Aug-12 Sep-12 Oct-12 Nov-12 Dec-12
Condominium Unit Contracts 3 3 3 3 3 3 3 3 3 3 3 3Condominium Sales Proceeds Under Contract 9,570,000$ 9,570,000$ 9,570,000$ 9,570,000$ 9,570,000$ 9,570,000$ 9,570,000$ 9,570,000$ 9,570,000$ 9,570,000$ 9,570,000$ 9,570,000$
Cumulative Condominium Unit Contracts 75 78 81 84 87 90 93 96 99 102 105 108 Cumulative Condominium Sales Proceeds Under Contract 239,250,000$ 248,820,000$ 258,390,000$ 267,960,000$ 277,530,000$ 287,100,000$ 296,670,000$ 306,240,000$ 315,810,000$ 325,380,000$ 334,950,000$ 344,520,000$
Condominium Unit Closings 40 38 3 3 3 3 3 3 3 3 3 3Condominium Closings Proceeds 127,600,000$ 121,220,000$ 9,570,000$ 9,570,000$ 9,570,000$ 9,570,000$ 9,570,000$ 9,570,000$ 9,570,000$ 9,570,000$ 9,570,000$ 9,570,000$
Cumulative Condominium Closings 40 78 81 84 87 90 93 96 99 102 105 108Cumulative Closings Proceeds 127,600,000$ 248,820,000$ 258,390,000$ 267,960,000$ 277,530,000$ 287,100,000$ 296,670,000$ 306,240,000$ 315,810,000$ 325,380,000$ 334,950,000$ 344,520,000$
Developer Held Units 110 72 69 66 63 60 57 54 51 48 45 42
Gross Condominium Revenue 127,600,000$ 121,220,000$ 9,570,000$ 9,570,000$ 9,570,000$ 9,570,000$ 9,570,000$ 9,570,000$ 9,570,000$ 9,570,000$ 9,570,000$ 9,570,000$ Less Sales Commissions (8,932,000)$ (8,485,400)$ (669,900)$ (669,900)$ (669,900)$ (669,900)$ (669,900)$ (669,900)$ (669,900)$ (669,900)$ (669,900)$ (669,900)$ Less Concessions (6,380,000)$ (6,061,000)$ (478,500)$ (478,500)$ (478,500)$ (478,500)$ (478,500)$ (478,500)$ (478,500)$ (478,500)$ (478,500)$ (478,500)$
Net Condominium Revenue 112,288,000$ 106,673,600$ 8,421,600$ 8,421,600$ 8,421,600$ 8,421,600$ 8,421,600$ 8,421,600$ 8,421,600$ 8,421,600$ 8,421,600$ 8,421,600$
Developer Contribution of Condominium Fees, Property Taxes 315,693.98$ 206,636.06$ 198,026.23$ 189,416.39$ 180,806.55$ 172,196.72$ 163,586.88$ 154,977.05$ 146,367.21$ 137,757.38$ 129,147.54$ 120,537.70$
Condominium EBITDA 111,972,306$ 106,466,964$ 8,223,574$ 8,232,184$ 8,240,793$ 8,249,403$ 8,258,013$ 8,266,623$ 8,275,233$ 8,283,843$ 8,292,452$ 8,301,062$
Total Debt Payments 111,972,306$ 106,466,964$ 8,223,574$ 8,232,184$ 8,240,793$ 8,249,403$ 8,258,013$ 8,266,623$ 4,781,421$ -$ -$ -$
Before Tax Cash Flow to Equity from Condominiums -$ -$ -$ -$ -$ -$ -$ -$ 3,493,812$ 8,283,843$ 8,292,452$ 8,301,062$
MONTHLY CONDOMINIUM PRO FORMA
Sales Month Sales Month Sales Month Sales Month Sales Month Sales Month Sales Month Sales Month Sales Month Sales Month Sales Month Sales Month37 38 39 40 41 42 43 44 45 46 47 48
Jan-13 Feb-13 Mar-13 Apr-13 May-13 Jun-13 Jul-13 Aug-13 Sep-13 Oct-13 Nov-13 Dec-13
Condominium Unit Contracts 3 3 3 3 3 3 3 3 3 3 3 3Condominium Sales Proceeds Under Contract 9,570,000$ 9,570,000$ 9,570,000$ 9,570,000$ 9,570,000$ 9,570,000$ 9,570,000$ 9,570,000$ 9,570,000$ 9,570,000$ 9,570,000$ 9,570,000$
Cumulative Condominium Unit Contracts 111 114 117 120 123 126 129 132 135 138 141 144 Cumulative Condominium Sales Proceeds Under Contract 354,090,000$ 363,660,000$ 373,230,000$ 382,800,000$ 392,370,000$ 401,940,000$ 411,510,000$ 421,080,000$ 430,650,000$ 440,220,000$ 449,790,000$ 459,360,000$
Condominium Unit Closings 3 3 3 3 3 3 3 3 3 3 3 3Condominium Closings Proceeds 9,570,000$ 9,570,000$ 9,570,000$ 9,570,000$ 9,570,000$ 9,570,000$ 9,570,000$ 9,570,000$ 9,570,000$ 9,570,000$ 9,570,000$ 9,570,000$
Cumulative Condominium Closings 111 114 117 120 123 126 129 132 135 138 141 144Cumulative Closings Proceeds 354,090,000$ 363,660,000$ 373,230,000$ 382,800,000$ 392,370,000$ 401,940,000$ 411,510,000$ 421,080,000$ 430,650,000$ 440,220,000$ 449,790,000$ 459,360,000$
Developer Held Units 39 36 33 30 27 24 21 18 15 12 9 6
Gross Condominium Revenue 9,570,000$ 9,570,000$ 9,570,000$ 9,570,000$ 9,570,000$ 9,570,000$ 9,570,000$ 9,570,000$ 9,570,000$ 9,570,000$ 9,570,000$ 9,570,000$ Less Sales Commissions (669,900)$ (669,900)$ (669,900)$ (669,900)$ (669,900)$ (669,900)$ (669,900)$ (669,900)$ (669,900)$ (669,900)$ (669,900)$ (669,900)$ Less Concessions (478,500)$ (478,500)$ (478,500)$ (478,500)$ (478,500)$ (478,500)$ (478,500)$ (478,500)$ (478,500)$ (478,500)$ (478,500)$ (478,500)$
Net Condominium Revenue 8,421,600$ 8,421,600$ 8,421,600$ 8,421,600$ 8,421,600$ 8,421,600$ 8,421,600$ 8,421,600$ 8,421,600$ 8,421,600$ 8,421,600$ 8,421,600$
Developer Contribution of Condominium Fees, Property Taxes 117,524.26$ 108,483.93$ 99,443.61$ 90,403.28$ 81,362.95$ 72,322.62$ 63,282.29$ 54,241.97$ 45,201.64$ 36,161.31$ 27,120.98$ 18,080.66$
Condominium EBITDA 8,304,076$ 8,313,116$ 8,322,156$ 8,331,197$ 8,340,237$ 8,349,277$ 8,358,318$ 8,367,358$ 8,376,398$ 8,385,439$ 8,394,479$ 8,403,519$
Total Debt Payments -$ -$ -$ -$ -$ -$ -$ -$ -$ -$ -$ -$
Before Tax Cash Flow to Equity from Condominiums 8,304,076$ 8,313,116$ 8,322,156$ 8,331,197$ 8,340,237$ 8,349,277$ 8,358,318$ 8,367,358$ 8,376,398$ 8,385,439$ 8,394,479$ 8,403,519$
52

EXHIBIT 8, CONT. MONTHLY CONDOMINIUM PRO FORMA
Sales Month Sales Month Sales Month Sales Month Sales Month Sales Month Sales Month Sales Month Sales Month Sales Month Sales Month Sales Month49 50 51 52 53 54 55 56 57 58 59 60
Jan-14 Feb-14 Mar-14 Apr-14 May-14 Jun-14 Jul-14 Aug-14 Sep-14 Oct-14 Nov-14 Dec-14
Condominium Unit Contracts 3 3 0 0 0 0 0 0 0 0 0 0Condominium Sales Proceeds Under Contract 9,570,000$ 9,570,000$ -$ -$ -$ -$ -$ -$ -$ -$ -$ -$
Cumulative Condominium Unit Contracts 147 150 150 150 150 150 150 150 150 150 150 150 Cumulative Condominium Sales Proceeds Under Contract 468,930,000$ 478,500,000$ 478,500,000$ 478,500,000$ 478,500,000$ 478,500,000$ 478,500,000$ 478,500,000$ 478,500,000$ 478,500,000$ 478,500,000$ 478,500,000$
Condominium Unit Closings 3 3 0 0 0 0 0 0 0 0 0 0Condominium Closings Proceeds 9,570,000$ 9,570,000$ -$ -$ -$ -$ -$ -$ -$ -$ -$ -$
Cumulative Condominium Closings 147 150 150 150 150 150 150 150 150 150 150 150Cumulative Closings Proceeds 468,930,000$ 478,500,000$ 478,500,000$ 478,500,000$ 478,500,000$ 478,500,000$ 478,500,000$ 478,500,000$ 478,500,000$ 478,500,000$ 478,500,000$ 478,500,000$
Developer Held Units 3 - - - - - - - - - - -
Gross Condominium Revenue 9,570,000$ 9,570,000$ -$ -$ -$ -$ -$ -$ -$ -$ -$ -$ Less Sales Commissions (669,900)$ (669,900)$ -$ -$ -$ -$ -$ -$ -$ -$ -$ -$ Less Concessions (478,500)$ (478,500)$ -$ -$ -$ -$ -$ -$ -$ -$ -$ -$
Net Condominium Revenue 8,421,600$ 8,421,600$ -$ -$ -$ -$ -$ -$ -$ -$ -$ -$
Developer Contribution of Condominium Fees, Property Taxes 9,492.34$ -$ -$ -$ -$ -$ -$ -$ -$ -$ -$ -$
Condominium EBITDA 8,412,108$ 8,421,600$ -$ -$ -$ -$ -$ -$ -$ -$ -$ -$
Total Debt Payments -$ -$ -$ -$ -$ -$ -$ -$ -$ -$ -$ -$
Before Tax Cash Flow to Equity from Condominiums 8,412,108$ 8,421,600$ -$ -$ -$ -$ -$ -$ -$ -$ -$ -$
53

EXHIBIT 9 CONDOMINIUM PRO FORMA/INCOME STATEMENT
CONDOMINIUM INCOME STATEMENT
Year Year Year Year Year Year Year2012 2013 2014 2015 2016 2017 2018
Months 12 12 12 12 12 12 12
Condominium Unit Closings 108 36 6 0 0 0 0
Condominium Closings Proceeds $344,520,000 $114,840,000 $19,140,000 $0 $0 $0 $0
Less Sales Commissions ($24,116,400) ($8,038,800) ($1,339,800) $0 $0 $0 $0 Less Concessions ($17,226,000) ($5,742,000) ($957,000) $0 $0 $0 $0
Net Condominium Revenue $303,177,600 $101,059,200 $16,843,200 $0 $0 $0 $0
Developer Contribution of Condominium Fees, Property Taxes $2,115,150 $813,629 $9,492 $0 $0 $0 $0
Condominium EBITDA $301,062,450 $100,245,571 $16,833,708 $0 $0 $0 $0
Interest Expense $1,768,865 $0 $0 $0 $0 $0 $0 Tax Expense $25,170,591 $8,430,652 $1,415,715 $0 $0 $0 $0
Condominium NOI $274,122,995 $91,814,918 $15,417,993 $0 $0 $0 $0
Total Debt Payments $272,691,281 $0 $0 $0 $0 $0 $0
Before Tax Cash Flow to Equity $28,371,170 $100,245,571 $16,833,708 $0 $0 $0 $0
Total Tax Expense $25,170,591 $8,430,652 $1,415,715 $0 $0 $0 $0
After Tax Cash Flow to Equity $3,200,579 $91,814,918 $15,417,993 $0 $0 $0 $0
54

55
EXHIBIT 10 HOTEL EXPENSE COMPARISON AND NOTES
HOTEL EXPENSES COMPARISON AND NOTES
Notes:
LOW HIGH AVG
DEPARTMENT EXPENSESROOMS 39.3% 29.5% 32.1% 29.8% 32.4% 29.5% 39.3% 32.6% 3,942 32.0% (a)
TELEPHONE 196.9% 112.9% 116.5% 135.5% 114.2% 112.9% 196.9% 135.2% 41 100%GIFT SHOPS 80.0% 0.0% 0.0% 0.0% 91.9% 80.0% 91.9% 86.0% 78 95.0%
TOT FOOD & BEV 89.0% 89.5% 90.8% 79.6% 74.5% 74.5% 90.8% 84.7% 6,946 72.3% (b)SPA 0.0% 108.0% 0.0% 0.0% 81.1% 0.0% 108.0% 37.8% 1,125 75.0%
OTHER DEPTS. 63.1% 37.7% 76.3% 0.0% 32.3% 0.0% 76.3% 41.9% 185 25.0% (c) TOT DEPT EXPENSES 60.3% 56.7% 51.8% 43.9% 64.7% 43.9% 64.7% 55.5% 12,317 50.7%
UNALLOCATED DEPARTMENTS 0.0% 0.0%GENERAL AND ADMINISTRATIVE $28 $44 $50 $16 $41 $16 $50 $36 2,300 $42 (d)
UTILITIES $12 $27 $20 $5 $21 $5 $27 $17 625 $11 (e)REPAIRS & MAINTENANCE $13 $20 $21 $6 $21 $6 $21 $16 1,369 $25
SALES & MARKETING $23 $28 $33 $12 $34 $12 $34 $26 1,500 $27 TOTAL UNALLOCATED DEPARTMENTS 5,793
HOUSE PROFIT 3.2% 10.0% 18.0% 35.1% 38.3% 3.2% 38.3% 20.9% 6,177 25.4%OTHER DEDUCTIONSMANAGEMENT FEE 3.0% 3.0% 3.9% 3.0% 3.0% 3.0% 3.9% 3.2% 729 3.0% (f)
FF&E REP AND CAPITAL EXP RESERVE 4.0% 5.0% 4.0% 4.0% 5.0% 4.0% 5.0% 4.4% 1,214 5.0% (f)PROPERTY TAXES 25 448 1,450 100 2,000 25 2,000 805 1,000 1,000 (g)
INSURANCE 112 620 218 99 220 99 620 254 100 100 (h)EQUIPMENT RENTAL 47 41 88 0 20 0 88 39 40 40 (i)
OTHER/PERMITS & LICENSES 63 0 599 0 0 0 599 132 20 20TOTAL OTHER DEDUCTIONS 3,103 3,103
NET HOUSE PROFIT -5.4% -5.4% 1.8% 27.5% 23.4% -5.4% 27.5% 8.4% 3,074 12.7%
ROOMS SOLD 45495 28346 49568 126862 54750 41,063ROOMS AVAILABLE 75,396 42,090 70,638 161,014 73,000 54,750
OCCUPANCY 60% 67% 70% 79% 75% 60% 79% 70% 75%AVERAGE RATE $197 $277 $390 $169 $320 $169 $390 $271 $300
NUMBER OF ROOMS 200 115 200 420 200 115 420 227 150
Notes:(a) Rooms expense of 32% is supported by the average comparable rooms expense of 32.6% and results in a cost per occupied room of $96.(b) Total Food & Beverage expense is projected to be on the low end of the comparables based on its high mix of banquet revenue, which generally has a higher profit margin than other F&B outlets.(c) Other departments includes Garage and Rents & Commissions. Garage profit margin is projected to be 50%, and Rents and Commissions are projected to have a profit margin of 95%.(d) General and Adminstrative costs includes security, general management salaries and benefits, credit card commissions, human resources, & financial management costs, etc. Projected to be on the high end of comparable performance due to low room count and higher luxury costs.(e) Utilities are expected to be generally lower than comparables based on the low cost of steam in the Vancouver market.(f) Management fee for luxury brands is typically 3% of total revenues. FF&E and capital replacement reserves are typically 5% of total revenue.(g) Property tax estimates are based on the local tax rates and have been confirmed by a property tax professional.(h) Insurance costs are actual quotes for property and general liability insurance.(i) Includes rental of two vehicles and office equipment.
2008 COMP PERFOMANCE COMPARABLE SUMMARYSTABILIZED PROJECTIONS
(2008 $)
COMP 1 COMP 2 COMP 5SUBJECT HOTEL
COMP 3 COMP 4

56
EXHIBIT 11 HOTEL INCOME STATEMENT/CASH FLOW
HOTEL INCOME STATEMENT / CASH FLOW
Year Year Year Year Year Year Year Year Year Year2012 2013 2014 2015 2016 2017 2018 2019 2020 2021
Months 12 12 12 12 12 12 12 12 12 12
Occupied Rooms 37,230 39,420 41,063 41,063 41,063 41,063 41,063 41,063 41,063 41,063 Available Rooms 54,750 54,750 54,750 54,750 54,750 54,750 54,750 54,750 54,750 54,750
Occupancy 68.0% 72.0% 75.0% 75.0% 75.0% 75.0% 75.0% 75.0% 75.0% 75.0%Average Daily Rate $303.08 $320.18 $337.85 $344.61 $351.50 $358.53 $365.70 $373.01 $380.47 $388.08RevPAR $206.10 $230.53 $253.39 $258.45 $263.62 $268.90 $274.27 $279.76 $285.35 $291.06
Department Revenue Rooms $11,283,706 $12,621,631 $13,872,913 $14,150,372 $14,433,379 $14,722,047 $15,016,488 $15,316,817 $15,623,154 $15,935,617 Restaurant $2,095,135 $2,970,408 $3,432,154 $3,535,119 $3,641,172 $3,750,407 $3,862,920 $3,978,807 $4,098,171 $4,221,117 Lounge $838,054 $1,142,465 $1,470,923 $1,515,051 $1,560,502 $1,607,317 $1,655,537 $1,705,203 $1,756,359 $1,809,050 Banquet $6,141,757 $6,995,754 $8,224,574 $8,553,557 $8,895,699 $9,251,527 $9,621,588 $10,006,451 $10,406,709 $10,822,978 Total Food & Beverage $9,074,946 $11,108,627 $13,127,651 $13,603,726 $14,097,373 $14,609,252 $15,140,044 $15,690,462 $16,261,240 $16,853,144 Telephone/Internet $38,742 $41,431 $43,589 $44,025 $44,465 $44,909 $45,359 $45,812 $46,270 $46,733 Garage $209,513 $319,890 $392,246 $404,014 $416,134 $428,618 $441,477 $454,721 $468,362 $482,413 Gift Shop $41,903 $91,397 $98,062 $101,003 $104,033 $107,154 $110,369 $113,680 $117,091 $120,603 Spa $1,215,506 $1,531,538 $2,010,143 $2,110,651 $2,216,183 $2,326,992 $2,443,342 $2,565,509 $2,693,784 $2,828,474 Other Rents & Commissions $335,222 $411,287 $490,308 $505,017 $520,167 $535,772 $551,846 $568,401 $585,453 $603,017 Other $0 $0 $0 $0 $0 $0 $0 $0 $0 $0
Tota
Depa Room Res Banqu Tel Ga Gift Spa Ot Ot
Total
Unall G Sal Util Ot
Total
House P
FF Ins Perm Equi Ot
Total
EBIDT
DeprIntereTa
NOI
SeniPermTota
Before T
SeniMezzHote Les
Cash
Tota
Tota
Total After Tax Cash Flow to Equity $2,222,699 $4,822,686 $26,898,807 $2,152,150 $2,142,426 $1,740,870 $1,609,691 $1,792,963 $1,482,741 $36,579,442
l Revenue $22,199,537 $26,125,801 $30,034,912 $30,918,807 $31,831,735 $32,774,745 $33,748,924 $34,755,402 $35,795,355 $36,870,001
rtment Expensess $3,610,786 $3,912,706 $4,161,874 $4,245,111 $4,330,014 $4,416,614 $4,504,946 $4,595,045 $4,686,946 $4,780,685
taurant $1,780,864 $2,376,326 $2,745,723 $2,828,095 $2,912,938 $3,000,326 $3,090,336 $3,183,046 $3,278,537 $3,376,893Lounge $544,735 $685,479 $882,554 $909,031 $936,301 $964,390 $993,322 $1,023,122 $1,053,816 $1,085,430
et $4,913,406 $5,036,943 $5,757,202 $5,987,490 $6,226,989 $6,476,069 $6,735,111 $7,004,516 $7,284,697 $7,576,084 Total Food & Beverage $7,239,005 $8,098,748 $9,385,479 $9,724,615 $10,076,228 $10,440,785 $10,818,769 $11,210,684 $11,617,049 $12,038,408
ephone/Internet $38,742 $41,431 $43,589 $44,025 $44,465 $44,909 $45,359 $45,812 $46,270 $46,733rage $104,757 $159,945 $196,123 $202,007 $208,067 $214,309 $220,738 $227,360 $234,181 $241,207 Shop $37,712 $82,257 $88,255 $90,903 $93,630 $96,439 $99,332 $102,312 $105,382 $108,543
$1,033,180 $1,225,230 $1,507,608 $1,582,988 $1,662,137 $1,745,244 $1,832,506 $1,924,132 $2,020,338 $2,121,355her Rents & Commissions $16,761 $20,564 $24,515 $25,251 $26,008 $26,789 $27,592 $28,420 $29,273 $30,151her $0 $0 $0 $0 $0 $0 $0 $0 $0 $0
Department Expenses $12,080,944 $13,540,882 $15,407,443 $15,914,900 $16,440,550 $16,985,089 $17,549,243 $18,133,765 $18,739,439 $19,367,081
Gross Operating Profit $10,118,594 $12,584,919 $14,627,469 $15,003,907 $15,391,186 $15,789,656 $16,199,680 $16,621,637 $17,055,915 $17,502,920
ocated Departmentseneral and Administrative $2,464,864 $2,602,280 $2,745,723 $2,828,095 $2,912,938 $3,000,326 $3,090,336 $3,183,046 $3,278,537 $3,376,893
Repairs and Maintenance $1,754,788 $1,824,979 $1,897,979 $1,973,898 $2,052,854 $2,134,968 $2,220,366 $2,309,181 $2,401,548 $2,497,610es and Marketing $1,688,263 $1,738,911 $1,791,078 $1,844,811 $1,900,155 $1,957,160 $2,015,875 $2,076,351 $2,138,641 $2,202,801ities $731,162 $760,408 $790,824 $822,457 $855,356 $889,570 $925,153 $962,159 $1,000,645 $1,040,671
her $0 $0 $0 $0 $0 $0 $0 $0 $0 $0
Unallocated Departments $6,639,077 $6,926,579 $7,225,605 $7,469,261 $7,721,302 $7,982,023 $8,251,729 $8,530,736 $8,819,372 $9,117,975
rofit $3,479,517 $5,658,340 $7,401,864 $7,534,646 $7,669,883 $7,807,632 $7,947,951 $8,090,900 $8,236,543 $8,384,945
Other DeductionsManagement Fee $665,986 $783,774 $901,047 $927,564 $954,952 $983,242 $1,012,468 $1,042,662 $1,073,861 $1,106,100
&E Rep and Capital Expenditure Reserve $665,986 $1,045,032 $1,501,746 $1,545,940 $1,591,587 $1,638,737 $1,687,446 $1,737,770 $1,789,768 $1,843,500Property Taxes $1,125,509 $1,391,129 $1,671,673 $1,721,823 $1,773,478 $1,826,682 $1,881,483 $1,937,927 $1,996,065 $2,055,947
urance $116,986 $121,665 $126,532 $131,593 $136,857 $142,331 $148,024 $153,945 $160,103 $166,507its & Licenses $21,649 $22,082 $22,523 $22,974 $23,433 $23,902 $24,380 $24,867 $25,365 $25,872
pment Rental $45,020 $46,371 $47,762 $49,195 $50,671 $52,191 $53,757 $55,369 $57,030 $58,741her $0 $0 $0 $0 $0 $0 $0 $0 $0 $0
Other Deductions $2,641,136 $3,410,053 $4,271,283 $4,399,090 $4,530,978 $4,667,086 $4,807,558 $4,952,542 $5,102,192 $5,256,668
A $838,381 $2,248,287 $3,130,581 $3,135,556 $3,138,906 $3,140,546 $3,140,393 $3,138,359 $3,134,351 $3,128,276
Other Expenseseciation/Amortization $5,570,888 $9,415,552 $6,877,505 $5,352,159 $5,388,443 $4,498,187 $4,256,487 $4,768,456 $4,113,014 $3,922,417st Expense $561,957 $0 $1,642,240 $1,775,158 $1,756,781 $1,736,978 $1,715,637 $1,692,639 $1,667,856 $1,641,149
x Expense -$1,946,275 -$2,574,399 -$1,634,659 -$1,028,468 -$1,015,395 -$612,198 -$481,172 -$666,478 -$360,264 -$248,848
-$3,348,189 -$4,592,866 -$3,754,504 -$2,963,293 -$2,990,924 -$2,482,420 -$2,350,559 -$2,656,258 -$2,286,255 -$2,186,442
or & Construction Debt Service $561,957 $0 $1,844,218 $2,011,874 $2,011,874 $2,011,874 $2,011,874 $2,011,874 $2,011,874 $2,011,874anent Mezzanine Debt Service $0 $0 $0 $0 $0 $0 $0 $0 $0 $0
l Debt Payments $561,957 $0 $1,844,218 $2,011,874 $2,011,874 $2,011,874 $2,011,874 $2,011,874 $2,011,874 $2,011,874
ax Cash Flow to Equity from Operations $276,424 $2,248,287 $1,286,363 $1,123,683 $1,127,032 $1,128,672 $1,128,519 $1,126,485 $1,122,477 $1,116,403
or Refinancing Proceeds $0 $0 $23,977,785 $0 $0 $0 $0 $0 $0 $0 Refinancing Proceeds $0 $0 $0 $0 $0 $0 $0 $0 $0 $0l Sales Proceeds $0 $0 $0 $0 $0 $0 $0 $0 $0 $32,956,698s Tax on Hotel Sale $0 $0 $0 $0 $0 $0 $0 $0 $0 -$2,257,493
Flows from Sale/Refinance $0 $0 $23,977,785 $0 $0 $0 $0 $0 $0 $35,214,191
l Before Tax Cash Flow to Equity $276,424 $2,248,287 $25,264,148 $1,123,683 $1,127,032 $1,128,672 $1,128,519 $1,126,485 $1,122,477 $34,073,101
l Tax Payments -$1,946,275 -$2,574,399 -$1,634,659 -$1,028,468 -$1,015,395 -$612,198 -$481,172 -$666,478 -$360,264 -$2,506,341

EXHIBITS 12 AND 13 MAJOR HOTEL MAINTENANCE AND RENOVATION SCHEDULE
HOTEL DEPRECIATION SCHEDULE
MAJOR MAINTENANCE AND RENOVATIONS
Year Year Year Year Year Year Year Year Year Year2012 2013 2014 2015 2016 2017 2018 2019 2020 2021
Beginning Accrual Balance $0 $547,677 $1,440,788 $2,663,496 $3,847,611 $4,913,822 $5,854,365 $2,908,106 $3,738,504 $4,593,363
Accrual Contribution $657,212 $1,020,699 $1,438,480 $1,480,144 $1,523,158 $1,567,572 $1,613,434 $1,660,797 $1,709,716 $1,760,246
Renovation Expenditures $0 $0 $0 $0 $0 $0 $3,914,320 $0 $0 $0Major Maintenance Expenditures $109,535 $127,587 $215,772 $296,029 $456,947 $627,029 $645,374 $830,399 $854,858 $968,136Annual Expenditures $109,535 $127,587 $215,772 $296,029 $456,947 $627,029 $4,559,693 $830,399 $854,858 $968,136
Ending Accrual Balance $547,677 $1,440,788 $2,663,496 $3,847,611 $4,913,822 $5,854,365 $2,908,106 $3,738,504 $4,593,363 $5,385,473
DEPRECIATION SCHEDULEYear Year Year Year Year Year Year Year Year Year2012 2013 2014 2015 2016 2017 2018 2019 2020 2021
Hotel Depreciation
Initial Depreciation 3-year MACRS Depreciation $0 $0 $0 $0 $0 $0 $0 $0 $0 $0 $0 5-year MACRS Depreciation $18,000,000 $3,600,000 $5,760,000 $3,456,000 $2,073,600 $2,073,600 $1,036,800 $0 $0 $0 $0 7-year MACRS Depreciation $3,600,000 $514,440 $881,640 $629,640 $449,640 $321,480 $321,120 $321,480 $160,560 $0 $0 10-year MACRS Depreciation $0 $0 $0 $0 $0 $0 $0 $0 $0 $0 $0 15-year MACRS Depreciation $0 $0 $0 $0 $0 $0 $0 $0 $0 $0 $0 20-year MACRS Depreciation $0 $0 $0 $0 $0 $0 $0 $0 $0 $0 $0 39-year Real Property Depreciation $92,562,036 $1,186,693 $2,373,386 $2,373,386 $2,373,386 $2,373,386 $2,373,386 $2,373,386 $2,373,386 $2,373,386 $2,373,386Total Initial Depreciation $5,301,133 $9,015,026 $6,459,026 $4,896,626 $4,768,466 $3,731,306 $2,694,866 $2,533,946 $2,373,386 $2,373,386
Renovation Depreciation (5-year MACRS) Renovation 1 (Soft Goods) - 2018 $3,914,320 $782,864 $1,252,582 $751,549 $450,930 Renovation 2 (Soft & Case) - 2024 $11,684,756 Renovation 3 (Soft Goods) - 2030 $5,580,884 Renovation 4 (Soft & Case) - 2036 $16,659,668 Renovation 5 (Soft Goods) - 2042 $7,957,006 Renovation 6 (Soft & Case) - 2048 $23,752,702 Renovation 7 (Soft Goods) - 2054 $11,344,788 Renovation 8 (Soft & Case) - 2060 $33,865,674Total Renovation Depreciation $0 $0 $0 $0 $0 $0 $782,864 $1,252,582 $751,549 $450,930
Major Maintenance Depreciation $109,535 $127,587 $215,772 $296,029 $456,947 $627,029 $645,374 $830,399 $854,858 $968,136
Total Depreciation Expense $5,410,668 $9,142,613 $6,674,797 $5,192,654 $5,225,413 $4,358,334 $4,123,103 $4,616,927 $3,979,793 $3,792,451
57

EXHIBIT 14 HOTEL SALE PROCEEDS
HOTEL SALE PROCEEDSTerminal Year 2021Terminal Cap Rate 9%Hotel NOI (Year Following Sale) $3,155,221
Sales Price 35,058,008$ Less: Transaction Costs (1,752,900)$ Less: Senior Loan Payoff (21,792,282)$ Less: Mezz Loan Payoff -$ Plus: Return of Unused Reserve 5,385,473$ Before Tax Proceeds from Sale 16,898,299$
Taxes in Year of SaleSales Proceeds 33,305,108$ Original Basis 125,152,036$ Plus Capital Invested 9,045,985$ Less: Accumulated Depreciation 52,516,753$ Adjusted Basis 81,681,268$ Capital Gain (48,376,160)$ Recovery of Depreciation 52,516,753$ Appreciable Gain (100,892,914)$
Tax From Sale (2,004,749)$
After Tax Proceeds from Sale 18,903,048$
58

EXHIBIT 15 CONSOLIDATED PROJECT PRO FORMA/INCOME STATEMENT
CONSOLIDATED PROJECT INCOME STATEMENT
Year Year Year Year Year Year Year Year Year Year2012 2013 2014 2015 2016 2017 2018 2019 2020 2021
Months 12 12 12 12 12 12 12 12 12 12
Hotel Revenue $21,907,073 $25,517,474 $28,769,593 $29,602,875 $30,463,166 $31,351,433 $32,268,680 $33,215,948 $34,194,322 $35,204,928
Condominium Proceeds $344,520,000 $114,840,000 $19,140,000 $0 $0 $0 $0 $0 $0 $0
Total Revenue $366,427,073 $140,357,474 $47,909,593 $29,602,875 $30,463,166 $31,351,433 $32,268,680 $33,215,948 $34,194,322 $35,204,928
Less Hotel Operating Expenses $20,724,666 $23,319,137 $25,624,692 $26,450,918 $27,305,706 $28,190,103 $29,105,198 $30,052,119 $31,032,040 $32,046,178Less Sales Commissions and Concessions $41,342,400 $13,780,800 $2,296,800 $0 $0 $0 $0 $0 $0 $0Less Condominium Operating Expenses $2,115,150 $813,629 $9,492 $0 $0 $0 $0 $0 $0 $0
EBIDTA $302,244,857 $102,443,908 $19,978,608 $3,151,957 $3,157,460 $3,161,330 $3,163,481 $3,163,829 $3,162,283 $3,158,750
Less Depreciation/Amortization Expense $5,410,668 $9,142,613 $6,674,797 $5,192,654 $5,225,413 $4,358,334 $4,123,103 $4,616,927 $3,979,793 $3,792,451Less Interest Expense $2,489,894 $0 $1,650,829 $1,784,443 $1,765,970 $1,746,063 $1,724,611 $1,701,493 $1,676,580 $1,649,734Less Tax Expense $23,423,042 $5,939,788 -$157,900 -$986,071 -$971,677 -$578,396 -$450,271 -$628,140 -$329,829 -$220,001
Total NOI $270,921,252 $87,361,506 $11,810,881 -$2,839,069 -$2,862,246 -$2,364,672 -$2,233,962 -$2,526,450 -$2,164,261 -$2,063,434
Total Debt Payments $275,774,003 $0 $1,853,864 $2,022,397 $2,022,397 $2,022,397 $2,022,397 $2,022,397 $2,022,397 $2,022,397
Before Tax Cash Flow to Equity from Operations $26,470,853 $102,443,908 $18,124,744 $1,129,560 $1,135,063 $1,138,933 $1,141,084 $1,141,432 $1,139,886 $1,136,353
Senior Refinancing Proceeds $0 $0 $24,103,201 $0 $0 $0 $0 $0 $0 $0Mezz Refinancing Proceeds $0 $0 $0 $0 $0 $0 $0 $0 $0 $0Hotel Sales Proceeds $0 $0 $0 $0 $0 $0 $0 $0 $0 $33,305,108 Less Tax on Hotel Sale $0 $0 $0 $0 $0 $0 $0 $0 $0 -$2,004,749
Cash Flows from Sale/Refinance $0 $0 $24,103,201 $0 $0 $0 $0 $0 $0 $35,309,856
Total Before Tax Cash Flow to Equity $26,470,853 $102,443,908 $42,227,945 $1,129,560 $1,135,063 $1,138,933 $1,141,084 $1,141,432 $1,139,886 $34,441,460
Total Tax Payments $23,423,042 $5,939,788 -$157,900 -$986,071 -$971,677 -$578,396 -$450,271 -$628,140 -$329,829 -$2,224,749
Total After Tax Cash Flow to Equity $3,047,811 $96,504,119 $42,385,845 $2,115,631 $2,106,740 $1,717,329 $1,591,355 $1,769,572 $1,469,715 $36,666,210
59

EXHIBIT 16 TOTAL EQUITY RETURNS
TOTAL EQUITY CASH FLOWS
Year Year Year Year Year Year Year Year Year Year Year Year Year2009 2010 2011 2012 2013 2014 2015 2016 2017 2018 2019 2020 2021
Common Equity Contributed -$90,683,900 -$28,214 $0 $0 $0 $0 $0 $0 $0 $0 $0 $0 $0
Preferred Equity Contributed $0 $0 $0 $0 $0 $0 $0 $0 $0 $0 $0 $0 $0
Total Equity Contributed -$90,683,900 -$28,214 $0 $0 $0 $0 $0 $0 $0 $0 $0 $0 $0
Total Before Tax Cash Available to Equity $0 $0 $0 $26,470,853 $102,443,908 $42,227,945 $1,129,560 $1,135,063 $1,138,933 $1,141,084 $1,141,432 $1,139,886 $34,441,460
Total Before Tax Equity Cash Flows -$90,683,900 -$28,214 $0 $26,470,853 $102,443,908 $42,227,945 $1,129,560 $1,135,063 $1,138,933 $1,141,084 $1,141,432 $1,139,886 $34,441,460
Total Before Tax Equity Internal Rate of Return 18.9%
After Tax Analysis
Total Tax Expense $0 $0 $0 $23,423,042 $5,939,788 -$157,900 -$986,071 -$971,677 -$578,396 -$450,271 -$628,140 -$329,829 -$2,224,749
Total After Tax Cash Available to Equity $0 $0 $0 $3,047,811 $96,504,119 $42,385,845 $2,115,631 $2,106,740 $1,717,329 $1,591,355 $1,769,572 $1,469,715 $36,666,210
Total Before Tax Equity Cash Flows -$90,683,900 -$28,214 $0 $3,047,811 $96,504,119 $42,385,845 $2,115,631 $2,106,740 $1,717,329 $1,591,355 $1,769,572 $1,469,715 $36,666,210
Total After Tax Equity Internal Rate of Return 14.5%
60

61
EXHIBIT 16 EQUITY TRANCHE RETURNS
Common Equity 1 - IronGate Cash Flows
Hurdle 1 Distribution to Common Equity 1 $0 $0 $0 $7,941,256 $30,733,172 $10,222,465 $0 $0 $0 $0 $0 $0Hurdle 2 Distribution to Common Equity 1 $0 $0 $0 $0 $0 $2,853,572 $395,346 $397,272 $398,626 $399,380 $399,501 $398,960 $12,054,Remaining Distributions to Equity 1 $0 $0 $0 $0 $0 $0 $0 $0 $0 $0 $0 $0 $
Common Equity 1 Before Tax Cash Flows -$27,205,170 -$8,464 $0 $7,941,256 $30,733,172 $13,076,037 $395,346 $397,272 $398,626 $399,380 $399,501 $398,960 $12,054,
Common Equity 1 Before Tax IRR 19.4%Common Equity 1 Before Tax NPV at 0.15 $4,420,482
After Tax Total Common 1 Equity Returns
Common Equity 1 Tax Allocation $0 $0 $0 $7,026,913 $1,781,937 -$47,370 -$295,821 -$291,503 -$173,519 -$135,081 -$188,442 -$98,949 -$667,
Common Equity 1 After Tax Cash Flows -$27,205,170 -$8,464 $0 $914,343 $28,951,236 $13,123,407 $691,167 $688,775 $572,145 $534,461 $587,943 $497,909 $12,721,
Common Equity 1 (IronGate) After Tax IRR 15.0%Common Equity 1 (IronGate) After Tax NPV at 0.12 $3,542,036
$0511
0
511
425
936
Common Equity 2 Cash Flows
Hurdle 1 Distribution to Common Equity 2 $0 $0 $0 $18,529,597 $71,710,735 $23,852,417 $0 $0 $0 $0 $0 $0Hurdle 2 Distribution to Common Equity 2 $0 $0 $0 $0 $0 $5,299,491 $734,214 $737,791 $740,306 $741,705 $741,931 $740,926 $22,386,Remaining Distributions to Equity 2 $0 $0 $0 $0 $0 $0 $0 $0 $0 $0 $0 $0 $
Common Equity 2 Before Tax Cash Flows -$63,478,730 $0 $0 $18,529,597 $71,710,735 $29,151,909 $734,214 $737,791 $740,306 $741,705 $741,931 $740,926 $22,386,
Common Equity 2 Before Tax IRR 18.7%Common Equity 2 Before Tax NPV at 0.15 $8,498,991
After Tax Total Common Equity 2 Returns
Common Equity 2 Tax Allocation $0 $0 $0 $16,396,129 $4,157,852 -$110,530 -$690,250 -$680,174 -$404,877 -$315,189 -$439,698 -$230,881 -$1,557
Common Equity 2 After Tax Cash Flows -$63,478,730 $0 $0 $2,133,468 $67,552,883 $29,262,439 $1,424,464 $1,417,965 $1,145,184 $1,056,894 $1,181,629 $971,806 $23,944,
Common Equity 2 After Tax IRR 14.2%Common Equity 2 After Tax NPV at 0.12 $5,881,844
$0949
0
949
,325
274

APPENDIX I HOTEL PRICE GROWTH REGRESSION ANALYSIS -
RELATIONSHIP OF CHANGE IN AIRLINE PASSENGER COUNTS AND CHANGE IN HOTEL RATES IN VANCOUVER, BC
A multivariate regression analysis was completed to determine whether a statistically significant relationship exists between year-over-year change in the following regional macroeconomic indicators and year-over-year change in hotel rates in Vancouver, B.C.
• Greater Vancouver Average Income Per Tax Filer • Port of Vancouver Cruise Ship Passengers • Total Visitors to Vancouver • % Asian Visitors to Vancouver • Vancouver International Airport (“VIA”) Passengers • Vancouver Employment • Vancouver Hotel Occupancy The regression analysis showed a relationship with overall significance (F stat of .056), but P-values for a majority of the independent variables ranged from .1 to .68, indicating the probability of a Type I error. The regression analysis was then performed using numerous combinations of the above variables, and two were found to have a statistically significant relationship with a change in Vancouver hotel rates. However, a correlation analysis between the two variables reflected multicollinearity. Because Change in VIA Passengers consistently showed the lowest P-value in the above analysis, a linear regression analysis was completed between this independent variable and the change in Vancouver Hotel Rates. The resulting analysis showed a statistically significant relationship between 1) Annual Change in VIA Passengers and 2) Annual Change in Vancouver Hotel Rates. A summary of the findings is below. SUMMARY OUTPUT
Regression StatisticsMultiple R 0.836217526R Square 0.699259751Adjusted R Square 0.671919728Standard Error 0.026223477Observations 13
ANOVAdf SS MS F Significance F
Regression 1 0.017588152 0.017588152 25.57641 0.00036783Residual 11 0.007564378 0.000687671Total 12 0.02515253
Coefficients Standard Error t Stat P-value Lower 95% Upper 95% Lower 95.0% Upper 95.0%Intercept 0.002330879 0.008768191 0.265833561 0.795284 -0.016967779 0.021629537 -0.016967779 0.021629537Vancouver International Airport Passengers 0.63219013 0.125005143 5.057312969 0.000368 0.357055666 0.907324594 0.357055666 0.907324594
Equation is y=.632x+.002 The table shows that the r-squared for the equation is 0.70. The low P-value (0.000368) indicates that the relationship is significant to a 1% level of confidence. In addition, all of the standard residuals were found to be within a reasonable range (+/- 2) of the predicted results, confirming the validity of the relationship. A residual summary, standard residual plot, and line fit plot are presented below.
62

RESIDUAL OUTPUT
Observation Predicted Average Hotel Rate Residuals Standard Residuals1 0.070983958 0.013606509 0.5419394032 0.109224851 -0.011776263 -0.4690417723 0.037522225 0.051351113 2.0452851524 0.031748274 -0.016181293 -0.6444915545 0.014494788 0.016091628 0.6409202436 0.011371161 -0.008096275 -0.3224699617 -0.019584043 0.014279725 0.5687531958 -0.022146124 -0.014361704 -0.5720183569 -0.021296551 -0.033908161 -1.350542457
10 0.064315644 -0.040132392 -1.59845000111 0.030197837 -0.009518802 -0.37912837612 0.021831498 0.021490579 0.85595736113 0.023610399 0.017155336 0.683287122
Vancouver International Airport Passengers
Standard Residual Plot
-2
-1.5
-1
-0.5
0
0.5
1
1.5
2
2.5
-5% 0% 5% 10% 15% 20%
Change in Vancouver International Airport Passengers
Stan
dard
R
esid
uals
Vancouver International Airport Passengers Line Fit Plot
-8%
-6%
-4%
-2%
0%
2%
4%
6%
8%
10%
12%
-5% 0% 5% 10% 15% 20%
Change in Vancouver International Airport Passengers
Chan
ge in
Av
erag
e Ho
tel R
ate
Average Hotel RatePredicted Average Hotel Rate
63

The resulting regression equation is presented below:
YOY Change in Vancouver Hotel Rates = 0.632*YOY Change in VIA Passenger Counts + 0.002 The below table presents the annual historical and projected change in VIA passenger counts and historical and predicted Vancouver hotel rates.
Year
Historic and Forecasted VIA
Passenger Counts
Historic and Predicted
Average Hotel Rate Growth
1995 10.9% 8.5%1996 16.9% 9.7%1997 5.6% 8.9%1998 4.7% 1.6%1999 1.9% 3.1%2000 1.4% 0.3%2001 -3.5% -0.5%2002 -3.9% -3.7%2003 -3.7% -5.5%2004 9.8% 2.4%2005 4.4% 2.1%2006 3.1% 4.3%2007 3.4% 4.1%
Forecasts Below
Predictions Below
2008 2.0% 1.5%2009 2.0% 1.5%2010 5.7% 3.8%2011 2.7% 1.9%2012 2.7% 1.9%2013 2.7% 1.9%2014 2.7% 1.9%2015 2.7% 1.9%2016 2.7% 1.9%2017 2.7% 1.9%2018 2.7% 1.9%2019 2.7% 1.9%2020 2.7% 1.9%
Avg Projected Hotel ADR Growth Rate 2.0%
Sources: Transport Canada; PKF Trends in the Canadian Hotel Industry A graphical depiction of the relationship of year-over-year changes in VIA passenger counts and Vancouver hotel rates follows.
64

Change in VIA Passenger Counts and Vancouver Hotel Rates
-10.0%
-5.0%
0.0%
5.0%
10.0%
15.0%
20.0%
1995
1997
1999
2001
2003
2005
2007
2009
2011
2013
2015
2017
2019
Year
% C
hg
Vancouver International AirportPassengersAverage Hotel Rate Growth
Predictions
65

APPENDIX II CONDOMINIUM SALES PRICE REGRESSION ANALYSIS -
RELATIONSHIP OF TOTAL POPULATION, AVERAGE INCOME AND AVERAGE APARTMENT PRICE IN THE PRIMARY MARKET AREA
A multivariate regression analysis was completed to determine whether a statistically significant relationship exists between the below regional macroeconomic indicators and the average apartment/condominium price in the subject development’s Primary Market Area.
• Greater Vancouver Average Income Per Tax Filer • Greater Vancouver Population • Number of Households in Vancouver • Vancouver Total Employment • Average Mortgage Interest Rates The regression analysis showed a strong relationship (adjusted r-squared of 0.90) with overall significance (F stat of 0.0001), but P-values for a majority of the independent variables ranged from .05 to .72, indicating the probability of a Type I error. The regression analysis was then performed using numerous combinations of the above variables, and two were found to have a statistically significant relationship with the average primary market area apartment price. The regression analysis showed a statistically significant relationship between the following independent variables 1) Greater Vancouver Average Income Per Tax Filer and 2) Greater Vancouver Population and the dependent variable, Average Apartment Price in the Primary Market Area. A correlation analysis was completed for the two independent variables, reflecting a correlation coefficient of less than 0.70. Although there is a correlation between the independent variables, it is not considered to be strong enough to cause multicollinearity. A summary of the multivariate regression analysis is below. SUMMARY OUTPUT
Regression StatisticsMultiple R 0.953107906R Square 0.90841468Adjusted R Square 0.891762803Standard Error 29703.58233Observations 14
ANOVAdf SS MS F Significance F
Regression 2 96265045232 48132522616 54.55329219 1.95003E-06Residual 11 9705330833 882302803Total 13 1.0597E+11
Coefficients Standard Error t Stat P-value Lower 95% Upper 95% Lower 95.0% Upper 95.0%Intercept -370983.8878 144840.124 -2.56133368 0.026455687 -689774.8511 -52192.92451 -689774.8511 -52192.92451Greater Vancouver Average Income per Tax Filer 5.844964494 1.017734899 5.743111 0.000129678 3.604945086 8.084983902 3.604945086 8.084983902Greater Vancouver Population 0.190051944 0.083041593 2.28863559 0.042880413 0.007278631 0.372825258 0.007278631 0.372825258
Regression equation is y=5.845x + 0.19z - 370983.888 The table shows that the adjusted r-squared for the equation is 0.89. The low P-values (0.0001 and 0.043) indicate that the relationship is significant to a 1% level of confidence. In addition, all of the standard residuals were found to be within a reasonable range (+/- 2) of the predicted results, confirming the validity of the relationship. A residual summary, standard residual plot, and line fit plot are presented below.
66

RESIDUAL OUTPUT
Observation
Predicted Primary Market Area Average Apartment Price (Annual
Avg) Residuals Standard Residuals1 206708.1701 -8317.615684 -0.3044145132 202018.1357 -10350.68572 -0.3788223783 160865.8046 36699.10538 1.3431421614 172546.8149 27632.63566 1.011320515 179615.8583 12208.85733 0.4468291766 191678.8012 -1642.981758 -0.0601311137 208268.4073 -18724.0429 -0.6852769628 214197.3418 -17281.15239 -0.6324689429 218770.1967 3858.918317 0.141231669
10 310435.8787 -54722.01311 -2.00275843711 329800.0153 -28046.64531 -1.02647275412 354280.0325 -11401.7081 -0.41728850613 385838.8202 24191.91542 0.88539437714 413123.5572 45895.41285 1.679715713
Total Population Standard Residual Plot
-2.5
-2
-1.5
-1
-0.5
0
0.5
1
1.5
2
1,500 1,600 1,700 1,800 1,900 2,000 2,100 2,200 2,300
in ThousandsTotal Population
Stan
dard
R
esid
uals
Greater Vancouver Average Income per Taxpayer Standard Residual Plot
-2.5
-2
-1.5
-1
-0.5
0
0.5
1
1.5
2
- 10,000 20,000 30,000 40,000 50,000 60,000 70,000
Greater Vancouver Average Income per Taxpayer
Stan
dard
Re
sidu
als
67

Greater Vancouver Population Line Fit Plot
0
50,000100,000
150,000200,000
250,000
300,000350,000
400,000450,000
500,000
1,500 1,600 1,700 1,800 1,900 2,000 2,100 2,200 2,300In ThousandsPopulation
Prim
ary
Mar
ket A
rea
Aver
age
Apar
tmen
t Pri
ce (A
nnua
l Avg
)
Primary Market Area Average Apartment Price(Annual Avg)Predicted Primary Market Area AverageApartment Price (Annual Avg)
Greater Vancouver Average Income per Taxpayer Line Fit Plot
0
50,000
100,000
150,000
200,000
250,000
300,000
350,000
400,000
450,000
500,000
20,000 30,000 40,000 50,000 60,000 70,000
Greater Vancouver Average Income per Taxpayer
Prim
ary
Mar
ket A
rea
Ave
rage
A
partm
ent P
rice
(Ann
ual A
vg)
Primary Market Area AverageApartment Price (Annual Avg)
Predicted Primary Market AreaAverage Apartment Price (Annual Avg)
The regression equation is presented below:
Average Condominium Price=5.845*Average Income Per Tax Filer + 0.19*Greater Vancouver Population - 370983.888
68

The below table presents the historical and projected Greater Vancouver population and average income per tax filer and expected condominium prices.
Year
Greater Vancouver Average Income
per Taxpayer
Total Greater Vancouver Population
Primary Market Area Average
Condominium Price (Annual Avg)
Per Square Foot Estimate (based on
1,200 SF average size)
Recent Average Competitive Luxury Sales
PriceLuxury
Premium1994 40,379 1,797,815 198,391 $165 1995 37,827 1,851,623 191,667 $160 1996 29,002 1,906,500 197,565 $165 1997 29,429 1,954,830 200,179 $167 1998 29,664 1,984,798 191,825 $160 1999 30,830 2,012,410 190,036 $158 2000 32,770 2,040,036 189,544 $158 2001 32,691 2,073,662 196,916 $164 2002 32,544 2,102,244 222,629 $186 2003 47,358 2,128,965 255,714 $213 2004 49,857 2,153,998 301,753 $251 2005 52,921 2,188,573 342,878 $286 $1,314 460%2006 57,246 2,221,613 410,031 $342 $1,200 351%2007 61,000 2,249,725 459,019 $383 $1,230 322%2008 63,000 2,293,438 433,121 $361 $1,322 366%
2009 60,000 2,333,513 423,203 $353 $1,365 387%2010 58,000 2,373,933 419,195 $349 $1,352 387%2011 60,000 2,414,772 438,646 $366 $1,415 387%2012 62,000 2,454,686 457,922 $382 $1,477 387%2013 65,000 2,494,292 482,984 $402 $1,558 387%2014 70,000 2,533,976 519,751 $433 $1,676 387%2015 72,000 2,573,727 538,995 $449 $1,738 387%2016 74,000 2,613,470 558,239 $465 $1,800 387%2017 77,000 2,652,982 583,283 $486 $1,881 387%2018 75,000 2,692,324 579,070 $483 $1,868 387%2019 73,000 2,731,391 574,805 $479 $1,854 387%2020 78,000 2,770,030 611,373 $509 $1,972 387%
Average Luxury Premium 2005 - 2008 375%Range of Premium 2005 - 2008 322%-460%Premium Applied 387%Average Luxury Projection during Sales Period $1,450
Sources: BC Stats, Real Estate Board of Greater Vancouver MLSLINK HPI
Projections Below
69

APPENDIX III CRYSTAL BALL REPORT
Crystal Ball Report
Simulation started on 3/7/09 at 18:24:49Simulation stopped on 3/7/09 at 19:45:28
Target Forecast: Total Equity IRR
Average Sales Price ($ per square foot) .70
Sales Pace (# units per month) .54
Construction Contingency -.34
Year 3 ADR .16
Development Timeline -.06
-1 -0.5 0 0.5 1
Measured by Rank Correlation
Sensitivity Chart
CRYSTAL BALL SCENARIO RESULTS - TOTAL EQUITY IRR
Summary:Display Range is from 2% to 35% Entire Range is from -7% to 38% After 1,000 Trials, the Std. Error of the Mean is 0%
Statistics: ValueTrials 1000Mean 18%Median 18%Mode ---Standard Deviation 6%Variance 0%Skewness -0.34Kurtosis 3.58Coeff. of Variability 0.35Range Minimum -7%Range Maximum 38%Range Width 45%Mean Std. Error 0.20%
70

Frequency Chart
%
.000
.008
.016
.023
.031
0
7.75
15.5
23.25
31
2% 10% 18% 26% 35%
1,000 Trials 983 Displayed
Forecast: Total Equity IRR
Forecast: Total Equity IRR (cont'd) Cell: H172
Percentiles:
Percentile %0% -7%
10% 11%20% 13%30% 15%40% 16%50% 18%60% 20%70% 21%80% 23%90% 26%
100% 38%
End of Forecast
71

SOURCES BC Stats. (2009, February). Sub-Provincial Population Projections (P.E.O.P.L.E. 33). Retrieved on
February 1, 2009, from http://www.bcstats.gov.bc.ca/data/pop/pop/popproj.asp Babson Capital. (2009, January). MarketView: A Publication of the REFG Valuation Section.
References data from Korpacz Real Estate Investor Survey (1Q03 – 3Q08). Retrieved on March 8, 2009, from http://www.babsoncapital.com/BabsonCapital/http/bcstaticfiles/Research/file/MarketView_MV3759_Jan09.pdf
Bank of Canada. Canada Mortgage and Housing Corporation - Average Residential Mortgage
Lending Rate – 5 Year. Retrieved on February 1, 2009, from http://www.bankofcanada.ca/pdf/annual_page57_page58.pdf
British Columbia Film Commission. Production Statistics 2007. Retrieved on September 20, 2008,
from http://www.bcfilmcommission.com/about_us/stats.htm Canada Mortgage and Housing Corporation. (2009, January). HOUSING NOW: Vancouver and
Abbotsford CMAs. pp. 1-2, 16, 22. Retrieved on February 1, 2009, from http://www.cmhc-schl.gc.ca/odpub/esub/64175/64175_2009_M01.pdf
Canada Mortgage and Housing Corporation. Fall 2008 Rental Market Report. Vancouver and
Abbotsford CMAs. pp. 3-4. Retrieved on February 1, 2009, from http://www.cmhc-schl.gc.ca/odpub/esub/64175/64175_2009_M01.pdf
City of Vancouver. Metro Vancouver Key Facts. Average and Median Household Income, 1991 –
1996 – 2001 – 2006 Census. Retrieved November 21, 2008, from http://www.metrovancouver.org/about/publications/Publications/KeyFacts-AverageHouseholdIncome1991-1996-2001-06.pdf
City of Vancouver. Metro Vancouver Key Facts. Average Income per Tax Filer (Current) 1993 -
2006. Retrieved November 21, 2008, from http://www.metrovancouver.org/about/publications/Publications/KeyFacts-AverageIncomeperTaxFiler.pdf
City of Vancouver. Metro Vancouver Key Facts. BC Stats Population Estimates 1996 -2008.
Retrieved November 21, 2008, from http://www.metrovancouver.org/about/publications/Publications/KeyFacts-MetroVancouverPopulationEstimates1996-2008.pdf
City of Vancouver. Metro Vancouver Key Facts. Census Population Trends 1976 - 2006. Retrieved
November 21, 2008, from http://www.metrovancouver.org/about/publications/Publications/KeyFacts-PopulationintheGVRD1976-2006Census.pdf
72

City of Vancouver. Metro Vancouver Key Facts. Housing Starts by Municipality 1996 – 2007. Retrieved November 21, 2008, from http://www.metrovancouver.org/about/publications/Publications/KeyFacts-MetroVancouverHousingStartsbyMunicipality1996-2007.pdf
City of Vancouver. Metro Vancouver Key Facts. Housing Starts by Municipality by Structural Type,
1961 – 2007. Retrieved November 21, 2008, from http://www.metrovancouver.org/about/publications/Publications/KeyFacts-TotalHousingStartsbyStructuralType1961-200.pdf
City of Vancouver. Metro Vancouver Key Facts. Major Firms 2007. Retrieved August 2, 2008, from
http://www.metrovancouver.org/about/publications/Publications/KeyFacts-MajorFirmsMetroVancouver.pdf
City of Vancouver. Metro Vancouver Key Facts. Migration Component 1991 – 2007. Retrieved
November 21, 2008, from http://www.metrovancouver.org/about/publications/Publications/migrationcomponent.pdf
Colliers International. (2008). Metro Vancouver Market Report Fourth Quarter 2008. Retrieved on
January 19, 2009, from http://www.colliersmn.com/prod/ccgrd.nsf/publish/7EBB413CD8517FD285257527006452DB/$File/Colliers+Office+Market+Report+-+Q4-08+E.pdf
Real Estate Strategies, Inc. (2006, June 23). Market Report for Proposed Ritz-Carlton Residences,
Vancouver, 10-13, 16, 22-29. Real Estate Board of Greater Vancouver. (2008, September). MLSLINK House Pricing Index.
Retrieved on February 1, 2009, from http://storage.ubertor.com/cl2849/content/document/9963.pdf
Tourism Vancouver. (2007). Tourism Data for Greater Vancouver. Cruise Ship Data for Metro
Vancouver 1986 – 2007. Retrieved on August 22, 2008, from http://www.tourismvancouver.com/pdf/research/cruise_volume_1986_2007.pdf
Tourism Vancouver. (2007). Tourism Data for Greater Vancouver. Hotel/Motel Rooms Available in
Metro Vancouver. Retrieved on August 22, 2008, from http://www.tourismvancouver.com/pdf/research/hotelmotel_rooms_available.pdf
Tourism Vancouver. (2007). Tourism Data for Greater Vancouver. Hotel Occupancy and Average
Daily Rate – Metro Vancouver 1992 – 2007. Retrieved on August 12, 2008, from www.tourismvancouver.com
Tourism Vancouver. (2007). Tourism Data for Greater Vancouver. Market Origin of Overnight
Visitors to Metro Vancouver. Retrieved on August 22, 2008, from http://www.tourismvancouver.com/pdf/research/annual_geographic_market_origin_1994_2007.pdf
73

Tourism Vancouver. (2007). Tourism Data for Greater Vancouver. Plans for Future Accommodation in Metro Vancouver. Retrieved on November 22, 2008, from http://www.tourismvancouver.com/pdf/research/future_hotels.pdf
Transport Canada. (2007, July). Transport Canada Aviation Forecast. Retrieved on January 15,
2009, from http://www.tc.gc.ca/policy/Report/Summary/2006-2020/tables/table2-2e.html Vancouver Airport Authority. Aviation Activity and Market Highlights December 2008. Retrieved on
February 15, 2009, from http://www.yvr.ca/pdf/authority/statistics/December_2008_Traffic_Update.pdf
74