~lv v'ien~ tc:iioiv agenly` epa w - usgs
TRANSCRIPT

Field Tests of Polyethylene-Membrane Diffusion Samplers for Characterizing Volatile Organic Compounds in Stream-Bottom Sediments, Nyanza Chemical Waste Dump Superfund Site, Ashland, Massachusetts Nater-Resources' Investigations Report 00-4108
vl~i .~lv v'IEN ~ tC : IIOiV AGENLY`
EPA
w.USGScience fora changing world

U.S . Department of the Interior U.S . Geological Survey
Field Tests of Polyethylene-Membrane Diffusion Samplers for Characterizing Volatile Organic Compounds in Stream-Bottom Sediments, Nyanza Chemical Waste Dump Superfund Site, Ashland, Massachusetts By FOREST P. LYFORD, RICHARD E . WILLEY, and SCOTT CLIFFORD
Water-Resources Investigations Report 00-4108
Prepared in cooperation with theU.S . ENVIRONMENTAL PROTECTION AGENCY
Northborough, Massachusetts2000

�����U.S .DEPARTMENT OF THE INTERIORBRUCE BABBITT, Secretary
U.S. GEOLOGICAL SURVEY Charles G . Groat, Director
The use of trade or product names in this report is for identification purposes only and does not constitute endorsement by the U.S . Geological Survey.
For additional information write to :
Chief, Massachusetts-Rhode Island DistrictU.S . Geological SurveyWater Resources Division10 Bearfoot RoadNorthborough, MA 01532or through our website at
http://ma.water.usgs.gov
Copies of this report can be purchased from :
U.S . Geological SurveyBranch of Information ServicesBox 25286Denver, CO 80225-0286

CONTENTS Abstract . . . . . . . . . . . . . . . . . . . . . . . . . . . . . . . . . . . . . . . . . . . . . . . . . . . . . . . . . . . . . . . . . . .. . . . . . . . . . . . . . . . . . . . . . . .. . . . . . . . . . . . . . . . . . . . . . . . . . . . . . . . . . . .. . . . . . . . . . . . . . . . . . . . . . . . . . . . . . . . . . . . . . . . . . . . . . . . . . 1 Introduction . . . . . . . . . . . . . . . . . . . . . . . . . . . . . . . . . . . . . . . . . . . . . . . . . . . . . . . . . . . . .. . . . . . . . . . . . . . . . . . . . . . . .. . . . . . . . . . . . . . . . . . . . . . . . . . . . . . . . . . . . . . . . . . . . . . . . . . . . . . . . . . . . . . . . . . . . . . . . . . . . . . . . . . . . . . 2 Description of Study Area . . . . . . . . . . . . . . . . . . . . . . . . . . . . . . . . . . . . . . . . . . . . . . . . . . . . . . . . . . . . . . . . . . . . . . . . . . . . . . . . . . . . . . . . . . . . . . . . . . . . . . . . . . . . . . . . . . . . . . . . . . . . . . . . . . . . . . . . . . . . . . . . . . . . . 2 Study Methods . . . . . . . . . . . . . . . . . . . . . . . . . . . . . . . . .. . . . . . . . . . . . . . . . . . . . . . . .. . . . . . . . . . . . . . . . . . . . . . . . . . . . . . . . . . . . . . . . . . . . . . . . . . . . . . . . . . . . . . . . . . . . . . . . . . . . . . . . . . . . . . . . . . . . . . . . . . . . . . . . . . . . . . 6 Distribution of Volatile Organic Compounds Detected in Vapor-Diffusion Samplers . . . . . . . .. . . . . . . . . . . . . . . . . . . . . . . . . . . . . . . . . . . . . . . . . . . . . . . . . . 8 Equilibration Time for Volatile Organic Compounds in Diffusion Samplers . . . . . . . . . . . . . . . . . . . . .. . . . . . . . . . . . . . . . . . . . . . . . . . . . . . . . . . . . . . . . . . . . . . . . . . 11 Comparison of Chemical Analytical Results . . . . . . . . . . . . . . . . . . . . . . . . . . . . . . . . . . . . . . . . . . . . . . . . . . . . . . . . . . . . . . . . . . . . . . . . . . . . . . . . . . . . . . . . . . . . . . . . . . . . . . . . . . . . . . . . . . . . . . . . 12
Vapor- and Water-Diffusion Samples . . . . . . . . . . . . . . . . . . . . . . . . . . . . . . . . . . . . . . . . . . . . . . . . . . . . . . . . . . . . . . . . . . . . . . . . . . . . . . . . . . . . . . . . . . . . . . . . . . . . . . . . . . . . . . . . . . . . . . . . . . 12 Water-Diffusion Samples and Seepage-Meter Samples . . . . . . . . . . . . . . . . . . . . . . . . . . . . . . . . . . . . . . . . . . . . . . . . . . . . . . . . . . . . . . . . . . . . . . . . . . . . . . . . . . . . . . . . . . . . . . 15 Water-Diffusion Samples and Sediment Samples . . . . . . . . . . . . . . . . . . . . . . . . . . . . . . . . . . . . . . . . . . . . . . . . . . . . . . . . . . . . . . . . . . . . . . . . . . . . . . . . . . . . . . . . . . . . . . . . . . . . . . . 16
Use of Diffusion Samplers as Reconnaissance Tools . . . . . . . . . . . . . . . . . . . . . . . . . . . . . . . . . . . . . . . . . . . . . . . . . . . . . . . . . . . . . . . . . . . . . . . . . . . . . . . . . . . . . . . . . . . . . . . . . . . . . . . . . . . . 17 Summary . . . . . . . . . . . . . . . . .. . . . . . . . . . . . . . . . . . . . . . . . . . . . . . . . . . . . . . . . . . . . . . . .. . . . . . . . . . . . . . . . . . . . . . . . . . . . . . . . . . . . . . . . . . . . . . . . . . . . . . . . . . . . . . . . . . . . . . . . . . . . . . . . . . . . . . . . . . . . . . . . . . . . . . . . . . . . . . 18 References . . . . . . . . . . . . . . .. . . . . . . . . . . . . . . . . . . . . . . . . . . . . . . . . . . .. . . . . . . . . . . . . . . . . . . . . . . . . . . . . . . . . . . . . . . . . . . . . . . . . . . . . . . . . . . . . . . . . . . . . . . . . . . . . . . . . . . . . . . . . . . . . . . . . . . . . . . . . . . . . . . . . . . . . . . . . . 19
FIGURES 1, 2 . Maps showing :
1 . Location of Nyanza Chemical Waste Dump Superfund Site, sampling locations, potentiometricsurface contours for the surficial aquifer, and directions of ground-water flow, Ashland, Massachusetts . . . . . . . . . . . . . . . . . . . . . . . . . . . . . . . . . . . . . . . . . . . . . . . . . . . . . . . . . . . . . . . . . . . . . . . . . . . . . . . . . . . . . . . . . . . . . . . . . . . . . . . . . . . . . . . . . . . . . . . . . . . . . . . . . . . . . . . . . . . . . . . . 3
2 . The extent of contaminants in ground water and concentrations of chlorobenzene and trichloroethene detected in vapor-diffusion samplers on February 16, 1999 . . . . . . . . . . . . . . . . . . . . . . . . . . . . . . . . . . . . . . . . . . . . . . . . 5
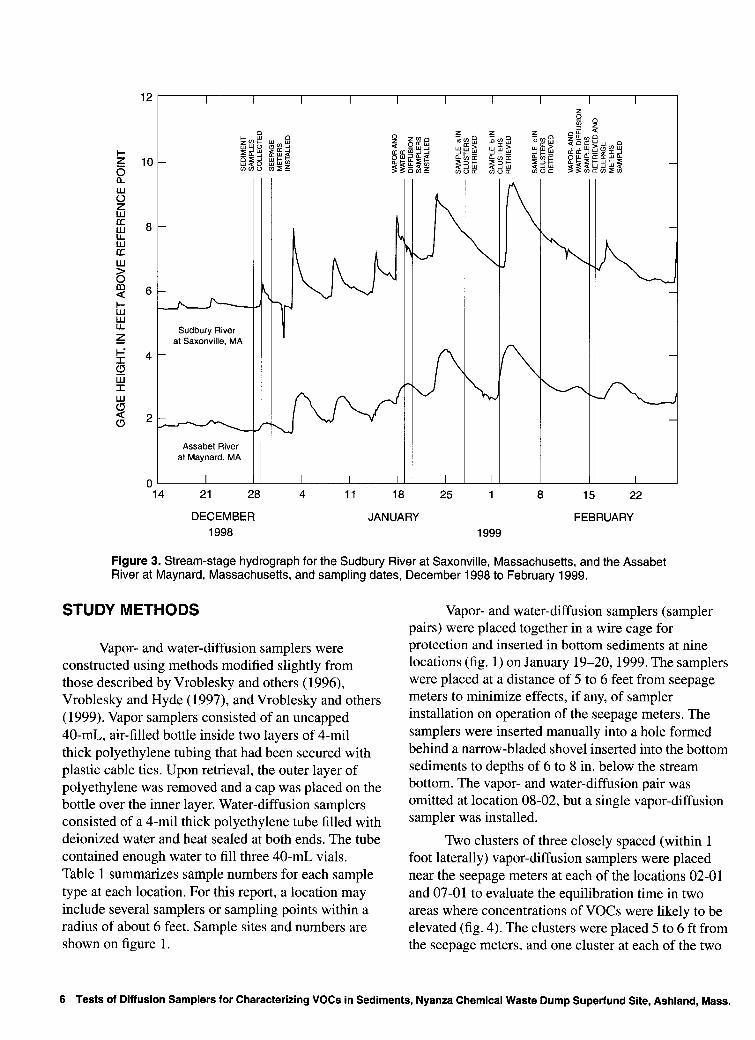
3 . Stream-stage hydrograph for the Sudbury River at Saxonville, Massachusetts, and the Assabet River at Maynard, Massachusetts, and sampling dates, December 1998 to February 1999 . . . . . . . . . . . . . . . . . . . . . . . . . . . . . . . . . . . . . .. . . . . . . . . 6
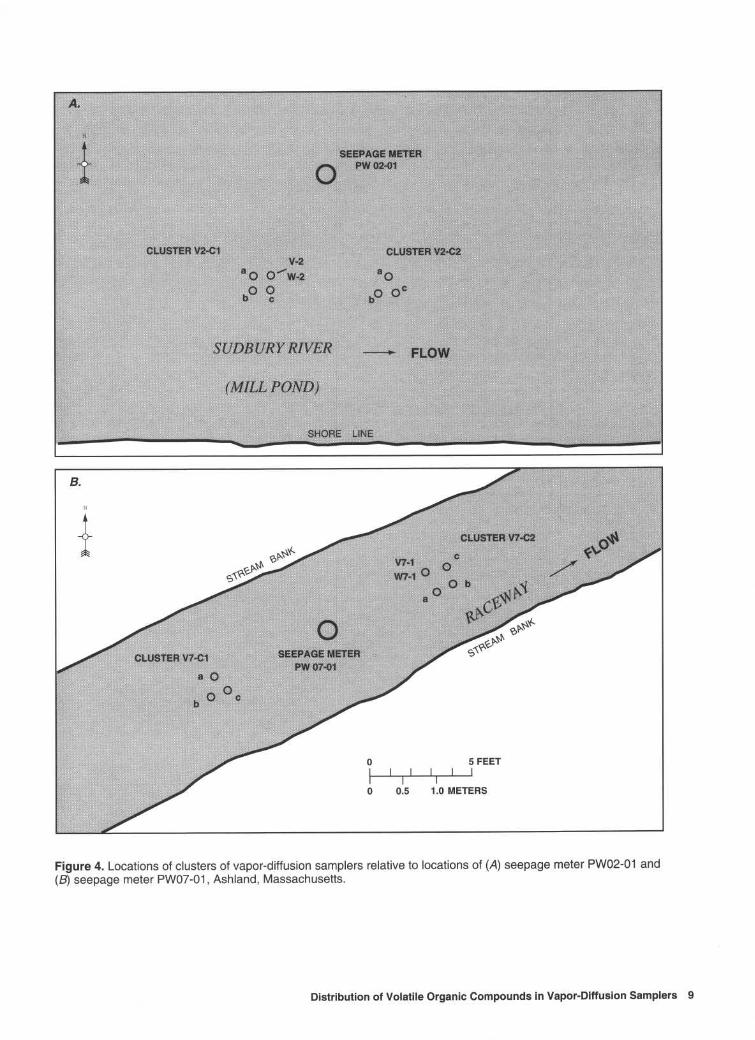
4 . Diagram showing the locations of clusters of vapor-diffusion samplers relative to locations of (A) seepage meter PW02-01, and (B) seepage meter PW07-01 . . . . . . . . . . . . . . . . . . . . . . . . . . . . . . . . . . . . . . . . . . . . . . . . . . . . . . . . . . . . . . . . . . . . . . . . . . . . . . . . . . . . . . . . . . . . . . . . 9
5-7 . Graphs showing : 5 . Concentrations of chlorobenzene and trichloroethene detected in vapor-diffusion samplers at
(A) sample location 02-01 and (B) sample location 07-01, January and February 1999 . . . . . . . . . . . . . . . . . . . . . . . . . . . . . . 12 6 . Concentrations of (A) chlorobenzene and (B) trichloroethene in vapor- and water-diffusion samplers,
February 16, 1999 . . . . . . . . . . . . . . . . . . . . . . . . . . . . . . . . . . . . . . . . . . . . . . . . . . . . . . . . . . . . . . . . . . . . . . . . . . . . . . . . . . . . . . . . . . . .. . . . . . . . . . . . . . . . . . . . . . . . . . . . . . . . . . . . . . . . . . . . . 15 7 . Concentrations of selected volatile organic compounds detected in water-diffusion samplers and
concentrations in water from seepage meters . . . . . . . . . . . . . . . . . . . . . . . . . . .. . . . . . . . . . . . . . . . . . . . . . . .. . . . . . . . . . . . . . . . . . . . . . . . . . . . . . . . . . . . . . . . . . . . . 16
TABLES 1 . Summary of sample numbers at sampling locations, Nyanza Chemical Waste Dump Superfund Site,
Ashland, Massachusetts . . . . . . . . . . . . . . . . . . . . . . . . . . . . . . . . . . . . . . . . . . . . . . . . . . . . . . . . . . . . . . . . . . . . . . . . . . . . . . . . . . . . . . . . . . . . . . . . . . . . . . . . . . . . . . . . . . . . . . . . . . . . . . . . . . . . . . . . . . 7 2. Concentrations of volatile organic compounds detected in vapor from vapor-diffusion samplers retrieved
on February 16, 1999, near the Nyanza Chemical Waste Dump Superfund Site . . . . . . . . . . . . . . . . . . . . . . . . . . . . . . . . . . . . . . . . . . . . . . . . . . . 10 3 . Concentrations of volatile organic compounds detected in clusters of vapor-diffusion samplers retrieved
during January and February 1999 near the Nyanza Chemical Waste Dump Superfund Site . . . . . . . . . . . . . . . . . . . . . . . . . . . . . . . . 11 4. Concentrations of volatile organic compounds in vapor-diffusion samplers, water-diffusion samplers,
seepage meters, and sediments, December 1998 to February 1999, Nyanza Chemical Waste Dump Superfund Site . . . . . . . . . . . . . . . . . . . . . . . . . . . . . . . . . . . . . . . . . . . . . . . . . . . . . . . . . . . . . . . . . . . . . . . . . . . . . . . . . . . . . . . . . . . . . . . . . . . . . . . . . . . . . . . . . . . . . . . . . . . . . . . . . . . . . . . . . . . . . . . . . . . . . . . . . 13
Contents III

CONVERSION FACTORS, VERTICAL DATUM, AND ABBREVIATIONS
CONVERSION FACTORS
Multiply By To obtain feet (ft) 0.3048 meters
inches (in.) 2.54 centimeters mil (mil) 0.0254 millimeters
Temperature in degrees Celsius (°C) may be converted to€degrees Fahrenheit (°F) as follows:€
°F=1 .8 °C+32€
VERTICAL DATUM
Sea level: In this report, "sea level" refers to the National Geodetic Vertical Datum of 1929 (NGVD of 1929)-a geodetic datum derived from a general adjustment of the first-order level nets of the United States and Canada, formerly called Sea Level Datum of 1929 .
ABBREVIATIONS
cis-DCE cis-1,2-dichloroethene ppb v parts per billion by volume mg/kg milligrams per kilogram mL milliliter PCE tetrachloroethene€SVOCS semi-volatile organic compounds€TCE trichloroethene Ng/kg micrograms per kilogram Rg/L micrograms per liter pS/cm microsiemens per centimeter at 25°C VOCS volatile organic compounds
1V Contents

Field Tests of Polyethylene-Membrane Diffusion Samplers for Characterizing Volatile Organic Compounds in Stream-Bottom Sediments, Nyanza Chemical Waste Dump Superfund Site, Ashland, Massachusetts
By Forest R Lyford, Richard E. Willey, and Scott Clifford
Abstract
Aplume of volatile organic compounds (VOCs) in ground water extends from the Nyanza Chemical Waste Dump Superfund site in Ashland, Massachusetts, northward toward a mill pond on the Sudbury River and eastward toward the Sudbury River and former mill raceway downstream from the mill pond. Polyethylene-membrane water-to-vapor (vapor) and water-to-water (water) diffusion samplers were installed in January 1999 in bottom sediments along the Sudbury River and former mill raceway in a pilot study to determine if vapor samplers would be useful in this setting for delineating a plume of contaminants in ground water near the river and raceway, to evaluate equilibration time for vapor-diffusion samplers, and to determine if diffusion samplers might be an alternative to seepage meters (inverted steel drums) and sediment sampling for evaluating concentrations of VOCs in bottom sediments.
Of five tested compounds (benzene, trichloroethene, toluene, tetrachloroethene, and chlorobenzene), chlorobenzene and trichloroethene were most frequently detected in vapor from vapor-diffusion samplers . The distribution of VOCs was generally consistent with a previously mapped plume of contaminants in ground water. The field evaluation of equilibration times for vapor-diffusion samplers was inconclusive because of changing hydrologic conditions that may have affected concentrations of VOCs,
possible variations in concentrations ofVOCs over short distances, and imprecise sampling and analytical methods . The limited data, however, indicated that equilibration may require 3 weeks or more in some settings .
VOCs detected in samples from water-diffusion samplers and their concentrations were comparable to results from seepage meters, and VOCs detected in vapor-diffusion samplers correlated with VOCs detected in water-diffusion samplers. These results indicate that either vapor-or water-diffusion samplers would serve as an economical alternative to seepage meters for sampling of VOCs in pore water from stream-bottom sediments . Results from diffusion samplers correlated poorly with results from sediment samples, partly because of high quantitation limits for chemical analyses of sediments. In general, results from the diffusion samplers better represented the distribution of VOCs than the results from the sediment samples . This pilot study indicates that diffusion samplers are an economical means of identifying "hot spots" for contaminants in bottom sediments and can provide insights on transport pathways for contaminants near surface-water bodies. After establishing equilibration times for a particular site, diffusion samplers also may be useful for studying variations in concentrations of VOCs over short distances, variations with time and changing hydrologic conditions, and processes such as chemical transformations by biodegradation and exchanges between surface water and ground water in the hyporheic zone .
Abstract 1

INTRODUCTION
Volatile organic compounds (VOCs) and semi-volatile organic compounds (SVOCs) are present in ground water near the Nyanza Chemical Waste Dump Superfund site (Nyanza site) in Ashland, Mass. (Roy F. Weston, Inc., 1998). Water-quality data and water-level data from monitoring wells indicate that contaminated ground water discharges to the surface in two areas: (1) along the Sudbury River at the upstream end of a mill pond and (2) along the Sudbury River and a former mill raceway downstream from the mill pond and parallel to the river (fig . 1) (Roy F. Weston, Inc., 1998). During 1998--99, the U.S . Environmental Protection Agency (USEPA), through the U.S . Army Corps of Engineers (USACE), supported a study by Roy F. Weston, Inc. (1999b) of contaminants in bottom sediments along the Sudbury River and former mill raceway. In this study, water was extracted from inverted steel drums (seepage meters) placed in streambottom sediments . Bottom sediments also were sampled for VOCs, SVOCs, and mercury. The USEPA requested that the USGS use polyethylene-membrane water-to-vapor diffusion samplers (referred to as vapordiffusion samplers in this report) to test their application for delineating the distribution of VOCs in ground-water discharge areas and as a pilot study to determine if vapor- and polyethylene-membrane waterto-water-diffusion samplers (referred to as waterdiffusion samplers in this report) might serve as cost-effective alternatives to other methods for characterizing contaminants at the interface between ground water and surface water. Also of interest to USEPA is the time needed forVOC concentrations in ground water to re-equilibrate after sediments have been disturbed by emplacement of vapor-diffusion samplers .
The objectives of this study were to :
1 . Determine if the distribution and concentrations of VOCs detected in vapor-diffusion samplers, whichwere placed in stream-bottom sediments, are consistent with the previously mapped distribution of contaminants in ground water near the Nyanza site, Ashland, Mass.
2. Determine the time needed forVOCs in bottom sediments to re-equilibrate after installation of the samplers .
3. Determine if vapor- and water-diffusion samplers might serve as alternatives to other sampling techniques, specifically seepage meters and sediment sampling, to characterize the occurrence of VOCs in stream-bottom sediments .
This report (1) describes the distribution of VOCs along the Sudbury River and mill raceway determined by use of vapor-diffusion samplers ; (2) presents results of an experiment to determine equilibration times forVOCs after installation of samplers in sediments; (3) compares results from vapor-diffusion samplers to results from water diffusion samplers, seepage meters, and sediment sampling; (4) discusses considerations for using diffusion samplers on the basis of results from this pilot study, and suggests additional studies that would further test and refine the use of diffusion samplers for characterizing contaminants at the interface between ground water and surface water.
USGS personnel constructed, installed, and retrieved vapor and water-diffusion samplers. The vapor-diffusion samples were analyzed on site by Scott Clifford, USEPA. Water samples from diffusion samplers and water samples from seepage meters were submitted by Roy F. Weston, Inc., personnel to a private laboratory for analysis . Appreciation is extended to Sharon Hayes, USEPA Site Manager, and Kathleen Taylor, Roy F. Weston, Inc., for logistical support and assistance during the study.
DESCRIPTION OF STUDY AREA
The study area is along the Sudbury River in Ashland, Massachusetts . At its closest point, the river is approximately 700 ft north of the Nyanza site (fig . 1). The upstream part of the study area is within a former mill pond. The downstream part of the study area below the mill pond includes the Sudbury River and a former mill raceway.
2 Tests of Diffusion Samplers for Characterizing VOCs in Sediments, Nyanza Chemical Waste Dump Superfund Site, Ashland, Mass.

��������������
------------
606,000 607,000 608,000 609,000 610,000
460,000
459,000
458,000
MILL PON1)
(w-01
RAILROAD
NYANZA CHEMICAL
WASTE DUMP SUPERFUND
SITE
w w
TES \\ , channel -A I 07-02
MMW4405B\~ a-2 s,a. . " ~Z v a- 1/1
EXPLANATION
APPROXIMATE BOUNDARY OF NYANZA CHEMICAL WASTEDUMP SUPERFUND SITE
1s0- POTENTIOMETRIC CONTOUR IN SURFICIALAQUIFER-Shows altitude at which waterlevel would have stood in wells completed in surficial materials. Dashed where approximately located . Interval is 5 feet. Datum is sea level. Data from Roy F. Weston, Inc., 1998
GENERAL DIRECTION OF GROUND-WATER FLOW IN SURFICIAL AQUIFER
01-01 LOCATION ANDNUMBER OF MULTI-SAMPLE 0 GROUP-Sample groups include vapor- and water
diffusion pairs, seepage meters, and sediment samples . May also include clusters of vapor-diffusion samplers
Vla VAPOR-DIFFUSION SAMPLER ONLY
02-01 MULTI-SAMPLE GROUP IEI
MW-305B SELECTED MONITORINGWELL
0 200 400 600 FEET
0 100 METERS
_-____--___--____-____-____-___:
Base map modified from area site plan, Department of theArmy New England District Corps of Engineers,Concord, Massachusetts and Weston Managers Designers/Consultants,1,000 foot grid based on Massachusetts State coordinate system, mainland zone
Figure 1 . Location of Nyanza Chemical Waste Dump Superfund Site, sampling locations, potentiometric-surface contours for the surficial aquifer, and directions of ground-water flow, Ashland, Massachusetts .

The ground-water system includes a surficial aquifer that consists of glacial lake deposits, till, and fractured crystalline rock . The glacial lake deposits range in grain size from silt to coarse sand and gravel . The thickness of fine-grained sediments increases eastward, and the till layer is discontinuous beneath the lake sediments (Ebasco Services, Inc., 1991, figs . 3-5 to 3-12). The depth to bedrock increases from less than 30 ft in the mill pond area to nearly 80 ft in an east-west trending trough that passes through the area near wells MW405A and MW405B downstream from the dam (Ebasco Services, Inc., 1991, fig. 3-1) (fig . 1). Most of the Superfund Site is on till-covered bedrock.
In general, ground water flows northward and eastward from the Nyanza site toward the Sudbury River.A potentiometric surface map for the surficial aquifer (Roy F Weston, Inc., 1998) (fig. 1) indicates that ground water in the western part of the study area flows northward toward the Sudbury River at the upstream end of the mill pond . The close spacing of potentiometric contours within the Nyanza site reflects the occurrence of ground water in poorly transmissive till . The direction of ground-water flow shifts eastward near the downstream end of the mill pond and downstream from the mill pond . Water-level data presented by Roy F. Weston, Inc. (1998), also indicate that water infiltrates from the pond to the aquifer downstream from sampling location 04-01. The raceway appears to receive much of its water from ground-water sources. During the study period, however, the upstream end of the raceway was receiving some flow from the Sudbury River through a connecting channel (fig . 1).
A plume of contaminants in the surficial and bedrock aquifer system extends from the area of the Nyanza site northward to the Sudbury River and mill pond. The plume also extends eastward to the river and raceway downstream from the dam (fig . 2) . VOCs that have been detected in ground water include 1,1,1-trichloroethane, benzene, chlorobenzene, cis-DCE, PCE, TCE, and vinyl chloride (Roy F Weston, Inc., 1999a; 1999b) . Chlorobenzene, TCE, and cis-DCE are the VOCs most commonly detected in ground water. Concentrations of VOCs in water from monitoring wells near the mill pond (fig. 1) are highest in well MW-305A, whichwas completed in bedrock. VOCs detected in a sample collected from this well in January 1999 included chlorobenzene (2,400 pg/L), cis-DCE (82 [ug/L), TCE (2,700 jig/L), and vinyl chloride (2 pg/L). Also detected were mercury (1.38 [tg/L) and
the SVOCs 1,2,4-dichlorobenzene (71 Rg/L), 1,2-dichlorobenzene (1,700 [tg/L), 1,3-dichlorobenzene (69 [g/L), and 1,4-dichlorobenzene (350 ~tg/L) . VOC concentrations in a water sample collected from well MW-305B completed in surficial materials at the same location were less than 10 [g/L, mercury concentration was 0.109 [g/L, and SVOCs were not detected .
Concentrations ofVOCs in water from monitoring wells MW-405A and MW-405B located between the Sudbury River and the mill raceway are highest in well MW-405B completed in the surficial aquifer. VOCs detected in a sample collected from this well in January 1999 included chlorobenzene (5,600 pg/L), cis-DCE (120 ~ug/L), and TCE (7,600 pg/L). Vinyl chloride was below the detection limit of 2 [tg/L. Also detected were mercury (0.0124 [tg/L) and the SVOC 1,2-dichlorobenzene (450 pg/L). The SVOCs 1,3-dichlorobenzene, and 1,4-dichlorobenzene were below the detection limits of 220 gg/L. VOCs detected in a water sample collected from well MW-405A, which was completed in bedrock at the same location, were chlorobenzene (29 [tg/L) and TCE (34 [ug/L) . Mercury was detected at a concentration of 0.0256 [tg/L, and concentrations of SVOCs were below 50 Rg/L .
Stream-bottom materials near sampling site 01-01 are cobbles and pebbles. Downstream from this site, the bottom material is a thick layer of soft organic matter. In the cove of the mill pond near sampling site 05-05, bottom materials along the shore are rocks and gravel . The river bottom downstream from the dam consists of rocks and coarse gravel . Bottom materials along the raceway are mainly soft and organic-rich, except near the downstream sampling location (08-01) where the bottom consists of gravel .
At the time samplers were installed on January 19-20,1999, the mill pond was ice covered except in a few open areas near the shore. Several samplers were placed through holes cut in the ice. The river and raceway downstream from the dam were ice free . Several rain storms and periods of snowmelt caused streamflow and stream stage to rise during the period when samplers were in place. The pond was largely ice free when samplers were retrieved on February 16, 1999 . Stage hydrographs for the Sudbury River at Saxonville, Mass., and the Assabet River at Maynard, Mass . (fig . 3), located several miles from Ashland, indicate that streamflow conditions varied during the study period .
4 Tests of Diffusion Samplers for Characterizing VOCs in Sediments, Nyanza Chemical Waste Dump Superfund Site, Ashland, Mass.

606,000 607,000 608,000 609,000 610,000
TCE-ND CB-ND
460,000
459,000
Rp TCE-ND CB-78
N'7-1 / . . w V8-2 i ' V7b-1 VSa-1TCE-35 (LOST) ,~v8-1
CB-1780
EXPLANATION
STANDARDS FOR DRINKING WATER FROM GROUND WATER EXCEEDED-Shows area whereat least one chemical in ground waterthat is believed to originate from Nyanza site exceeds Massachusetts criteria for drinking water. The location of this line was determined on the basis of water samples from numerous wells not shown on this map (Roy F. Weston, Inc., 1999a)
CONCENTRATIONS OF TRICHLOROETHENE (TCE) AND TCE-34 CHLOROBENZENE (CB) IN VAPOR-DIFFUSION SAMPLERS-
CB-130€ Numbers are concentrations in parts per billion by volume on February 16, 1999 ; ND, not detected . See table 2 for other chemicals
458,000 V1
Base map modified from area site plan, Department of the�Army New England District Corps of Engineers,�Concord, Massachusetts andWeston Managers Designers/Consultants,�1,000foot grid based on Massachusetts State coordinate system, mainland zone�
detected in vapor-diffusion samplers .
VAPOR SAMPLER LOCATION ANDNUMBER
0 500 1000 FEET I I
I I I r 0 100 200 300 METERS
Figure 2 . The extent of contaminants in ground water and concentrations of chlorobenzene and trichloroethene detected in vapor-diffusion samplers on February 16, 1999, Ashland, Massachusetts .
�
Z0a w UZ w w w
w O m Hww Z
O w
w OQO
14 21 28 4 11 18 25 1 8 15 22
DECEMBER JANUARY FEBRUARY 1998 1999
Figure 3 . Stream-stage hydrograph for the Sudbury River at Saxonville, Massachusetts, and the Assabet River at Maynard, Massachusetts, and sampling dates, December 1998 to February 1999 .
STUDY METHODS
Vapor- and water-diffusion samplers were constructed using methods modified slightly from those described by Vroblesky and others (1996), Vroblesky and Hyde (1997), and Vroblesky and others (1999) . Vapor samplers consisted of an uncapped 40-mL, air-filled bottle inside two layers of 4-mil thick polyethylene tubing that had been secured with plastic cable ties . Upon retrieval, the outer layer of polyethylene was removed and a cap wasplaced on the bottle over the inner layer. Water-diffusion samplers consisted of a4-mil thick polyethylene tube filled with deionized water and heat sealed at both ends . The tube contained enough water to fill three 40-mL vials. Table 1 summarizes sample numbers for each sample type at each location . For this report, a location may include several samplers or sampling points within a radius of about 6 feet . Sample sites and numbers are shown on figure 1 .
Vapor- and water-diffusion samplers (sampler pairs) were placed together in a wire cage for protection and inserted in bottom sediments at nine locations (fig . 1) on January 19-20, 1999 . The samplers were placed at a distance of 5 to 6 feet from seepage meters to minimize effects, if any, of sampler installation on operation of the seepage meters . The samplers were inserted manually into a hole formed behind a narrow-bladed shovel inserted into the bottom sediments to depths of 6 to 8 in . below the stream bottom . The vapor- and water-diffusion pair was omitted at location 08-02, but a single vapor-diffusion sampler was installed .
Two clusters of three closely spaced (within 1 foot laterally) vapor-diffusion samplers were placed near the seepage meters at each of the locations 02-01 and 07-01 to evaluate the equilibration time in two areas where concentrations of VOCs were likely to be elevated (fig . 4) . The clusters were placed 5 to 6 ft from the seepage meters, and one cluster at each of the two
6 Tests of Diffusion Samplers for Characterizing VOCs in Sediments, Nyanza Chemical Waste Dump Superfund Site, Ashland, Mass .

�
Table 1 . Summary of sample numbers at sampling locations, Nyanza Chemical Waste Dump Superfund Site, Ashland, Massachusetts
[No., number]
Sampling location No.
Sediment sample No .
Seepage Vapor-diffusion meter No . sample No.
Water-diffusion sample No.
Vapor-diffusion cluster No .
Sudbury River in Millpond
01-01 SW01-01 PW01_01 Vl W1 none 02-01 SW02-01 PW02-01 V2 W2 V2-Cla, b, and c
V2-C2a, b, and c 03-01 SW03-01 PW03-01 V3 W3 none 04-01 SW04-01 PW04-01 V4 W4 none 05-01 SW05-01 PW05-01 V5 W5 none
Sudbury River Downstream from Dam
06-01 SW06-01 PW06-01 V6 W6 none 07-02 SW07-02 PW07-02 V7-2 W7-2 none 08-02 SW08-02 PW08-02 V8-2 none none
Former Mill Raceway
07-01 SW07-01 PW07-01
08-01 SW08-01 PW08-01
seepage meters was at the location of the vapor- and water-diffusion pair. Clusters at location 02-01 were labeled V2-Cla, b, and c and V2-C2a, b, and c, and clusters at location 07-01 were labeled V7-Cla, b, and c and V7-C2a, b, and c (table 1, fig. 4) .
Additional vapor-diffusion samplers were placed at 13 locations near and between sampling locations (fig . 1) to better define the extent of VOCs in bottom sediments . Labels for these samplers included lower-case letters a and b in downstream order from the sampling location . Forexample, Vla is downstream from location 01-01 andV2a is downstream from location 02-01. Vapor samplers Vlz near location 01-01 and V8a-1 near location 08-01 are exceptions to this labeling scheme . Duplicate vapor-diffusion samplers were placed at four of these locations for quality assurance. A sampler (V7b-1) placed in the raceway disappeared prior to retrieval . Installation points were limited downstream from the dam on the Sudbury River because of steep banks, deep and swift water, and rocky bottom materials .
Vapor-diffusion samplers were installed with a narrow-bladed shovel as discussed above, or, in areas of deep water (generally greater than 2 ft), through a hole formed by driving a pipe assembly that consisted of a 2-inch outer pipe and a 1 .5-inch, pointed inner pipe into bottom sediments . In general, samplers were at
V7-1 W7-1 V7-Cla, b, and c V7-C2a, b, and c
V8-1 W8-1 none
depths that ranged from 8 to 12 in . in bottom sediments. Samplers at each cluster, however, were at a uniform depth of 12 in .
One vapor-diffusion sampler from each of the 4 clusters was retrieved once aweek for 3 weeks after installation and transported with a trip blank to the USEPA Lexington laboratory for analysis . The remaining vapor samplers and water-and vapor-diffusion sampler pairs were retrieved four weeks after installation when water samples were collected from seepage meters. Installation and retrieval dates are shown with stream-stage data on figure 3.
Vapor-diffusion samples were analyzed for VOCs in accordance with the Region I standard air screening method (U.S . Environmental Protection Agency, 1998) with a Photovac gas chromatograph equipped with a 4-foot by 1/8-inch SE-30 column and photoionization detector. Samples were analyzed within 3 hours of sample collection . Samples collected on February 16, 1999, were analyzed onsite in a mobile laboratory . Target compounds for vapor samples were benzene, toluene, TCE, PCE, and chlorobenzene .
Water samples were decanted from the polyethylene tubes to 40-mL glass vials that contained hydrochloric acid as a preservative . These samples were shipped with samples from the seepage meters to a contract laboratory for analysis of VOCs using USEPA Method 8260 . The VOCs that were analyzed using Method 8260 are as follows:
Study Methods 7
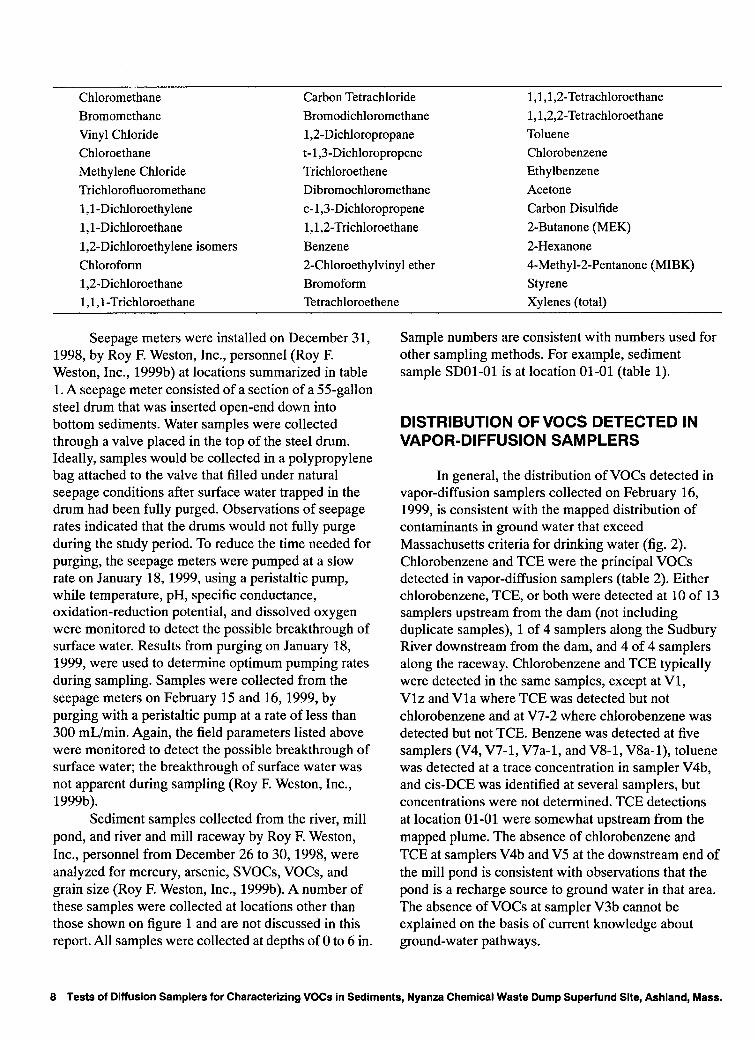
Chloromethane Carbon Tetrachloride 1,1,1,2-Tetrachloroethane Bromomethane Bromodichloromethane 1,1,2,2-Tetrachloroethane Vinyl Chloride 1,2-Dichloropropene Toluene Chloroethane t-1,3-Dichloropropene Chlorobenzene Methylene Chloride Trichloroethene Ethylbenzene Trichlorofluoromethane Dibromochloromethane Acetone 1,1-Dichloroethylene c-1,3-Dichloropropene Carbon Disulfide 1,1-Dichloroethane 1,1,2-Trichloroethane 2-Butanone (MEK) 1,2-Dichloroethylene isomers Benzene 2-Hexanone Chloroform 2-Chloroethylvinyl ether 4-Methyl-2-Pentanone (MIBK) 1,2-Dichloroethane Bromoform Styrene 1,1,1-Trichloroethane Tetrachloroethene Xylenes (total)
Seepage meters were installed on December 31, 1998, by Roy R Weston, Inc., personnel (Roy F. Weston, Inc., 1999b) at locations summarized in table 1.A seepage meter consisted of a section of a 55-gallon steel drum that was inserted open-end down into bottom sediments. Water samples were collected through a valve placed in the top of the steel drum . Ideally, samples would be collected in a polypropylene bag attached to the valve that filled under natural seepage conditions after surface water trapped in the drum had been fully purged . Observations of seepage rates indicated that the drums would not fully purge during the study period. To reduce the time needed for purging, the seepage meters were pumped at a slow rate on January 18, 1999, using a peristaltic pump, while temperature, pH, specific conductance, oxidation-reduction potential, and dissolved oxygen were monitored to detect the possible breakthrough of surface water. Results from purging on January 18, 1999, were used to determine optimum pumping rates during sampling . Samples were collected from the seepage meters on February 15 and 16, 1999, by purging with a peristaltic pump at a rate of less than 300 mL/min. Again, the field parameters listed above were monitored to detect the possible breakthrough of surface water; the breakthrough of surface water was not apparent during sampling (Roy F. Weston, Inc., 1999b) .
Sediment samples collected from the river, mill pond, and river and mill raceway by Roy F. Weston, Inc., personnel from December 26 to 30, 1998, were analyzed for mercury, arsenic, SVOCs, VOCs, and grain size (Roy F. Weston, Inc., 1999b) . A number of these samples were collected at locations other than those shown on figure 1 and are not discussed in this report . All samples were collected at depths of 0 to 6 in .
Sample numbers are consistent with numbers used for other sampling methods. For example, sediment sample SDOl-01 is at location 01-01 (table 1) .
DISTRIBUTION OF VOCS DETECTED IN VAPOR-DIFFUSION SAMPLERS
In general, the distribution of VOCs detected in vapor-diffusion samplers collected on February 16, 1999, is consistent with the mapped distribution of contaminants in ground water that exceed Massachusetts criteria for drinking water (fig . 2) . Chlorobenzene and TCE were the principal VOCs detected in vapor-diffusion samplers (table 2) . Either chlorobenzene, TCE, or both were detected at 10 of 13 samplers upstream from the dam (not including duplicate samples), 1 of 4 samplers along the Sudbury River downstream from the dam, and 4 of 4 samplers along the raceway. Chlorobenzene and TCE typically were detected in the same samples, except at V1, Vlz and Vla where TCE was detected but not chlorobenzene and at V7-2 where chlorobenzene was detected but not TCE. Benzene was detected at five samplers (V4, V7-1, V7a-1, and V8-1, V8a-1), toluene was detected at a trace concentration in sampler V4b, and cis-DCE was identified at several samplers, but concentrations were not determined. TCE detections at location O1-01 were somewhat upstream from the mapped plume. The absence of chlorobenzene and TCE at samplers V4b and V5 at the downstream end of the mill pond is consistent with observations that the pond is a recharge source to ground water in that area . The absence of VOCs at sampler V3b cannot be explained on the basis of current knowledge about ground-water pathways.
8 Tests of Diffusion Samplers for Characterizing VOCs in Sediments, Nyanza Chemical Waste Dump Superfund Site, Ashland, Mass .
�
S(/I)BC!RYRI[-TR
Figure 4. Locations of clusters of vapor-diffusion samplers relative to locations of (A) seepage meter PW02-01 and (B) seepage meter PW07-01, Ashland, Massachusetts .
Distribution of Volatile Organic Compounds in Vapor-Diffusion Samplers 9