m o n t h yl r e v i e w federal reserve bank of atlanta
TRANSCRIPT
M o n t h ly 1§P R e v i e w
FEDERAL RESERVE BANK OF ATLANTAV o l u m e X X I X A t l a n t a , G e o r g i a , S e p t e m b e r 3 0 , 1 9 4 4 N u m b e r 9
Pine, Pulp and PaperW ith the discovery that the Southern pine tree provides an
economic and renewable source of cellulose, the pulp, paper, and paper-products industry in the Southeast was elevated to an important place in the region’s economy. The pulp industry in the South is relatively new. About 3.8 million short tons of wood pulp were produced in the United States in 1920, but the South was responsible for less than one-half million tons of that amount. By 1942, however, it was producing more than twice as much wood pulp as any other region in the country was; in that year approximately 4.6 million short tons of the nation’s total 10.4 million were produced in this section of the country. The War Production Board has set a 1944 goal of 14 million cords for domestic pulpwood producers. Of this total, the Southern states from Virginia to Texas are expected to produce about 8 million cords. Thus, the increasing importance of the Southern forests in the production of pulpwood during the years since World War I has been accentuated during the present war.
Pulp mills have been established in each of the six states of the District. The Gulf States Paper Corporation established a pulp mill at Tuscaloosa, Alabama, in 1928. That same year, the Mobile Paper Mill Company established a mill at Crichton, Alabama. Three additional paper mills that came to the state were located in Mobile: the International Paper Company established a plant there in 1929; the National Gypsum Company, in 1938; and the Hollingsworth and Whitney Company, in 1940.
Although its progress has been rapid in the past few years, the development of pulp manufacture in Florida did not get under way until 1930. In that year the International Paper Company’s plant at Panama City was built. Three more new mills were located in Florida in 1938. These were the Container Corporation of America plant at Fernandina; the National Container Corporation mill at Jacksonville; and the St. Joe Paper Corporation mill at Port St. Joe. In the following year, Rayonier, Inc., established a pulp mill in Fernandina. TEe Florida Pulp and Paper Company built a mill at Pensacola in 1941, and the Santa Rosa Pulp Company is now constructing another mill there.
Not until the middle 1930’s did the Georgia development come. The Union Bag and Paper Corporation in 1936 established a mill at Savannah; in 1938, the Brunswick Pulp and Paper Company began operations at Brunswick; and in 1941, St. Mary’s Kraft Corporation built a mill at St. Mary’s.
Concentrated in the decade between 1918 and 1928, the development in Louisiana began with the construction of the Gaylord Container Corporation mill at Bogalusa during the first year of the period. The International Paper Company became the owner of two mills at Bastrop between 1921 and 1924, and the Brown Paper Mill Company, Inc., began operations in West Monroe in 1924. Two years later, the Calcasieu Paper Company built a mill at Elizabeth, and the Southern
Advance Bag and Paper Company began production at Hodge in 1928. Ten years passed before any additional pulp mills were established in the state. Then, in 1938, the International Paper Company built a pulp mill at Spring Hill.
Though pulp manufacture began in Mississippi before World War I with the establishment of an International Paper Company plant at Moss Point, subsequent development was sporadic. The Masonite Corporation began to manufacture pulp at Laurel in 1926, and within the next four years the United States Gypsum Company opened a mill at Greenville. Ten years later, in 1940, the Flintkote Company began operations at Meridian.* Three pulp mills are located in Tennessee, all established
during the 1920’s. The Mead Corporation built a mill in Kingsport in 1923, the Southern Extract Company began operations in Knoxville in 1925, and the Mead Corporation established a second mill at Harriman in the last year of the decade.► At the time of the last Census of Manufactures, 1939, the pulp and paper industry in the District had already reached major proportions, and some expansion has taken place since that year. The census figures for the year 1939 showed that manufacturers of paper, paperboard, and paper products employed 2,914 persons in Alabama. Total wages paid in the industry there during the same year were 2.9 million dollars. In Florida, 2,180 persons employed in the manufacture of the same products earned 2.5 million dollars. Earning 3.0 million dollars in the industry in Georgia were 3,192 employees. The industry in Louisiana paid 6.5 million dollars in wages to a total of 5,910 employees. Tennessee wage earners in the industry numbered 2,491 and earned a total of 2.5 million dollars during the year.
Similar figures for Mississippi are not available because the number of establishments in the state in 1939 was so small that release of the figures would indicate the size of individual plants. It is impossible to secure comparable figures for the woods’ end of the industry in the District, but additional thousands of persons were employed in cutting pulpwood and transporting it to the mills, and their wages amounted to several million dollars. All these figures have risen substantially since that year.
When the pulp and paper industry began to come South early in the present century, wage costs were substantially lower in the Southern area than they were in the rest of the country. This differential has now been narrowed. The Quarterly Labor Review of the American Paper and Pulp Association reveals that in January 1944 the average hourly wage rate paid to male common labor in the South in the industry was 60.4 cents; in the country as a whole it was 67.2 cents. States included in the Southern region by the association are South Carolina, Georgia, Florida, Alabama, Louisiana, Mississippi, Arkansas, and Texas. Tennessee is classified by the
Digitized for FRASER http://fraser.stlouisfed.org/ Federal Reserve Bank of St. Louis

7 4 M o n t h l y R e v i e w o f t h e F e d e r a l R e s e r v e B a n k o f A t l a n t a f o r S e p t e m b e r 1 9 4 4
association as being in the Central zone. In January 1944, the wage rate for male common labor in that zone was 65.1 cents.
Excluding employees of converting departments, i.e., employees engaged in manufacturing paper products, the average hourly earnings of productive employees in 204 United States pulp and paper mills increased from 49.9 cents in January 1934 to 89.3 cents in January 1944. Over the same 10-year period, average hourly earnings of productive employees in the Southern industry as represented by the figures supplied by nine mills in that zone increased from 44.8 cents to 87.8 cents. The differential has thus been narrowed from 5.1 cents to 1.5 cents in the last 10 years.
Hours of work have been increased during the past decade, but less rapidly in the South than in the country as a whole. In January 1934, 204 pulp and paper mills in the United States reported that the average number of hours worked weekly by productive employees (all employees excepting
office workers, mill managers, and superintendents) was 33.8. Ten years later, the average work week had increased to 46.4 hours. The average work week in the South was 2.1 hours longer in January 1934 than the national average work week. That month, nine Southern mills reported an average work week of 35.9 hours. The Southern average in January 1944 was 44.6 hours, 1.8 hours less than the national figure.
Between January 1934 and January 1944, mills reporting to the Pulp and Paper Association increased employment by almost 10,000 workers, from 53,758 to 63,454. Almost half of this increase took place in the South. Nine identical Southern mills in January 1934 had on their pay rolls 4,951 productive employees, and 10 years later they had 8,733. Nothing like this rate of increase was recorded in any other region. The average size of the Southern mills is much greater than that in other regions. For example, 16 mills in the Central states employed only 3,474 persons in January 1944, and 50 mills
Digitized for FRASER http://fraser.stlouisfed.org/ Federal Reserve Bank of St. Louis

M o n t h l y R e v i e w o f t h e F e d e r a l R e s e r v e B a n k o f A t l a n t a f o r S e p t e m b e r 1 9 4 4 7 5
in New England employed only 13,976 persons in that month. ̂Wartime demands have led to increased production by the
pulp and paper industry. In the first seven months of 1944, pulpwood receipts at Southern mills were 15.5 per cent higher than they were in the corresponding period of the preceding year, but this difference was lower than the national increase of 21.7 per cent for the same period. The country’s production of wood pulp to August 1 of this year was 4.2 per cent above the 1943 figure, but, because of fewer imports, total inventory of pulp on July 31, 1944, was 33.4 per cent below the level of July 31, 1943.
Paper and paperboard requirements of the war effort are immense, and supplies available for civilian uses have been seriously curtailed in recent months. Some 700,000 articles are being manufactured for the Army and Navy, and most of these items must be packaged before they can be shipped to the fronts. Perhaps the most spectacular wartime development in packaging is waterproof paper. Items wrapped in this paper can be thrown overboard and floated ashore with no danger of water damage. Military requirements for this waterproof paper were 20,000 tons during the last three months of 1943. In the first quarter of 1944, requirements jumped to 150,000 tons.
Total wood-pulp supplies available to United States mills during the three-month period from July 1 to October 1, 1944, are estimated at 2.8 million tons, of which it is estimated 2.5 million tons were domestically produced, the remainder having been imported from Canada. Total paper and paperboard production during the third quarter of this year is estimated at 4.3 million tons. Of this total, container board took 1.1 million tons, wrapping paper and bags and other coarse paper products 475,508 tons.
The continuing labor shortage has seriously handicapped attempts to expand production of wood pulp during the war. The cutting of pulpwood is still almost entirely a hand operation. About the only machines used are the five-foot saw and the smaller trucks. A portable power saw is being used in a few operations. A new saw operated on the chain principle is being tried out, and it may revolutionize the woods end of the pulp and paper industry by mechanizing the cutting of pulpwood. The problem of getting the wood to the mill after cutting is an acute one because of the heavy reliance upon trucks for this work. Shortages of repair parts, heavy-duty tires, and gasoline plus the limited supply of new trucks available to the industry are seriously handicapping operations, though the situation has improved somewhat in recent months.► In general, the pulp and paper industry in the Southeast can face the future with a degree of optimism. One reason for optimism is that the Southern mills have two distinct advantages over the Northern mills. In the first place, Southern mills are larger and newer and hence more efficient than the Northern mills. Secondly, Southern mills do not have to maintain a large stock of pulpwood because they can get deliveries the year around. Northern mills, on the contrary, cannot ordinarily get wood out of the forests during the winter months and hence must maintain huge inventories. Maintenance of inventories involves interest costs and in addition involves expensive insurance premiums against fire.
The production of kraft paper promises to continue to dominate the paper industry in the District. Some years ago
the possibility of manufacturing newsprint from Southern pine pulp received enthusiastic publicity. It seems unlikely, however, that the industry in the South will take this direction. In the first place, newsprint is a low-value product relative to the other possible end products from Southern pine. Secondly, the plants in the South are chemical-process plants —chiefly sulphate— and newsprint contains about 80 per cent ground wood since the pulp is made by the physical disintegration of pine logs rather than by chemical disintegration. As a result, the capital loss involved in converting Southern kraft mills to newsprint production constitutes a prohibitive expense. Furthermore, the tremendous advances in recent years in the bleaching of kraft paper have reached a point where paper of a whiteness comparable to that manufactured in Northern mills from spruce and other timber can be produced from pine. Paper products from white paper are far more profitable to manufacture than is newsprint.
Continued sound operation of any industry dependent upon the forest is, in its turn, absolutely dependent upon sound forestry practices in the area. That is to say, the forest must be treated as a crop that is planted and harvested rather than as a mineral that is mined once and for all. The larger pulp and paper mills in the South own outright vast acreages of pine forest, and they are, in varying degrees, applying the best forest management practices on these acreages to assure a continuing supply of raw material.
One of the large costs in the manufacture of paper is freight, and the farther back from the mill the forest is cut down, the farther the pulpwood has to be hauled and the higher is the freight charge against the paper. As a result, mills in cut-over areas cannot compete in price with mills in sections where wood is abundant. The large pulp and paper producers, the more progressive of them, attempt not only to manage their own holdings properly but also to encourage the private timber owners, from whom they purchase pulpwood through contractors, to adopt modern management practices.
A major problem for all Southern industries drawing their raw materials from the forests is the continuing enormous loss by fire of vast stands of timber. It is estimated that 90 per cent of all forest areas burned in recent years have been concentrated in 11 Southern states. It is probable that more wood is burned in Southern forests each year than is consumed in pulp mills.
The treating of trees as a recurrent crop involves not only fire protection and reforestation but also the use of the forest in the most advantageous manner. The butt cuts of pine trees worked for turpentine, for example, are not in ordinary times acceptable to the pulp mills because they have been so burned that they are less desirable for the pulping process.
Some attention has been given to the possibility of manufacturing pulp from bamboo. The United States Plant Introduction Station is currently experimenting on new uses for bamboo at the Bamboo Gardens near Savannah. Although industrial uses undoubtedly will be developed for bamboo types that can be grown in the South, there seems little reason to expect any wide use of bamboo for paper pulp. Proper forest management practice requires the thinning of stands of pine, and the major market for such trees is the pulp mill. Furthermore, bamboo is so light that the transportation cost involved in moving a sufficient tonnage to pulp mills would be prohibitive.
Digitized for FRASER http://fraser.stlouisfed.org/ Federal Reserve Bank of St. Louis
7 6 M o n t h l y R e v i e w o f t h e F e d e r a l R e s e r v e B a n k o f A t l a n t a f o r S e p t e m b e r 1 9 4 4
► The Southern Forest Survey in the mid-1930’s indicated that there was a considerable margin of growth above drain so far as cordwood was concerned. Thus, some millions of cords each year are available for pulping without reducing the total forest area or volume. Furthermore, the annual production of 500,000 barrels of turpentine, the average prewar production, means that enough trees are discarded from the naval-stores operation annually to provide 1,800,000 cords for pulping. The average diameter of the abandoned turpentine tree is approximately 12 inches, and, because of damage to the wood through the turpentining operation under old methods that still dominate the industry, only about 15 per cent of the volume of timber abandoned by naval-stores producers is of saw-timber quality and size.
Foresters believe the existence of a good pulpwood market may often mean the difference between the success and failure of a sustained forest operation, since the money realized on the sales of pulpwood from thinnings and intermediate cuttings while the stand is growing to final saw-timber size may suffice to carry the cost of the stand during the period of waiting. It is true that an overexpansion of the industry in the area would mean excessive cutting of trees for pulp, and this degree of development is to be avoided.► What does the postwar future hold for the pulp and paper industry? The U. S. Department of Commerce has made forecasts of estimated domestic production and imports of wood pulp at various levels of gross national product. The department took 1946 as the assumed first postwar normal year and calculated production of wood pulp for various levels of gross national product ranging from 145 to 165 billion dollars. The statistical projection indicates that, with a gross national product of 145 billion dollars, domestic production of pulpwood would be 10.89 million short tons, imports would total 3.35 million short tons, and domestic consumption would be 14.24 million short tons. On the optimistic assumption of 165 billion dollars gross national product in 1946, all these factors would increase. Domestic production of wood pulp would then be 12.00 million short tons with imports of 3.68 million short tons and approximate domestic consumption of 15.68.
These calculations of domestic consumption exclude exports of pulp and give no consideration to inventory changes, but these items are relatively insignificant. Exports of wood pulp from domestic production averaged only about 3 per cent of consumption from 1935 to 1941. The gross national product was 119 billion dollars in 1941. In that year, domestic production of wood pulp was 10.20 million short tons with imports estimated at 1.00 million short tons; the apparent domestic consumption was, therefore, about 11.20 million short tons.
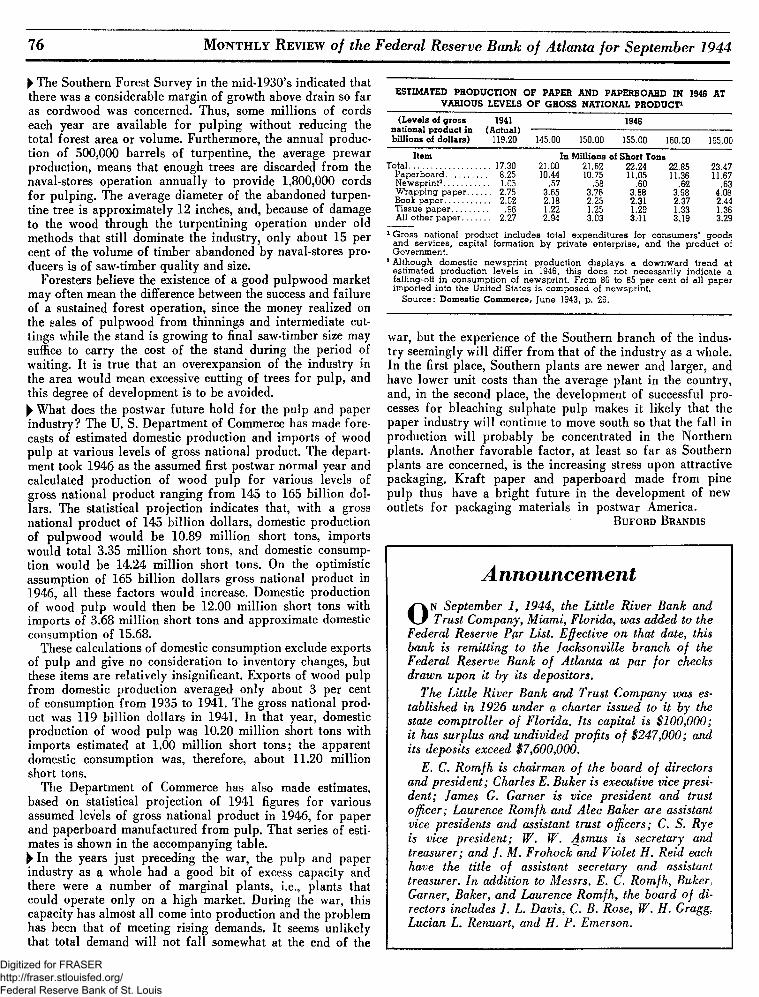
The Department of Commerce has also made estimates, based on statistical projection of 1941 figures for various assumed levels of gross national product in 1946, for paper and paperboard manufactured from pulp. That series of estimates is shown in the accompanying table. ̂In the years just preceding the war, the pulp and paper
industry as a whole had a good bit of excess capacity and there were a number of marginal plants, i.e., plants that could operate only on a high market. During the war, this capacity has almost all come into production and the problem has been that of meeting rising demands. It seems unlikely that total demand will not fall somewhat at the end of the
ESTIM ATED PRO D UCTIO N O F PAPER AND PAPERBOARD IN 1946 AT V A R IO U S L E V E L S O F G R O SS NATIONAL PRO D UCT1
(Levels oi gross 1941 1946national product in (Actual) ------ —----------------------------------------------- ------billions oi dollars) 119.20 145.00 150.00 155.00 160.00 165.00
Item In Millions oi Short TonsTotal..................................... 17.30 21.00 21.62 22.24 22.85 23.47
Paperboard................... 8.25 10.44 10.75 11.05 11.36 11.67Newsprint2..................... 1.05 .57 .58 .60 .62 .63Wrapping paper.......... 2.75 3.65 3.76 3.88 3.98 4.08Book paper..................... 2.02 2.18 2.25 2.31 2.37 2.44Tissue paper......................... 96 1.22 1.25 1.29 1.33 1.36A ll other paper............. 2.27 2.94 3.03 3.'1'1 3.19 3.29
1 Gross national product includes total expenditures for consumers' goods and services, capital formation by private enterprise, and the product of Government.
1 Although domestic newsprint production disp lays a downward trend at estimated production levels in 1946, this does not necessarily indicate a falling-off in consumption of newsprint. From 80 to 85 per cent of all paper imported into the United States is composed of newsprint.
Source: Domestic Commerce. June 1943, p. 26.
war, but the experience of the Southern branch of the industry seemingly will differ from that of the industry as a whole. In the first place, Southern plants are newer and larger, and have lower unit costs than the average plant in the country, and, in the second place, the development of successful processes for bleaching sulphate pulp makes it likely that the paper industry will continue to move south so that the fall in production will probably be concentrated in the Northern plants. Another favorable factor, at least so far as Southern plants are concerned, is the increasing stress upon attractive packaging. Kraft paper and paperboard made from pine pulp thus have a bright future in the development of new outlets for packaging materials in postwar America.
B u f o r d B r a n d i s
A n n o u n c e m e n t
O N September 1, 1944, the Little River Bank and Trust Company, Miami, Florida, was added to the
Federal Reserve Pftr List. Effective on that date, this bank is remitting to the Jacksonville branch of the Federal Reserve Bank of Atlanta at par for checks drawn upon it by its depositors.
The Little River Bank and Trust Company was established in 1926 under a charter issued to it by the state comptroller of Florida. Its capital is $100,000; it has surplus and undivided profits of $247,000; and its deposits exceed $7,600,000.
E. C. Romfh is chairman of the board of directors and president; Charles E. Buker is executive vice president; James G. Garner is vice president and trust officer; Laurence Romfh and Alec Baker are assistant vice presidents and assistant trust officers; C. S. Rye is vice president; W. W. Asmus is secretary and treasurer; and J. M. Frohock and Violet H. Reid each have the title of assistant secretary and assistant treasurer. In addition to Messrs. E. C. Romfh, Buker, Garner, Baker, and Laurence Romfh, the board of directors includes J. L. Davis, C. B. Rose, W. II. Gragg, Lucian L. Renuart, and H. P. Emerson.
Digitized for FRASER http://fraser.stlouisfed.org/ Federal Reserve Bank of St. Louis

M o n t h l y R e v i e w o f t h e F e d e r a l R e s e r v e B a n k o f A t l a n t a f o r S e p t e m b e r 1 9 4 4 7 7
The Southern Research InstituteA fte r four years of preliminary planning and promotion on
the part of a group of Alabama businessmen, the Southern Research Institute is now a reality. More than $400,000 of the capital required for the institute has been raised by private subscription. This amount has been subscribed primarily in Alabama, where the movement to found the institute began. With the extension of the capital-raising campaign to other states, the supporters of the institute believe that perhaps $1,500,000 can be raised. Meanwhile, the amount now available has been regarded as sufficient for the commencement of actual work. A large brick dwelling on a two-acre site near downtown Birmingham has been purchased and is at present being fitted with modern laboratory and office equipment for a staff of 20 to 25 research workers. The newly appointed director, Wilbur Arthur Lazier, a well-known research chemist, is now in Birmingham and will assume his duties on October 1. Actual research work on the first of several industrial projects submitted to the institute by manufacturing companies of the South is scheduled to be under way by the end of 1944.
In its present beginning stage, the institute is a significant example of regional venturing in behalf of the technological advancement of Southern industry. If the institute develops as its founders confidently anticipate, an important contribution will have been made to the industrial research facilities of the region and to the development of high-value products manufactured from Southern materials.
In its method of operation, the Southern Research Institute is closely modeled upon the Mellon Institute of Industrial Research. An obvious distinction between the two is found in the sources of their capital funds. The Mellon Institute’s source was a large private endowment; the Southern Research Institute is receiving such funds through private subscriptions that so far number more than 200 and range in amount from a maximum of $25,000 to a minimum of $25 a year.
The capital fund of the institute will not be used to pay the direct cost of research projects of any private enterprise, but to provide the laboratory equipment and other essential facilities of a modern research center. Most research projects and scientific investigations conducted in this center will be paid for by the business enterprises that suggest the projects and agree to sponsor them within the institute. The institute, from one aspect, may be termed a commercial laboratory and scientific investigative service organization, accepting private business companies as its paying clients. But it is a nonprofit corporation, and its charge for a given task of research will be the actual cost of that particular work plus a stipulated amount for overhead expenses. With a sufficient number of research investigations in progress, the institute accordingly may be expected to become self-supporting.► The first step in the working process is taken when a company or individual in the business field, to be generally in some branch of manufacturing or agriculture, comes to the institute with a technical problem, or an idea for a potential discovery, requiring chemical or other scientific research. As the second step, the institute makes a study of the proposal to determine to its own satisfaction that no previous patent covers the situation and that the project is worth while.
If the institute becomes satisfied upon these points and accepts the assignment, the third step is then taken. This step consists in the making of an agreement between the institute and the applicant business concern. The agreement ordinarily will cover a period of one year, but renewal may be permitted. Under the terms of the agreement, the institute takes full charge of the desired investigation and assumes responsibility for it. The institute agrees to create a research fellowship, devoted to the particular project, within its organization, and to find and employ a competent scientific specialist to undertake the given investigative task. The institute also agrees to direct and aid the research and to place its scientific resources at the specialist’s disposal.
The business client, in turn, agrees to sponsor the particular fellowship that is established for the investigation that he has proposed. Sponsorship will include the payment to the institute of the actual costs of the work—primarily, the salary of the research fellow for the contract period— plus the contribution to overhead. Sponsorship will also include such co-operation as the business itself would ordinarily give a research worker of its own.► The relationship between the institute and the sponsor of a research project is entirely confidential. Without the consent of the sponsor, no publication of scientific findings may be made within a stipulated period. If a patentable new product or process results from a sponsored investigation, all ownership of patents and patent rights is to be vested in the sponsor.
Some investigations may, of course, require only short-time work. In such cases, the costs are estimated in advance and no special fellowship may be required. In addition, the institute itself will, as funds permit, originate and undertake certain investigations in its own behalf. These may include new or improved uses for Southern raw materials. In such cases, the institute itself would hold the patents and, upon proper occasion, lease them for purposes of production.
The plan thus outlined is in large part the one that the Mellon Institute has found to be the most workable in its 30 years’ experience. Initially, the industrial fellowship system was conceived by Robert Kennedy Duncan, eminent scientist, in 1906 while he was in attendance at the Sixth International Congress of Applied Chemistry in Rome. Dr. Duncan in 1913 became the first director of the Mellon Institute and there put into practice the system that is now to be adapted to the industrial needs of the South.
Specific action leading to the establishment of the institute was first taken three years ago. For some time prior to that, the idea had been repeatedly urged upon business men by Dr. Stewart J. Lloyd of the School of Chemistry, University of Alabama. A few businessmen of Alabama had become convinced that the advancement of industry along lines of scientific exploration was not only a primary need of the South but was also the best means of furthering industrial expansion and improving the income of the region. Accordingly, the subject of scientific research was again presented at the annual meeting of Alabama State Chamber of Commerce in October 1940, by Dr. George D. Palmer, Dean of Chemistry, University of Alabama. Dr. Palmer’s report proved of so much interest that a committee was appointed, at the sug
Digitized for FRASER http://fraser.stlouisfed.org/ Federal Reserve Bank of St. Louis

7 8 M o n t h l y R e v i e w o f t h e F e d e r a l R e s e r v e B a n k o f A t l a n t a f o r S e p t e m b e r 1 9 4 4
gestion of Thomas W. Martin of Birmingham, to study the question.
Almost a year was spent by the committee,' and its report was presented by Mr. Martin at the 1941 meeting of the State Chamber of Commerce, and adopted. The result was the decision to form the Alabama Research Institute, which was incorporated on October 11, 1941.
As the work of organization and fund-raising proceeded, the concept of the institute expanded to that of an all- Southern organization, capable of operating across state boundaries and aiding industry throughout the South and, in fact, throughout the nation. By amendment of the corporation’s constitution and by-laws on June 15, 1944, the name Southern Research Institute was adopted. Business leaders of the Tennessee area gathered in Nashville on September 6 to consider the plans for the institute, and a similar meeting is scheduled for Atlanta, under the auspices of the industrial division of the Agricultural and Industrial Development Board of Georgia, on October 5.
The officers of the Southern Research Institute are at present those of the originally projected Alabama organization. They are: chairman, Thomas W. Martin, president of the Alabama Power Company; vice chairman, Wallace L. Caldwell, president of the Alabama Asphaltic Limestone Company, Birmingham; treasurer, Milton H. Fies, consulting engineer, Birmingham; secretary, John A. Maguire, Birmingham. The 27 trustees include members of the original founding group and several from other Southeastern states.
Dr. Lazier, whose appointment as director of the institute was announced on August 27, 1944, was offered this post after a considerable inquiry in scientific circles had resulted in repeated recommendations of his scientific and personal qualifications. Dr. Lazier, at 44 years of age, ranks as one of America’s distinguished younger scientists in the field of chemistry. He graduated from the University of Illinois in 1922, took his doctorate in chemistry at the University of Wisconsin three years later, and since then has been occupied in research and development work at the du Pont Experimental Station in Wilmington, Delaware. He is one of the nation’s foremost authorities on problems of catalytic hydrogenation and played a leading part in the development of processes for producing intermediates used in the manufacture of nylon. For these and other scientific achievements, he was granted a Modern Pioneer Award of the National Association of Manufacturers in 1940. Since 1942 he has served as consultant to the National Defense Research Committee and has devoted much time to special chemical assignments for the armed services. ,► Implications for Southern industry in the establishment of the institute are of considerable long-range importance. By attracting research workers to the South, the institute is expected to ameliorate a condition of old standing, namely, a marked deficiency in the number of resident research workers, and to avoid the resulting effects upon the development of regional resources. According to the National Research Council, immediately prior to the war only 983 research workers resided in nine Southeastern states. Of this number, Alabama had 188; Arkansas, 8; Florida, 50; Georgia, 71; Louisiana, 356; Mississippi, 53; North Carolina, 49; South Carolina, 95; and Tennessee, 113. By comparison, New York alone had 9,514 research workers, and New Jersey, 6,057. Ohio, Pennsylvania, and Illinois had approximately 4,700
each, and Connecticut, ranking eleventh in the number of such workers, had 965, or almost as many as the nine Southeastern states combined.
The number of patents granted in a recent 10-year period by the United States Patent Office shows a general correlation with the number of research workers, by states. Thus New York in the years 1934-43, inclusive, received 79,072 patents; Illinois, 4l,853; Pennsylvania and New Jersey, about30,000 each; and Connecticut, 12,069. In contrast, the nine Southeastern states in the same period received 10,825 patents, distributed as follows: Alabama, 1,013; Arkansas, 469; Florida, 2,185; Georgia, 1,465; Louisiana, 1,288; Mississippi, 383; North Carolina, 1,458; South Carolina, 560; and Tennessee, 2,004. This total of 10,825 patents was only 2.9 per cent of the national total of patents issued during the decade 1934-43, and the proportion of the nation’s research workers living in the £>outh was but 2.2 per cent.
Partly accounting for the relative lack of discoveries leading to patents owned by Southern enterprises is the familiar fact that the Southern area,, in general, has an unusually high percentage of manufacturing plants that are affiliates or branches of national concerns. These plants utilize the patents of their parent companies. But there are also many independent manufacturing enterprises, generally small or medium in size, and it is in connection with such enterprises that the work of the institute may have an especial significance. An important differential between the smaller and the larger enterprises lies in their access to scientific work and the findings of technical research. Leaders of the institute believe the new facilities will tend to equalize this differential for the South. “One of the advantages of associative research,” states a pamphlet of the new institute, “is that it enables a small manufacturer, who cannot afford to have a laboratory of his own, to profit from scientific research in the same manner as a larger manufacturer.” Since the cost for most projects of practical importance is not prohibitive, it is believed that many of the institute’s clients will be the smaller and unaffiliated concerns.► The productive economy of the Southeast has, up to the present war at least, suffered from a neglect, in the section, of the higher and more elaborate types of processing, and the abundant raw materials of the region, whether mineral or agricultural, have not been fully utilized in the scientific sense. That much of the region’s manufacturing output was more or less rudimentary in type was reflected in the Census of Manufactures for 1939, which showed that the nine Southeastern states previously mentioned, though having 14.1 per cent of the nation’s workers in manufacturing, produced but 8.7 per cent of the total value of manufactured products. The average manufacturing worker of the nation added $3,130 to the value of the raw materials processed in 1939, but the average worker of the nine Southern states added only $1,825 in product value.
Apparently, Chairman Martin had these facts in mind when he said, in a recent public address: “We, in the Southern region, must recognize that in research in the natural sciences we have in the past been highly deficient; that it is technological research, generally absent in the South, that creates new finished goods industries; and that the increase of technological research is perhaps the most important long-range project in the South. . . . It is a happy omen that the South is awakening to its opportunity.”
Digitized for FRASER http://fraser.stlouisfed.org/ Federal Reserve Bank of St. Louis

M o n t h l y R e v i e w o f t h e F e d e r a l R e s e r v e B a n k o f A t l a n t a f o r S e p t e m b e r 1 9 4 4 7 9
T e r m i n a t i o n L o a n s
O NE of the major problems of the reconversion period now rapidly approaching will be the financing of war con
tractors during the time elapsing between the termination of their contracts and the receipt of settlement payments from the Government. With this problem in mind, Congress passed the Contract Settlement Act, which was approved on July 1,1944. To carry out the provisions of the act, Robert H. Hinckley has been appointed Director of Contract Settlement by the President.
A responsibility of the Director of Contract Settlement is to see that all war contractors having any termination claims are provided pending the settlement of those claims, “with adequate interim financing, within 30 days after proper application therefor.” The interim financing is to be provided in one of two ways: either by loans or by partial payments iny advance of final settlement.► The Federal Reserve System, with the approval of the Director of Contract Settlement, has instituted a plan to expedite and aid the private banks in making such termination loans pending final settlement of war contractors’ claims against the Government. This plan is the T-loan program, a further development of the earlier V and V T programs.
The termination-loan framework has now been established by agreement between the Director of Contract Settlement, the Board of Governors of the Federal Reserve System, the armed services, and the Maritime Commission. Regulations of the Board, issued with the approval of the Director of Contract Settlement, authorize the Federal Reserve Banks to act, on behalf of the War and Navy Departments and the Maritime Commission, as fiscal agents of the United States guaranteeing loans as authorized by the Contract Settlement Act.
The original V-loan program began on March 26, 1942, with the issuance by the President of Executive Order No. 9112 authorizing Government guaranty of bank loans against war contracts. The Federal Reserve Banks were authorized by that order to guarantee, as fiscal agents for the War and Navy Departments and the Maritime Commission, production loans for war contractors. The Regulation V program, which had been set up to give effect to this executive order, was amended, effective September 1, 1943, to provide financing for both production and termination claims. Financing of termination claims, however, could be undertaken under the VT-loan program only while production was in progress and before cancellation occurred. T loans, on the other hand, may be guaranteed after the borrower’s war-production contract has been terminated, though commitments for such loans may be guaranteed in advance of cancellation.
A revision of Regulation V of the Board of Governors of the Federal Reserve System pertaining to the financing of war production and war-contract termination became effective September 11, 1944. This revision gives effect to the new termination-loan program. On the same date, the Board of Governors amended Regulation A, which required, among other things, that a note be negotiable in order to be eligible for discount by a Federal Reserve Bank. The new amendment exempts from this requirement notes resulting from loans that are the subject of a guarantee or commitment made pursuant to the Contract Settlement Act of 1944. Loans guaranteed pursuant to Executive Order 9112 were exempted
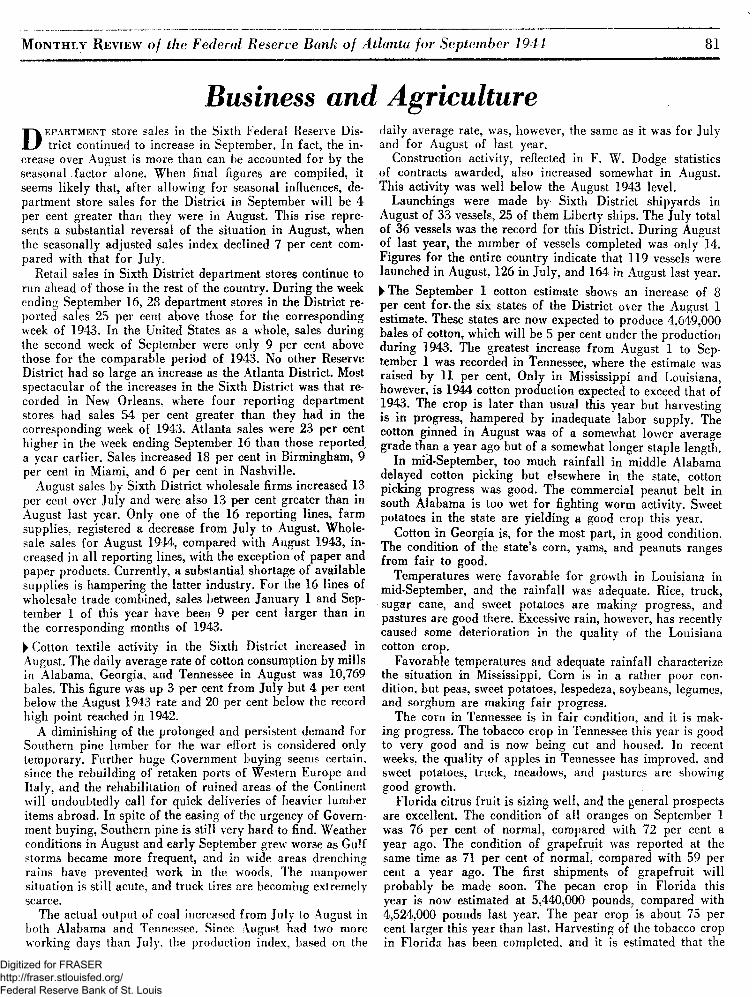
R e c o n n a i s s a n c eSixth District Statistics for August 1944 compared with August 1943
PER CEN T D E C R E A S E 'V ' PER CEN T IN C R EA SE
D e p a r t m § j § | S t o r e S a l e s .
S t o r e S t o c k s
F u n » e S a l e s
C * B B a C o n t r a c t s
C o t t o n C c | | | | { | u n p t io n
G a s o l i n e T a j | | | | p o l l e c t i o n s
M e m b e & : !$ a n k L o a n s
M e m b e r B a n | $ I n v e s t m e n t s
—________________________________________________ +40 30 20 10 0 10 20 30 40
from the negotiability requirement by an amendment dated September 21, 1942.
The maximum commitment fee that may be charged the borrower by a financing institution under the T-loan program will be one-fourth of 1 per cent per annum or, as an alternative, a flat fee not to exceed $50. Under the new program, this fee is not shared by the guarantor. The maximum rate of interest on any T loan is 4 ^ per cent per annum, compared with the maximum rate of 5 per cent on V and VT loans. This new maximum rate is hereafter also made applicable to new V loans, which may provide for both production and termination financing.► The steps involved in securing a T loan or commitment may be briefly summarized. In the first place, the war contractor anticipating a termination or having already received notice of termination of his contract requests his bank to provide him with the necessary financing during the period prior to his receipt of payment from the Government. The bank may, of course, be willing to make the loan without any guaranty. Indeed, the Director of Contract Settlement encourages financing institutions to make unguaranteed loans for war production and for termination financing. In the Director’s General Regulation No. 1 of August 18, 1944, the statement is made that a financing institution which makes such a loan on an unguaranteed basis does not thereby affect its right to apply subsequently for a T-loan guarantee even though the proceeds of the T loan are used to retire the earlier loan to the war contractor. But if the bank desires a guarantee on the war contractor’s loan, it will furnish the contractor with copies of the standard form of loan agreement and exhibits, to accompany the bank’s application.
In such a case, the bank will assist the contractor in the completion of the forms, in quadruplicates. To each copy of the application form, the bank will attach a copy of the proposed guarantee agreement and of the loan agreement, as well as exhibits showing the form of note and a certificate recording the percentage of receivables, inventory, and subcontract settlements applicable to cancelled war contracts that may be advanced to the contractor. Additional attachments to each copy of the application form will be a list of the war-produc-
Digitized for FRASER http://fraser.stlouisfed.org/ Federal Reserve Bank of St. Louis

8 0 M o n t h l y R e v i e w o f t h e F e d e r a l R e s e r v e B a n k o f A t l a n t a f o r S e p t e m b e r 1 9 4 4
S ix t h D i s t r i c t I n d e x e s
DEPARTMENT STO R E SA LES*
Adjusted** Unadjusted
August July August August July August1944 1944 1943 1944 1944 1943
D IS T R IC T .............. 245 263 202 218 197 179Atlanta................ 266 283 210 257 201 203Baton R o u g e ... 261 267 195 227 207 170Birmingham. .. . 256 261 213 234 204 194Chattanooga. . . 279 280 214 231 197 176Jackson............... 280 259 223 224 181 179Jackso nville .. . . 337 329 278 282 263 232Knoxville............ 303 347 216 273 248 195M acon................. 321 267 246 226 190 174M iami................... 206 263 178 139 147 120M ontgom ery.... 274 265 216 213 189 168N ashville ............ 282 288 234 239 203 198New O rlean s. . . 211 225 176 194 171 162Tam pa................ 339 330 274 266 241 215
DEPARTM ENT ST O RE ST O CK S
Adjusted** Unadjusted
August July August August July August1944 1944 1943 1944 1944 1943
D IST R IC T ............... 194 225 199 187 201 191Atlanta................ 288 260 249 281 251 243Birmingham. . . . 156 172 154 157 155 • 155M ontgom ery... 234 290 217 232 232 215N ashville .......... 321 358 291 320 310 291New O rlean s. . . 167 161 142 157 148 133
CO TTO N CONSUM PTION* C O A L PRODUCTION*
August1944
July1944
August1943
August1944
July1944
August1943
T O T A L..................... 152 147 158 163 163 163Alabam a............ 160 153 165 171 171 174G eo rg ia .............. 151 148 157Tennessee........ 134 121 138 139 i-46 139
M AN UFACTURIN G EM PLOYM ENT***
July June July1944 1944 1943
SIX S T A T ES........ , ................................... 157 157r 157Alabam a.................................................. 184 186 197Florida ...................................................... 178 169r 174G eo rg ia .................................................... 144 145r 143Louisiana................................................ 170 170r 151M ississippi.............................................. 139 140r 144Tennessee.............................................. 136 136r 140
CO N STRUCTIO NCO N TRA CTS
G A SO LIN E TAX C O LLEC T IO N S ***
Aug.1944
July1944
Aug.1943
Aug.1944
July1944
Aug.1943
D IS T R IC T .............. 106 87r 1,196 98 99 103Residential........ 79 53r 151O thers................ 120 104r 1,702Alabam a............ 69 58 135 i02 i03 107Florid a .............. 72 122 163 87 87 86G eo rg ia............ 78 71 213 99 93 93Louisiana .......... 263 100 89 102 102 102M ississippi........ 1,14 4.1 59 95 95 87Tennessee........ 126 82 5,034 108 118 142
C O ST O F LIV IN G E LE C T R IC PO W ER PRODUCTION*
July1944
June1944
July1943
July1944
June1944
July1943
A LL IT E M S ..Food..........C lothing. . .Rent.............Fuel, e lec
130144137114
130142137114
128147130U4
SIX STATES. Hydrogenerated
Fu elgenerated.
260
209
327
264
230
308
237
214
268tricity, and ic e ..
Home furnishings.
M iscellaneous. .
110 110 ,107 ANNUAL RA TE O F TURN OVER O F DEMAND DEPO SITS
138
126
138
125
123
118
Aug.1944
July1944
Aug.1943
Unadjusted. . A djusted**. . . Index**..........
15.017.1 66.0
17.818.9 73.0
15.317.4 67.2
C RU D E PETRO LEU M PRODUCTION IN CO A STA L LO U ISIA N A AND
jY iia a ia a irr i-
Aug.1944
July1944
Aug.1943
u a u y average oasis * ‘ Adjusted for seasonal variation
***1939 monthly average = 100; otherU nadjusted .. Adjusted**. .
200200
197197
191191
indexes, 1935-39 r = Revised
= 100
tion contracts held by the borrower and one copy each of the balance sheet and operating statement for the latest fiscal period, certified by the borrower, and of the latest available balance sheet and operating statement for the time intervening since the close of that period. Of course, the bank and the contractor will agree between themselves regarding the percentages of receivables, inventory, and subcontract settlements to form the borrowing base, as well as any other special provisions to be added to the required standard loan agreement.
Three copies of the application form, together with their attachments, will be mailed to the Federal Reserve Bank by the financing institution. The Bank will then review the enclosures and the application forms. If they meet the requirements of the Director of Contract Settlement and of the guaranteeing agency, the guarantee will be officially executed by the Reserve Bank as fiscal agent for the United States and forwarded to the financing institution. The funds will then be made available by the institution to the war contractor if he meets the requirements with respect to the assignment of claims arising under the terminated contract.► It is anticipated, of course, that as payments on the termination claims are made to the bank from time to time by the contracting agencies in accordance with the assignment of claims, such payments will retire the loan in full. Provisions are contained in the Contract Settlement Act of 1944 to the effect that any overstatement by a war contractor of the amount due on his termination claim or claims in connection with any interim financing under the act shall constitute a debt due to the United States and that he shall pay to the United States, as a penalty, an amount equal to 6 per cent of the amount of the overstatement.
To be able to obtain promptly such interim financing and to support adequately the termination claim that must be filed, contractors should see that all accounting, cost records, and adequate inventory control are maintained in current form. A prime contractor should ascertain from its contracting agency the nature of the data that will be required in support of a termination claim, and a sub-contractor should request the same information of its prime contractor. All termination claims should be filed promptly.
If it does not exceed 90 per cent, a guarantee will not ordinarily be questioned by the Federal Reserve Bank or the contracting agency. A contracting agency will not usually authorize a percentage of guarantee in excess of 90, or 95 in the case of loans not exceeding $100,000, to any one borrower, unless the circumstances clearly justify so large a guarantee and unless no other means of interim financing are promptly available.► Since many war contracts will be cancelled with the cessation of hostilities in Europe, all banks are urged to acquaint their war-contractor customers with the procedure necessary to obtain financing of their termination claims. Too much emphasis cannot be placed on the importance of contractors’ obtaining commitments covering these guaranteed loans prior to actual termination of their war contracts. Only in this way can funds be made available promptly after the notice of termination is received.
It is suggested that all banks and war contractors obtain copies of the Contract Settlement Act of 1944 (Public Law 395— 78th Congress). Copies are obtainable from the Superintendent of Documents, Government Printing Office, Washington, D. C., at 10 cents each.
Digitized for FRASER http://fraser.stlouisfed.org/ Federal Reserve Bank of St. Louis
M o n t h l y R e v i e w o f t h e F e d e r a l R e s e r v e B a n k o f A t l a n t a f o r S e p t e m b e r 1 9 4 4 8 1
Business and AgricultureD epartment store sales in the Sixth Federal Reserve Dis
trict continued to increase in September. In fact, the increase over August is more than can be accounted for by the seasonal factor alone. When final figures are compiled, it seems likely that, after allowing for seasonal influences, department store sales for the District in September will be 4 per cent greater than they were in August. This rise represents a substantial reversal of the situation in August, when the seasonally adjusted sales index declined 7 per cent compared with that for July.
Retail sales in Sixth District department stores continue to run ahead of those in the rest of the country. During the week ending September 16, 28 department stores in the District reported sales 25 per cent above those for the corresponding week of 1943. In the United States as a whole, sales during the second week of September were only 9 per cent above those for the comparable period of 1943. No other Reserve District had so large an increase as the Atlanta District. Most spectacular of the increases in the Sixth District was that recorded in New Orleans, where four reporting department stores had sales 54 per cent greater than they had in the corresponding week of 1943. Atlanta sales were 23 per cent higher in the week ending September 16 than those reported a year earlier. Sales increased 18 per cent in Birmingham, 9 per cent in Miami, and 6 per cent in Nashville.
August sales by Sixth District wholesale firms increased 13 per cent over July and were also 13 per cent greater than in August last year. Only one of the 16 reporting lines, farm supplies, registered a decrease from July to August. Wholesale sales for August 1944, compared with August 1943, increased in all reporting lines, with the exception of paper and paper products. Currently, a substantial shortage of available supplies is hampering the latter industry. For the 16 lines of wholesale trade combined, sales between January 1 and September 1 of this year have been 9 per cent larger than in the corresponding months of 1943.► Cotton textile activity in the Sixth District increased in August. The daily average rate of cotton consumption by mills in Alabama, Georgia, and Tennessee in August was 10,769 bales. This figure was up 3 per cent from July but 4 per cent below the August 1943 rate and 20 per cent below the record high point reached in 1942.
A diminishing of the prolonged and persistent demand for Southern pine lumber for the war effort is considered only temporary. Further huge Government buying seems certain, since the rebuilding of retaken ports of Western Europe and Italy, and the rehabilitation of ruined areas of the Continent will undoubtedly call for quick deliveries of heavier lumber items abroad. In spite of the easing of the urgency of Government buying, Southern pine is still very hard to find. Weather conditions in August and early September grew worse as Gulf storms became more frequent, and in wide areas drenching rains have prevented work in the woods. The manpower situation is still acute, and truck tires are becoming extremely scarce.
The actual output of coal increased from July to August in both Alabama and Tennessee. Since August had two more working days than July, the production index, based on the
daily average rate, was, however, the same as it was for July and for August of last year.
Construction activity, reflected in F. W. Dodge statistics of contracts awarded, also increased somewhat in August. This activity was well below the August 1943 level.
Launchings were made by Sixth District shipyards in August of 33 vessels, 25 of them Liberty ships. The July total of 36 vessels was the record for this District. During August of last year, the number of vessels completed was only 14. Figures for the entire country indicate that 119 vessels were launched in August, 126 in July, and 164 in August last year.► The September 1 cotton estimate shows an increase of 8 per cent for* the six states of the District over the August 1 estimate. These states are now expected to produce 4,649,000 bales of cotton, which will be 5 per cent under the production during 1943. The greatest increase from August 1 to September 1 was recorded in Tennessee, where the estimate was raised by 11 per cent. Only in Mississippi and Louisiana, however, is 1944 cotton production expected to exceed that of 1943. The crop is later than usual this year but harvesting is in progress, hampered by inadequate labor supply. The cotton ginned in August was of a somewhat lower average grade than a year ago but of a somewhat longer staple length.
In mid-September, too much rainfall in middle Alabama delayed cotton picking but elsewhere in the state, cotton picking progress was good. The commercial peanut belt in south Alabama is too wet for fighting worm activity. Sweet potatoes in the state are yielding a good crop this year.
Cotton in Georgia is, for the most part, in good condition. The condition of the state’s corn, yams, and peanuts ranges from fair to good.
Temperatures were favorable for growth in Louisiana in mid-September, and the rainfall was adequate. Rice, truck, sugar cane, and sweet potatoes are making progress, and pastures are good there. Excessive rain, however, has recently caused some deterioration in the quality of the Louisiana cotton crop.
Favorable temperatures and adequate rainfall characterize the situation in Mississippi. Corn is in a rather poor condition, but peas, sweet potatoes, lespedeza, soybeans, legumes, and sorghum are making fair progress.
The corn in Tennessee is in fair condition, and it is making progress. The tobacco crop in Tennessee this year is good to very good and is now being cut and housed. In recent weeks, the quality of apples in Tennessee has improved, and sweet potatoes, truck, meadows, and pastures are showing good growth.
Florida citrus fruit is sizing well, and the general prospects are excellent. The condition of all oranges on September 1 was 76 per cent of normal, compared with 72 per cent a year ago. The condition of grapefruit was reported at the same time as 71 per cent of normal, compared with 59 per cent a year ago. The first shipments of grapefruit will probably be made soon. The pecan crop in Florida this year is now estimated at 5,440,000 pounds, compared with4,524,000 pounds last year. The pear crop is about 75 per cent larger this year than last. Harvesting of the tobacco crop in Florida has been completed, and it is estimated that the
Digitized for FRASER http://fraser.stlouisfed.org/ Federal Reserve Bank of St. Louis

8 2 M o n t h l y R e v i e w o f t h e F e d e r a l R e s e r v e B a n k o f A t l a n t a f o r S e p t e m b e r 1 9 4 4
B a n k S t a t i s t i c s
NUMBER AND DEPO SITS O F PAR AND NONPAR BANKING O F F IC E S , BY STA TES, JUNE 30, 1944
(Includes branches and additional ofiices, except offices at military reservations, classified according to Federal Reserve Par List status.
Preliminary figures, subject to minor change.) (Deposits as oi December 1943, in Thousands oi Dollars)
Total, All Commercial
Banking Offices1
Banking Ofiices on Federal Reserve Par List
Banking Ofiices Not on Federal Reserve Par List
State O i Member Banks2
O i Nonmember Banks
No. Deposits No. Deposits No. Deposits No. Deposits
A la .......... 237 841,422 103 706,896 7 13,666 127 120,860Ariz........ 38 229,188 28 198,130 10 31,058A rk.......... 241 483,671 67 348,905 33 32,936 141 101,830C a lif .. . . 1,016 8,857,658 893 8,100,708 123 756,950C o lo .. . . 140 720,327 92 662,258 48 58,069
C o n n .. . . Del..........
1325251
1,290,318372,770705,729
691847
873,090278,728685,422
63344
417,22894,04220,307D. C . . . .
F la .......... 164 1,057,874 60 842,772 18 69,098 86 146,004G a .......... 369 1,191,869 83 913,273 18 48,820 268 229,776
Idaho. . . 86 257,898 63 225,031 23 32,867Ill............Ind..........
827564808
8,520,8871,974,9561,428,031
466246162
7,953,0231,446,149
774,486
359318646
566,083528,807653,545
2 1,781
Io w a .. . .Kan........ 622 1,028,152 213 695,494 407 331,808 2 850
K y .......... 420 1,022,057 134 697,077 279 322,773 7 2,207La .......... 202 1,062,773 69 833,888 7 26,350 126 202,535M aine.. M d . . . . . .
126255312
346,1111,322,9273,581,779
73131264
251,717974,796
3,302,333
5312448
94,394348,131279,446M ass.. . .
M ich .. . . 614 3,760,199 373 3,391,755 240 368,176 1 268Minn____ 677 1,873,354 215 1,498,988 40 78,429 422 295,937M iss---- 248 486,214 25 187,473 2 5,734 221 293,007Mo.......... 591 2,901,699 171 2,410,913 343 423,898 77 66,888Mont.. . . 110 319,052 69 264,542 21 24,737 20 29,773
NebNev........
4102367
47247
834,27599,101
158,6443,098,143
162,238
1482054
38827
661,37393,359
134,4922,633,344
130,427
1103
95,1535,742
24,152464,799
31,811
152 77,749
N. H ........ 138420
N. J........N. M .. ..
N. Y ........ 1,332 28,102,757 1,174 26,687,950 158 1,414,807N. C ........ 341 1,127,680 70 682,049 30 148,756 241 296,875N. D . . . . 176 299,836 42 129,913 3 59,087 131 110,836O hio . . . . 849 5,068,468 563 4,580,990 286 487,478O k la .. . . 382 914,691 215 793,707 155 115,780 12 5,204
Oregon. 138 897,132 98 848,329 40 48,803Penna.. . 1,135 7,489,012 850 6,509,211 285 979,801R. I ........ 59 507,894 39 457,230 20 50,664S. C ........ 169 393,510 49 283,974 4 6,552 116 102,984S. D ........ 205 240,051 80 168,264 7 6,604 118 65,183
T e n n .... 344. 1,297,637 105 1,046,847 57 114,978 182 135,812T e x a s ... 848 3,658,958 535 3,302,448 229 307,859 84 48,651U ta h ... . Vt ........
70.79
383,855159,804
1,255,671
4341
327,92585,647
2738
55,93074,157
179,269V a .......... 386 221 1,035,782 118 47 40,620
W ash ... 219 1,458,162 144 1,367,838 60 77,432 15 12,892W . V a . . 180 545,562 107 426,961 68 113,060 5 5,542W is........ 695 1,897,237 178 1,351,252 324 432,511 193 113,474W yo— 56 136,023 37 112,008 18 23,754 1 261
Total. 17,584 105,823,257 9,362 92,369,167 5,425 10,946,291 2,797 2,507,799
NOTE: This table does not include deposits of industrial banks and "trust balances" of nondeposit trust companies on w hich no checks are drawn; also, deposit figures in this table are aggregates of December 1943 figures reported by banks that w ere in existence in June 1944. Consequently they differ from total deposits in December 1943 of banks then in existence. The member bank figures include, and the nonmember bank figures exclude, deposits of banks that became members between December 1943 and June 1944.in c lu d e s (a) 102 private banks that do not report to State banking departments, in Georgia, Iowa, Michigan, and Texas, (b) 13 "cooperative" banks in Arkansas. Excludes (a) all nonmember mutual savings banks, on a few of w hich some checks are drawn, (b) 51 nonmember industrial banks and 54 nonmember nondeposit trust companies on w hich no checks are drawn.
2Com prises a ll member banks, including 3 mutual savings banks and 5 nondeposit trust companies.
harvest totaled 18,215,000 pounds as compared with14,910,000 pounds in 1943. Prices were excellent on the markets this year.
► Net circulation of this Bank’s Federal Reserve notes continues to increase; on September 20 it was 41 per cent greater than at the same time a year ago. The increase in net circulation in August was 32 million dollars, more th§n twice the increase recorded a month earlier. Notes of the smaller denominations, 5-, 10- and 20-dollar notes, increased about 19 million dollars in August, and those of $50 and over increased about 13 million dollars. Since last December, however, the total increase in the smaller-denomination notes has amounted to about 91 million dollars, and the rise in circulation of the larger notes has totaled about 97 million dollars.
Demand deposits (adjusted) at the Sixth District’s 20 weekly reporting member banks show an increase in recent weeks over the averages for July and August, but they are still somewhat below the June 14 peak. On September 20 they were 21 per cent greater than they were a year earlier. Time deposits reached a new high point on September 20 and were27 per cent greater than a year ago. During the four weeks ending September 20, total loans and investments reported by these banks declined 1 per cent because of a slight reduction in holdings of investment securities.
Figures recently released by the United States Department of Commerce indicate that income payments in the District continued, in 1943, to increase relative to the country as a whole, although they still remained far below the national average. The department reports that in 1943, Alabama income payments per capita were $603, a 68 per cent increase over 1941. Florida income payments in 1943 were $874 per capita, up 65 per cent from 1941. In Georgia, income payments per capita increased by 66 per cent between 1941 and1943 and were $647 per capita in the latter year. In Louisiana, income payments per capita were $714 in 1943, an increase of 65 per cent in the last two years. Mississippi recorded a 71 per cent increase between 1941 and 1943; per capita income payment in the latter year was $484. Tennessee had a per capita income of $449 in 1943, an increase of 57 per cent since 1941. By comparison, the per capita income in the United States as a whole in 1943 was $1,031, an increase of49 per cent since 1941.
As of September 1, the War Manpower Commission classified the following District cities in Group 1: Columbus, Macon, and Savannah, Georgia; Knoxville, Tennessee; Mobile, Alabama; and Pascagoula, Mississippi. Group 1 areas are those in which acute labor shortages that will endanger essential production exist or are anticipated.
► Sales of life insurance in the six states of this District during August, although a record total for that month, were down 1 per cent from July. The total was, however, 14 per cent greater than that for August a year ago. For the country as a whole, the gain over August 1943 was 12 per cent. Increases of 37 per cent in Mississippi, 21 per cent in Georgia, and 13 per cent in Tennessee were larger than the national average increase. The increase in Louisiana was 5 per cent and that in Alabama 3 per cent, but in Florida, August sales were the same as they were a year ago. In the first eight months of this year, sales in the District’s six states have been up 19 per cent compared with those of the same period last year, against a gain of 16 per cent for the country as a
Digitized for FRASER http://fraser.stlouisfed.org/ Federal Reserve Bank of St. Louis

M o n t h l y R e v i e w o f t h e F e d e r a l R e s e r v e B a n k o f A t l a n t a f o r S e p t e m b e r 1 9 4 4 8 3
whole. Florida, Mississippi, and Tennessee had increases for this period larger than the national average.► A total of 11.0 million people were working on farms in the United States on September 1, according to an estimate by the United States Department of Agriculture. This figure was4 per cent under that for the comparable date in 1943 and 8 per cent less than the average September 1 employment in the five prewar years, 1935-39. In all geographic regions, employment on farms has declined during the past year. The greatest decline has taken place in the East South Central region, covering the states of Kentucky, Tennessee, Alabama, and Mississippi; the 1935-39 average September 1 employment in that region was 2.0 million. Total farm employment on September 1 of this year was only 1.7 million workers, of whom 1.4 million were family workers and 0.3 million were hired workers.
In the South Atlantic region, which includes Florida, Georgia, the Carolinas, the Virginias, Maryland, and Delaware, total farm employment on September 1 of this year was 2.1 million, compared with the 1935-39 average of 2.3 million. In the West South Central region, covering the states of Louisiana, Arkansas, Oklahoma, and Texas, total farm employment on September 1 this year was 1.7 million persons as compared with the prewar average of 2.0 million.
Foreign agricultural workers transported by the Office of Labor of the War Food Administration have helped the farm-labor situation in two states of the District. Working on Florida farms and in the orchards on August 31 were J ,582 Jamaicans and 1,000 Bahamians and doing farm work in Tennessee were 322 Bahamians.► Wartime demands for rosin have continued to grow in recent weeks. In mid-September, it was announced that the production of yellow laundry soap, requiring rosin in its manufacture, would be increased considerably. This increase has been made necessary by the larger requirements of the Army for such soap as well as the rising demands of civilian consumers. In recent weeks, synthetic resin manufacturers have been reported among the chief buyers of the paler grades of rosin.
Prices of gum rosin have been rising as a result of increased demand and short supplies, and on September 20 the OPA established a permanent ceiling price for grade K rosin of $5.61 a hundred pounds net in drums on the yard in Savannah. Specific prices were set for the other 12 grades of gum rosin as well as maximum prices for sales made on the Savannah Naval Stores Exchange. The ceiling on grade X, the top grade, is $6.31, and the prices range downward to $4.81 for grade B. The bulk of rosin sales are made off the exchange, and maximum prices for such sales are established in the new OPA regulation by applying a differential to the exchange, or base price, listed in the regulation. This differential is the most favorable one realized by the seller during the first six months of 1944 on a similar sale.► For the country as a whole, wholesale prices of farm products and foods showed small seasonal decreases from the middle of August to the middle of September. Maximum prices of such industrial goods as cotton fabrics, cement, and bricks were increased.
Retail prices of food and other cost-of-living items increased slightly in August and the average of all items was2 per cent higher than a year ago.
S ix t h D i s t r i c t S t a t i s t i c s
R ETA IL FU RN ITURE STO RE OPERATIONS
Per Cent ChangeItem of August 1944 Irom
Stores July 1944 August 1943
Total Sa les .................................................. 93 + 17 + 5Cash S a les .................................................. 81 + 11 + 7Instalment and Other Credit Sa ids.. 81 + 17 + 5Accounts Receivable, end of month.. 92 + 1 — 13Collections during month..................... 92 + 2 — 8Inventories, end of month..................... 66 + 7 ' — 19
CONDITION O F FED ER A L R ESER V E BAN E O F ATLANTA (In Thousands of Dollars)
Item Sept. 20 1944
Aug. 23 1944
Sept. 22 1943
Per cent change Sept. 20. 1944. from
Aug. 23 1944
Sept. 22 1943
Bills discounted.......................Industrial advances...............U. S. securities.........................
Total bills and securities.F. R. note circulation.............Member bank reserve
deposits.................................U. S. Gov't deposits...............Foreign bank deposits........ .Other deposits.........................
Total deposits.......................Total reserves...........................
2,95025
750,880753,855
1,151,530
568,15610,24744,1113,613
626,127997,818
2.750 32
728,117730,899
1,118,256
533,09134,20643,857
2.750 613,903 994,667
209312,687312,896816,652
475,31524,45438,888
6,116544,772
1,028,628
+ 7 — 22
t 3+ 3
+ 7 — 70 + 1 + 31 + 2 + o
— 88 + 140 + 141 + 41
+ 20— 58 + .13— 41 + 15— 3
DEBITS TO IN DIVIDUAL BA N E A CCO U N TS (In Thousands of Dollars)
Per Cent ChangeAug. July Aug. Aua. 1944 from
Area 1944 1944 1943July 1944 Aug. 1943
ALABAMAAnniston..................... 17,295 16,241 12,609 + S + 37Birmingham.............. 167,608 177,069 153,294 — 5 + 9Dothan........................ 6,892 5,502 5,554 + 25 + 24G adsden ..................... 9,594 9,760 8,720 — 2 + 10
112,364 114,29:1 108,851 — 2 + 3Montgomery............. 35,550 33,883 33,095 + 5 + 7
FLO RID AJacksonville............... 170,933 167,653 167,605 + 2 + 2Miami........................... 114,661 110,756 90,380 + 4 + 27Greater Miami*........ 149,266 144,996 113,787 + 3 + 31O rlando...................... 22,785 25,042 18,101 — 9 + 26Pensacola................... 23,795 23,651 21,172 + 1 + 12St. Petersburg........ 19,769 21,900 18,928 — 10 + 4Tam pa......................... 69,573 76,898 68,182 — 10 + 2
G EO R G IAA lb any....................... 8,162 8,663 7,484 — 6 + 9Atlanta......................... 476,038 460,055 405,203 + 3 + 17Augusta..................... 33,934 34,158 29,557 — 1 + 15Brunswick................. 13,200 14,908 15,174 — 11 — 13Colum bus.................. 30,481 32,523 31,854 — 6 — 4Elberton..................... 1,731 1,787 1,457 — 3 + 19M acon......................... 43,108 45,039 42,811 — 4 + 1Newnan...................... 4,128 4,495 3,985 — 8 + 4Savannah................... 89,754 97,274 76,132 — 8 + 18Valdosta..................... 15,940 6,602 14,683 + 141 + 9
LO UISIAN ABaton Rouge............ 37,947 40,536 37,179 — 6 + 2Lake C h arles............ 15,490 17,225 18,332 — 10 — 16New O rlean s............ 406,862 429,365 352,260 — 5 + 16
M ISSISSIPPIHattiesburg.............. 12,619 13,021 12,255 — 3 + 3Jackson....................... 59,734 53,143 42,622 + 12 + 40M eridian..................... 15,488 16,275 14,149 — 5 + 9V icksburg ................. 16,182 21,998 16,033 — 26 + 1
TEN N ESSEEChattanooga............ 78,537 90,345 76,560 — 13 + 3Knoxville ................... 100,543 105,976 63,961 — 5 + 57N ashville................... 171,178 171,475 164,844 - 0 + 4
SIXTH D ISTRICT32 C it ie s ..................... 2,401,875 2,447,509 2,133,026 — 2 + 13
UNITED STATES334 C it ie s ................... 69,213,000 72,945,000 60,613,000 — 5 + 14
*Not included in totals
Digitized for FRASER http://fraser.stlouisfed.org/ Federal Reserve Bank of St. Louis

8 4 M o n t h l y R e v i e w o f t h e F e d e r a l R e s e r v e B a n k o f A t l a n t a f o r S e p t e m b e r 1 9 4 4
The National Business SituationI ndustrial output and employment showed little change in
August. Retail trade was at a new high level for the month. There"was a small further rise in retail commodity prices. Industrial Production: Output at factories and mines was 232 per cent of the 1935-39 average in August as compared with 231 for July, according to the Board’s seasonally adjusted index of industrial production. Steel production was maintained, while output of nonferrous metals continued to decline. Over-all activity in the metal fabricating industries continued at the level of the preceding month. There were large increases in output of heavy trucks, tanks, and some other critical ordnance items in August; aircraft production showed little change; while shipbuilding declined.
Output increased in the shoe, woolen and worsted, and paper industries in August following a drop in July which reflected chiefly the curtailment of operations around the Fourth. Output of manufactured foods, after allowance for seasonal changes, declined in August, largely reflecting decreases in output of meats, dairy products, and sugar products. Distilleries were shifted for the month of August from production of industrial alcohol for war purposes and output of about 50,000,000 proof gallons of beverage spirits was reported. Production of other nondurable goods was maintained at the level of the preceding month.Distribution: Value of department store sales, according to the Board’s seasonally adjusted index, was larger in August and the first half of September than in the first half of 1944 and averaged 12 per cent above the corresponding period of last year. In the third quarter the index at 90 per cent above the 1935-39 average has been at the highest level on record.
Carloadings of railroad freight were maintained in large volume in August. During the first three weeks in September loadings were slightly less than during the same period a year ago, owing to decreases in all classes of freight except merchandise in less than carload lots and miscellaneous ship-
end of the Fifth War Loan Drive. This increase in the money holdings of businesses and individuals is largely a reflection of the expenditures made by the Treasury from its war-loan accounts built up during the drive. Adjusted demand and time deposits at member banks in leading cities increased by nearly 4 billion dollars between the close of the drive and mid-September, or by over three-quarters of the amount of reduction in such funds during the drive. Deposits at nonreporting banks probably increased by nearly 2 billion dollars. Treasury war-loan accounts at banks declined by nearly8 billion dollars.
In the same period loans and investments at weekly reporting member banks in 101 leading cities declined by 2.2 billion dollars. Loans to brokers and dealers for purchasing and carrying Government securities declined to a level approximately equal to that of the predrive period. There was, however, a temporary increase in such borrowings in late August and early September, presumably associated with market transactions stemming from the Treasury offer to exchange certificates maturing on September 1 and notes maturing on September 15 for new issues. Loans to others for purchasing and carrying securities declined steadily, but on September 13 were still well above the predrive level. Government security holdings showed a net decline of 800 million dollars over the period, reflecting mainly substantial bill sales by reporting banks partially offset by some increase in bond holdings.
As the result of the increase in deposits of businesses and individuals, the average level of required reserves at all member banks rose by about a billion dollars between the close of the Fifth Drive and mid-September. In addition, a billion-dollar increase in money in circulation and some further decrease in gold stock served to absorb reserve funds. Member bank needs for reserves due to these factors were met largely through an increase of 1.7 billion dollars in the Government security portfolio of the Federal Reserve Banks and there was also a slight increase in Reserve Bankf discounts.
ments.Bank Credit: Bank deposits of businesses and individuals, as well as currency in circulation, have increased since the
(This page was written by the staff of the Board of Governors of the Federal Reserve System)
F e d e r a l R e s e r v e i n d e x . M o n t h l y f i g u r e s ,l a t e s t s h o w n is f o r A u g u s t .
1940 1942 1944 1940 1942 1944
Based on Department of Commerce estimates. Wages and salaries include military pay. Monthly figures raised to annual rates, latest shown are for July.
1939 1940 1941 1942 1943 1944
W e d n e s d a y f i g u r e s , l a t e s t s h o w n a r e f o rS e p t e m b e r 2 0 .
MEMBER BANK R ESER V ES ANO RELATED ITEMSINDUSTRIAL PRODUCTION INCOME PAYMENTS TO INDIVIDUALSAM4UM. RATO. SEASONALLY ADJUSTED MUJON* Of DOLLARS
Digitized for FRASER http://fraser.stlouisfed.org/ Federal Reserve Bank of St. Louis