m3 stratigraphic modeling
DESCRIPTION
M3 Stratigraphic ModelingTRANSCRIPT

Module 3
Stratigraphic Modeling
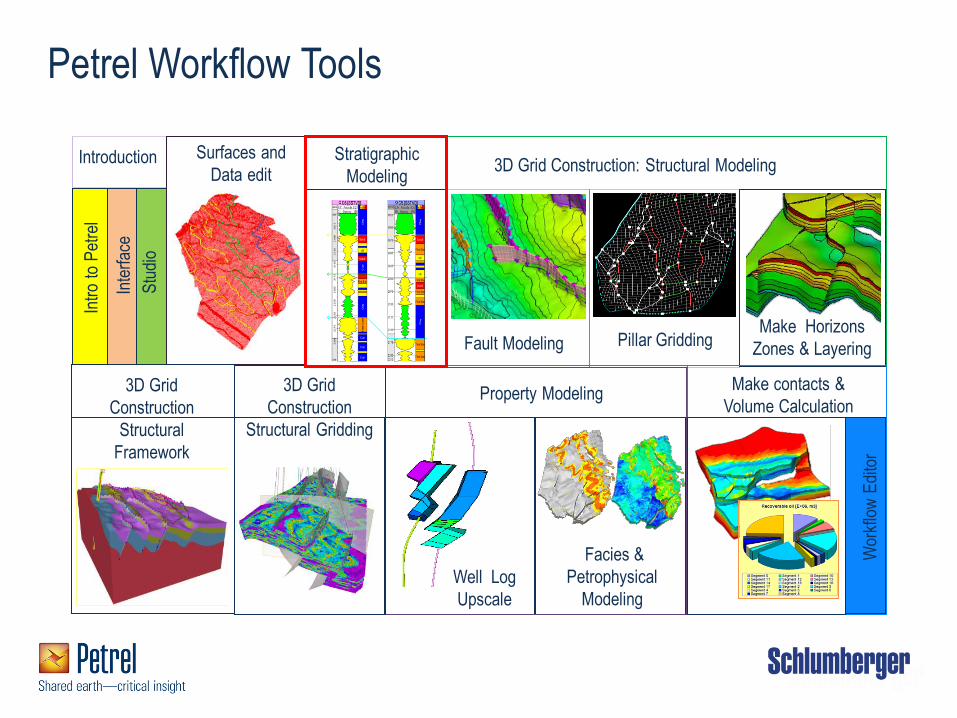
Petrel Workflow Tools
3D Grid
Construction
Structural Gridding
Stratigraphic
Modeling
Pillar Gridding
Well Log
Upscale
Facies &
Petrophysical
Modeling
Make contacts &
Volume Calculation
Intr
o to
Pet
rel
Inte
rfac
e
Wor
kflo
w E
dito
r
Property Modeling
Make Horizons
Zones & Layering
3D Grid Construction: Structural Modeling S
tudi
o
3D Grid
Construction
Structural
Framework
Fault Modeling
Introduction Surfaces and
Data edit
Stratigraphic Modeling:
Objectives
Create and display data in a Well section window.
Working with well templates.
Well section settings
Track and log settings
Use the Log Calculator.
Interactive Facies Interpretation
Make/edit Well tops.
Well top spreadsheet
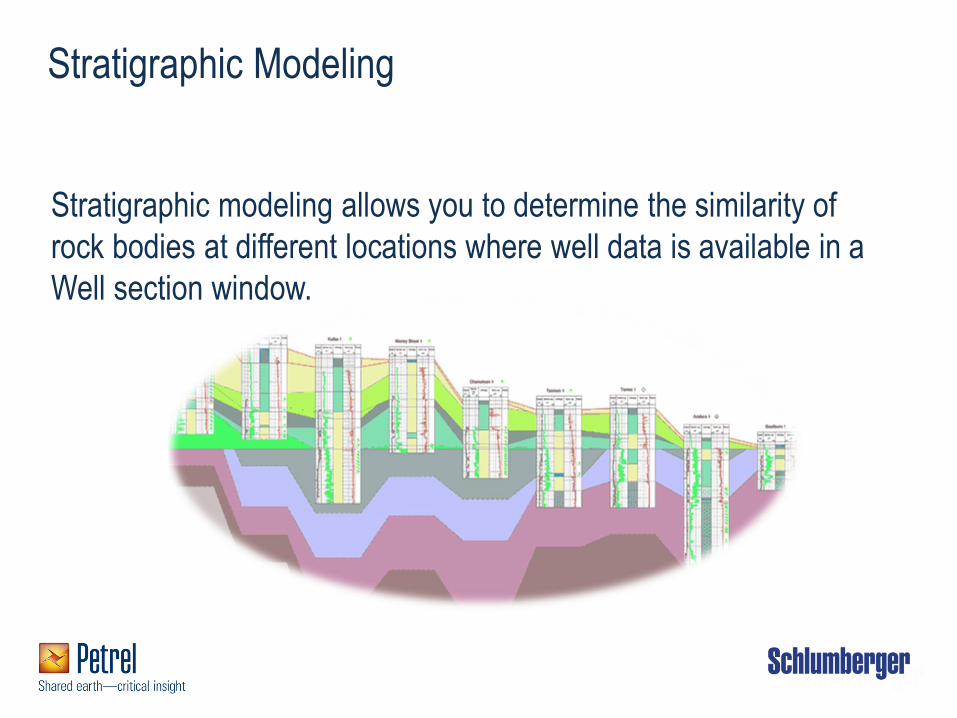
Stratigraphic Modeling
Stratigraphic modeling allows you to determine the similarity of
rock bodies at different locations where well data is available in a
Well section window.
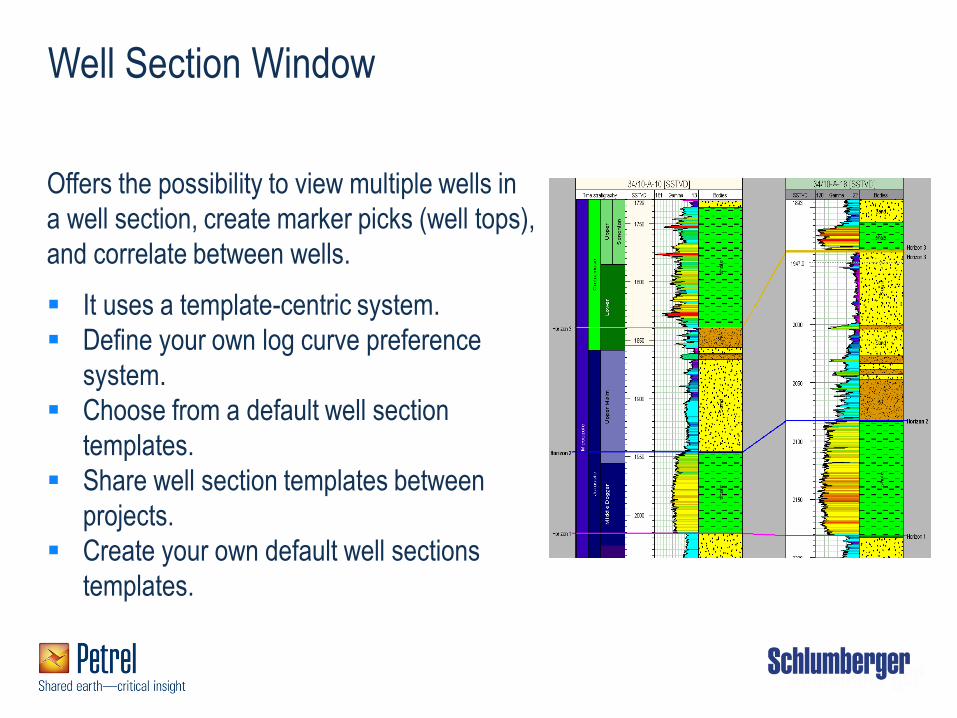
Well Section Window
Offers the possibility to view multiple wells in
a well section, create marker picks (well tops),
and correlate between wells.
It uses a template-centric system.
Define your own log curve preference
system.
Choose from a default well section
templates.
Share well section templates between
projects.
Create your own default well sections
templates.
Well Section Window: Well SectionTemplate
1
2.
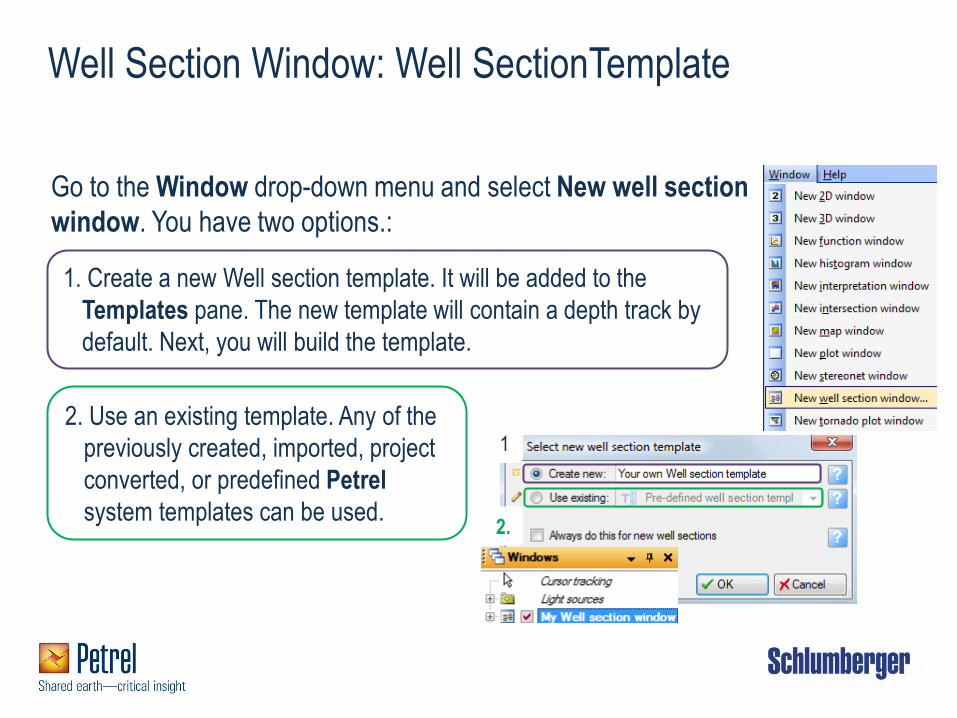
1. Create a new Well section template. It will be added to the
Templates pane. The new template will contain a depth track by
default. Next, you will build the template.
Go to the Window drop-down menu and select New well section
window. You have two options.:
2. Use an existing template. Any of the
previously created, imported, project
converted, or predefined Petrel
system templates can be used.
Add a Well to a Well Section Window (1)
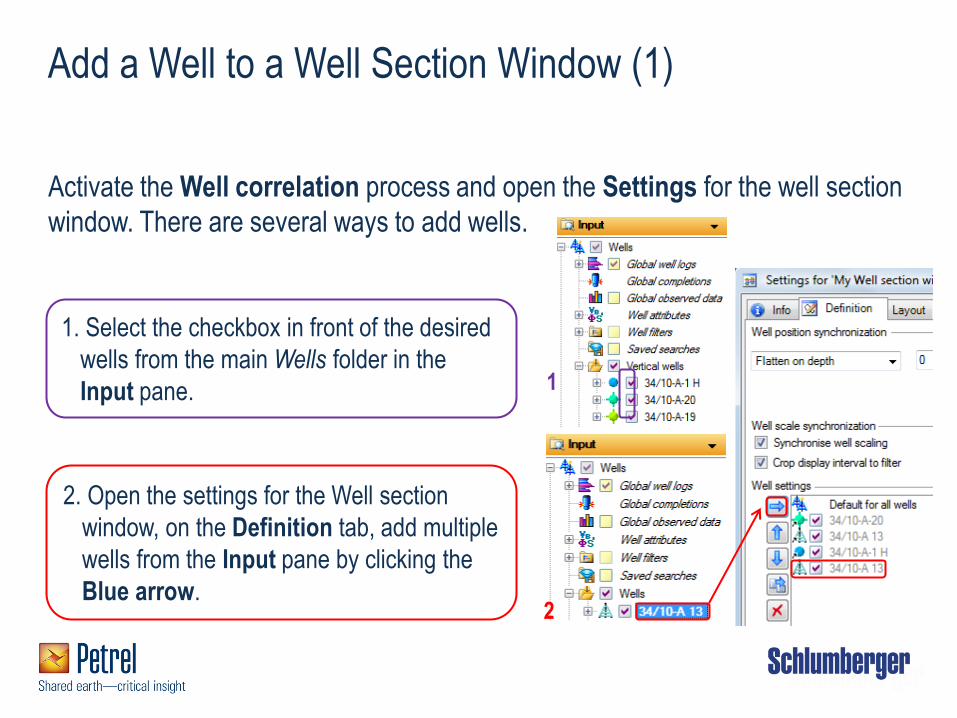
Activate the Well correlation process and open the Settings for the well section
window. There are several ways to add wells.
1. Select the checkbox in front of the desired
wells from the main Wells folder in the
Input pane.
2. Open the settings for the Well section
window, on the Definition tab, add multiple
wells from the Input pane by clicking the
Blue arrow.
1
2
Add a Well to a Well Section Window (2)
Well Section Fence
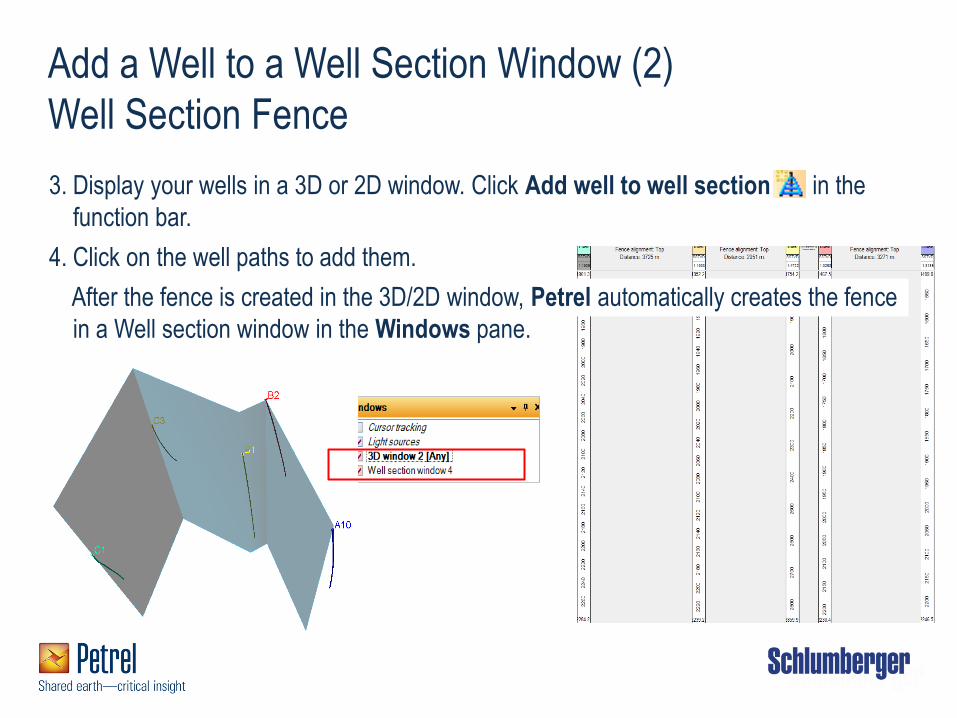
3. Display your wells in a 3D or 2D window. Click Add well to well section in the
function bar.
4. Click on the well paths to add them.
After the fence is created in the 3D/2D window, Petrel automatically creates the fence
in a Well section window in the Windows pane.
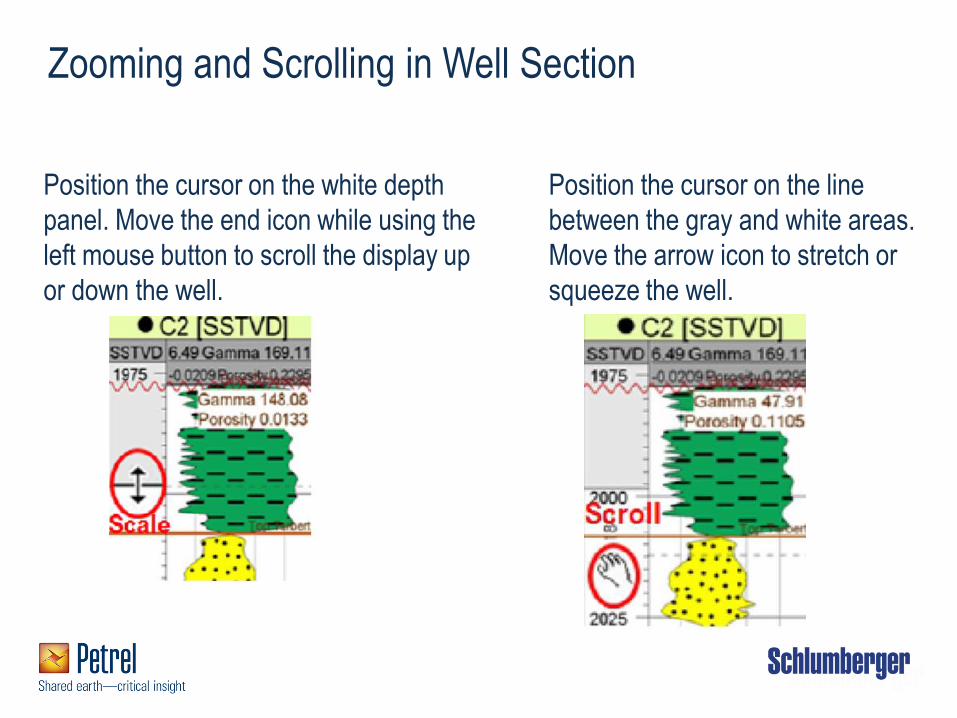
Position the cursor on the white depth
panel. Move the end icon while using the
left mouse button to scroll the display up
or down the well.
Position the cursor on the line
between the gray and white areas.
Move the arrow icon to stretch or
squeeze the well.
Zooming and Scrolling in Well Section
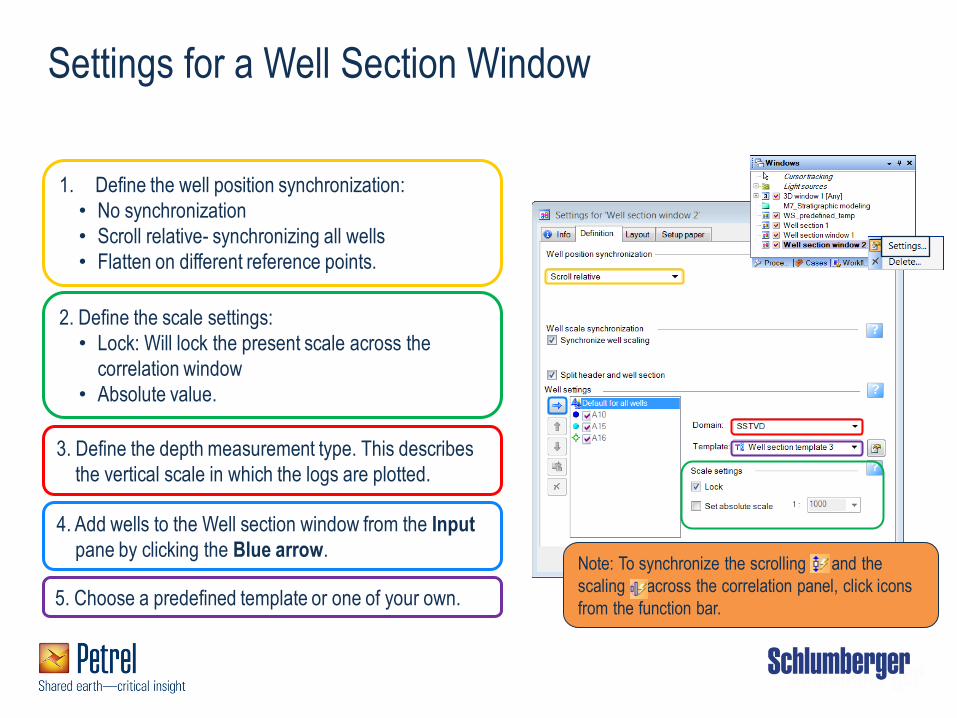
Settings for a Well Section Window
1. Define the well position synchronization:
• No synchronization
• Scroll relative- synchronizing all wells
• Flatten on different reference points.
2. Define the scale settings:
• Lock: Will lock the present scale across the
correlation window
• Absolute value.
3. Define the depth measurement type. This describes
the vertical scale in which the logs are plotted.
4. Add wells to the Well section window from the Input
pane by clicking the Blue arrow.
5. Choose a predefined template or one of your own.
Note: To synchronize the scrolling and the
scaling across the correlation panel, click icons
from the function bar.
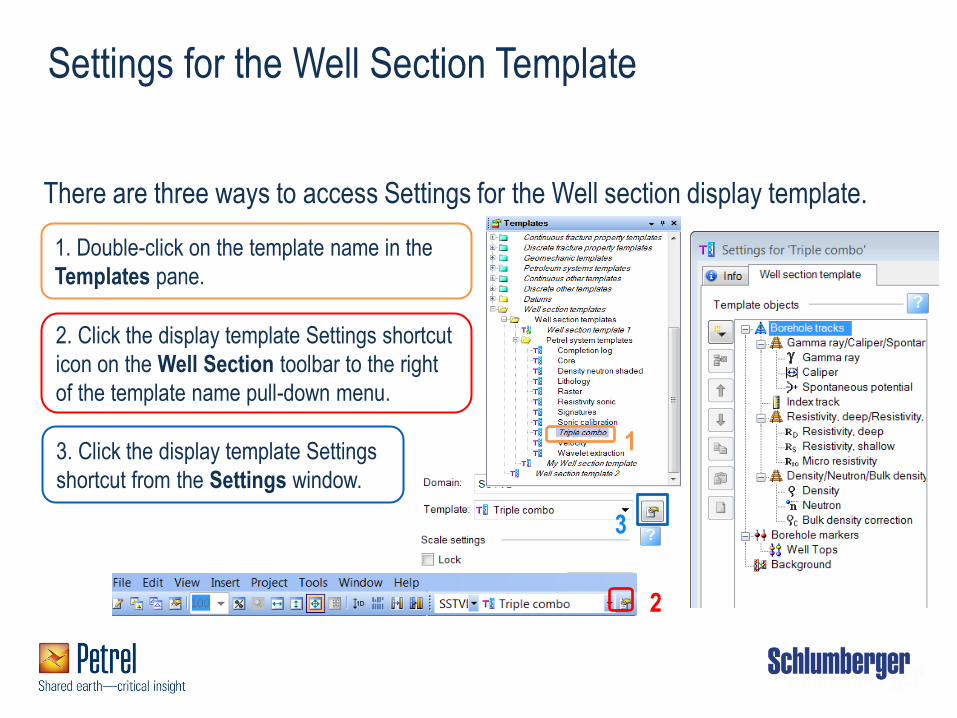
Settings for the Well Section Template
There are three ways to access Settings for the Well section display template.
1. Double-click on the template name in the
Templates pane.
2. Click the display template Settings shortcut
icon on the Well Section toolbar to the right
of the template name pull-down menu.
1
2
3. Click the display template Settings
shortcut from the Settings window.
3
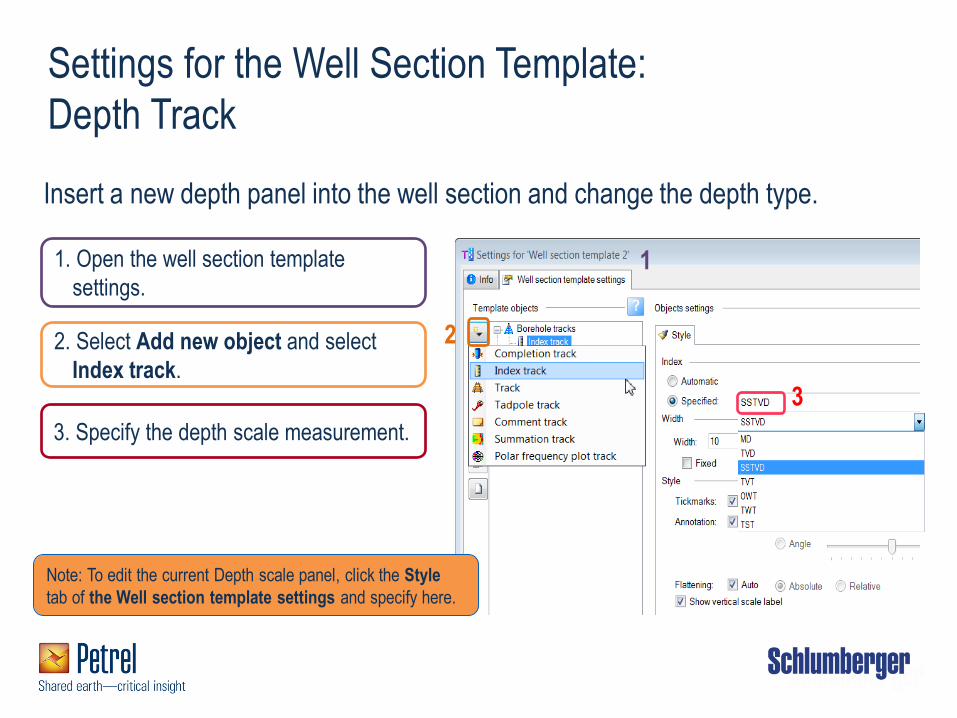
Settings for the Well Section Template:
Depth Track
Insert a new depth panel into the well section and change the depth type.
1. Open the well section template
settings.
2. Select Add new object and select
Index track.
3. Specify the depth scale measurement.
2
3
1
Note: To edit the current Depth scale panel, click the Style
tab of the Well section template settings and specify here.
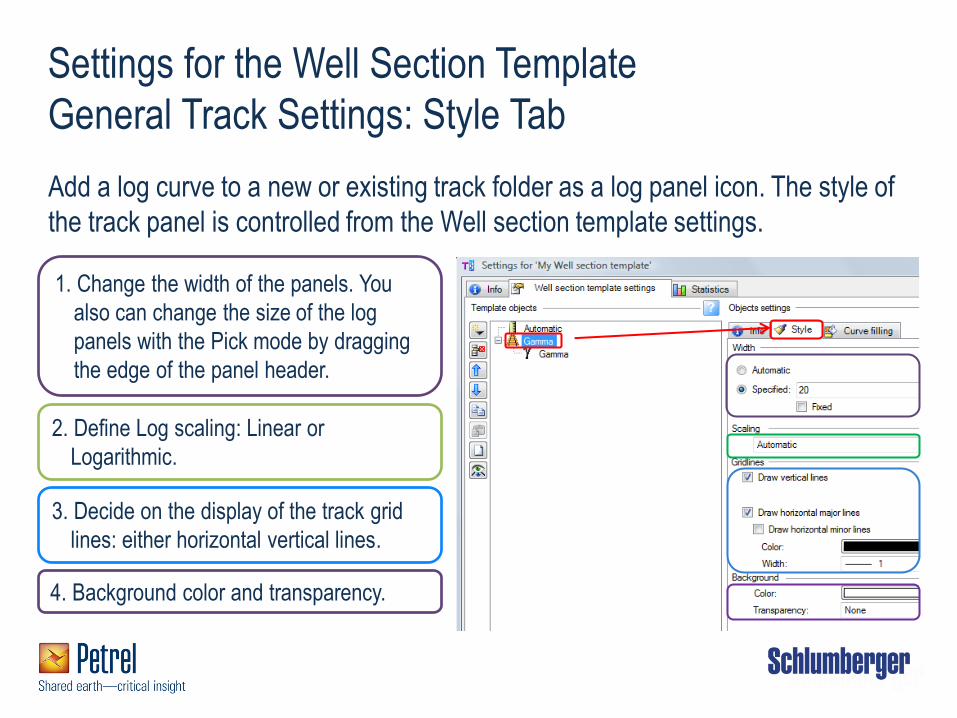
Settings for the Well Section Template
General Track Settings: Style Tab
Add a log curve to a new or existing track folder as a log panel icon. The style of
the track panel is controlled from the Well section template settings.
1. Change the width of the panels. You
also can change the size of the log
panels with the Pick mode by dragging
the edge of the panel header.
4. Background color and transparency.
3. Decide on the display of the track grid
lines: either horizontal vertical lines.
2. Define Log scaling: Linear or
Logarithmic.
Settings for the Well Section Template
General Track Settings: Curve Filling
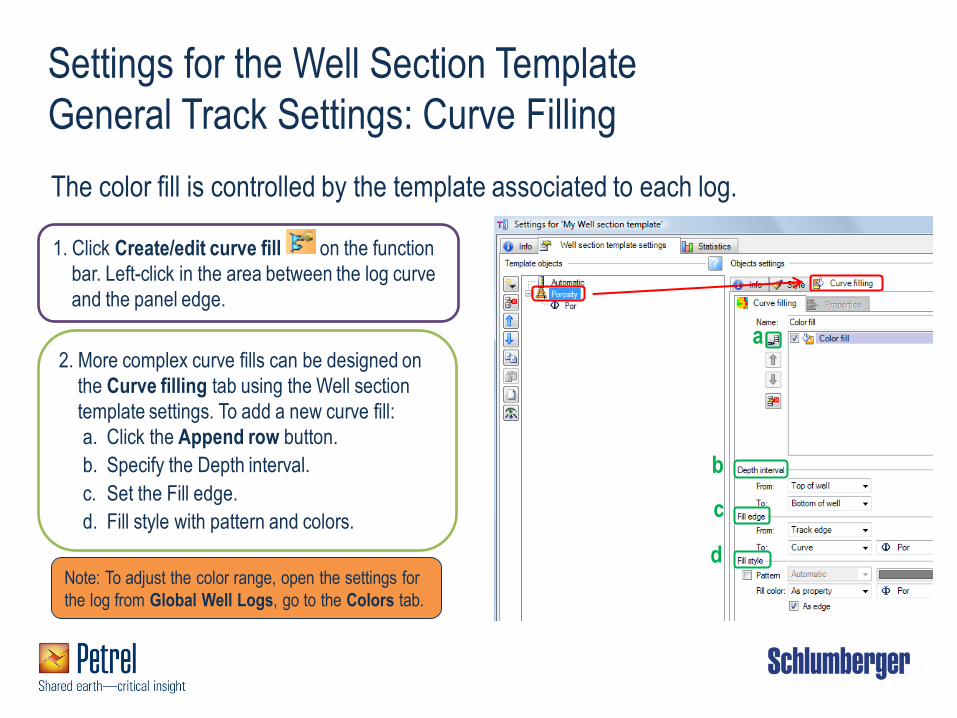
1. Click Create/edit curve fill on the function
bar. Left-click in the area between the log curve
and the panel edge.
The color fill is controlled by the template associated to each log.
2. More complex curve fills can be designed on
the Curve filling tab using the Well section
template settings. To add a new curve fill:
a. Click the Append row button.
b. Specify the Depth interval.
c. Set the Fill edge.
d. Fill style with pattern and colors.
a
b
c
d Note: To adjust the color range, open the settings for
the log from Global Well Logs, go to the Colors tab.
Create or Edit Log Templates
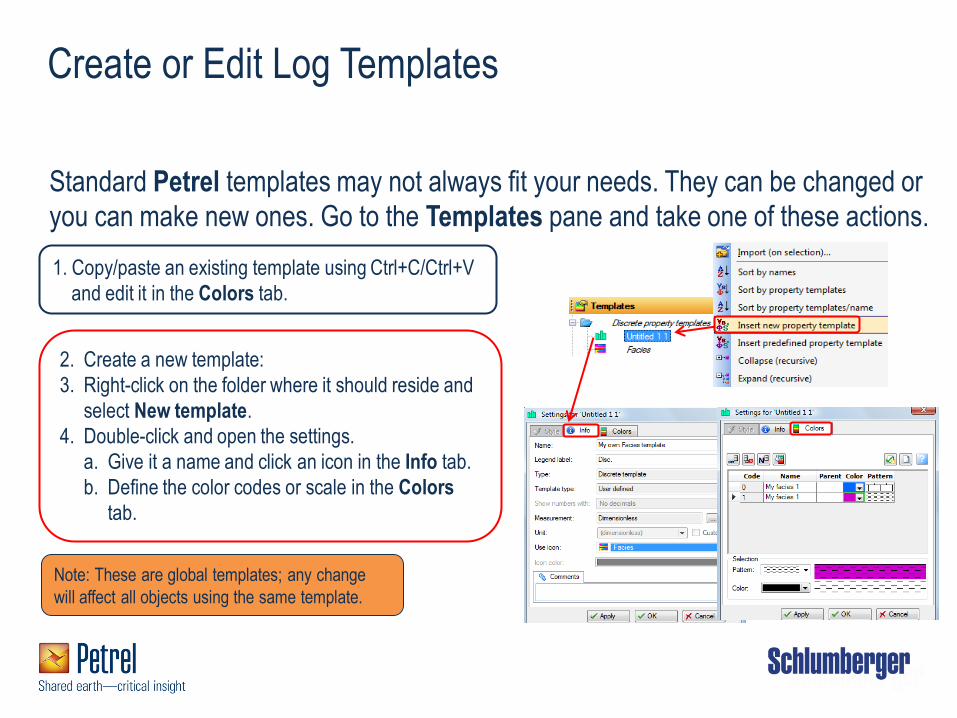
Standard Petrel templates may not always fit your needs. They can be changed or
you can make new ones. Go to the Templates pane and take one of these actions.
1. Copy/paste an existing template using Ctrl+C/Ctrl+V
and edit it in the Colors tab.
2. Create a new template:
3. Right-click on the folder where it should reside and
select New template.
4. Double-click and open the settings.
a. Give it a name and click an icon in the Info tab.
b. Define the color codes or scale in the Colors
tab.
Note: These are global templates; any change
will affect all objects using the same template.
Settings for the Well Section Template
General Log Settings
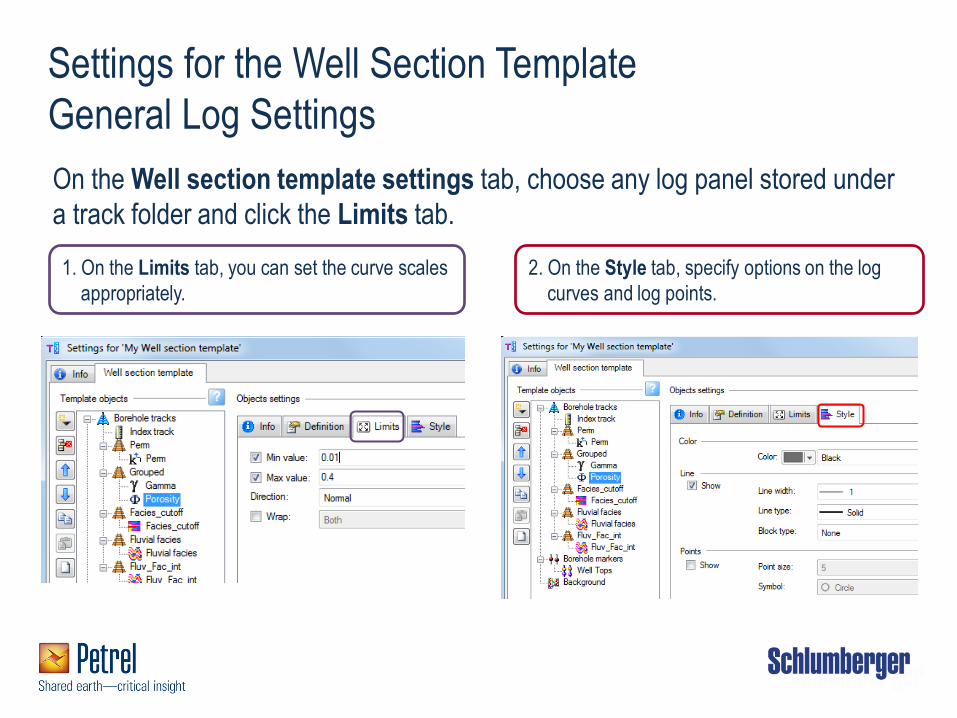
On the Well section template settings tab, choose any log panel stored under
a track folder and click the Limits tab.
1. On the Limits tab, you can set the curve scales
appropriately.
2. On the Style tab, specify options on the log
curves and log points.
Settings for the Well Section Template
Grouping Logs in a Single Track Panel
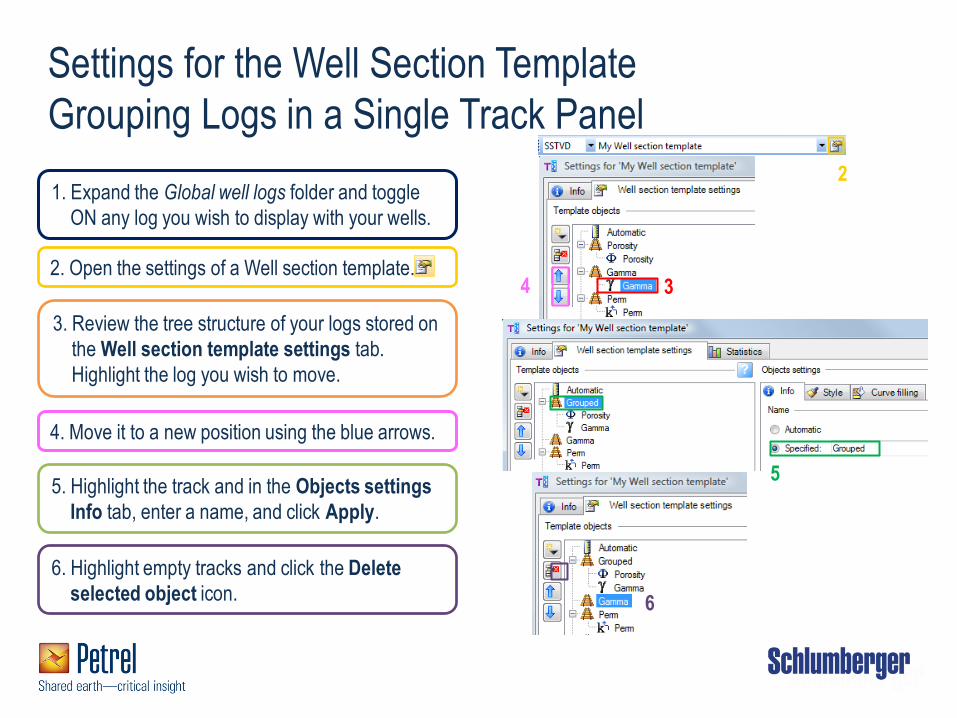
2. Open the settings of a Well section template.
1. Expand the Global well logs folder and toggle
ON any log you wish to display with your wells.
3. Review the tree structure of your logs stored on
the Well section template settings tab.
Highlight the log you wish to move.
4. Move it to a new position using the blue arrows.
5. Highlight the track and in the Objects settings
Info tab, enter a name, and click Apply.
6. Highlight empty tracks and click the Delete
selected object icon.
4
5
3
6
2
Settings for the Well Section Template
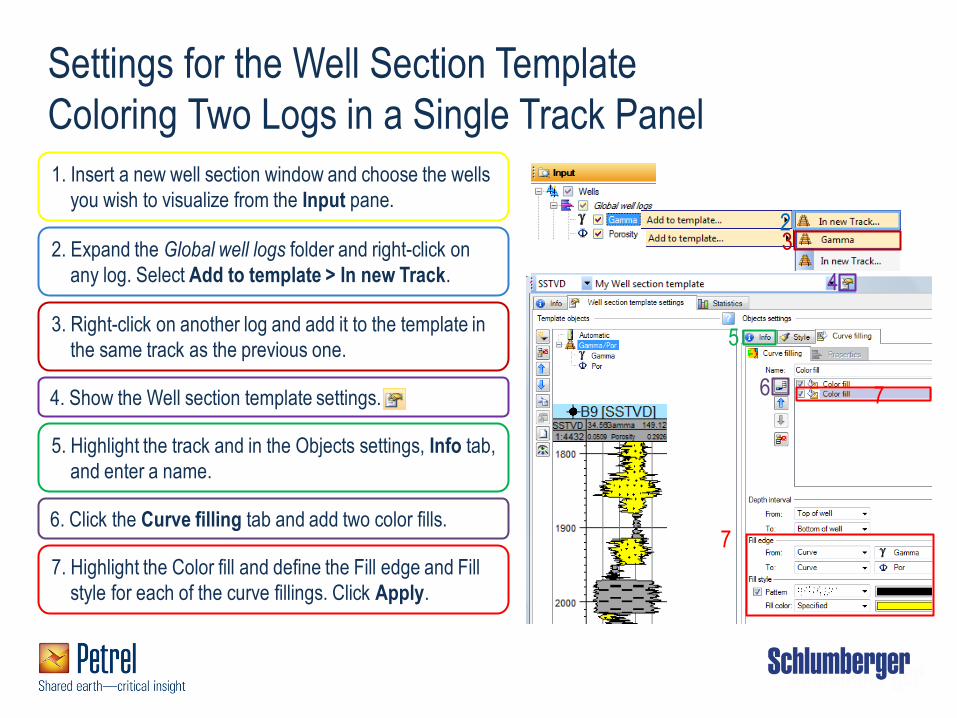
Coloring Two Logs in a Single Track Panel
1. Insert a new well section window and choose the wells
you wish to visualize from the Input pane.
2. Expand the Global well logs folder and right-click on
any log. Select Add to template > In new Track.
3. Right-click on another log and add it to the template in
the same track as the previous one.
4. Show the Well section template settings.
5. Highlight the track and in the Objects settings, Info tab,
and enter a name.
6. Click the Curve filling tab and add two color fills.
7. Highlight the Color fill and define the Fill edge and Fill
style for each of the curve fillings. Click Apply.
2 3
5
7 6
7
4
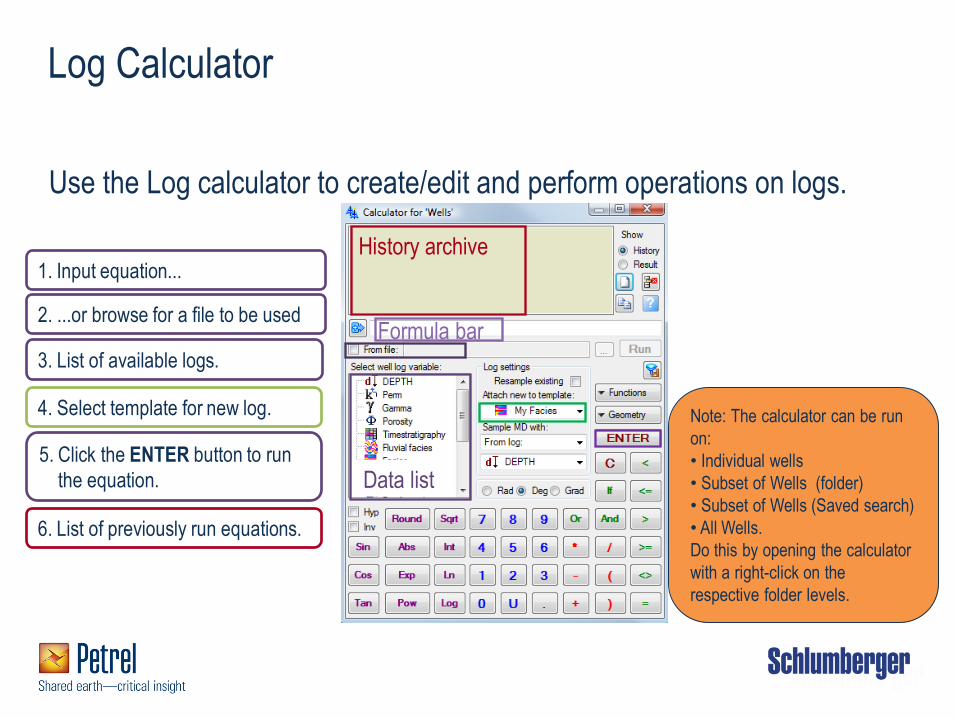
Log Calculator
Use the Log calculator to create/edit and perform operations on logs.
3. List of available logs.
1. Input equation...
4. Select template for new log.
5. Click the ENTER button to run
the equation.
6. List of previously run equations.
2. ...or browse for a file to be used
History archive
Formula bar
Data list
Note: The calculator can be run
on:
• Individual wells
• Subset of Wells (folder)
• Subset of Wells (Saved search)
• All Wells.
Do this by opening the calculator
with a right-click on the
respective folder levels.
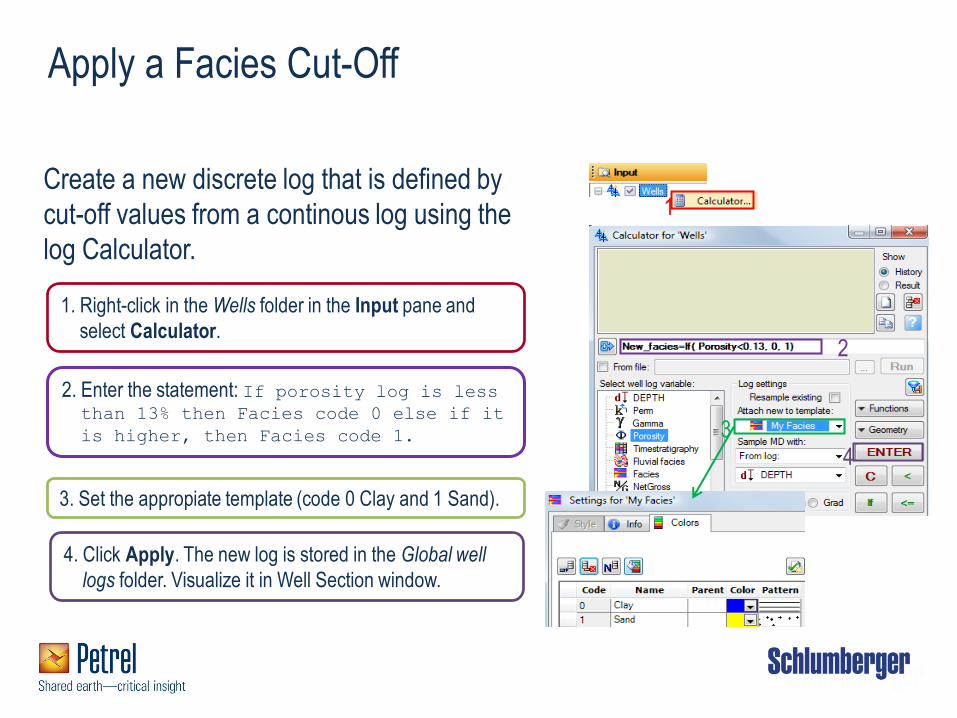
Apply a Facies Cut-Off
Create a new discrete log that is defined by
cut-off values from a continous log using the
log Calculator.
2. Enter the statement: If porosity log is less than 13% then Facies code 0 else if it
is higher, then Facies code 1.
4. Click Apply. The new log is stored in the Global well
logs folder. Visualize it in Well Section window.
1. Right-click in the Wells folder in the Input pane and
select Calculator.
3. Set the appropiate template (code 0 Clay and 1 Sand).
1
2
3 4
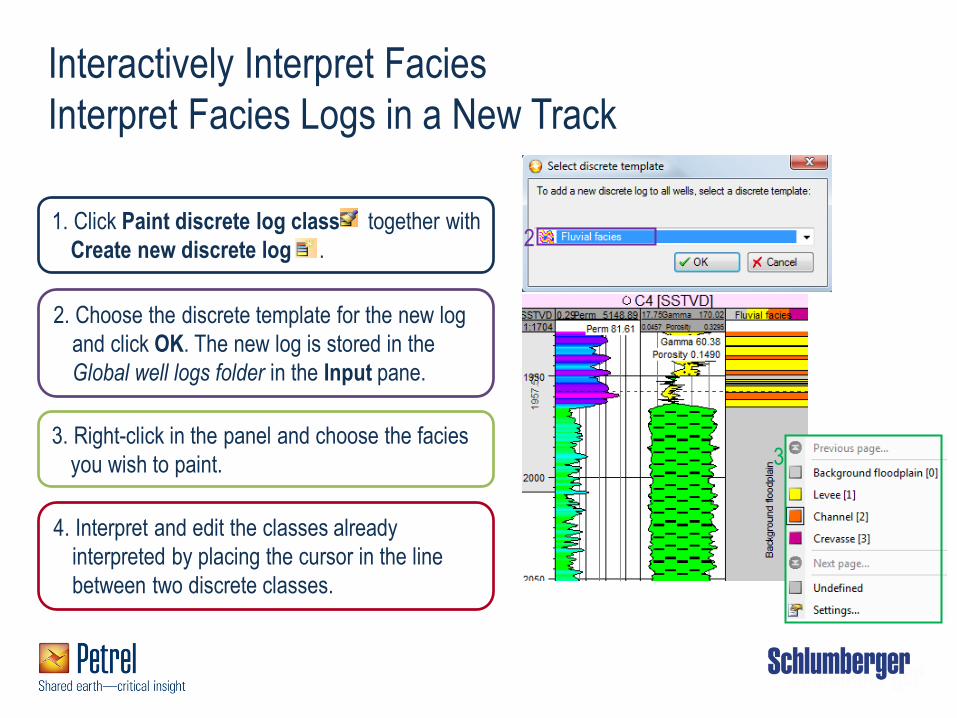
Interactively Interpret Facies
Interpret Facies Logs in a New Track
1. Click Paint discrete log class together with
Create new discrete log .
2. Choose the discrete template for the new log
and click OK. The new log is stored in the
Global well logs folder in the Input pane.
3. Right-click in the panel and choose the facies
you wish to paint.
4. Interpret and edit the classes already
interpreted by placing the cursor in the line
between two discrete classes.
2
3
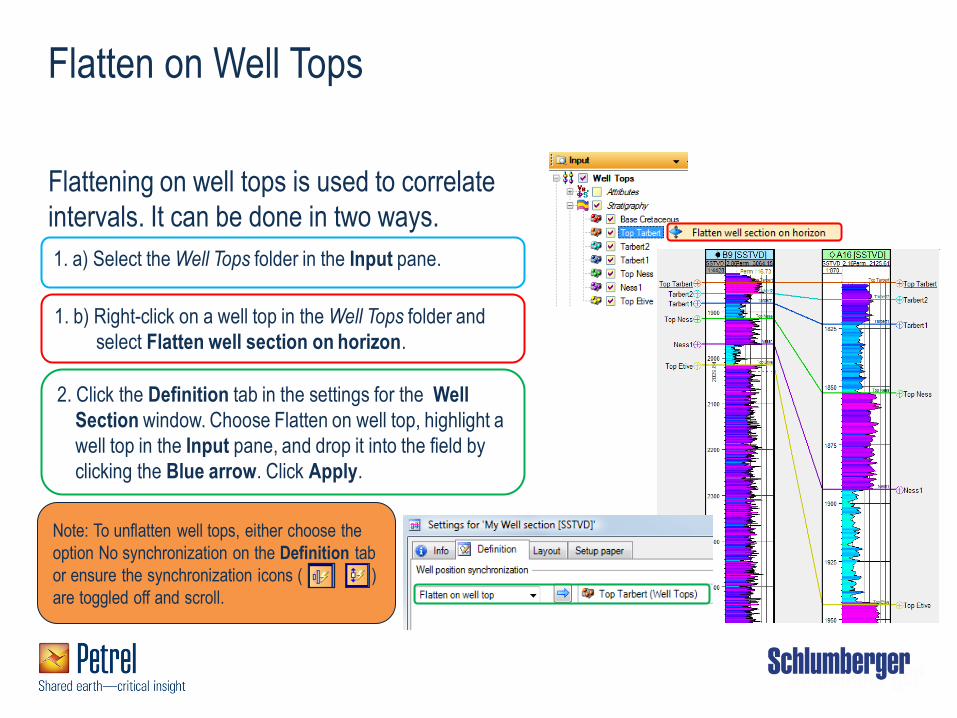
Flatten on Well Tops
Flattening on well tops is used to correlate
intervals. It can be done in two ways.
1. b) Right-click on a well top in the Well Tops folder and
select Flatten well section on horizon.
2. Click the Definition tab in the settings for the Well
Section window. Choose Flatten on well top, highlight a
well top in the Input pane, and drop it into the field by
clicking the Blue arrow. Click Apply.
1. a) Select the Well Tops folder in the Input pane.
2
Note: To unflatten well tops, either choose the
option No synchronization on the Definition tab
or ensure the synchronization icons ( )
are toggled off and scroll.
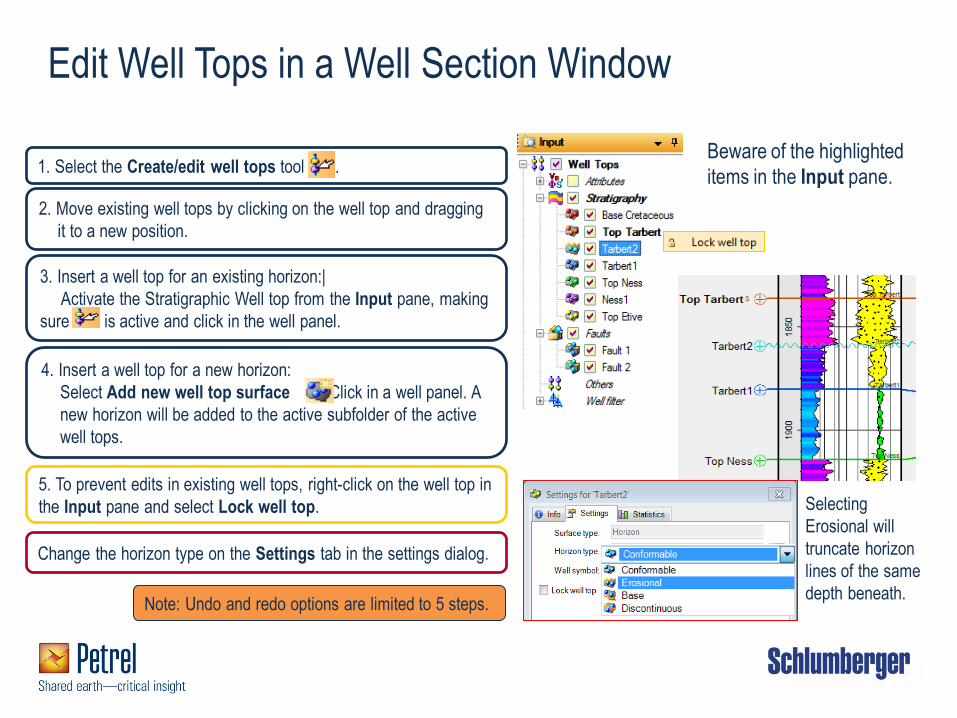
Edit Well Tops in a Well Section Window
1. Select the Create/edit well tops tool .
2. Move existing well tops by clicking on the well top and dragging
it to a new position.
3. Insert a well top for an existing horizon:|
Activate the Stratigraphic Well top from the Input pane, making
sure is active and click in the well panel.
4. Insert a well top for a new horizon:
Select Add new well top surface . Click in a well panel. A
new horizon will be added to the active subfolder of the active
well tops.
Note: Undo and redo options are limited to 5 steps.
Beware of the highlighted
items in the Input pane.
5. To prevent edits in existing well tops, right-click on the well top in
the Input pane and select Lock well top.
Change the horizon type on the Settings tab in the settings dialog.
Selecting
Erosional will
truncate horizon
lines of the same
depth beneath.
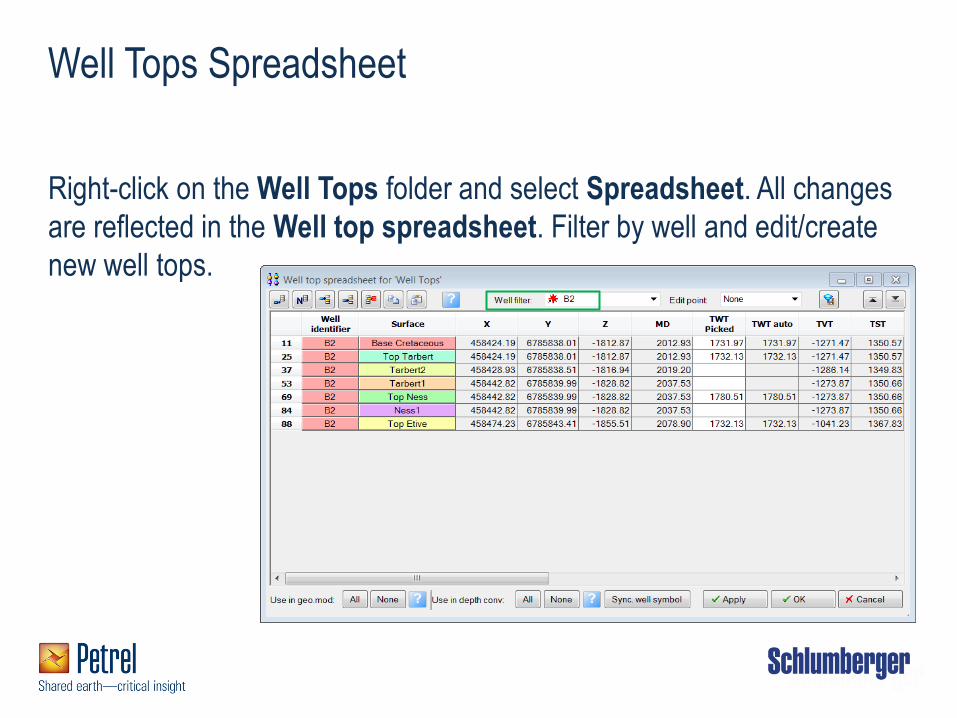
Well Tops Spreadsheet
Right-click on the Well Tops folder and select Spreadsheet. All changes
are reflected in the Well top spreadsheet. Filter by well and edit/create
new well tops.
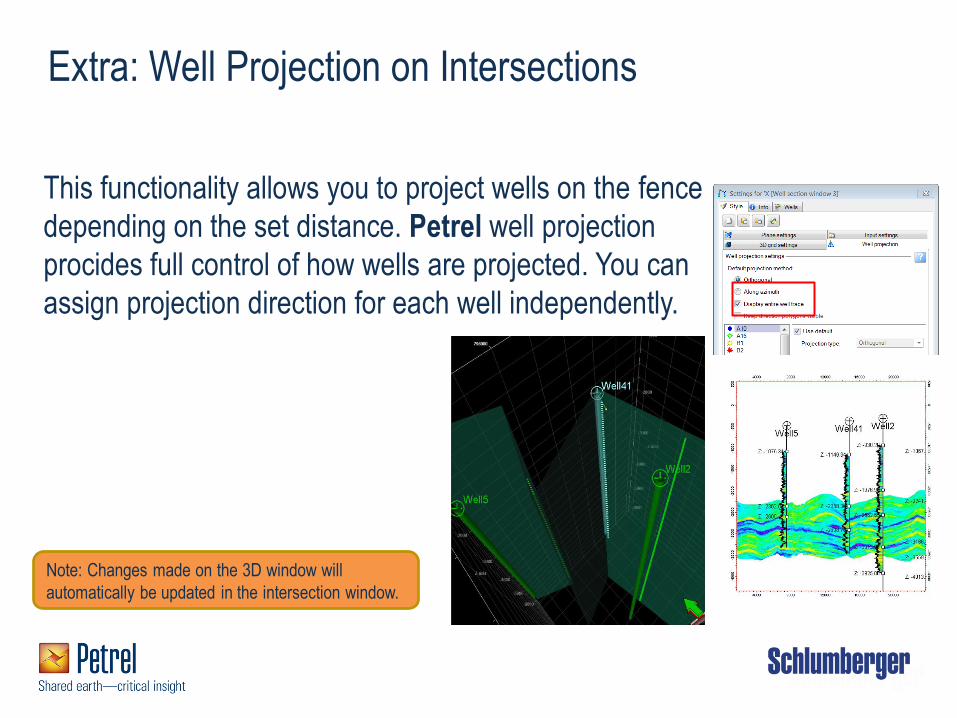
Extra: Well Projection on Intersections
This functionality allows you to project wells on the fence
depending on the set distance. Petrel well projection
procides full control of how wells are projected. You can
assign projection direction for each well independently.
Note: Changes made on the 3D window will
automatically be updated in the intersection window.

EXERCISE