ma (economics) final semester maeco503 indian and …
TRANSCRIPT
1
MA (ECONOMICS)
FINAL SEMESTER
MAECO503
INDIAN AND NORTH EAST ECONOMY

2
BOARD OF STUDIES
1. Prof. S.K Nayak
Head
Dept. of Economics, RGU
Chairman (Ex-officio)
2.
Prof. A. Mitra
Dept. of Economics, RGU
Member
3.
Prof. (Ms.) V. Upadhyay
Dept. of Economics, RGU
Member
4.
Prof. N.C Roy
Dept. of Economics, RGU
Member
5.
Prof. M P Bezbaruah
Dept. of Economics,
Guwahati University, Guwahati
Member
6.
Dr. RajuMondal
Dept. of Economics,
Assam University, Silchar, Assam
Member
7.
Dr. LijumNochi
Dept. of Economics, RGU
Member Secretary
Authors: -
Prof S.K. Nayak, Dept. of Economics, RGU (Unit: IX)
Prof A. Mitra, Dept. of Economics, RGU (Unit: VI)
Prof. V. Uphadhayay, Dept. of Economics, RGU (Unit: III & VII)
Dr. A.K. Das, Dept. of Economics, RGU (Unit: II & V)
Dr. D.B. Gurung, Dept. of Economics, RGU (Unit: IV & VIII)
Mr. Babu Jyoti Gosh & Mr. Bhoirab Jyoti Konch, Research Scholar, Dept. of Economics,
RGU (Unit: I)
Ms. Apilang Apum, Asst. Prof. JTGDMC, Roing (Unit: X)

3
SYLLABI-BOOK MAPPING TABLE PAPER NO: MAECO503
Indian and North East Economy
SYLLABI Mapping
in Book
UNIT-I: NATIONAL INCOME, EMPLOYMENT AND PRICE
BEHAVIOUR National Income - Trends in National Income in India - Rates of Growth of
National Income in India - Causes for Slow Growth of National Income in India
- Suggestions to Raise the Level and Growth Rate of National Income in India -
Sectoral Contribution or Distribution of National Income by the Industrial Origin
-Service Led Growth - Labour Market Reform - Labour Policies before the
Reform Era - Labour Policies and the Reform Era - Social Safety Net for
Workers - Inflation: Recent Trends in Prices in India and Its Causes - 16 Recent
Trends in Prices in India - Recent Rise in Inflationary Pressure- Price Stability -
How is Price Stability Measured? - Why is Price Stability Important? - What
are the Factors that Affect Price Stability? - How is Monetary Policy Used to
Achieve Price Stability?
UNIT-II: AGRICULTURE
Growth and Productivity - Economic Reforms and Indian Agriculture -
Agricultural policy - Land Reform
UNIT III: INDUSTRY
Evolution of Indian industries: An overview - Industrial Policy Resolution of
1948 - Industrial Policy Resolution of 1956 - Public Sector in India
UNIT-IV: INFRASTRUCTURE Different Types of Infrastructure - Physical Infrastructure - Financial Infrastructure -
Social Infrastructure - Institutional Infrastructure: Market - Financing
Infrastructure: Problems and Policies - Sources of Infrastructure Finance
UNIT-V: PUBLIC FINANCE AND ECONOMIC REFORMS
Trends in Revenue and Expenditure of Central and State Governments - Public
Debt - Tax Reforms in India - Deficit Financing and Price Behaviour in India -
Economic Reforms - WTO and Indian Economy - Foreign Capital and MNCs
(Multi-national Corporations)
UNIT –VI: STRUCTURE OF NORTH EAST ECONOMY
North East Economy: An overview - Basic Features of North Eat Economy -
Relative Performance of North East Economy - Economic Performance of the
Region -Level and Growth of NSDP are per-capita NSDP - Changing Sectoral
composition of state income and Sectoral Contribution to the Growth of Income
with respect to Arunachal Economy. - Natural Resource Base-Land, Mineral,
Water, food -Status of Human Development in N.E. India
UNIT-VII: AGRICULTURE IN NORTHEAST INDIA
Agricultural Practice in the region: Permanent cultivation, shifting cultivation and
4
its effects, jhum cultivation and the problem of induction of new technology. -
Land Tenure and Problem of Agricultural credit - Land Use Pattern and Cropping
Pattern in Northeast India- Need for land reform with reference to Arunachal
Pradesh - Agricultural Productivity in Northeast India
UNIT – VIII: DEVELOPMENT OF SECONDARY AND TERTIARY
SECTOR IN NORTHEAST INDIA
Present Status of Industries in Northeast Region - Industries in North Eastern
Region - Distribution of Micro, Small, Medium Enterprise in NER - Factors Inhibiting
the growth of Industries in North East - Infrastructure Development: Power,
Transport, Communication - Market and Banking
UNIT- IX: FISCAL ISSUES OF NORTH EASTERN STATES (section - I)
Receipts – Expenditure - Concept of Deficit- Expenditure – Deficits - Outstanding
Debt and Liabilities - 14th Finance Commission’s recommendation in share of
Central Taxes
UNIT-X: FISCAL ISSUES OF NORTH EASTERN STATES (section - II)
Types of Planning - Economic Planning in India - Five Year Plans and North
Eastern States of India - Problems and Prospects of North East Economy in the
background of economic liberalisation of India- Opening of NE economy
5
Contents
UNIT-I: NATIONAL INCOME, EMPLOYMENT AND PRICE BEHAVIOUR
1.0 Introduction
1.1 Objective
1.2 National Income
1.3 Trends in National Income in India
1.4 Rates of Growth of National Income in India
1.5 Causes for Slow Growth of National Income in India
1.5.1 High Growth Rate of Population
1.5.2 Excessive Dependence on Agriculture
1.5.3 Occupational Structure
1.5.4 Low Level of Technology and its Poor Adoption
1.5.5 Poor Industrial Development
1.5.6 Poor Development of Infrastructural Facilities
1.5.7 Poor Rate of Saving and Investment
1.5.8 Socio-Political Conditions
1.6 Suggestions to Raise the Level and Growth Rate of National Income in India
1.7 Sectoral Contribution or Distribution of National Income by the Industrial
Origin
1.8 Service Led Growth
1.9 Labour Market Reform
1.10 Labour Policies before the Reform Era
1.11 Labour Policies and the Reform Era
1.12 Criticism
1.13 Social Safety Net for Workers
1.14 Inflation: Recent Trends in Prices in India and Its Causes
1.15 Causes of Inflation
1.15.1 Demand-Pull Effect
1.15.2 Cost-Push Effect
1.16 Recent Trends in Prices in India
1.17 Recent Rise in Inflationary Pressure
1.18 Price Stability
1.19 How is Price Stability Measured?
1.20 Why is Price Stability Important?
1.21 What are the Factors that Affect Price Stability?
1.22 How is Monetary Policy Used to Achieve Price Stability?
1.23 Question
1.24 Key Words
1.25 Suggested Readings

6
UNIT-II: AGRICULTURE
2.0 Introduction
2.1 Objective
2.2 Growth and Productivity
2.3 Economic Reforms and Indian Agriculture
2.4. Agricultural policy
2.5 Land Reform
2.6 Key Words
2.7 Questions
2.8 Suggested Readings
UNIT III: INDUSTRY
3.0 Introduction
3.1 Objectives
3.2 Evolution of Indian industries: An overview
3.2.1 Indian Industry: An overview of the Current Scenario
3.3 Industrial Policy Resolution of 1948
3.4 Industrial Policy Resolution of 1956
3.5 Public Sector in India
3.5.1 Growth of public Sector in India
3.5.2 Role of Public Sector in India
3.5.3 Economic reforms and Public Sector
3.5.4 Government’s Policy towards Public Enterprises
3.6 Questions
3.7 Key words
3.8 Suggested Reading
UNIT-IV: INFRASTRUCTURE
4.0 Introduction
4.1 Objectives
4.2 Different Types of Infrastructure
4.3 Physical Infrastructure
4.3.1 Power
4.3.2 Transport
4.4 Financial Infrastructure
4.5 Social Infrastructure
4.6 Institutional Infrastructure: Market
4.7 Financing Infrastructure: Problems and Policies
4.8 Sources of Infrastructure Finance
4.9 Suggested Readings
UNIT-V: PUBLIC FINANCE AND ECONOMIC REFORMS
5.0 Introduction
5.1 Objectives
5.2 Trends in Revenue and Expenditure of Central and State Governments

7
5.3 Public Debt
5.4 Tax Reforms in India
5.5 Deficit Financing and Price Behaviour in India
5.6 Economic Reforms:
5.6.1 Evaluation of Economic Reforms:
5.7 WTO and Indian Economy
5.8 Foreign Capital and MNCs (Multi-national Corporations):
5.9 Questions
5.10 Key Words
5.11 Suggested Readings
UNIT –VI: STRUCTURE OF NORTH EAST ECONOMY
6.0 Introduction
6.1 Unit objectives
6.2 North East Economy: An overview
6.3 Basic Features of North Eat Economy
6.4 Relative Performance of North East Economy
6.5 Economic Performance of the Region
6.6 Level and Growth of NSDP are per-capita NSDP
6.7 Changing Sectoral composition of state income and Sectoral Contribution to
the Growth of Income with respect to Arunachal Economy.
6.8 Natural Resource Base-Land, Mineral, Water, food
6.9 Status of Human Development in N.E. India
6.10 Summary
6.11 Key Words
6.12 Check your progress
6.13 Question and Exercise
6.14 Further Readings
UNIT-VII: AGRICULTURE IN NORTHEAST INDIA
7.0 Introduction
7.1 Objectives
7.2 Agricultural Practice in the region: Permanent cultivation, shifting cultivation
and its effects, jhum cultivation and the problem of induction of new
technology.
7.3 Land Tenure and Problem of Agricultural credit
7.4 Land Use Pattern and Cropping Pattern in Northeast India
7.4.1 Land Use Pattern in Northeast India
7.4.2 Cropping Pattern in Northeast India
7.5 Need for land reform with reference to Arunachal Pradesh
7.6 Agricultural Productivity in Northeast India
7.6.1 Causes of Agricultural Low Productivity in Northeast India.
7.7 Further Readings

8
UNIT – VIII: DEVELOPMENT OF SECONDARY AND TERTIARY SECTOR IN
NORTHEAST INDIA
8.0 Introduction
8.1 Objectives
8.2 Present Status of Industries in Northeast Region
8.3 Industries in North Eastern Region
8.3.1 Agro-based Industries
8.3.2 Forest-based Industries
8.3.3 Textile-based Industries
8.3.4 Mineral-based Industries
8.3.5 Other Industries
8.4 Distribution of Micro, Small, Medium Enterprise in NER
8.5. Factors Inhibiting the growth of Industries in North East
8.6 Infrastructure Development: Power, Transport, Communication
8.7 Market and Banking
8.7.1 North Eastern Development Finance Corporation Ltd (NEDFi)
8.7.2 Small Industries Development Bank of India (SIDBI)
8.7.3 Promotional & Developmental Activities
8.7.4 Industrial Development Bank of India (IDBI)
8.8 Further Readings
UNIT- IX: FISCAL ISSUES OF NORTH EASTERN STATES (section - I)
9.0 Introduction
9.1 Objectives
9.2 Receipts
9.3 Expenditure
9.4 Concept of Deficit
9.5 Expenditure
9.6 Deficits
9.7 Outstanding Debt and Liabilities
9.8 14th Finance Commission’s recommendation in share of Central Taxes
9.9 Let us sum up
9.10 Key terms
9.11 Long type question.
9.12 Short type questions:
9.13 Suggested Readings
UNIT-X: FISCAL ISSUES OF NORTH EASTERN STATES (section - II)
10.0 Introduction
10.1 Objectives
10.2 Types of Planning
9
10.3 Economic Planning in India
10.3.1 Objectives of Economic Planning in India
10.3.2 Evaluation of the Five Year Plans
10.3.3 NITI (National Institution for Transforming India) AAYOG
10.3.4 Regional Disparities in Growth rates
10.4 Five Year Plans and North Eastern States of India
10.5 Problems and Prospects of North East Economy in the background of
economic liberalisation of India- Opening of NE economy
10.6 Key Words
10.7 Check Your Progress
10.8 Long Type Questions
10.9 Suggested Reading
10
INTRODUCTION OF THE BOOK
India is developing economy. The economic stagnation and vicious circle of poverty
was the characteristic of the India economy prior to liberalization. Rapid economic activities
and a higher level of income altogether achieved in the last few decades under the impacts of
economic planning in India. An attempt was made in this book to describe the India economy
in general and North-East Economy in particular.
The book is divided into ten units and each unit has explained the vital characteristic
of India economy.
In unit one, the learners will acquaint themselves with the trenched of national income
in Indian Economy. They will also learn the extent of employment and unemployment, the
changing structure of the Indian Economy, including various pertinent issues of Indian
Economy.
Agriculture plays a crucial role in the economy of India. It provides livelihoods to a
large section of the population; more than half of the populations of the country are engaged
in agriculture sector directly or indirectly. The second unit discusses agricultural
performance: Growth and productivity, economic reforms and their impact on agriculture,
agricultural policy and institutional reforms.
The evolution of the Indian Industry since independence, Industrial Policy of 1948
and 1956, the role and growth of Public Sector, the impact of Economic Reforms on the
Industrial Sector and the emergence of the disinvestment Policy is elaborately discussed in
unit three of this book.
The availability of physical infrastructure defines country wellbeing. Thus, unit four
discussed the types, problems and the policies of infrastructure finance in India.
The students are expected to acquaint themselves about the various facets of public
finance. Thus, the fifth unit of this book comprehensively discusses the trends in revenue and
expenditure of central and state governments, public debt, characteristics of tax reforms,
deficit financing and price behavior, foreign capital and MNCs in India.
In the unit sixth, we have discussed the North-East economy. The region constitutes
around 7.9 percent of the total area of the country but it contains only 3.8 percent of the
population of the country as per 2011 census. Topographically the region is a mixture of hills
and plains. Thus, the unit sixth deals with the North-East economy.
Agriculture in India is considered to be the backbone and also regarded as the largest
sector of the country economic activity. Obviously, in the case of North-East India also the

11
agriculture is the backbone of the state economy in the absence of industry. The unit seventh
of this book explained the agriculture situation in Northeast India, the extent of Jhum
Cultivation and its effects, land tenure, land use pattern and cropping pattern in North-East
India.
Further, the development of the secondary and tertiary sector in Northeast India is
been discussed in unit eighth and Fiscal issues of North Eastern states in unit ninth and tenth.
By bringing out this book, we are quite confident that the contents in this book will
meet the needs of a wide range of readers.

12
UNIT-I
NATIONAL INCOME, EMPLOYMENT AND PRICE BEHAVIOUR
Structure
1.0 Introduction
1.1 Objective
1.2 National Income
1.3 Trends in National Income in India
1.4 Rates of Growth of National Income in India
1.5 Causes for Slow Growth of National Income in India
1.5.1 High Growth Rate of Population
1.5.2 Excessive Dependence on Agriculture
1.5.3 Occupational Structure
1.5.4 Low Level of Technology and its Poor Adoption
1.5.5 Poor Industrial Development
1.5.6 Poor Development of Infrastructural Facilities
1.5.7 Poor Rate of Saving and Investment
1.5.8 Socio-Political Conditions
1.6 Suggestions to Raise the Level and Growth Rate of National Income in India
1.7 Sectoral Contribution or Distribution of National Income by the Industrial
Origin
1.8 Service Led Growth
1.9 Labour Market Reform
1.10 Labour Policies before the Reform Era:
1.11 Labour Policies and the Reform Era
1.12 Criticism
1.13 Social Safety Net for Workers
1.14 Inflation: Recent Trends in Prices in India and Its Causes
1.15 Causes of Inflation
1.15.1 Demand-Pull Effect
1.15.2 Cost-Push Effect
1.16 Recent Trends in Prices in India
1.17 Recent Rise in Inflationary Pressure
13
1.18 Price Stability
1.19 How is Price Stability Measured?
1.20 Why is Price Stability Important?
1.21 What are the Factors that Affect Price Stability?
1.22 How is Monetary Policy Used to Achieve Price Stability?
1.23 Question
1.24 Key Words
1.25 Suggested Readings
1.0 Introduction
In this unit the learners will acquaint themselves with the trench of national income of
Indian Economy. They will also learn the extent of employment and unemployment, the
changing structure of Indian Economy, including various pertinent issues of Indian Economy.
1.1 Objectives
The learning outcomes are:
National income
Trends in growth and structure, performance of different sectors.
Employment and unemployment: Recent trends and estimates
Changing structure and emerging issues
Labour market reforms
Inflation: recent trends in prices in India and its causes, price stability.
1.2 National Income
National income of India constitutes total amount of income earned by the whole
nation of our country and originated both within and outside its territory during a particular
year. The National Income Committee in its first report wrote, “A national income estimate
measures the volume of commodities and services turned out during a given period, without
duplication”. The estimates of national income depict a clear picture about the standard of

14
living of the community. The national income statistics diagnose the economic ills of the
country and at the same time suggest remedies. The rate of savings and investment in an
economy also depends on the national income of the country. Moreover, the national income
measures the flow of all commodities and services produced in an economy. Thus the
national income is not a stock but a flow. Further, the National Income Committee has rightly
observed, “National income statistics enable an overall view to be taken of the whole
economy and of the relative positions and inter-relations among its various parts”. During the
British period, several estimates of national income were made by Dadabhai Naoroji (1868),
Willium Digby (1899), Findlay Shirras (1911, 1922 and 1934), Shah and Khambatta (1921),
V.K.R.V. Rao (1925-29) and R.C. Desai (1931-40). Among all these pre-independence
estimates of national income in India, the estimates of Naoroji, Findlay Shirras and Shaw and
Khambatta have computed the value of the output raised by the agricultural sector and then
added some portion of the income earned by the non-agricultural sector. But these estimates
were having no scientific basis of its own. After that Dr. V.K.R.V. Rao applied a combination
of census of output and census of income methods. While dividing the whole economy into
two separate categories he included agriculture, pastures, forests, fishing, hunting and mines
in the first category and applied output method to derive the value of output of these sectors.
The other activities like industry, trade, transport, administrative and public services,
professions, liberal arts and domestic services were included in second category and applied
income method to derive the amount of income raised from all these services. He also added
income from house property and other internal incomes along-with the total income earned
from abroad to these two sub-totals mentioned above. Although pre-independence estimates
of national income in India suffered from various difficulties and limitations but it provided
considerable light and insight about the economic conditions of the country prevailing during
those period.
After independence, the Government of India appointed the National Income
Committee in August, 1949 with Prof. P.C. Mahalnobis as its chairman and Prof. D.R. Gadgil
and Dr. V.K.R.V. Rao as its two members so as to compile a national income estimates
rationally on scientific basis. The first report of this committee was prepared in 1951. In its
report, the total national income of the year 1948-49 was estimated at Rs. 8,830 crore and the
per capita income of the year was calculated at Rs. 265 per annum. The committee continued
its estimation works for another three years and the final report was published in 1954. For
the estimation of national income in India the National Income Committee applied a mixture

15
of both ‘Product Method’ and the ‘Income Method’. This Committee divided the entire
economy into 13 sectors. Income from the six sectors, viz., agriculture, animal husbandry,
forestry, Fishery, mining and factory establishments was estimated by the output method. But
the income from the remaining seven sectors consisting of small enterprises, commerce,
transport and communications, banking and insurance, professions, liberal arts, domestic
services, house property, public authorities and rest of the world was estimated by the income
methods.
During the post-independence period, the estimate of national income was primarily
conducted by the National Income Committee. Later on, it was carried over by the Central
Statistical Organisation. The National Income Unit of C.S.O. estimated the major part of
national income from the various sectors like agriculture, forestry, animal husbandry, fishing,
mining and factory establishments with the help of product method. The unit of C.S.O. is also
applying the income method for the estimation of the remaining part of national income
raised from the other sectors.
1.3 Trends in National Income in India
A study, of the trend of the national income in India over the last 60 years, in detail, is
very much essential for attaining a clear understanding about the impact of planning on the
Indian economy. Both the national income and per capita income are first collected at current
prices and then at constant prices for eliminating the effect of any change of price level
during that period.
This trend in national income also reflects on the standard of living of the people of
India. Thus the national income at current prices is influenced by both the increase in
production of goods and services and the rise in prices. In order to make the national income
figures comparable, these figures are deflated at constant prices just for eliminating the effect
of any change in the price level of the country.
16
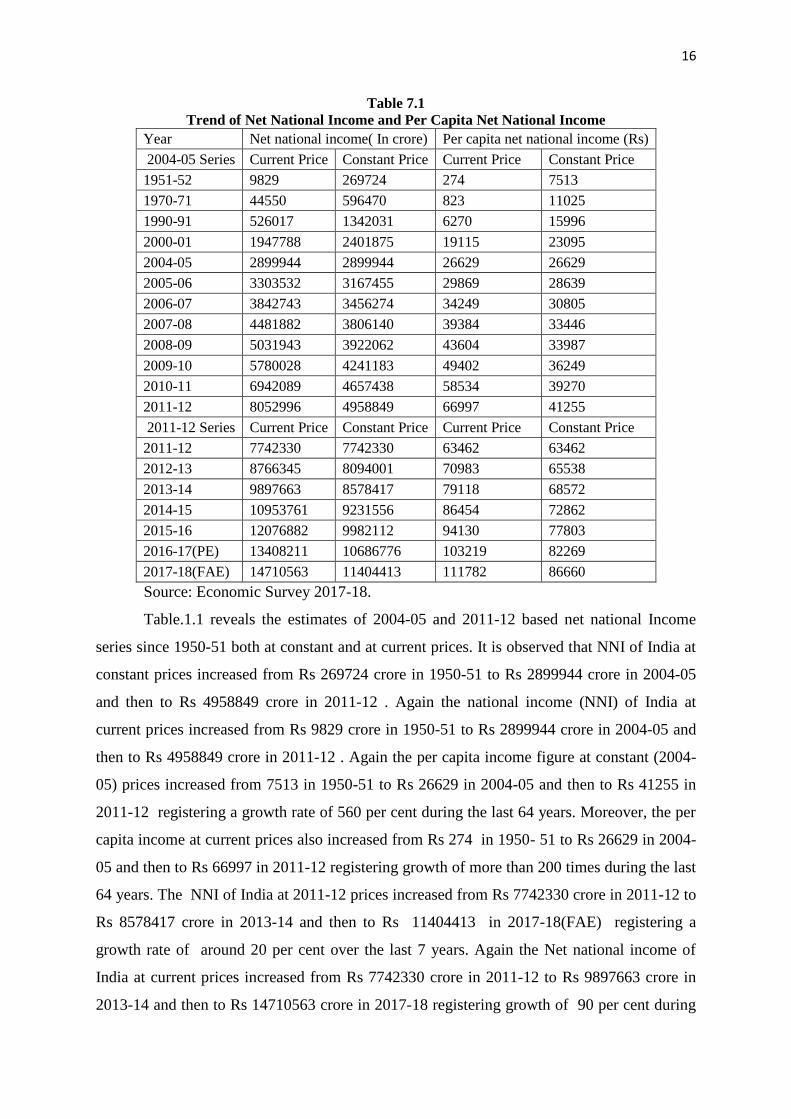
Table 7.1
Trend of Net National Income and Per Capita Net National Income
Year Net national income( In crore) Per capita net national income (Rs)
2004-05 Series Current Price Constant Price Current Price Constant Price
1951-52 9829 269724 274 7513
1970-71 44550 596470 823 11025
1990-91 526017 1342031 6270 15996
2000-01 1947788 2401875 19115 23095
2004-05 2899944 2899944 26629 26629
2005-06 3303532 3167455 29869 28639
2006-07 3842743 3456274 34249 30805
2007-08 4481882 3806140 39384 33446
2008-09 5031943 3922062 43604 33987
2009-10 5780028 4241183 49402 36249
2010-11 6942089 4657438 58534 39270
2011-12 8052996 4958849 66997 41255
2011-12 Series Current Price Constant Price Current Price Constant Price
2011-12 7742330 7742330 63462 63462
2012-13 8766345 8094001 70983 65538
2013-14 9897663 8578417 79118 68572
2014-15 10953761 9231556 86454 72862
2015-16 12076882 9982112 94130 77803
2016-17(PE) 13408211 10686776 103219 82269
2017-18(FAE) 14710563 11404413 111782 86660
Source: Economic Survey 2017-18.
Table.1.1 reveals the estimates of 2004-05 and 2011-12 based net national Income
series since 1950-51 both at constant and at current prices. It is observed that NNI of India at
constant prices increased from Rs 269724 crore in 1950-51 to Rs 2899944 crore in 2004-05
and then to Rs 4958849 crore in 2011-12 . Again the national income (NNI) of India at
current prices increased from Rs 9829 crore in 1950-51 to Rs 2899944 crore in 2004-05 and
then to Rs 4958849 crore in 2011-12 . Again the per capita income figure at constant (2004-
05) prices increased from 7513 in 1950-51 to Rs 26629 in 2004-05 and then to Rs 41255 in
2011-12 registering a growth rate of 560 per cent during the last 64 years. Moreover, the per
capita income at current prices also increased from Rs 274 in 1950- 51 to Rs 26629 in 2004-
05 and then to Rs 66997 in 2011-12 registering growth of more than 200 times during the last
64 years. The NNI of India at 2011-12 prices increased from Rs 7742330 crore in 2011-12 to
Rs 8578417 crore in 2013-14 and then to Rs 11404413 in 2017-18(FAE) registering a
growth rate of around 20 per cent over the last 7 years. Again the Net national income of
India at current prices increased from Rs 7742330 crore in 2011-12 to Rs 9897663 crore in
2013-14 and then to Rs 14710563 crore in 2017-18 registering growth of 90 per cent during

17
the last 7 years. Again, the per capita income figure at constant (2011-12) prices increased
from Rs 63462 in 2011-12 to Rs 79118 in 2013-14 and then to Rs 111782 in 2017-18(AFE)
registering a growth rate of 76.14 per cent during the last 7 years. Moreover, the per capita
income at current prices also increased from Rs 63462 in 2011-12 to Rs 79118 in 2013-14
and then to Rs 111782 in 2017-18 registering a growth of 76.14 per cent during the last 7
years.
1.4 Rates of Growth of National Income in India
In order to study the extent of changes in the national income during different periods
it is quite essential to study the annual average growth rate of national income and per capita
income in India. Table.1.2 reveals a clear picture about the annual average rates of growth of
both national income and per capita income in India during different periods.
Table.1.2
Annual Average growth rate of Net National income Per Capita Net National Income
Period Net national income( ` crore) Per capita net national income (`)
2004-05 Series Curent Price Constant Price Curent Price Constant Price
First Plan (1951-56) 1.9 4.2 0.0 2.4
Second Plan (1956-61) 9.6 4.2 7.4 2.2
Third Plan(1961-66) 9.5 2.6 7.1 0.3
Annual Plan (1966-69) 12.2 3.7 9.8 1.5
Fourth Plan (1969-74) 10.8 3.2 8.4 0.9
Fifth Plan(1974-78) 10.4 4.9 8.0 2.6
Sixth Plan (1980-85) 15.3 5.4 12.8 3.1
Seventh Plan (1985-90) 13.8 5.5 11.4 3.3
Eight Plan (1992-97) 16.6 6.7 14.2 4.6
Ninth Plan (1997-02) 10.6 5.5 8.6 3.5
Tenth Plan (2002-07) 12.8 7.5 11.1 5.9
Eleventh Plan (2007-12) 16.1 7.8 14.6 6.3
Twelfth Plan (2012-17)
2011-12 Series Curent Price Constant Price Curent Price Constant Price
2012-13 13.2 4.5 11.9 3.3
2013-14 12.9 6 11.5 4.6
2014-15 10.7 7.6 9.3 6.3
2015-16 10.3 8.1 8.9 6.8
2016-17(PE) 11 7.1 9.7 5.7
2017-18(FAE) 9.7 6.7 8.3 5.3
Source: Economic Survey 2017-18

18
Table.1.2 reveals that the annual average growth rate of NNP at 2004-05 prices
increased from 4.2 per cent during the First Plan to 4.2 per cent during the Second Plan and
then declined to 2.6 per cent during the Third Plan due to severe drought. This growth during
the Third Plan was just sufficient to neutralise the growth of population indicated by the zero
rate of growth of per capita income during the same period. But during the First Plan and the
Second Plan, the annual growth rates of per capita income were 2.4 per cent and 2.2 per cent
respectively. During the three Ad-hoc Annual Plans, the economy of the country gradually
started to pick up resulting in increase in the growth rates of national income and per capita
income to 3.7 per cent and 1.5 per cent respectively.
During the Fourth Plan, the annual average growth rate, of both national income and
per capita income gradually declined to 3.2 per cent and 0.9 per cent respectively and the
same rates again gradually increased to 4.9 per cent and 2.6 per cent respectively during the
Fifth Plan showing an improvement in its performance.
During the Sixth Plan Period, the national income and per capita income in India
again recorded a growth rate of 5.4 per cent and 3.1 per cent respectively. Again during the
Seventh Plan at 2004-05 prices, the national income and per capita income in India recorded
a growth rate of 5.5 per cent and 3.3 per cent respectively.
Again during the Eighth Plan at 2004-05 prices, the national income and per capita
income in India recorded a growth rate of 6.7 per cent and 4.6 per cent respectively and in
1993-94 the same rate reached the level of 6.1 per cent and 3.7 per cent respectively. The
National income and per capita income in India recorded a growth rate of 5.5 per cent and 3.5
per cent respectively during the Ninth Plan. However, during the Tenth Plan at 2004-2005
prices, the national income and per capita income in India recorded a growth rate of 7.5 per
cent and 5.9 per cent respectively. In 2007-08, the same growth rate increased to 9.6 per cent
and 8.1 per cent respectively. In 2011-12, the same growth rate declined to 6.5 per cent and
5.1 per cent respectively facing the impact of global recession. Thus, during the Eleventh
Plan at 2004-05 prices, the national income and per capita income recorded a growth rate of
7.8 per cent and 6.0 per cent respectively.
19
However, during the Twelfth Plan, the growth rate of national income and per capita
income is likely to face a setback facing the impact of global recession again. Accordingly,
the CSO has estimated a growth rate of 4.5 per cent only for the year 2012-13. However both
Growth rate of national income and per capita national income increased to 7.6 and 6.3
during 2014-15 and it increased further up to 8.1 and 6.2 during 2015-16 respectively.
1.5 Causes for Slow Growth of National Income in India
The growth rate of national income in India remained all along poor particularly in the
first half of our planning process. Between First plans to Fourth Plan, the annual average
growth rate of national income varied between 2.6 per cent to 4.1 per cent. During the Fifth,
Sixth and Eighth Plan, the annual average growth rate of national income also ranges
between 4.9 per cent, 5.4 per cent and 6.7 per cent respectively. It is only during the Ninth
Plan, the annual rate of growth of national income in India touched the level of 5.5 per cent.
Thus we have seen that the rate of growth of national income in India is very poor. Targets of
growth rate of national income remain all long unfulfilled. The following are some of the
important causes of slow growth of national income in India.
1.5.1 High Growth Rate of Population
Rate of growth of population being an important determinant of economic growth, is
also responsible for slow growth of national income in India. Whatever increase in national
income has been taking place, all these are eaten away by the growing population. Thus high
rate of growth of population in India is retarding the growth process and is responsible for
slow growth of national income in India.
1.5.2 Excessive Dependence on Agriculture
Indian economy is characterised by too much dependence on agriculture and thus it is
primary producing. The major share of national income that is usually coming from the
agriculture, which is contributing nearly 34 per cent of the total national income and engaged
about 66 per cent of the total working population of the country. Such excessive dependence
on agriculture prevents quick rise in the level of national income as well as per capita income
as the agriculture is not organised on commercial basis rather it is accepted as way of life.

20
Excessive dependence on agriculture and low land-man ratio, inferior soils, poor ratio of
capital equipment, problems of land holding and tenures, tenancy rights etc. are also
responsible for slow growth of agricultural productivity which, in turn, is also responsible for
slow growth of national income.
1.5.3 Occupational Structure
The peculiar occupational structure is also responsible for slow growth of national
income in the country. At present about 66 per cent of the working force are engaged in
agriculture and allied activities, 3 per cent in industry and mining and the remaining 31 per
cent in the tertiary sector. Moreover, prevalence of high degree of under-employment among
the agricultural labourers and also among the work force engaged in other sectors is also
responsible for this slow growth of national income.
1.5.4 Low Level of Technology and its Poor Adoption
In India low level of technology is also mostly responsible for its slow growth of
national income. Moreover, whatever technology that has been developed in the country, is
not properly utilised in its production process leading to slow growth of national income in
the country.
1.5.5 Poor Industrial Development
Another important reason behind the slow growth of national income in India is the
poor rate of development of its industrial sector. The industrial sector in India has failed to
maintain a consistent and sustainable growth rate during the planned development period and
more particularly in recent years. Moreover, the development of basic industry is also lacking
in the country. All these have resulted a poor growth in the national income of the country.
1.5.6 Poor Development of Infrastructural Facilities
In India, the infrastructural facilities viz., transport, communication, power, irrigation
etc. have not yet been developed satisfactorily as per its requirement throughout the country.
21
This has been creating major hurdles in the path of development of agriculture and industrial
sector of the country leading to poor growth of national income.
1.5.7 Poor Rate of Saving and Investment
The rate of savings and investment in India is also quite poor as compared to that of
developed countries of the world. In recent times, i.e., in 2008-09, the rate of gross domestic
savings was restricted to 32.5 per cent of GDP and that of investment was 33.0 per cent of
GDP in the same year. Such low rate of saving and investment has resulted in a poor growth
of national income in the country.
1.5.8 Socio-Political Conditions
Socio-political conditions prevailing in the country is also not very much conducive
towards rapid development. Peculiar social institutions like caste system, joint family system,
fatalism, illiteracy, unstable political scenario etc. are all responsible for slow growth of
national income in the country. In the mean time, the Government has taken various steps to
attain a higher rate of growth in its national income by introducing various measures of
economic reforms and structural measures. All these measures have started to create some
impact on raising growth of national income of the country.
1.6 Suggestions to Raise the Level and Growth Rate of National Income in India
In order to raise the level and growth rate of National income in India, the following
suggestions are worth mentioning:
1.6.1 Development of Agricultural Sector
As the agricultural sector is contributing the major portion of our national income,
therefore, concrete steps be taken for all round development of the agricultural sector
throughout the country at the earliest. New agricultural strategy be adopted widely
throughout the country to raise its agricultural productivity by adopting better HYV seeds,
fertilizers, pesticides, belter tools and equipment’s and scientific rotation of crops and other

22
scientific methods of cultivation. Immediate steps be taken to enhance the coverage of
irrigation facilities along with reclamation of waste land.
1.6.2 Development of Industrial Sector
In order to diversify the sectoral contribution of national income, industrial sector of
the country should be developed to a considerable extent. Accordingly the small, medium and
large scale industries should be developed simultaneously which will pave the way for
attaining higher level of income and employment.
1.6.3 Raising the Rate of Savings and Investment
For raising the level of national income in the country, the rate of savings and
investment should be raised and maintained to a considerable extent. The capital output ratio
should be brought down within the manageable limit. In this respect, the Ninth Plan
document set its objectives to achieve 7 per cent rate of economic growth, to enhance the rate
of investment from 27 per cent to 28.3 per cent and to reduce the capital output ratio from 4.2
per cent to about 4.0 per cent.
1.6.4 Development of Infrastructure
In order to raise the level of national income to a considerable height, the
infrastructural facilities of the country should be adequately developed. These include
transport and communication network, banking and insurance facilities and better education
and health facilities so as to improve the quality of human capital.
1.6.5 Utilisation of Natural Resources
In order to raise the size and rate of growth of national income in India, the country
should try to utilize the natural resources of the country in a most rational manner to the
maximum extent.

23
1.6. 6 Removal of Inequality
The country should try to remove the inequality in the distribution of income and
wealth by imposing progressive rates of taxation, on the richer sections and also by
redistribution of wealth through welfare and poverty eradication programmes. Moreover,
imposing higher rates of taxation on the richer sections can also collect sufficient revenue for
implementation of the plan.
1.6.7 Containing the Growth of Population
As the higher rate of growth of population has been creating a negative impact on
level of national income and per capita income of the country, positive steps be taken to
contain the growth rate of population by adopting a rational population policy and also by
popularising the family planning programmes among the people in general.
1.6. 8 Balanced Growth
In order to attain a higher rate of economic growth, different sectors of the country
should grow simultaneously so as to attain an inter-sectoral balance in the country.
1.6.9 Higher Growth of Foreign Trade
Foreign trade can also contribute positively towards the growth of national income in
the country. Therefore, positive steps are taken to attain a higher rate of growth in foreign
trade of the country. Higher volume of export can also pave the way for the import of
improved and latest technologies required for the development of country.
1.6.10 Economic Liberalisation
In order to develop the different sectors of the country, the Government should
liberalise the economy to a considerable extent by removing the unnecessary hurdles and
obstacles in the path of development. This would improve the productivity of different
productive sectors. Under the liberalised regime, the entry of right kind of foreign capital and
technical know-how will become possible to a considerable extent leading to modernisation

24
of industrial, infrastructural and other sectors of the country. This economic liberalisation of
the country in the right direction will ultimately lead the economy towards attaining higher
level of national income within reasonable time frame. Therefore, in order to raise the size
and growth rate of national income of the country, a rigorous and sincere attempt be made by
both public and private sector to undertake developmental activities in a most realistic path
and also to liberalize and globalize the economy for the best interest of the nation as a whole.
1.7 Sectoral Contribution or Distribution of National Income by the Industrial
Origin
Sectoral contribution of national income depicts a clear picture about the composition
or distribution of national income by industrial origin. Thus it shows the contribution made
by different sectors towards the national income of the country.
In India, among the different sectors, the primary sector and more particularly
agriculture still plays a dominant role in contributing the major portion of the national income
of the country. Table.1.3 shows the changes in the sectoral contribution towards the national
income of the country since 1950-51.
Table.1.3 shows the following trends:
1. Primary Sector
The contribution of primary sector which is composed of agriculture, forestry, fishery
and mining gradually declined from 56.4 per cent of GDP in 1950-51 to 45.8 per cent in
Table.1.3
25
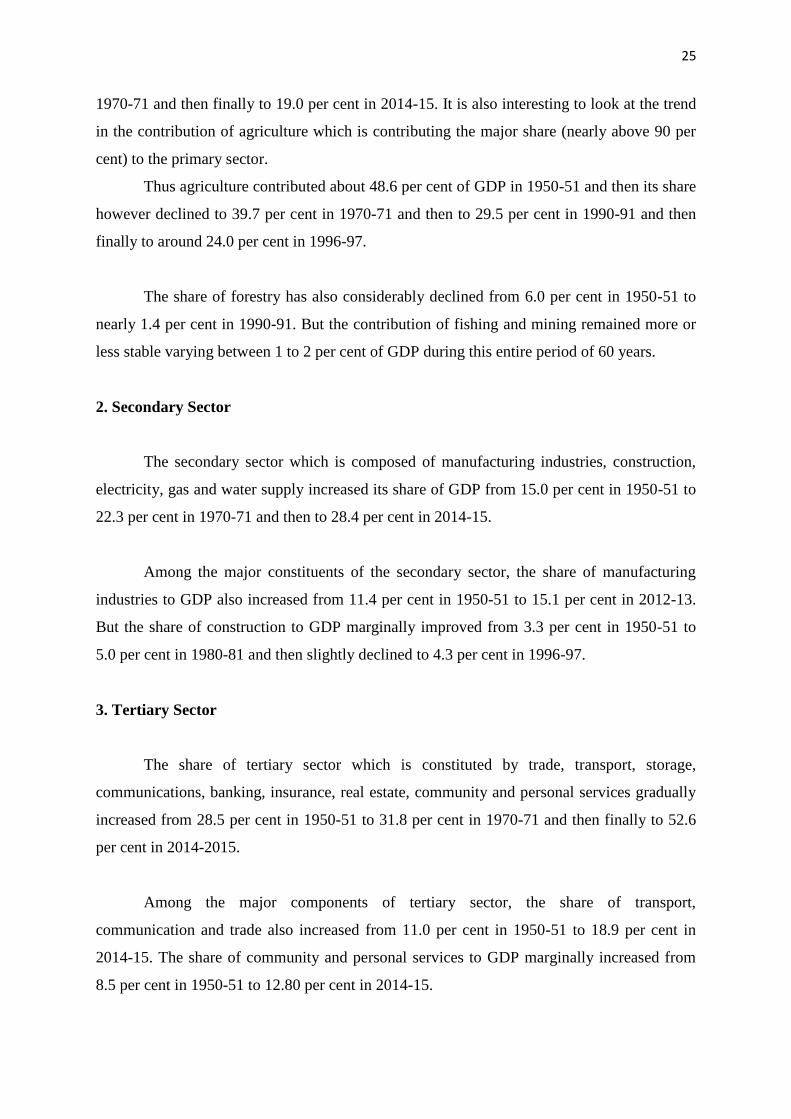
1970-71 and then finally to 19.0 per cent in 2014-15. It is also interesting to look at the trend
in the contribution of agriculture which is contributing the major share (nearly above 90 per
cent) to the primary sector.
Thus agriculture contributed about 48.6 per cent of GDP in 1950-51 and then its share
however declined to 39.7 per cent in 1970-71 and then to 29.5 per cent in 1990-91 and then
finally to around 24.0 per cent in 1996-97.
The share of forestry has also considerably declined from 6.0 per cent in 1950-51 to
nearly 1.4 per cent in 1990-91. But the contribution of fishing and mining remained more or
less stable varying between 1 to 2 per cent of GDP during this entire period of 60 years.
2. Secondary Sector
The secondary sector which is composed of manufacturing industries, construction,
electricity, gas and water supply increased its share of GDP from 15.0 per cent in 1950-51 to
22.3 per cent in 1970-71 and then to 28.4 per cent in 2014-15.
Among the major constituents of the secondary sector, the share of manufacturing
industries to GDP also increased from 11.4 per cent in 1950-51 to 15.1 per cent in 2012-13.
But the share of construction to GDP marginally improved from 3.3 per cent in 1950-51 to
5.0 per cent in 1980-81 and then slightly declined to 4.3 per cent in 1996-97.
3. Tertiary Sector
The share of tertiary sector which is constituted by trade, transport, storage,
communications, banking, insurance, real estate, community and personal services gradually
increased from 28.5 per cent in 1950-51 to 31.8 per cent in 1970-71 and then finally to 52.6
per cent in 2014-2015.
Among the major components of tertiary sector, the share of transport,
communication and trade also increased from 11.0 per cent in 1950-51 to 18.9 per cent in
2014-15. The share of community and personal services to GDP marginally increased from
8.5 per cent in 1950-51 to 12.80 per cent in 2014-15.

26
Thus due to the developmental strategy followed in economic planning of the country,
structural changes occur in the composition of its national income by industrial origin. With
the rapid expansion of manufacturing’ industries, the share of manufacturing sector recorded
a sharp increase.
But the agriculture could not record a faster rate of growth. But the services sector has
improved its position and became the major contributor to the growth process attaining a
faster and higher rate of growth in the later stage. Thus growth scenario in India is termed as
services-led growth.
1.8 Service Led Growth
The growth scenario in India shows that the services sector has become the most
dominant in the later part of its growth process. The share of services sector in GDP
increased from 28.5 per cent in 1950-51 to 39.6 per cent in 1990-91 and then to 52.6 per cent
in 2014-15 while the share of primary sector declined from 56.4 per cent in 1950-51 to 33.4
per cent in 1990-91 and then to only 19.0 per cent in 2014-15.
During the Ninth Plan, in spite of slowdown in overall growth process, the services
sector grew at a rate of 7.9 per cent per annum as compared to that of 2.5 per cent and per
annum as compared to that of 2.5 per cent and 4.3 per cent attained by agriculture and
industry sector respectively.
Moreover, expansion of services sector accelerated further since 2002-03, propelled
considerably by high rates of growth attained by communications (especially telecom),
business services (especially information technology) and finance. Table 1.4 shows the
excellent performance of services sector since 1991.
Table.1.4
27
Table.1.4 reveals that during the period 1991-97 services sector contributed about half (49.8
per cent) of total growth of GDP. But in the subsequent five years, i.e. during 1996-2002, the
contribution of services sector to GDP growth increased significantly to 68.3 per cent and
continued to grow at 60.4 per cent over the next six years, i.e. during 2001-08.
Again, during 2008-14 periods, the contribution of services sector to GDP growth in India
was as high as 69.8 per cent as shown in the study made by Shankar Acharya. Sri Acharya
also observed that “these shares would “be even higher if the construction sub-sector were
included under services instead of industry”. Thus the above analysis clearly, shows
a ‘services-led’ pattern of economic growth attained by India in the later part of its economic
transformation realising a structural transformation of the economy.
1.9 Labour Market Reform
Labour reforms essentially mean taking steps in increasing production, productivity,
and employment opportunities in the economy in such a manner that the interests of the
workers are not compromised. “Essentially, it means skill development, retraining,
redeployment, updating knowledge base of workers-teachers, promotion of leadership
qualities, etc. Labour reforms also include labour law reforms” (INDIA 2006; p 601, GOl
Publication Division). Labour laws are concerned with the trade union rights of the workers,
industrial relations and job security and policies relating to wages, bonus and other incentive
schemes.
Archaic labour laws are the greatest roadblocks in realization of an industry-friendly
labour market in India. Labour laws continue to keep the workers’ entitlements intact
whereas protective shield of the industry which guarded the domestic industry players from
competition has disappeared after 1991. Globalization and liberalization unleashed in 1991
allowed international players in Indian market thereby fundamentally changing the business
and trade ecosystem. It is essential to have labour laws in sync with emerging trends such as
casualization of labour, third-party employment, etc. At the same time, it is equally important
to ensure that basic rights of the workers are protected and labour standards are implemented
across industries and formal as well as informal sectors. Significant skill shortage across the
country has almost a crippling impact on Indian labour market. More than archaic labour
laws, this factor makes the labour market quite unattractive especially for foreign direct
investment. Even the large domestic players as well as entrepreneurs in micro-small and

28
medium enterprises face the brunt of unavailability of skilled manpower. A study of Planning
Commission (2001) indicated that only 10.1% of the male workers and 6.3% of female
workers possessed specific marketable skills in the rural areas while only 19.6% of male
workers and 11.2% of female workers had requisite skills in urban areas. Further, only 5% of
the Indian labour force in the age bracket 20-24 has vocational skills. Whereas the percentage
in industrial countries is much higher, varying between 60% and 80% (Planning Commission,
2001). In terms of vocational skills, India fares worse than some of the developing countries
such as Mexico where the percentage of youth having vocational training is 28% (Planning
Commission, 2001).
Lack of a holistic labour policy is a major obstacle in the way of developing a liberal
labour market which can contribute towards making a competitive manufacturing and service
industry eco-systems in the country. There has been a good number of study groups, reports,
consultative meetings, etc. However, a holistic national labour policy is elusive. Instead, the
government has been involved in piecemeal reforms in labour laws from time to time. In
addition, there are references of labour issues in National Manufacturing Policy, National
Policy on child Labour, National Policy on Skill Development, National Employment Policy,
National Policy on HIV/AIDS and World of Work, National Policy on Safety, Health and
Environment at Workplace, etc. Last traces of a ‘labour policy’ are found in the draft of 3rd
Five Year Plan document which is quite dated. Such directionless and ad hoc efforts have
done no good to liberalize the labour market in line with global trends.
1.10 Labour Policies before the Reform Era:
Before we move to the labour policy in the pre- reform era of 1990s, we must make
one important observation of the Indian labour market. Indian labour market is characterized
by a sharp dichotomy. Here one finds a small enclave of organized labour. This organized
sector is fairly stringently regulated.
On the other hand, a large number of establishments operate in the organized sector
where labourers cannot organize themselves to pursue their common interests due to various
constraints. Most importantly, this sector is virtually free from any outside control and
regulation with little or no job security.
29
This sector, thus, provides ‘too little to too many’. Further, wages are ‘too high’ in the
organized sector and ‘too low’, even below the subsistence level in the unorganized sector.
This dualistic set up suggests how far the Indian labour market is segmented.
Social security to organized labour force in India is provided through a variety of
legislative measures. These are payment of compensation to workers in cases of industrial
accidents and occupational diseases leading to disablement or death, provident fund, pension
including family pension, health insurance, payment of gratuity, maternity benefit, em-
ployees’ deposit-linked insurance scheme, etc.
A number of steps were taken in India to provide social security as back as 1923. The
trend towards conferring benefits to the workers gained momentum only after independence.
But considering the needs of the country, the present social security arrangements are
inadequate. More than 90 p.c. of workers in India are outside the purview of the prevailing
social security arrangements as workers of small unorganized sector as well as informal
sectors remain outside the purview of these arrangements.
Another aspect about labour policies that influence labour market is labour laws re-
lating to forming trade unions, industrial relations, and job security
As far back as 1926, Trade Union Act was passed. In India, any seven employees
could form a union. During the freedom struggle, Indian trade union contributed handsomely.
Today, the trade union is more widespread and has taken deep roots. It is now better
organized and is now on a permanent footing. But at the same time, one finds same major
defects in the Indian trade union movement.
It is alleged that trade unions in India are interested in the growth of capital thereby
blunting the edge of a trade union which is a product of conflict between labour and capital.
Often employers counter the moves of the workers to hit back the aggressiveness of workers’
unions.
Since workers are not disciplined, leaders resort to strike and work stoppage even on
flimsy grounds. Above all, inter-union rivalry and political rivalries are considered to be the
major impediments to have a sound industrial relation system in India. It is also said that

30
Indian labour laws are highly protective of labour, and labour markets are relatively
inflexible. As usual, these laws are applicable in the organized sector only.
Prevention and settlement of disputes and benign industrial relations are the two
important objectives of India’s industrial relations policy. Industrial disputes are governed by
the Industrial Disputes Act, 1947, that aims at promoting good relations between employers
and workmen, protecting workers against retrenchment and settling disputes through con-
ciliation, arbitration or adjudication.
However, industrial relations climate were far from satisfactory when trade unions
resorted to militancy in the 1960s and early 1970s. Between 1972 and 1981, the average
number of work days lost per year per employee in the manufacturing sector stood at 4.070.
This figure went up to 5.736 between 1982 and 1992—a very high figure compared to other
countries in the contemporary period.
India’s labour laws for the workers in the organized sector give workers permanent
employment, of course, after a probation period ranging from 6 months to 2 years. Job
security in India is so rigid that workers of large private sector employing over 100 workers
cannot be fired without government’s permission.
Above all, in the public sector, one author aptly remarked that ‘workers here have
enjoyed almost complete job security since independence’. Promotions are based on seniority
and thus workers get fixed annual wage increments unrelated to work performance.
This really tells on the efficiency of the workers leading to low productivity in the
manufacturing industry. Even the owners of sick industries are not permitted to downsize the
establishments or to close them down. In view of this, one finds the tendency of Indian firms
to employ casual or contract workers who are not protected by the country’s labour laws.
Thus, the conclusion in the words of Pradeep Agrawal is; The labour market policies
followed in India in the past have led to serious problems due to low labour productivity even
in the context of an economy where the firms were shielded from both international
competition (by the very high import tariffs) and domestic competition (by the licensing
policies).

31
This, in turn, created an inefficient and internationally uncompetitive industrial sector
which eventually led to lower wages (for example, Indian wages in the manufacturing sector
are only seventh the Singaporean wages), fewer jobs, and higher unemployment.
P. Agarwal adds further that these labour policies, if pursued in the neo-liberal
regime, will create variety of problems in the midst of growing domestic and international
competition. It has been also observed that the so- called labour market regulations operating
since 1947 have tended to discourage both the growth of employment and productivity.
Further, it has pushed many activities into the unorganised sector. This is evident
from the fact that annual growth rate of employment in the unorganised sector was much
higher (2.73 p.c.) than the organised sector (1.58 p.c.) during 1981-91.
1.11 Labour Policies and the Reform Era
Since protective labour policies and inflexible labour laws are not in the long term
interests, flexible labour market policies gained legitimacy in the climate of economic
liberalism so as to promote efficiency and productivity of labour and protect them against any
hazards.
The Indian neo-liberal economic reforms introduced in mid-July 1991 paid rather
little attention to employment generation. That is why one finds poor employment growth
during the reform period—an adverse consequence of the reform process.
Before we start our discussion on the labour market policies in the reform era, one
must say that the existing labour laws are commendable in paper but not in implementation.
This is what the second National Commission on Labour set up in October 1999 observed in
its Report presented on June 2002; “It can be said that our labour laws… have been criticized
as being ad hoc, complicated, mutually inconsistent, if not contradictory, lacking in uni-
formity of definitions and riddled with clauses that have become outdated and anachronistic,
in view of the changes that have taken place after they were introduced many years ago.”
The Government of India has in recognized the following rights of workers as
alienable to every worker under any system of labour laws and labour policy.
32
These are:
(i) Right to work of one’s choice
(ii) Right against discrimination
(iii) Prohibition of child labour
(iv) Just and humane conditions of work
(v) Right to social security
(vi) Production of wages including right to guaranteed wages
(vii) Right to redress grievances
(viii) Right to organize and form trade unions
(ix) Right to collective bargaining
(x) Right to participation in management.
Along with these rights, workers need many forms of security, like labour market se-
curity, employment security, job security, income security, work security, etc. These are of
critical importance in the globalised era as these people are exposed to increased risk of
insecurity. Really, a pathetic condition prevails in the unorganized sector. That is why a Na-
tional Commission for Enterprises in the Unorganized Sector headed by Arjun Sengupta was
set up to provide some sort of social security to the unorganised workers. It submitted its
report in August 2007.
Unfortunately, these may of rights of workers are rarely met or enforced. This is one
of the most common and most effective criticisms of labour legislation in India.
1.12 Criticism
(i) Labour Market Reforms are Imperative:
India’s experience of growth during the liberalized regime is rather stunning, but its
overall impacts on employment in the organised sector, per worker productivity are not
altogether rosy. As employment, during the period considered, grew slowly compared to the
GDP growth rate the period has been described very aptly as ‘jobless growth’ or ‘job loss
growth’. Employment decelerated in all sectors in the post-liberalization period.
Another disturbing aspect of the current employment growth is that both the shares of
self-employment and wage labour both casual and regular have increased. One then observes

33
concentration of employment in the unorganized/informal sector. Earlier, this informal sector
was considered as the ’employment of the last resort’.
Such informal as well as non-agricultural employment neither results in higher
productivity nor better wages to the workers. Work conditions have been deteriorating
gradually as employers of this sector prefer to employ workers on a contract basis.
However, the hiring of casual or contract labour is not peculiar in the unorganized
informal sector in India. One can see the growing incidence of casualisations and
contractualisation of the labour force even in the organised sector. Thus, protection or se-
curity of workers is rather a dream workers are at the discretion of the employers.
It is also observed that employment discrimination against women workers has in-
creased substantially in the reform period though empowerment of women is considered an
important avowed objective in India.
In addition to declining employment opportunities in the organised sector, we see that
wages are not increasing in commensuration with the workload that the workers carry now.
In other words, workers are exploited not only in the unorganised sector but also in the
organised sector in spite of the legislation providing social security to these workers.
Unfortunately, most of these legislations are dated and not adequate ‘fit’ in the current
globalised-liberalised economy. In fact, labour market in India is now showing a great deal of
inefficiency and a high cost structure economy.
Rigid institutional structures in the labour market need to be made flexible and
transparent, It is commonly alleged that the employment growth in the organised sector is
largely impeded by ‘the prevalence of excessively rigid labour laws’ (11th Plan Document).
It is found that in India there are 45 laws at the national level and close to 4 times that at the
State levels (since labour falls in the Concurrent List) that monitor the functioning of the
labour markets.
It is, thus, necessary to review the existing laws and regulations so that the (i)
corporate sector can be induced to adopt more labour intensive sectors, and (ii) unorganised

34
sectors which are traditionally labour-intensive sectors are encouraged to facilitate the ex-
pansion of employment.
(ii) Different Aspects of Labour Market Regulations
Against the backdrop of current liberalized Indian economy, we can say that as
changing labour laws is a sensitive issue it requires consensus among all the parties involved.
The three issues involved in the labour market regulations are: (i) the wage setting process,
(ii) the labour market conditions, and (iii) the hiring and firing process.
The issue of labour reforms has been a source of debate since the reforms era begun in
1991 when the State withdrew itself from intervening the labour market. Historically, the
government had a ‘social pact’ with labour reflected in the labour laws of the country.
Employers argue that the rigid labour laws are fetters to their development in the current
competitive environment. Flexibility in the labour market is of urgent necessity.
But in the name of flexibility in labour laws, one must not ignore the interests of
labour so that their jobs are not threatened. Thus, labour market reforms must ensure greater
flexibility to our firms and employers in such a way that labour is adequately protected
against any casualties.
A belated attention was made by the Government on the need for bringing about
changes in the labour laws in 1999 when the Second National Labour Commission was
constituted. The Commission was asked (i) to suggest nationalization of existing labour laws
applicable in the organised sector, and (ii) to suggest ‘umbrella’ legislation for insuring a
minimum level of protection to workers in the unorganized sector.
The two aspects of labour reforms that have come to the surface in recent times are
Chapter V-B of the Industrial Disputes Act and the Contract Labour (Regulation and
Abolition) Act. Under Chapter V-B of the ID Act, all establishments employing more than
100 workers must obtain prior approval for closure, retrenchment and lay-offs from the
appropriate Government authority.
It has been recommended by the Second National Commission on Labour that the
provisions may be applicable to organizations employing over 300 persons. Some argue that

35
the limit be raised to establishments employing more than 1,000 workers. Employers want
the provision relating to ‘prior permission’ needs to be deleted. Another alternative is to pitch
the compensation to be paid to workers in the event of closure, retrenchment or lay-offs be
raised at a higher level.
The objective of the Contract Labour (Regulation and Abolition) Act is to abolish
contractual employment in activities and processes in core production/service activities.
However, contract workers must enjoy prevalent social security provisions and other benefits.
(iii) Unorganized Sector and Umbrella Organization
These are all about formal or regular employment. But umbrella legislation is indeed
of great importance so that the unorganized sector—where the majority of workers are
engaged—is protected. It is necessary to take steps to improve quality of employment in the
unorganized sector.
Any significant improvement in their incomes and the quality of employment is
feasible if the ‘institutional environment in the labour market makes it feasible for the formal
sector to reach out to the workers of the unorganized sectors on a decentralized basis. This is
also possible if provident fund, ESI and a variety of welfare funds are extended to the
unorganized sectors. All these would give the workers a better deal in terms of wages, and
security of all kinds.
Unfortunately, the quality of employment is far from satisfactory and the NSSO 61st
Round (2004-05) shows, as usual, that as most of the workers do not have any (written) job
contracts they are not eligible for leave and social security benefits, if any. Thus, what is
needed is ‘the creation of a formal relationship between the worker and the hiring es-
tablishment’.
Another Important Issue
Labour laws and labour market regulations will surely erode the powers of the
workers’ association. This is undesirable on any ground and the workers’ rights to form
36
associations need to be protected at any cost. Labour market regulations must be designed in
a manner that prevents employers from being vindictive.
1.13 Social Safety Net for Workers
It has been said that the labour market is anti- labour. ID Act, 1947 stipulates that
workers cannot be retrenched without prior permission of the Government. This, of course,
safeguards the interests of the workers. But employers are of the opinion that, in this
competitive globalised world, an organization needs to be efficient.
Against the backdrop of changing scenario firms should respond in such a manner
that labour forces are kept small as far as possible. But hiring and firing of workers on any
pretext by the employers is hardly defensible. Even if such firing is needed at all, workers
need to be adequately compensated so as to minimize the risks of losing jobs.
a. Rationale for Safety Net:
(i) Safety valve against job loss:
Firstly, globalization and liberalization have resulted in higher economic growth rate
in collision with a lower employment. Loss of jobs consequent upon volatile demand is the
social and distributional consequence of globalization. This is true for all the economies.
Provisioning of social safety net for workers will act as a cushion to the victims so as to
legitimize reforms. This argument is valid for all the economies, including India.
(ii) Cancelling out the adverse impacts of reforms:
Secondly, globalization and its attendant consequences on the Indian economy is
unavoidable. Workers, in the present scenario, are bound to lose jobs. If a social safety net for
workers is created the adverse consequences of economic reforms can be minimized. This
compliments economic reforms and related labour market developments.
(iii) Minimizing the unfavorable impacts of structural shifting of labour force:
Thirdly, one finds the rationale of such social safety net for workers against the
backdrop of structural transformation of an economy. Following the liberalization measures

37
introduced since 1991, the Indian economy has been seeing structural changes where some
sectors of the economy lose importance while other sectors gain in importance.
This kind of structural change, thus, necessitates a shift in work force from one sector
to another sector, i.e., from the contracting sector to the expanding sector. The labour market
should be made more flexible so that the labour force could be shifted from the unorganized
sector to the organised sector and vice versa without any hassles.
In fact, problems get multiplied when an organised labour force is forced to migrate
from its own forte to the unprotected unorganized sectors. Anyway, the process of transition
of workers from one sector/industry to another sector/industry could be managed both by the
provision of financial compensation and through retraining of skills. This is suggestive of the
fact that the statutorily- backed social security to the workforce engaged in the unorganized
sector needs to be provided.
(iv) Mechanisms of Social Safety Net:
To minimize the adverse impacts of closure of a firm, or retrenchment of workers, the
option of social security net needs to be promoted. One such option is the ‘Voluntary
Retirement Scheme’ (VRS). This is the most common method to shed off excess labour-
load. It is also known as ‘Golden Handshake’—a golden route to retrenchment. This scheme,
thus, does not create any pressure to workers to exit as voluntarily retired workers are to be
paid lump-sum tax- free benefits. It has been introduced both in public and private sectors in
India.
The second option was the creation of National Renewal Fund in 1992. Its basic
objectives were (i) to provide funds for compensation to employees, and (ii) to provide funds
for employment generation schemes in order to provide a social safety net for labour arising
out of closure of units or industrial restructuring.
Conclusion
Thus, in the current scenario, greater flexibility in labour laws must be ensured so that
firms can adjust to changes in demand when necessary. The Government admits that the
labour laws—such as Chapter V-B of the ID Act, and Contract Labour (Regulation and
Abolition) Act—lack flexibility. Further, those laws focus on job protection and thus inhibit
employment. These aspects received attention in the Mid-term Appraisal of the Tenth Plan.
However, the 11th Plan Document says that the V-B provisions of the ID Act, 1947 ‘has not
proved to be a major obstacle in downsizing by several manufacturing enterprises during the
past few years with the aid of generous packages for voluntary retirement.’ The labour

38
market is required to be made more flexible in the days to come so that labour force shifts
gradually from the unorganized sector to the organised ones.
However, trade unionists as well as workers of the organised sector are of the opinion
that labour market reform is anti-labour. But as far as labour laws are concerned, workers of
the organised sector, especially in PSEs, enjoy virtually ‘complete’ job security. But
protective labour policies may cause damages in the long run in the midst of rising number of
unemployment.
Further, if employers enjoy more bargaining power, interests of the workers may be at
jeopardy. Indeed, this is what we observe in the rising incidence of contract- based employ-
ment leading to conflicts with the more general requirement that society must ensure ‘decent
work’ for all. With growth rate picking up, a harmonious balance between efficiency and the
quality of employment involving the relationship between management and labour and
welfare aspects needs to be maintained.
In the ultimate analysis, labour laws, significant as they are, are not the true drivers of
growth. Changes in labour laws are only one of the issues that merit attention. Flow-ever, the
Second National Labour Commission Report goes on stating that these labour laws ‘have to
be visualized and effected in a broader perspective of infrastructural facilities, social security,
and Government policies.’
The Commission adds that it is necessary to provide for both protective and
promotional measures, the latter being highly relevant for the workers in the unorganized
sector.
1.14 Inflation: Recent Trends in Prices in India and Its Causes
What Is Inflation?
Inflation is a quantitative measure of the rate at which the average price level of a
basket of selected goods and services in an economy increases over a period of time. It is the
constant rise in the general level of prices where a unit of currency buys less than it did in
prior periods. Often expressed as a percentage, inflation indicates a decrease in
the purchasing power of a nation’s currency.
39
As prices rise, a single unit of currency loses value as it buys fewer goods and
services. This loss of purchasing power impacts the general cost of living for the common
public which ultimately leads to a deceleration in economic growth. The consensus view
among economists is that sustained inflation occurs when a nation's money supply growth
outpaces economic growth.
To combat this, a country's appropriate monetary authority, like the Central Bank,
then takes the necessary measures to keep inflation within permissible limits and keep the
economy running smoothly. Inflation is measured in a variety of ways depending upon the
types of goods and services considered and are the opposite of deflation which indicates a
general decline occurring in prices for goods and services when the inflation rate falls below
0 percent.
Nobel Laureate economist, Milton Friedman, said in his Nobel Laureate lecture that
‘Inflation is always and everywhere a monetary phenomenon’. In other words, in the long
run, no inflation can occur without an accommodating money supply increase.
1.15 Causes of Inflation
Rising prices are the root of inflation, though this can be attributed to different factors.
In the context of causes, inflation is classified into two types: Demand-Pull inflation and
Cost-Push inflation.
1.15.1 Demand-Pull Effect
Demand-pull inflation occurs when the overall demand for goods and services in an
economy increases more rapidly than the economy's production capacity. It creates a
demand-supply gap with higher demand and lower supply, which results in higher prices. For
instance, when the oil producing nations decide to cut down on oil production, the supply
diminishes. It leads to higher demand, which results in price rises and contributes to inflation.
Additionally, an increase in money supply in an economy also leads to inflation. With more
money available to individuals, positive consumer sentiment leads to higher spending. This
increases demand and leads to price rises. Money supply can be increased by the monetary
authorities either by printing and giving away more money to the individuals, or

40
by devaluing (reducing the value of) the currency. In all such cases of demand increase, the
money loses its purchasing power.
1.15.2 Cost-Push Effect
Cost-push inflation is a result of the increase in the prices of production process
inputs. Examples include an increase in labor costs to manufacture a good or offer a service
or increase in the cost of raw material. These developments lead to higher cost for the
finished product or service and contribute to inflation.
1.16 Recent Trends in Prices in India
During the 1950’s, the average decadal rate of inflation was very low at 1.7 percent.
In 1960’s, the average decadal rate of inflation went up to 6.4 percent. It was increased due to
Chinese war in 1952, Pakistan war in 1965 and Famine conditions in 1965-67. The maximum
rate of inflation at 14 percent was recorded in 1966-67.
During the 1970’s the average decadal rate of inflation was 9 percent. Due to undue
hike in oil prices in this decade, once in 1972-73 and again in 1979-81, it led to an overall
increase in prices. During the 1980’s, the decadal average inflation was 8 percent. The
average inflation rate was around 10 percent during the first half of nineties. The inflation
rate was more that 12 percent during 1990-91. The next three years saw a decline in the
inflation rates at around 10 percent, the growth in prices, both at the wholesale level and retail
level, has been around 5 percent per annum during 1996-2001.
The average inflation during 2010 April to December was 9.4 percent which was the
highest recorded average inflation in last ten years. It was due to delayed monsoons,
hardening of international prices for crude oil, minerals and related products, shortfall in
domestic production vis-à-vis domestic demand, led to higher inflation during 2000-10.
There has been a significant variation in inflation rates in terms of Wholesale Price Index
(WPI) and Consumer Price Index (CPI). The Consumer Price Index combined for urban and
rural was 7.65 percent. CPI for urban it was 7.38 percent and CPI for rural it was 8.25 percent
in January 2012.

41
1.17 Recent Rise in Inflationary Pressure
The economy witnessed a gradual transition from a period of high and variable
inflation to more stable and low level of inflation in the last five years. Headline inflation
based on the Consumer Price Index – Combined (CPI-C) has been declining continuously for
the last five years. Headline CPI inflation declined to 3.4 per cent in 2018-19 from 3.6 per
cent in 2017-18, 4.5 per cent in 2016-17, 4.9 per cent in 2015-16 and 5.9 per cent in 2014-15.
It stood at 2.9 per cent in April 2019 as compared to 4.6 per cent in April 2018. A
comparative picture of inflation based on the major price indices is given in Table1.5.
Table.1.5
General inflation based on different price indices (in per cent) 2012-13 2013-14 2014-15 2015-16 2016-17 2017-18 2018-19
WPI 6.9 5.2 1.2 -3.7 1.7 3.0 4.3(P)
CPI(combined) 9.9 9.4 5.9 4.9 4.5 3.6 3.4
CPI(IW) 10.4 9.7 6.3 5.6 4.1 3.1 5.4
CPI(AL) 10.0 11.6 6.6 4.4 4.2 2.2 2.1
CPI(RL) 10.2 11.5 6.9 4.6 4.2 2.3 2.2 Source: Various years of Economic Survey report, 2016-17, 2017-18 and 2018-19
Note: CPI-C inflation for 2012-13 and 2013-14 is based on old series 2010=100; (P) - Provisional; C
stands for Combined, IW stands for Industrial Workers, AL stands for Agricultural Laborers and RL
stands for Rural Laborers.
The average CPI-C headline inflation declined to 3.4 per cent in 2018-19, which is the
lowest average since the new series of CPI-C began. Headline CPI-C inflation has remained
below 4.0 per cent for two consecutive years. The decline in the inflation in the FY 2018-19
was mainly due to low food inflation which ranged between -2.6 to 3.1 per cent. The
moderate inflation rate of less than 4 per cent was maintained for straight 8 months during the
FY 2018-19. The CPI-C inflation for the month of April 2019 stood at 2.9 per cent same as in
March 2019 as compared to 4.6 per cent in April 2018.
Continuously decline in inflation is observed for various price indices. Headline CPI
(combined) inflation declined sharply to 4.5 per cent in 2016-17 from 4.9 per cent in 2015-16
and 5.9 per cent in 2014-15. Inflation based on CPI-Industrial workers (IW) declined to 3.1
percent in 2017-18 from 4.1 percent in 2016- 17 from 5.6 percent in the previous year. It
reached a low level of 1.1 percent in May 2017. As per Wholesale Price Index (WPI) with
base 2011-12, inflation increased to 1.7 percent in 2016-17 from -3.7 per cent in 2015-16 on
the back of hardening of global commodity prices.

42
Inflation both in terms of Consumer Price Index – Combined (CPI-C) and Wholesale
Price Index (WPI) has decreased in recent years with WPI registering negative growth in
2015-16. The salient aspects include secular decline in headline inflation, convergence of CPI
and WPI, decline in inflation across commodity groups, notable being food, narrowing of gap
between rural and urban inflation and decline in inflation across States.
Table.1.6 Inflation in selected groups of CPI-Base 2012 (in per cent)
Description Weights 2015-16 2016-17 2017-18 2018-19 Apr-19 (P)
All Groups 100 4.9 4.5 3.6 3.4 2.9
CFPI* 39.1 4.9 4.2 1.8 0.1 1.1
Food & beverages 45.9 5.1 4.4 2.2 0.7 1.4
Cereals & products 9.7 1.8 4.2 3.5 2.1 1.2
Meat & fish 3.6 6.3 5.6 3.2 4.0 7.5
Egg 0.4 2.3 6.7 3.6 2.3 1.9
Milk & products 6.6 5.2 4.1 4.1 1.8 0.4
Oils & fats 3.6 4.3 4.0 1.6 2.1 0.7
Fruits 2.9 1.5 4.8 4.6 2.3 -4.9
Vegetables 6.0 1.4 -2.2 5.8 -5.2 2.9
Pulses & products 2.4 31.9 9.3 -21.0 -8.3 -0.9
Sugar & confectionery 1.4 -7.0 19.6 6.1 -7.0 -4.0
Fuel & Light 6.8 5.3 3.3 6.2 5.7 2.6
CPI excl. food and fuel group (Core) 47.3 4.6 4.8 4.6 5.8 4.5
Source: Economic survey, 2018-19, P: Provisional * Consumer Food Price Index
It was observed that the decline in inflation for all commodity groups, the most
significant being decline in food. Food inflation based on consumer food price index (CFPI)
declined to 4.2 per cent in 2016-17 from 4.9 per cent in 2015-16 and 6.4 per cent in 2014-15.
High inflation in pulses, vegetables and sugar although put some pressure on CFPI in the
beginning of 2016-17, favorable Monsoon leading to increase in production of cereals and
pulses has led to a decline in CPI food inflation in the second half. In order to reduce the
volatility in prices of pulses, the Government has built-up buffer stocks of about 19 lakh
tonnes through domestic procurement and imports. Vegetable prices, which generally flare up
during lean summer seasons, have declined sharply in the past few months, as supply picked
up. CPI inflation in vegetables as a result remained negative since September 2016. Sugar
inflation remained persistently high during 2016-17 in the backdrop of lower production and
hardening of prices in the international market. Sugar prices at both wholesale and retail level
have moderated in the last few months. The break-up of food inflation based on CPI and WPI
is at Table.1.6 and 1.7 respectively.
Food Inflation in the country has been extremely benign. Even globally, food inflation
has been moderate. Food inflation based on Consumer Food Price Index (CFPI) declined to

43
1.8 per cent in 2017-18 from 4.2 per cent in 2016-17, 4.9 per cent in 2015- 16 and 6.4 per
cent in 2014-15. Average food inflation for the financial year 2018- 19 declined to a low of
0.1 per cent. Food inflation stood at 1.1 per cent in April 2019 compared to 0.3 per cent in
March 2019 and 2.8 per cent in April 2018. The food deflation in the second half of FY 2018-
19 is mainly due to deflation in vegetables, fruits, pulses and products, sugar & confectionery
and eggs, which together account for 13.1 per cent weight in overall CPI-C. Vegetables,
which account for 6.0 per cent weightage in overall CPI-C, recorded deflation of 5.2 per cent
during 2018-19. Pulses and products, which account for 2.4 per cent weightage, too recorded
deflation during 2018-19 at 8.3 per cent. Volatility in prices of pulses has been low. Amongst
pulses, many have seen the least price fluctuation.
Table.1.7
Inflation in selected groups of WPI- Base 2011-12 (in per cent) All Commodities
Weight 2015-16
2016-17
2017-18 2018-19
Apr-19 (P)
100 -3.7 1.7 3.0 4.3 3.1
Food Index 24.4 1.2 5.8 1.9 0.6 4.9
Food articles 15.3 2.6 4.0 2.1 0.4 7.4
Cereals 2.8 1.1 8.7 0.3 5.5 8.4
Pulses 0.6 34.8 17.6 -27.1 -9.4 14.3
Vegetables 1.9 -8.6 -5.3 18.8 -8.2 40.6
Fruits 1.6 0.1 6.0 5.0 -1.7 -6.9
Milk 4.4 3.1 2.9 4.0 2.4 1.5
Egg, meat & fish 2.4 1.5 0.8 2.0 1.7 6.9
Food products 9.1 -1.5 9.5 1.6 1.0 0.6
Edible oils 2.6 -3.2 8.4 2.2 7.5 -5.0
Sugar 1.1 -9.8 28.8 3.4 -10.7 5.1
Fuel & power 13.2 -19.7 -0.2 8.1 11.6 3.8
Non-Food manufactured products (Core) 55.1 -1.8 -0.1 3.0 4.2 1.9
Source: Economic Survey, 2018-19, P: Provisional
CPI-C based core inflation, which equals CPI excluding the food and fuel group, has
remained above 4 per cent since the start of new series of CPI-C. Core inflation based on
CPI-C increased to 5.8 per cent in 2018- 19 from 4.6 per cent in 2017-18. However, it has
declined from 5.7 per cent in November 2018 to 4.5 per cent in April 2019.
Food inflation based on Wholesale Price Index too declined over the last two financial
years. It was over 0.6 per cent in 2018-19. The decline in WPI food inflation during 2018-19
is mainly due to deflation in pulses, vegetables, fruits and sugar, which together account for
5.2 per cent weight in the overall WPI basket. WPI food inflation was at 4.9 per cent in April
2019 as compared to 3.9 per cent in March, 2019 and 0.8 per cent in April 2018.

44
Core Inflation corresponds to the component of inflation that is likely to continue for
a long period. Thus, core inflation captures the underlying trend of inflation and is, therefore,
more stable. Unlike the non-core component of inflation, core inflation is not affected by
temporary shocks. In India, core inflation is generally measured by excluding highly volatile
components from the headline inflation. By their very nature, food and fuel have been highly
volatile. Therefore, we arrive at core inflation by removing food and fuel components from
the headline inflation. As headline inflation exhibits volatility due to short run shocks,
Central banks in many countries focus on core inflation.
CONCLUSION
The current low level of inflation provides a historic moment in inflation scenario,
instilling confidence in price stability. CPI inflation declined to 3.4 per cent during 2018-19,
with broad based price decline in all major commodity groups like pulses, vegetables and
sugar. It has been below 4 per cent for past eight months. The measure of underlying trends –
core inflation has been trending down in the last few months. Food inflation too has declined
sharply in the last few months on the back of normal monsoon.
1.18 Price Stability
What is price stability?
When there is no inflation or deflation, we can say that there is price stability. On the
other hand, prices neither increase nor decrease but stay stable over time is called also price
stability. For example if, Rs 100 can buy the same amount of goods as it could, say one and
two years ago, then this can be called a situation of absolute price stability. In a market
economy, price changes are a common phenomenon depending on the demand for and supply
of goods and services. The price stability means a relative stability in the general price level
in an economy, but does not imply the stability of individual prices or fixed prices.

45
1.19 How is Price Stability Measured?
As we are more interested in the general increases or decreases in prices, rather than
the increase or decrease in the price of particular good or service, it is necessary to find a
measure that will capture the changes in the general price level. The general price level is
measured by statistical tool called a price index. A price index is simply a weighted average
of prices of a basket of selected goods and services where weights represent the relative
importance of each item as reflected in its relative share in the total value of the basket. There
are different price indices, e.g., Consumer Price Indices (CPIs), Wholesale Price Indices
(WPIs) and Producer Price Indices (PPIs), which measure the overall trends in price
movements at different stages of the process, from production to final consumption.
However, CPIs are the most widely used price indices, as their changes represent the price
movement faced by most people in a society as consumers. Nevertheless, consumption of
WPIs and PPIs is also important, as their movements are leading indicator of future
movements of consumer prices.
The Consumer Price Index
The CPI is a measure that examines the weighted average of prices of a basket of
goods and services which are of primary consumer needs. They include transportation, food
and medical care. CPI is calculated by taking price changes for each item in the
predetermined basket of goods and averaging them based on their relative weight in the
whole basket. The prices in consideration are the retail prices of each item, as available for
purchase by the individual citizens. Changes in the CPI are used to assess price changes
associated with the cost of living, making it one of the most frequently used statistics for
identifying periods of inflation or deflation. The U.S. Bureau of Labour Statistics reports the
CPI on a monthly basis and has calculated it as far back as 1913.
The Wholesale Price Index
The WPI is another popular measure of inflation, which measures and tracks the
changes in the price of goods in the stages before the retail level. While WPI items vary from
one country to other, they mostly include items at the producer or wholesale level. For
example, it includes cotton prices for raw cotton, cotton yarn, cotton gray goods, and cotton

46
clothing. Although many countries and organizations use WPI, many other countries,
including the U.S., use a similar variant called the Producer Price Index (PPI)
The Producer Price Index
The producer price index is a family of indexes that measures the average change in
selling prices received by domestic producers of goods and services over time. The
PPI measures price changes from the perspective of the seller and differs from the CPI
which measures price changes from the perspective of the buyer.
1.20 Why is Price Stability Important?
Maintaining price stability is important as it has a number of benefits. Conversely, when it is
not maintained, the resulting outcome of inflation or deflation has a series of adverse impacts.
The price stability promotes economic growth, as stable prices allow everyone to make better
decision regarding what to produce and how to produce, thus enabling more efficient
allocation of resources. Price stability also avoids economic agents diverting scarce resources
to hedging against inflation. If price are stable, investors and severs would not demand a risk
premium, such as a high interest rate, to compensate them for the risk associated with long
term savings and investments. In fact continuous unstable prices are likely to result in
demand for a high risk premium, discouraging both long term savings and investment.
Inflation has adverse impacts as it distorts price signals, erodes savings, discourages
investment, stimulates capital flow from productive investment to non productive investment
such as precious metals and real estate, inhibits growth and makes economic planning a
nightmare. It also has a disproportionate effect on the most vulnerable groups in society such
as fixed income earners, pensioners and low-income groups as their ability to hedge against
inflation is very limited. The cost of inflation rises with its level and volatility and in its
extreme form, i.e. hyperinflation, can result in public unrest, causing huge economic, social
and political costs. Similarly, deflation also has a number of adverse impacts, such as
discouraging investment retarding economic growth, increasing unemployment and poverty
and in its extreme form, economic depression which could, result in economic, social and
political instability in a country. Achieving and maintaining a low and a stable inflation is a
foundation for many of the economic and social objectives that most people would want to

47
see achieved? Crucially, it is an essential ingredient for sustainable growth in investment,
output and jobs.
1.21 What are the Factors that Affect Price Stability?
In a free market economy, prices signal the prevailing demand and supply conditions
and their changes. In the short run, there are a large number of factors that affect demand and
supply, e.g., weather, social and cultural events, purchasing power of people, consumer
preferences, innovations, productivity etc. During harvesting time price of rice fall due to a
greater supply and prices of vegetables rise in the drought time, reflecting a drop n
production. Similarly, in general, prices of food items tend to rise during festive seasons, such
as New Year and Christmas, due to demand being greater than regular supply. However, such
price changes resulting from seasonal factors and temporary phenomena and prices readjust
themselves within a short period. People tend to demand more goods and services if they
have money at their disposal. Prices will rise when the level of aggregate demand rises with
the expansion of money supply, if the supply of goods and services does not increase at the
same rate as the demand for the same. However, the expansion in supply has its own
limitations such as availability of inputs and technological capabilities. Therefore, a greater
availability of money in the hands of the people, without a commensurate increase in the
availability of goods and services, is the primary demand side factor contributing to inflation.
1.22 How is Monetary Policy Used to Achieve Price Stability?
Monetary policy is the means by which a central bank seeks to achieve its objectives
of price stability, by influencing the cost (interest rate) and availability of money (credit). A
Central Bank has many instruments that it can be use in the conduct of monetary policy. The
most widely used instruments are Statutory Reserve Requirements (SRR) and Open Market
Operations (OMO), under the SRR, the central bank can impose a requirement on
commercial banks to keep part of their deposits with the Central Bank. By changing the SRR
the Central Bank can influence the credit creation ability of commercial banks and hence,
broad money supply and market interest rates. Under open market operations, the Central
Bank influences money supply and market interest rates by changing policy interests
applicable for its transactions with commercial banks and by trading treasury bills and
Central Bank Securities.

48
The process by which the changes in monetary policy instituted by a central bank
affects the general price level and output in the economy is referred to as the monetary policy
transmission mechanism. There are several channels through which monetary policy changes
are transmitted through the economy. These are usually identified as
i) The interest rate channel, whereby the economy is impacted through changes in
interest rates.
ii) The credit channel, where the economy is affected through changes in the
availability of credit.
iii) The exchange rate channel, whereby the economy is affected through changes in
the exchange rate.
iv) The wealth channel, whereby the economy is affected through changes in asset
prices and their impact on wealth.
Of these channels, greater emphasis has been placed on the interest rate and credit
channels, particularly in developing countries. Also it is important to note here that there are
different and long lags, sometimes extending up to two years, in the process of transmitting
the monetary policy impact from the policy instrument (i.e. SRR and OMO) to intermediary
targets (such as broad money supply) and subsequently to the final targets (i.e. prices and
output).
CONCLUSION
Maintaining price stability in an economy has many benefits, while inflation or
deflation has serious adverse economic, social and political impacts. Inflation, in the long
run, is essentially caused by excessive money supply, although in the short run there are other
factors that could also put pressure on prices. Consequently, one of the most important goals
of monetary policy is the containment of inflation, i.e. maintaining price stability. However,
monetary policy alone is not sufficient to maintain price stability and monetary policy cannot
be carried out in isolation from the macroeconomic policies. In particular, fiscal policy
should work in tandem with monetary policy in order to achieve effectively the goal of price
stability.

49
1.23 Question
1. Compare and contrast the growth of national income in India.
2. Discuss the inflationary trend in Indian Economy.
3. Discuss the extent of unemployment in Indian Economy.
1.24 Key Words
Inflation : Increase in price
National Income : The total output of the economy
Price Stability : Controlled Inflation
1.25 Suggested Readings
Bardhan, P., The Political Economy of Development in India, OUP, New Delhi, 1999.
Jalan, B., The Indian Economy—Problems and Prospects, Viking, New Delhi, 1992.
Ahluwalia, I. J. and I. M. D. Little (eds.), India’s Economic Reforms and Development (Essays in
Honour of Manmohan Singh), Oxford University Press, New Delhi, 1999.
Kapila, Uma (Ed.), India’s Economic Reforms, Academic Foundation, New Delhi.
Government of India, Economic Survey (Annual), Ministry of Finance, New Delhi.
Parikh, K.S., India Development Report – 1999-2000 and 2001-02, OUPress, New Delhi.
Byres, T. J. (Ed.), The Indian Economy: Major Debates Since Independence, OUP, N/Delhi, 1998.
Dreze, J. and A. Sen, India: Economic Development and Social Opportunities, OUP
Dutt and Sundaram, (Latest edition) Indian Economy, S.Chand and Company, New Delhi.
Mundle, S., Public Finance: Policy Issues for India, Oxford University Press, New Delhi, 1999.
Mishra, S.K. & V.K. Puri Indian Economy, Himalayan Publishing House, Mumbai (latest edition)
Kapila, Uma (ed) Indian Economy Since Independence, Academic Foundations, Delhi (latest edition)
Parikh, K. (ed) India Development Report ( Various years) Oxford University Press, New Delhi
Government of India Economic SurveysVarious years, New Delhi

50
UNIT-II
AGRICULTURE
Structure
2.0 Introduction
2.1 Objective
2.2 Growth and Productivity
2.3 Economic Reforms and Indian Agriculture
2.4. Agricultural policy
2.5 Land Reform
2.6 Key Words
2.7 Questions
2.8 Suggested Readings
2.1 Introduction
Agriculture plays a great role in the economy of India. It provides livelihood to a large
section of population of the country. More than half of the population of the country engaged
in agriculture sector directly or indirectly. In 2011, the share of agricultural workers in the
total workers of the country was 54.6 percent (Agricultural Statistics at A Glance, 2017,
GOI). It also contributes significantly to the Gross Value Added (GVA) of the country.
However, the share of agriculture in GVA of the country is declining. Figure 1 depicts that
the share of agriculture, forestry and fishing in GVA at current prices has declined from 18.5
per cent in 2011-12 to 17.1 per cent in 2017-18 (PE).
2.0 Objective
The readers are accepted to know and learn about the following;
Agricultural performance: Growth and productivity
Economic reforms and their impact on agriculture
Agricultural policy
Institutional reforms.

51
Figure.2.1
Source: Agricultural Statistics at a Glance, 2017, GOI
The important roles of agriculture in the economy of India can be sum-up as:
Contribution to national income: The contribution of agriculture to the national
income of the country is significant. In 1950-51, more than half of the national
income was from agriculture. However, over the times with the development of
secondary and tertiary sector, the share of agriculture in the national income of India
is declining. The share of agriculture, forestry and fishing in GVA at current prices is
17.1 per cent in 2017-18 (PE).
Source of livelihood: Agriculture sector is still the dominant source of livelihood for
the Indian population. With the increasing population pressure, the number of people
dependent on this sector becomes very large. As per Agricultural Statistics at a
Glance, 2017 of GOI, 54.6 per cent of total workers in India were agricultural workers
in 2011.
Supply of food: A key role of agriculture is that it provides food to the people of the
country. In fact, agricultural product consist a large portion of India’s export.
Agriculture is the major source of food. India, which was largely food deficient at the
time of independence, now becomes almost self-sufficient in production of food
grains.
Contribution to industrial development: Agriculture supply raw materials to
various agro-based industries of the country. For instance, cotton and textile industry,
jute industry, sugar industry etc. are dependent on agriculture.
18.5 18.2 18.6 18.2 17.7 17.9 17.1
0
5
10
15
20
Share of agriculture,forestry & fishing in GVA at current prices (in
%)
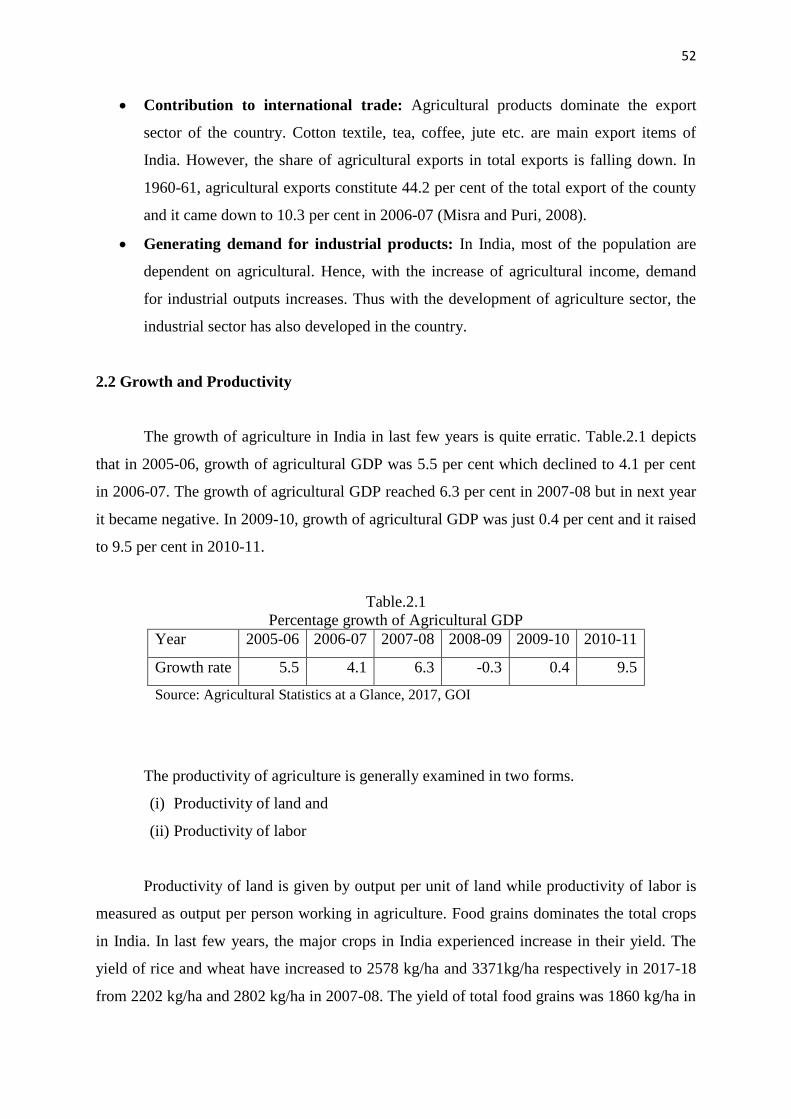
52
Contribution to international trade: Agricultural products dominate the export
sector of the country. Cotton textile, tea, coffee, jute etc. are main export items of
India. However, the share of agricultural exports in total exports is falling down. In
1960-61, agricultural exports constitute 44.2 per cent of the total export of the county
and it came down to 10.3 per cent in 2006-07 (Misra and Puri, 2008).
Generating demand for industrial products: In India, most of the population are
dependent on agricultural. Hence, with the increase of agricultural income, demand
for industrial outputs increases. Thus with the development of agriculture sector, the
industrial sector has also developed in the country.
2.2 Growth and Productivity
The growth of agriculture in India in last few years is quite erratic. Table.2.1 depicts
that in 2005-06, growth of agricultural GDP was 5.5 per cent which declined to 4.1 per cent
in 2006-07. The growth of agricultural GDP reached 6.3 per cent in 2007-08 but in next year
it became negative. In 2009-10, growth of agricultural GDP was just 0.4 per cent and it raised
to 9.5 per cent in 2010-11.
Table.2.1
Percentage growth of Agricultural GDP
Year 2005-06 2006-07 2007-08 2008-09 2009-10 2010-11
Growth rate 5.5 4.1 6.3 -0.3 0.4 9.5
Source: Agricultural Statistics at a Glance, 2017, GOI
The productivity of agriculture is generally examined in two forms.
(i) Productivity of land and
(ii) Productivity of labor
Productivity of land is given by output per unit of land while productivity of labor is
measured as output per person working in agriculture. Food grains dominates the total crops
in India. In last few years, the major crops in India experienced increase in their yield. The
yield of rice and wheat have increased to 2578 kg/ha and 3371kg/ha respectively in 2017-18
from 2202 kg/ha and 2802 kg/ha in 2007-08. The yield of total food grains was 1860 kg/ha in

53
2007-08 and it became 2233 kg/ha in 2017-18. The yield of other major crops like total
oilseeds, sugarcane, tea, coffee, cotton etc. have also increased in 2017-18 as compared to
2007-08.
Table2.2
Yield of major crops in India (in kg/hactare)
Year Rice Wheat Total Cereals
Pulses Total Food grains
Total Oilseeds
Sugarcane Tea Coffee Cotton (Lint)
2017-18 2578 3371 2660 841 2233 1270 79650 2285 765 477
2016-17 2494 3200 2525 786 2,153 1195 69001 2165 761 512
2015-16 2400 3034 2392 656 2056 968 70720 2176 876 415
2014-15 2390 2872 2373 744 2070 1037 69859 2113 847 461
2013-14 2424 3075 2438 764 2101 1153 69839 2121 799 532
2012-13 2461 3117 2449 789 2129 1169 68254 2027 846 486
2011-12 2393 3177 2415 699 2078 1133 71668 1956 852 491
2010-11 2239 2988 2256 691 1930 1193 70091 1726 838 499
2009-10 2125 2839 2075 630 1798 958 70020 1711 815 403
2008-09 2178 2907 2183 659 1909 1006 64553 1679 748 403
2007-08 2202 2802 2151 625 1860 1115 68877 1706 761 467
Source: RBI, accessed from https://dbie.rbi.org.in/DBIE/dbie.rbi?site=statistics
Although the land productivity of agriculture in India is increasing, it is low as
compared to many other countries. Table 3 depicts that the land productivity in India is below
the world average with respect to major crops like rice, wheat, maize and soybean. In
comparison to China too, land productivity on India is lower in case of all the four crops
considered. Countries like US and Brazil realized higher land productivity than India in
respect of rice, maize and soybean.
Table.2.3
Land productivity across countries, 2018 (in tonnes/hactare)
Country Wheat Rice Maize Soybean
India 3.3 2.5 3.0 1.1
Brazil 2.7 4.2 5.5 3.2
China 5.4 4.9 6.1 1.8
U S 3.2 6.0 11.1 3.5
World 3.4 3.1 6.0 2.9 Source: OECD Data, access from https://data.oecd.org/agroutput/crop-production.htm on
16/08/2019

54
Causes of low productivity
There are many factors causing low agricultural productivity in India. Some of the
major factors resulting low agricultural productivity are:
(i) Population pressure: The population pressure on agriculture in India is very
heavy. Still the non-farm sector of the country is not enabled to absorpt the
increasing population pressure sufficiently. Thus, due to excessive population
pressure, the productivity of agriculture sector in India is low.
(ii) Social factors: Social factors like conservative attitude of farmers, illiteracy,
ignorance, superstitions etc. prevent the farmers to adopt new methods of
cultivation in the country. Due to such factors they prefers to stick with the less
productive traditional method of cultivation.
(iii) Land degradation: A large extent of land in India has degraded resulting low
agricultural output. As per government of India, around 43 per cent of land in
India suffers from high degradation resulting in 33-67 per cent yield loss (Misra
and Puri, 2008).
(iv) Uneconomic holdings: The landholdings in India are small and fragmented. Most
of the holdings are small and marginal. With the increase population and
fragmentation due to inheritance, the size of land holdings in the country is
declining day by day. The small and fragmented holding basically prevents the
adoption of farm mechanization due to many reasons. As the results the
production and productivity of land remain low.
(v) Land tenure pattern: The land tenure system in India is quite defective. Even
after implementation of land reform measures, the position of tenants is not good.
A large land owner has still a strong hold on the rural economy and exploits the
tenants.
(vi) Lack of credit: The economic conditions of most of the farmers in India are very
poor. They need to depend on borrowed money for financing their cultivation.
However, there is problem of institution credit sources from which loan are
available without complex procedure. The non-availability of credit limits the
adoption of HYV seeds, use of fertilizer etc. resulting lower productivity of
agriculture.

55
(vii) Traditional method of cultivation: In India the modes of cultivation followed by
farmers are traditional due factors like illiteracy, conservative nature, lack of
credit etc. of farmers. However, with passes of time this problem is declining.
(viii) Lack of irrigation facilities: Most of the India farmers are dependent on weather
for their cultivation due to inadequate irrigation facilities. Due to which, the extent
of adoption production and productivity generating actives such as intensive
cultivation, adoption of HYV seeds etc. are low.
(ix) Lack of marketing facilities: Lack of marketing facilities to sell the output
produced is another important factor resulting low agricultural productivity. The
inadequate marketing facility for agricultural output reduces the incentives of
farmers to produce more.
To raise the productivity of agriculture in India, following measures can be suggested:
Proper implementation of consolidation of land holding measures.
Enhancement of farm mechanization. Emerging rental markets of farm machinery can
play an important role here.
Skilling of farmers
Facilitation of institutional credits as a lager extent and easier way.
Development irrigation facilities.
Provisioning of adequate markets for agricultural output.
Development of different factor markets in agriculture such as land lease market,
rental markets of agricultural capital goods etc.
More emphasis on agricultural research and development.
2.3 Economic Reforms and Indian Agriculture
In India, an era of new economic reforms was started in 1991by P.V. Narsimah Rao
led Union Government. The New Economic Policy (NEP) has been introduced in response to
the suggestions made by World Bank and the International Monetary Fund. The two broad
objectives of the new economic policy were:
(i) To correct macro imbalances which had destabilised the economy during the late 80’s
and early 90’s, such as acute foreign exchange shortage, high rate of inflation,

56
unsustainable fiscal deficit and current account deficit and growing internal and
external debts.
(ii) To accelerate the overall growth of the economy.
The policy consists of two major set of measures for fulfilling the above-mentioned
objectives.
Stabilization of the economy at the macro level and
Structural adjustments in the economy.
According Crabo et. al (Soni, 2004), structural adjustments refer to measures relating
to improvement in the productivity of labour and capital in specific sectors of the economy.
This policy sought out measures of Liberalisation, Privatisation and Globalisation (often
called as LPG) for almost every sectors of Indian economy.
At the time of announcement of the main features of economic reforms, agricultural
sector was seemed to be excluded. It was only in 1995 that the draft farm policy was
announced which aims:
To globalize the Indian agricultural by exporting more agricultural product.
To reduce the burden on land by developing agro-based industries and
To ensure more investment and credit flow to agriculture. By increasing productivity
of agriculture and by ensuring remunerative minimum suppose prices, the policy
aimed to make agriculture as a profitable profession.
The impact of economic reforms on agriculture in India can be discussed as follows:
(i) Structural Adjustments in the Non-agricultural Sectors and Agriculture: The
structural adjustment in non-agriculture due to NEP was expected to benefits
agriculture in several ways. First, there will be reduction in import tariffs on
manufactured goods which will end the discrimination against agriculture. Secondly,
due to patenting of research in the country under GATT, it was expected to encourage
private research in agriculture. Thirdly, potential expansion of industrialization due to
NEP was expected to contribute in development of agriculture sector in various ways.
Fourthly, through infrastructure development, agriculture sector was expected to be
benefited immensely.

57
(ii) Agriculture and Macro Economic Stabilisation Measures:
Reduction in Fiscal Deficit (FD)is an important macro-economic stabilization
measure. The fiscal deficit of India was 7 per cent of GDP in the year 1990-91 which
should be around 3 per cent of GDP in developing country like India. Thus, there was
a need to reduce FD in India. Reduction of FD needs reduction of expenditure and
increase of revenue collection. So far as the reduction of expenditure in agricultural
sector is concerned, it can be brought about mainly by:
a. Reduction in Input Subsidies: Subsidies are paid to the farmers on the purchase
of fertilisers, canal water, electricity, credit etc. Among these, fertilisers and
provision of credit are subsidised by the central government and the rest are paid
by the state governments. Subsidies given to the agricultural inputs have become a
debatable issue after the introduction of economic reforms. At the time of green
revolution, these subsidies were given to the farmers as an incentive for adopting
newly introduced seed-cum-fertiliser technology. Gradually, the amount paid on
subsidies began to rise which was estimated by Rao and Gulati in early 90’s. After
so many discussions and arguments, government of India on May, 1997 has listed
the subsidies granted for fertilisers, irrigation and power as subsidies on non-merit
economic services and suggested that these subsidies should be abolished.
However, in order to ensure that their withdrawal does not lead to any serious
repercussions, these should be withdrawn in a phased manner. Such a step will
reduce the fiscal deficit, improve the efficiency of resource use, spare funds for
public investment in agriculture and will also be in line with the guidelines
implied by the policy of economic reforms which suggests that the production as
well as allocation of resources should be determined solely by the market forces
and in an atmosphere of competition. If their withdrawal is accompanied by non-
price yield increasing steps like further improvement in the agricultural
technology, timely supply of physical inputs, then only the possible adverse effect
of elimination of input subsidies will be softened.
b. Reduction/ Elimination of Food Subsidies: Food Subsidy is the difference
between the total expenditure incurred by the government on procuring and
distributing the food and what the government actually charges from the
beneficiaries of the PDS (Public Distribution System). It has been estimated that
70 per cent of total food subsidies are used up in meeting the cost of storing and
transporting the crops and for administering PDS. So, the ultimate beneficiary gets

58
the rest 30% of subsidies. The total food subsidies paid by the government in
2018-19 was 1.71 lakh crore (Economic Times, June5, 2019) against Rs. 17612
crore in 2001-02. The protagonists of economic reforms have advocated the
abolition of food subsidies so as to contribute the agricultural sector to the
reduction of fiscal deficit.
c. Reduction in public investment: After introduction of economic reform, public
investment in agriculture has been declined. The real public investment (at 1993-
94 prices) was Rs.7371 crore in 1980-81 which declined to Rs.4971 crore in 1995-
96 and in 1999-2000, it further declined to Rs.4753 crore.
(iii)Structural Adjustments in Agricultural Sector: The structural adjustment in
agriculture during the period of economic reform can be discussed as follow.
a. Marketisation of agriculture: It implies that the decision-making process in
agriculture should be governed by the market forces only. The ways of
marketisation of agriculture are-
Purchase of inputs and sale of agricultural crops at market determined prices.
Development of competitive domestic product market.
Facilitation of free land lease market.
Development of competitive markets for domestic products.
No procurement prices, i.e. purchase of foods for buffer stock, meeting other
calamities must be in prevailing market prices.
Marketisation of rural financial sector.
b. Globalisation of agriculture: Globalisation involves a free flow of foreign capital
in to Indian agriculture. However, foreign capital cannot be associated with the
ownership of land or crops cultivation (except foreign firms in tea, coffee, rubber
plantation, etc). So, scope for foreign investment is associated with the off-farm
activities, such as development of infrastructure like irrigation projects, etc.
Besides these, MNCs are allowed to develop agro-processing industries (fruit and
vegetable processing).
c. Privatisation of agriculture: Privatisation, as a part of economic reforms has
been identified as a process of dismantling of the public sector. In other words, in
India, privatisation implies transferring the ownership of production units like
railways, steel plants, coal mines, fertiliser factories, etc. to private individuals or
corporations. From this viewpoint, there is very little scope for privatisation of

59
Indian agriculture as they are already in private hands. In this context, new
economic policy has suggested that privatisation can be associated with the fields
of production of agricultural inputs as well as processing of agricultural produce.
d. Liberalisation of Agriculture: Liberalisation has been identified as a complete
freedom of enterprise, reduction in govt regulations for economic activities to the
minimum and reduction in tariffs and taxes.
In this light, agriculture is already liberalised from many angles-
Sale and purchase of land, except when its purchase makes the land holding
move above the ceilings as imposed by law, is allowed.
There is complete freedom to the farmers to produce anything they like, on
their farms.
Government regulation with regard to the movement of crops within the
country have almost been removed.
2.4. Agricultural policy
The agriculture sector in India suffers from many problems. Low productivity, lack of
irrigation facilities, small and fragmented land holdings, exploitative land tenure system etc.
Hence, to promote the agricultural development and to get self-sufficiency in production of
agricultural output, the governments of India has been under taken various measures during
the post-independence period. The important policy measures introduced for agricultural
developments are discussed below.
a. Technological measures: To meet the growing needs of the population and to
support industrial development, steps were taken to raise agricultural production
substantially through extensive and intensive cultivation. For extensive cultivation
promoted irrigation facilities and converted land unfit for cultivation to fit. For
intensive cultivation, new agricultural strategy was introduced in the form of a
package programme in some selected regions of the country. To extent and sustain the
new agricultural strategy, steps were taken to increase production of HYV seeds,
fertilizers and pesticides within county and imported depending on needs. These
measures results substantial increase of production and productivity of agriculture.
b. Land reforms: The land tenure system at the time of independence of India were
highly exploitative in nature. Zamindari system was more exploitative in nature,

60
under which zamindars took away the surplus output produced by cultivators over the
minimum subsistence. In order to stop the exploitation of the actual tillers and to
confer the ownership on land to them, land reform was introduced by Government of
India in the post-independence period.
The basic objectives of land reform measures in India were:
To remove impediments, arise from agricultural structure inherited from the past,
to raise the production of agriculture.
To eliminate exploitation and social injustice in the agriculture sector, to provide
security to tenants and equality in status and to provide opportunity to rural
population of all sections.
The different land reform measures are:
Abolition of Intermediaries-legislations were adopted for abolition of exploitative
land tenure system in the country namely zamindari system, mahalwari system
and ryotwari system to provide land to tiller
Tenancy reforms- under tenancy reform to protect the tenants, measures were
taken to control rent on land, to provide security to tenants and to accord
ownership right on land.
Reorganization of agriculture- measures also taken to set ceiling on land
ownership, for consolidation of holdings and encouraging cooperative farming.
c. Institutional credit: government of India also initiated measures to expand
institutional credit mainly through cooperatives and commercial banks. After bank
nationalization in 1969, attention on agricultural credit was enhanced. Regional Rural
Banks and NABARD were set-up to expand the agricultural credits in the country.
d. Procurement and support prices: Procurement and support prices was announced to
ensure that the farmers are not penalized for producing more. By fixing fairly high
prices for agricultural outputs, government aims to protect the farmers from losses
when there is surplus production. This provides incentives to produce more to the
farmers.
e. Subsidies on agricultural inputs: To support the farmers, government provides large
scale subsidies on agricultural inputs such as irrigation, fertilizer, power etc. Under
subsidization policy, government facilitates farm inputs to farmers at a price which is
well below the open market price. By encouraging the use of modern inputs, input
subsidization aims to increase agricultural production and productivity.

61
f. Rashtriya Krishi Vikas Yojana (RKVY):In 2007-08, RKVY was launched to
provide incentives to states to increase public investment in agriculture and allied
sectors so that 4 per cent growth of the sector can be achieved. The states were
provided Rs. 22,409 crore under the RKVY during 11th five year plan. This permits
states taking national priorities as sub-schemes. The sub-schemes include – Bringing
Green Revolution to Estern India, Integrated Development of 60000 pulses villages in
rainfed areas, Promotion of Oil Palm, Initiative on Vegetable Clusters, Nutri-cereals,
National Mission for Protein and Supplements, Accelerated Fodder Development
Programme, and Saffron Mission.
g. National Food Security Mission (NFSM): NFSM was also initiated in 2007-08 with
the aims to raise production of rice, wheat and pulses by 10 million, 8 million and 2
million tonnes respectively at the end of 11th plan. The ways set to achieve these
targets were- area expansion, productivity enhancement, restoring soil fertility and
productivity, creation of employment opportunities and enhancement of farm level
economy. Promotion and expansion of use of improved technologies were the basic
strategies of this mission.
h. Macro Management of Agriculture (MMA):MMA is a centrally sponsored
schemes introduced in 2000-01. Ensuring that central assistant is spent for agriculture
through focused and specified interventions is the objective of MMA. At the
beginning, 27 schemes sponsored by central government were there which are related
to co-operative crop production programmes (for rice, wheat, coarse cereals, jute and
sugarcane), watershed development programme, horticulture, fertilizer, mechanization
and seed production programmes. MMA was revised in 2008-09 to improve its
efficiency in supplementing/complementing efforts of states in improving agricultural
production and productivity. To avoid overlapping and duplication of efforts, role of
the scheme has been redefined. Further,
i. New agricultural policy: The National Agriculture Policy, announced on July 28,
2000 by GOI seeks to ‘actualise the vast untapped growth potential of Indian
agriculture, strengthen rural infrastructure to support faster agricultural
development, promote value addition, accelerate the growth of agro business, create
employment in rural areas, secure a fair standard of living for the farmers and
agricultural workers and their families, discourage migration to urban areas and face
the challenges arising out of economic liberalization and globalization’ (Misra and
Puri, 2008). This policy over the next two decades aims:
62
A growth rate in agriculture of more than 4 per cent per annum.
Growth by efficiently using resources and conservation of soil, water and bio-
diversity.
Growth with equity.
Demand driven growth that caters to domestic markets and maximizes export
benefits of agricultural products.
Technologically, environmentally and economically sustainable growth.
The important features of NAP are:
Privatization of agriculture and price protection of farmers in the post quantities
restrictions regime. It focuses on efficient use of resources and technology
facilitation of credit to farmers sufficiently and protecting them from fluctuation
in prices.
Promotion of private sector participation to enhance technology transfer, capital
inflow and development of markets for agricultural output through contract
farming and land leasing arrangement.
Encouragement of private investment in agriculture.
Formulation of commodity-wise strategies in order to protect farmers from price
fluctuation in the international market.
Enlargement of future markets to minimize fluctuation in commodity price and to
reduce risks.
Meeting the requirement of milk, meat, egg and livestock products and to increase
the role of draught animals as energy source for farming operation, ‘National
Livestock Breeding Strategy’ was envisaged.
High priority to evolvement of location-specific and economically viable varieties
of crops, livestock species and aquaculture.
Reduction of restrictions on movement of agricultural commodities within the
country.
Review of excise duty on inputs use in agricultural production and post-harvest
storage and processing.
Adoption of measures to keep agriculturists outside the regulatory and tax
collection system.
Priority on rural electrification for agricultural development.
63
Encouragement of use of new and renewable sources of energy for irrigation and
other agricultural operation.
Progressive institutionalization of rural and farm credit timely and adequately.
Provisioning of crop insurance.
j. National Policy for Farmers (NPF): As per recommendation of National
Commission on Farmers, GOI approved NPF, 2007 after consulting with state
governments. NPF broadly covers:
Improvement in production and productivity of agriculture along with economic
well-being of farmers.
Possession or getting access to productive asset or marketable skill has to be
ensured.
Priority to increasing awareness of using water efficiently and realization of
maximum yield and income per unit of irrigation.
Encouragement of new technologies such as biotechnology, ICT, renewable
energy technology, space applications, Nano-technology etc.
In order to coordinated agricultural bio-security programme, it was decided to
establish National Agricultural Bio-security System.
To maintain seeds quality and soils health, soil health passbook containing
integrated information on farm soils with corresponding advisories is to be issued.
Support services like creches, child care centers and adequate nutrition to women
working in filed would be funded.
Galvanize the financial services for timely, adequate and easy reach to the farmers
at reasonable interest rate.
Setting-up of Gyan Chaupals at village level with the help of ICT and farm
schools through state governments for strengthening extension services.
Effective implementation of Minimum Support Price mechanism.
Expansion of food security basket to include nutrition’s millets such as bajra,
jowar, ragi and millets mostly grown in dry land farming areas.
Septs to put in place an appropriate social scheme for farmers.
k. Doubling of farmers income: In India, the strategies undertaken for agricultural
development in past aims only in enhancing agricultural output and achieving food
security. However, such strategies did not try to increase the farmers’ income and also
did not suggest any measures to improve farmers’ welfare (Chand, 2016). Such

64
strategies did not necessarily result in increase in farmers’ income and welfare for all
even though their output raised. In fact, the income of farmers kept low as compared
to the income of the non-farm workers. Hence, Government of India in 2015 has set
the goal of doubling farmers’ income by 2022-23 to improve the conditions of
farmers in the country which is also a part of second goal of Sustainable Development
Goals.
As income of agricultural households of different states and Union
Territories(UTs) are not same, the equitability in doubling of farmers income requires
that income of such households in states/UTs where income is less than national
average should grow faster that the income of such households in states/UTs where
income is less than national average. Accordingly, the Doubling Farmers’ Income
(DFI) committee has devised a hypothetical reference scenario. The DFI committee
has identified seven major sources of growth operating inside and outside the
agriculture sector to achieve the target of doubling of farmers income. These sources
of growth are (Report of the Committee on Doubling Farmers’ Income, 2017):
Improvement in crop productivity
Improvement in livestock productivity
Resource use efficiency or saving in cost of production
Increase in cropping intensity
Diversification towards high value crops
Improvement in real prices received by farmers and
Shift from farm to non-farm occupations
Among these seven sources of growth of farmers’ income, first five operates within
agriculture and the rest two operates outside the sector.
In order to achieve the target of doubling farmers income, GOI has adopted Pradhan
Mantri Krishi Sinchai Yojana on July 1, 2015. PMKSY aims to improve the water supply
for cultivation. Organic farming is another scheme started by GOI. The Pradhan Mantri
Kisan Sampada Yojana is also launched to develop the food-processing capabilities. The
PMKSY benefitting 20 lakh farmers and creating around 5 lakh employment
opportunities (Singh, 2017). With the aim of development of agricultural marketing, the
electronic-National Agricultural Market was lunched by GOI. The pradhan Mantri Fasal
Yojana is adopted to reduce the risk of crop loss by farmers.

65
2.5 Land Reform
There were three types of land tenure system in India at the time of independence.
a. Zamindari system: This system was created by East India Company in 1793. Under
this system, zaminers collected the land revenue from farmers.
b. Mahalwari system: William Bentinck started this system in Agra and Oudh. Village
headman collected land revenue from tenants for the whole village.
c. Ryotwari system: This system was introduced in Tamil Nadu first. Under this
system, the farmers paid the land revenue directly to the state.
There were three types of tenants:
a. Occupancy tenants: Who enjoy permanent and heritable rights on land.
b. Tenants-at-will: Who did not enjoy any security of tenure.
c. Sub-tenants: those whose condition are also same with tenants-at-will but while sub-
tenants are appointed by occupancy tenants, latter are appointed by landlord.
The land tenure systems at the time of independence of India were highly exploitative
in nature. Zamindari system was more exploitative in nature, under which zamindars took
away the surplus output produced by cultivators over the minimum subsistence. In order to
stop the exploitation of the actual tillers and to confer the ownership on land to them, land
reform was introduced by Government of India in the post-independence period. The basic
objectives of land reform measures in India were:
To remove impediments, arise from agricultural structure inherited from the past,
to raise the production of agriculture.
To eliminate exploitation and social injustice in the agriculture sector, to provide
security to tenants and equality in status and to provide opportunity to rural
population of all sections.
The measures undertaken to achieves the objectives of land reforms were:
a. Abolition of Intermediaries
The exploitative agrarian relation was recognized as a major cause of stagnation in the
agriculture. As already mentioned all the three types of land tenure systems in India
were exploitative in nature which cost the agriculture very much. The zamindari
system was prevailing on around 57 per cent area of the country. The legislation for

66
abolition of intermediaries aims to provide land to tiller. In 1951, passed legislations
for the abolition of zamindari system. However, it was the first five year plan during
which most of the work relating to enactment of laws and acquisition of areas was
carried out. It has been estimated that 173 million acres of land was acquired from
intermediaries as a result of which two crore tenants were came into direct relation
with the state. The enactment of legislations to abolish intermediaries result decline of
exploitation and oppression of tenants to a great extent.
b. Tenancy reforms
With the abolition of tenancy, the sub-tenants still remained unprotected. There are
also some other problems related with tenants. Hence to minimize the evils of tenancy
cultivation some tenancy reform measures were undertaken.
Regulation of rent: The rent charged by zamindars during pre-independence period
was very high. For instance, the rent on land was around 80 per cent of the produce in
Punjab. Such high rate of rent puts heavy burden of tenants. It gave the zamindar the
power to squeeze land from tenants who were unable to the rent. As a result, after
1947, legislations were enacted to regulate the rents and to reduce its burden on
tenants. As per first five year plan, rent should be 1/4th or 1/5th of the total produce.
Security of tenants: Legislation for security of tenants was passed in most of the
states in order to protect them from ejectment and grant them permanent rights on
land. The legislation for security of tenants was enacted with the following aims-
Ejectments do not take place except in accordance with the provisions of the
law.
Land may be resumed by an owner, if at all, for ‘personal cultivation’ only and
In the event of resumption, the tenant is assured of a prescribed minimum
area.
Ownership right for tenants: Land reform made the provision of ownership rights
for tenants. Provision of ownership rights on land for tenants was assumed to be very
much desirable to bring tenants in non-resumable area in direct contact with the state
by second five year plan. Accordingly, some states adopt legislations for providing
right of ownership on tenants. In this regard West Bengal, Karnataka and Kerala
achieved more success than other states adopted such legislations. This legislation
gave ownership rights to around 12.42 million tenants over 6.32 million hectares land.
However, overall success of this legislation was far away from expectation.

67
c. Reorganization of agriculture
Ceiling of farm holdings: A ceiling on farm holdings implies a statutory absolute
limit on the land possessed by an individual. Land reforms made the provision that all
lands of the landlords beyond a certain limit would be taken away by government of
state and distributed to small proprietors to make their holdings economically viable
or to landless laborer to meet land demand. To make the policies relating to
imposition of ceilings on land holding by states of India, a conference of Chief
Ministers was held in July 1972. The important features of the new policy on ceiling
on land holdings undertaken in the conference were-
Lowering of ceiling to 18 acres of wet land and 54 acres of unirrigated land.
The changeover to family rather than the individual as the unit for determining
land holding lowered ceiling for a family of five.
Fewer exemptions from ceiling.
Retrospective application of the for declaring benami transactions nulland
void
In order to insulate the measures from challenge in courts of law, jurisdiction
of civil courts has been barred; most of these laws have been included in the
Ninth Schedule of the constitution, which places them beyond any challenge
in courts of law on grounds of infringement of Fundamental Rights.
Consolidation of holdings: The land holdings in India are small and fragmentated.
Small and fragmented holdings affects agriculture by limiting mechanization, wasting
land, creating problems in land management etc. To solve the problem of
fragmentation of land, the measure of consolidation of holding is very useful.
Accordingly, Government of India adopted the method of consolidation of holdings
through which a farmer was given one consolidated holding equal to the total land in
different plots possessed by him/her. The programme of consolidation of holding was
made voluntary at the beginning but later on it was made compulsory. The progress of
consolidation of holding was very slow. As on March 31, 2002, only 66.10 million
hectares out of 142 million hectare total cultivable area were consolidated. Thus, only
in 1/3rd of the consolable area of the country has been consolidated. A common
problem in consolidation of holdings in India was that the rich and influential group
often manage to get fertile and well situated land while the poor and uninfluential get
inferior land.
68
Cooperative farming: Due to sub-division of holdings, land holdings are becoming
smaller and smaller. In order to address this problem, cooperating farming was
advocated in India. The idea of cooperative farming was that farmers having very
small holdings should join hands and pool their land for cultivation. Such farming can
help the farmers to get the profits of large scale farming. Under cooperative farming,
marketable surplus of food grains and industrial raw materials can be obtained more
easily from large farms and can be transport to the market easily and at a large scale.
Such farming also encourage mutual confidence, collective action, joint thinking and
feeling of fraternity and friendship among the members.
Evaluation of Land Reform
a. The definition of personal cultivation was not satisfactory. Nowhere the meaning of
personal cultivation was mentioned clearly. This result large scale ejectment of
tenants.
b. Zamindars under the name of ‘absentee landlords’, still retain substantial areas of
cultivable land for their personal cultivation. Thus, the objectives of abolition of
zamindars was defeated.
c. Zamindars transferred land at large scale to their family members to escape the laws
related to land ceiling. Initially for some times in some states there were no law to
prevent such transfer of land. Even if law exists in some states, due to unsatisfactory
definition of personal cultivation, zamindars still get the scope for such transfer of
land.
d. The share-croppers were not given the status of tenants in some state although they
cultivated a substantial part of land. Thus, the rights of tenants were not protected
with the help of laws related to tenancy reforms.
e. Quite often, landlord forced their tenants to voluntary surrender the land which are
being cultivated by tenants. For this, tenants were threatened and even beaten up. In
such cases law cannot help tenants if they surrender their land on their own accord.
f. The levels of ceilings on land were different across some states and even in areas
within same state. This creates lots of confusions and disputes.
g. Lack of political will was a major problem in implementation of land reform. It was
observed that governments were not interested in implementation of legislations
enacted under land reform. Governments were merely trying to wear the progressive

69
and socialistic look while continuing to function under the directions and pressures of
large farmers.
h. There were also lacks of interested of bureaucracy in implementing the land reforms.
In fact, politician and bureaucrats were linked up. Whenever, any enthusiastic
administrator wanted to implement the land reform measures, they were transferred
immediately.
2.6 Key Words
GDP : Gross Domestic Product
Policy : a documentary orientation and framework targeted to be
achieved
Reform : refining and redefining the existing forms of framework
Consolidation : realigning and combining the scattered and fragmented
pieces of land
2.7 Questions
1. Discuss the growth and productivity trends in Indian Agriculture. What are the causes
of low productivity of agriculture in India? Suggest some remedies.
2. Discuss the impacts of economic reforms on agriculture in India.
3. Discuss the various agricultural policies under taken by government of India.
4. What are the components of land reforms in India? Evaluate the land reforms.
2.8 Suggested Readings
Chand, R (2016): Doubling Farmers’ Income: Strategy and Prospects, Presidential
address, Seventy Sixth Annual Conference, The Indian Society
of Agricultural Economics.
Datt, Ruddar and K.P.M Sundharam (2001): Indian Economy, S. Chand & Company
LTD., New Delhi.
Dhar, P. K. (2003): Indian Economy: Its Growing Dimensions, Kalyani Publishers,
Delhi.
70
Ministry of Agriculture & Farmers’ Welfare (2017): Report of the Committee on
Doubling Farmers’ Income, Volume II, Department of
Agriculture, Cooperation and Farmers’ Welfare.
Misra, S. K. and V. K. Puri (2008): Indian Economy- Its Development Experience,
Himalaya Publishing House, Nagpur.
Singh, R.M (2017):‘Doubling farmers income by 2022: Here is a 7 step path to move
forward’, Financial Express, September, 15, 2017
Soni, R.N. (2004): Leading Issues in Agricultural Economics (Theoretical& Applied),
Vishal Publishing Co., Jalandhar.
71
UNIT - III
INDUSTRY
Structure
3.0 Introduction
3.1 Objectives
3.2 Evolution of Indian industries: An overview
3.2.1 Indian Industry: An overview of the Current Scenario
3.3 Industrial Policy Resolution of 1948
3.4 Industrial Policy Resolution of 1956
3.5 Public Sector in India
3.5.1 Growth of public Sector in India
3.5.2 Role of Public Sector in India
3.5.3 Economic reforms and Public Sector
3.5.4 Government’s Policy towards Public Enterprises
3.6 Questions
3.7 Key words
3.8 Suggested Reading
3.0 Introduction
Prior to the coming of the Britishers, India was industrially more advanced compared
to the West European countries. The Britishers systematically destroyed the industrial base of
India. As a result, India inherited a weak industrial base, underdeveloped infrastructural
facilities and a stagnant economy at the time of Independence.
So, in 1947 when India became independent, the industrial base of the economy was
very small and the industries were plagued with many problems such as shortage of raw
materials, deficiency of capital, bad industrial relations, etc. The investors were not sure
about the industrial policy of the new national government and the industrial and investment
climate was shaped with reservations and doubts. In December 1947 the Industrial
Conference was called by the Government in order to improve matters and remove suspicions
and uncertainties in the minds of the investors and entrepreneurs. A resolution was adopted in
the Conference which called for industrial peace and recommended a clear division of
industries into public and private sector.

72
3.1 Objectives
After going through the chapter you should be in a position to answer the following
questions:
Give an overview of the evolution of the Indian Industry since independence?
What are the main features of the Industrial Policy Resolution of 1948 and
1956?
Discuss the role and growth of Public Sector Units in the Indian Economy?
What has been the impact of Economic Reforms on the Industrial Sector?
What do you understand by disinvestment? Discuss the emergence of the
disinvestment Policy?
3.2 Evolution of Indian industries: An overview
Industrial development during the period of planning can be divided into four phases.
The first phase covered the period of the first three plans (1951 to 1965), which laid the basis
for industrial development and a base for a strong industrial structure; the second phase
covered the period between 1965 to 1980, which was marked by industrial deceleration and
structural retrogression; third phase between 1980 to 1991 was marked by industrial
recovery; and the fourth phase covering the period beyond 1991-92 onwards is marked as the
post reform period.
On the eve of the First Plan, the industrial development in India was confined largely
to the consumer goods sector, the important industries being cotton textiles, sugar, salt soap,
leather goods and paper. Thus, the industrial structure exhibited the features of an
underdeveloped economy. As far as the capital goods sector was concerned, only a small
beginning was made. The consumer goods industries were well established, while the
producer goods industries lagged behind. The Second plan gave to priority to programmes of
industrialization. The Strategy was “if industrialization is to be rapid enough, the country
must aim at developing basic industries and those industries which make machines needed
for further development. This calls for substantial expansion in iron and steel, non-ferrous
metals, coal, cement, heavy chemicals and other industries of basic importance…”.The Third
Plan pressed forward the establishment of basic capital and producer goods industries, with

73
special emphasis on machine building programme so that the growth of the economy would
be self-sustaining in the coming years. The structure of industrial development was promoted
and nurtured in the Fourth and Fifth plans. The Sixth plan noted that industrial production
had increased by 5 times during the last thirty years. It also noted that the industrial structure
had diversified considerably producing an entire range of consumer, intermediate and capital
goods, but was not sufficiently guided by cost considerations. The plan also noted that the
public sector had failed to generate enough resources and that the problem of regional
disparities in industrial development was very acute and serious. The Sixth Plan saw wide
range changes in the industrial policy of the government and the industrial and trade policies
were substantially liberalized. The seventh Plan laid emphasis to industrial and mineral
programmes in the public sector. In line with the liberalization of industrial policy, the Eighth
Plan placed less emphasis on quantitative targets. It sought to achieve the desired growth in
different sectors primarily through modifications in industrial, trade, fiscal policies and
changes in duties and taxes rather than through quantitative restriction on import/exports or
licensing mechanism. The Ninth plan made broad sector wise allocation which included the
village and small-scale industries as well. In the Tenth Plan there was reduced allocation to
industry keeping in line with the government’s strategy to liberalize and privatize and give
more space to the private sector to expand its activities. The Eleventh and Twelfth plans set
ambitious target of 10 per cent per annum growth for the industrial sector and at the same
time tried to follow the re-oriented industrial development strategy towards creating an
enabling environment for the private sector to reach its full entrepreneurial potential and
thereby contribute towards production, employment and income generation in the country.
3.2.1 Indian Industry: An overview of the Current Scenario
Industry plays a decisive role in determining the overall growth of an economy. The
industrial sector performance during 2018-19 has improved as compared to 2017-18. As per
the provisional estimates of the Annual National Income 2018-19 released by the Central
Statistics Offices (CSO), the growth of industry real Gross Value Added (GVA) was higher
at 6.9 per cent in 2018-19 as compared to 5.9 per cent in 2017-18. Construction and
manufacturing sectors have experienced 8.7 per cent and 6.9 per cent growth rate respectively
during 2018-19. The mining and quarrying sector has experienced sluggish growth in 2018-
19 as compared to 2017-18.
74
The industrial growth in terms of Index of Industrial Production (IIP) during 2018-19
stood at 3.6 per cent as compared to 4.4 per cent growth rate in 2017-18. The moderation in
2018-19 has been mainly due to subdued manufacturing activities in Q3 and Q4 due to
slower credit flow to medium and small industries, reduced lending by NBFCs owing to
liquidity crunch, tapering of domestic demand for key sector such as automotive sector,
pharmaceuticals, and machinery and equipment, volatility in international crude oil prices etc.
The Index of eight core industries measures the performance of Coal, Crude Oil,
Natural Gas, Petroleum Refinery Products, Fertilizers, Steel, Cement and Electricity. The
eight core industries comprise about 40.3 per cent weight in the IIP. The overall Index of the
eight core industries registered a growth rate of 4.3 percent during 2018-19 similar to the
increase achieved in 2017-18. The production of Coal, Steel, Cement, Electricity, Refinery
Products, Natural Gas and Fertilizers registered positive growth rate in 2018-19 with Cement
and Coal registering a higher growth rate of 13.3 per cent and 7.4 per cent respectively.
The Government has initiated a number of measures in crucial sectors to accelerate
higher manufacturing growth such as Start-up India, Ease of doing Business, Make in India,
Foreign Direct investment Policy reforms. India has considerably improved its ranking to 77th
position in 2018 among 190 countries assessed by the World Bank Doing Business Report,
2019 in which India has leapt 23 ranks over its rank of 100 in 2017.
A robust and resilient infrastructure is fundamental and essential for budding
industries. While India has invested in its infrastructure over the years, the challenge is to
mobilize adequate investment in infrastructure sector which runs into several trillions of
dollars. The investment gaps in the infrastructure would have to be addressed through various
innovative approaches with the collaboration of both public and private sector. The need of
the hour is a robust industry with a buoyant and resilient infrastructure.
3.3 Industrial Policy Resolution of 1948
The Government of India on 6 April, 1948 issued the first important industrial policy
resolution. Following were the main features of the 1948 industrial policy:

75
1. Acceptance of the importance of both Private and Public Sectors: The industrial
policy resolution accepted the importance of both public and private sectors in the
industrial economy of India. The resolution adopted a two-pronged strategy – Firstly,
expansion of the State sector in areas where it was operating and in new lines of
production, and secondly, allowing private sector to exist and expand under proper
direction and regulation.
2. Division of the industrial sector: The resolution divided industries into four
categories. These categories were as follows:
(i) Industries were State had a monopoly: In this category three fields of activity
were specified – arms and ammunition, atomic energy and rail transport.
(ii) Mixed Sector: In this category the following 6 industry were specified – coal,
iron and steel, aircraft manufacture, ship building, manufacture of telephone,
telegraph and wireless apparatus and minerals oils.
(iii) The field of government control: In this category 18 industry of national
importance were included. Some of the industries included were –
automobiles, heavy chemicals, heavy machinery, machine tools, fertilizers,
electrical engineering, sugar, paper, cement, cotton and woolen textiles.
(iv) The field of private enterprise: All other industries not included in the above
three categories were left open to the private sector.
3. Role of small and cottage industries: The 1948 Resolution accepted the importance
of small and cottage industries in industrial development. These industries were
particularly suited for the utilization of local resources and for the creation of
employment opportunities. For a long period of time they had to face acute problems
of raw material, capital, skilled labour, marketing etc. So, it was emphasized in the
industrial policy that these problems of the small scale and cottage industries should
be solved by the Central Government with the cooperation of State governments.
4. Other important features of the industrial policy: The role of foreign capital in
industrial development of the economy was recognized but the need of regulating and
controlling it according to the needs of the domestic economy was believed to be
critical. It was therefore stated that in those industries where foreign investment was
to be done, Indians should have a major say in the ownership and management. The
Resolution called for harmonious relations between the management and labour since
this was necessary for industrial development. It also called for just labour conditions
76
wherein workers would be given fair wages. Further, for purposes of maintaining
industrial peace, labour participation in management was considered essential.
3.4 Industrial Policy Resolution of 1956
The nature and pattern of Industrial development in the country was determined by
the 1948 policy which remained in force for full eight years. The country had completed one
five-year plan period 1951-56. ‘Socialist pattern of society’ was declared as the goal for the
country and hence a new industrial policy seemed essential which came in the form of
Industrial Policy Resolution of 1956.
The 1956 Resolution laid down the following objectives for the industrial policy:
(i) To accelerate the rate of growth and to speed up industrialization;
(ii) To develop heavy industries and machine making industries;
(iii) To expand public sector;
(iv) To reduce disparities in income and wealth;
(v) To build up a large and growing cooperative sector; and
(vi) To prevent monopolies and the concentration of wealth and income in the hands
of a small number of individuals. These objectives it was felt would help in
generating employment opportunities and in raising the standard of living of the
masses.
Salient Features of the Industrial Policy of 1956
1. Division of the industrial sector: The 1956 Resolution divided industries into the
following three categories:
(a) Monopoly of the State: In the first category those industries were included
whose future development would be the exclusive responsibility of the State.
Seventeen industries were included in this category and were listed in
Schedule A. These industries were grouped into the following five classes;
(i) defense industries, (ii) heavy industries, (iii) minerals, (iv) transport and
communications, and (v) power. Of these, four industries – arms and
ammunition, atomic energy, railways and air transport, were to be government

77
monopolies. In the remaining 13 industries, all new units were to be
established by the State.
(b) Mixed sector of public and private enterprise: In this section 12 industry
listed in Schedule B were included. These were: all other minerals, road
transport, sea transport, machine tools, ferro-alloys and tool steels, basic and
intermediate products required by chemical fertilizers such as manufacture of
drugs, dyestuffs and plastics, antibiotics and other essential drugs, fertilizers,
synthetic rubber, chemical pulp, carbonization of coal and aluminium and
other non-ferrous metals.
(c) Industries left for private sector: All industries not listed in schedules ‘A’ or
‘B’ were included in the third category. These industries were left open to the
private sector. Their development was to depend on the initiative and
enterprise of the private sector and the role of the State in this category was to
provide facilities to the private sector to develop.
2. Mutual dependence of public and private sectors: The public and private
sectors were not to be exclusive and totally independent of one another. The only
four industries in which the private sector was not allowed to function were arms
and ammunitions, atomic energy, railways and air transport. It emphasized at
mutual coexistence and cooperation of private and public sectors.
3. Assistance and control of private sector: The government could assist expansion
and development of private sector through participation in its risk capital and
share capital and by providing other types of service, fiscal incentives etc.
4. Importance of small-scale and cottage industries: The 1956 Resolution also
recognized the importance of small-scale and cottage industries. Such industries
could create large scale employment opportunities, ensure a more equitable
distribution of income and wealth, and help in effective mobilization of human
and physical capital.
5. Reduction of regional inequalities: The 1956 Resolution called for reduction in
regional imbalances and inequalities. It advocated that transport facilities, power
and other facilities should be provided in the backward regions and stressed on
balanced development of agriculture and industry.
6. Technical and managerial personnel: The 1956 Resolution advocated the
establishment of proper technical and managerial cadres through the organization

78
of apprenticeship schemes of training on a large scale, establishment of technical
institutions, organization of management courses in universities.
7. Industrial peace: A congenial atmosphere is of paramount importance for
industrial progress to take place. The relation between mill owners and the
workers should be cordial and amicable. Thus the 1956 Resolution reiterated that
in a ‘socialist society’ the rights of the workers should be protected and they
should be provided with adequate amenities and incentives for carrying out their
work.
Thus, the second industrial resolution re-emphasized the importance of public sector
and the necessity to regulate the growth of the private sector.
3.5 Public Sector in India
Public sector in India includes all those activities which are funded out of the Budget
of the government of India as well as budgets of State Governments and municipal bodies. In
this sense, the public sector covers all government departments, government enterprises,
railways, communications, irrigation projects, ordinance factories, banking and insurance
companies, public financial institutions, government schools, colleges, hospitals,
dispensaries, etc.
The Industrial Policy of the 1956 shaped the growth of public sector in India, which
enjoined upon the government to play a strategic role in the country’s development. When
India became independent it inherited a number of problems which had to be solved in a
planned and systematic manner. India had a weak industrial base, low savings and investment
levels and poor and primitive infrastructural facilities. Majority of the people in India lived
below the poverty line and were extremely poor and wide disparities existed in terms of
income and wealth. The unemployment situation was acute along with glaring regional
imbalances.
3.5.1 Growth of public Sector in India
One the eve of independence, there were hardly any public enterprises in India except
for railway transport, ordinance factories, postal communications, etc. It was only under the
79
Industrial Policy Resolution of 1956 that the States were called upon to assume direct
responsibility and play a dominant role in Industrial development. Consequently, the number
of enterprises in the public sector which was 5 in 1951 with an investment of Rs. 29 crores
increased to 245 public sector enterprises with an investment of Rs. 403, 706as on March 31,
2006. Further, the number of public sector enterprises rose to 247 as on March 31, 2007 with
an investment of Rs. 421089 crore. Thus, investment increased by Rs. 17383crore during the
year 2006-07. The turnover was Rs. 133906crore in 1991-92 which rose to Rs. 837295 crore
in 2006-07 and further to Rs. 964410 crore in 2006-07. Thus, the turnover of public sector
enterprises increased by Rs. 127115 crore during 2006-07 an increase of 15.2 per cent, of the
total Rs. 421089 crore investments in the public sector as on March 31, 2007, of which as
much as 62.6 percent were in the industrial sector comprising of electricity, manufacturing,
mining and construction sectors.
The Central Public Sector Enterprises (CPSEs) play a significant role in Indian
Economy. According to the Department of Public Enterprises, there are 339 CPSEs as on 31
March, 2018. Out of these 339 CPSEs, 257 are in operation and 82 are non-operational
during 2017-18. Out of the operating 257 CPSEs, 184 CPSEs were profit making, 71 loss
making and 2 CPSEs at no profit no loss. The profit of profit making CPSEs (184) stood at
Rs 1,59,635 crore, while the loss of loss-making CPSEs (71) stood at Rs 31,261 crore during
2017-18. The overall net profit of the 257 operating CPSEs went up by 2.29 per cent to Rs
1,28374 crore during 2017-18. Further, the CPSEs contribution to the total Central Exchequer
decreased by 2.98 per cent in 2017-18 as against the previous year. A comparative analysis of
the performance of a few CPSEs vis-a-vis private sector using 5 year average net profit
margin in selected sectors show that there is a great scope for improvement for CPSEs in
some sectors as the private sector firm as have performed relatively better than the public
sector forma.
3.5.2 Role of Public Sector in India
In India’s planned economic development, public sector was assigned a very
important role. The major contributions expected from the public sector in India’s economic
development are discussed below:
(i) To ensure rapid economic development: For an accelerated rate of economic
growth to be a reality, the State was called upon to directly participate in industrial
80
development. The State could gather the necessary resources and make direct
investment in various sectors of the economy and thus increase the pace of
industrial and economic development.
(ii) To promote redistribution of income and wealth: Since India had adopted the
goal of establishing a ‘Socialist Pattern of Society’ as the motto of its
development, it was therefore necessary that concentration of income, wealth and
economic power in the hands of a few rich capitalists is controlled.
(iii) To develop industries which require huge investment: There are some
industries, the development of which is extremely essential for the growth of the
economy. Such industries include power, transport, petroleum, irrigation,
fertilizers, iron and steel, heavy machinery, etc. Hence all such activities which
are essential for country’s development but are beyond the capacity of the private
investors and are not sufficiently profitable and attractive to them must be
developed by the State.
(iv) Balanced regional growth: Expansion of public sector was necessary to
industrialize the backward regions and achieve a balanced regional growth. It is
only the public enterprises, which are governed more by social responsibility
rather than private profitability that can help in developing these backward regions
and thus achieve balanced regional growth.
(v) To prevent concentration of economic power: If the entire field of industry is
left wide open for the private sector, it is quite possible that the big industrial
houses branch off their activities to diverse fields of activity and gain control over
a large number of industries. Further, through the development of public
enterprises in all the key sectors, the government would come to assume “the
commanding heights” of the economy and would thus be in a position to dilute
such tendencies of concentration of economic power in private hands and blunt
their capacity to exploit the consumers or hold the economy to ransom.
(vi) To Generate Resources of development: Growth of public sector was visualized
as a vehicle for faster economic development. The public enterprises were
expected to generate sufficient surpluses/profit that would be ploughed back to set
up more public enterprises or used for the expansion of the existing enterprises.
(vii) To promote import substitution: The public-sector industries were expected to
produce goods of international standards so as to replace the imported goods. This
81
would naturally save a lot of precious foreign exchange that can be used for other
development requirements.
(viii) To generate Employment: The public sector was expected to generate
substantial employment opportunities and thus help in minimizing the dimensions
and problems of widespread unemployment.
(ix) To help in development of small-scale industries: The public-sector was also
expected to help the growth of small-scale industries by enabling them to upgrade
their technology and inducing them to produce ancillary products required as
inputs by these enterprises.
3.5.3 Economic reforms and Public Sector
In view of the many ills affecting the working of the public-sector enterprises, a
number of reforms have been introduced to make it more efficient and competitive. The
government strategy in the context of the public sector continues to be a judicious mix of
policies that aim at strengthening the strategic industrial units, privatizing the non-strategic
ones through gradual disinvestment and sale and devising viable rehabilitation package for
the weak units.
3.5.4 Government’s Policy towards Public Enterprises
The main elements of Government’s policy towards public sector undertakings are:
(i) To bring down Government’s equity in all non-strategic public-sector
undertakings to 26 per cent or lower, if necessary,
(ii) To restructure and revive potentially viable public-sector undertakings,
(iii) To close down public-sector undertakings which cannot be revived, and
(iv) To fully protect the interest of workers.
The New Industrial Policy July 1991, apart from reducing the area exclusively
reserved for the public sector from 17 to 4 industries, has also initiated the following reforms.
82
(i) Restructuring: The new policy aims at restructuring of the public enterprises.
This would involve modernization of plants, rationalization of productive
capacity, changes in product mix.
(ii) Focus on infrastructure: The New Industrial Policy seeks to focus the
development of public sector on strategic, high-tech and essential infrastructure.
(iii) Openings for Private sector: While some reservation for public sector will be
retained, there would be no bar on area of exclusivity to be opened up to the
private sector selectively.
(iv) Professional Management: According to the New Industrial Policy, Boards of
public sector companies would be made more professional and given greater
powers. Changes will be made in management practices to promote efficiency,
dynamic leadership, resourcefulness and innovation.
(v) Autonomy and Accountability: To make the public enterprises efficient,
competitive and dynamic, it is necessary to give them increased autonomy and at
the same time subject them to accountability for their performance. The
performance of the enterprises is reviewed after the specified time period to assess
how far they have achieved their goals and targets.
(vi) Navratnas and Mini Ratnas: In accordance with its policy of giving greater
autonomy to public enterprises, the government has granted the status of
Navratnas to certain selected public-sector units. These enterprises have been
given full freedom to make capital expenditure, enter joint ventures, set up foreign
subsidiaries and form technological and strategic alliances with foreign
enterprises.
(vii) Disinvestment: With a view to raising resources and encouraging wider
participation, a part of government shareholding in public enterprises is being
offered to financial institutions, general public and workers. The July 1991
Industrial policy stated that to begin with 20 per cent share of the public
enterprises would be sold.
(viii) Growth in per capita income: The growth rate of per capita income has been
quite distressing upto the Fourth Plan; it was almost zero during the Third Plan
and below one percent during the fourth Plan. However, Fifth Plan onwards it has
shown continuous increase and reached a reasonably high level during the Eighth
Plan but however, declined marginally in the Tenth Plan.

83
(ix) Structural changes in National Income: Planned economic development has led
to structural changes in National Income. While in 1950-51, agriculture’s share in
national income was over 55 per cent, it has come down to less than a quarter in
2001-02 and has further come down to 14.6 per cent in 2011-12. The share of
secondary sector has gone up from 13 per cent in 1950-51 to around 25 per cent in
2001-02 and has remained almost stagnant at 24.2 per cent in 2011-12. The
contribution of the tertiary sector has improved substantially from 30 per cent in
1950-51 to 50.9 per cent in 2000-01 to 61.2 per cent in 2011-12.
The Public Enterprises and the Disinvestment Debate
Rationale of Disinvestment
The term ‘disinvestment’ is used to indicate the process of privatization. Since the
beginning of the 1980s, the functioning of the public sector began to be questioned. It was
held that public sector performed well only when protected through State monopolies, entry
reservations, high tariffs and quotas etc. Since quite a large number of Public enterprises
incurred losses year after year, so it was argued why should the State use the tax payer’s
money to bail out these industries. So, the question of privatization of public sector was
debated. Disinvestment is the process through which privatization could take place.
The collapse of the Soviet Union towards the end of the 1980s, followed by several
East European countries eroded the faith in the public sectors. Chinese government also
pleaded for market socialism. Since in the socialist economies, disinvestment of State owned
enterprise was undertaken in a big scale, so the critics of Public sector argued for reducing
the area of operations of the Public-sector units.
The Ministry of Disinvestment outlined the following objectives:
1. Releasing the large amount of public resources locked up in non-strategic public
sectors enterprises, for redeployment in areas that are much higher on the social
priority, such as basic health, family welfare, primary education and social and
economic infrastructure.
84
2. Stemming, further outflow of these scarce public resources for sustaining the unviable
non-strategic public-sector enterprises.
3. Reducing the public debt that is threating to assume unmanageable proportions.
4. Transferring the commercial risk to the private sector wherever the private sector is
willing and able to step in; and
5. Releasing other tangible and intangible resources, such as large man power currently
locked up in managing public sector enterprises and their time and energy for re-
deployment in high priority social sectors that are short of such resources.
The emergence of the Disinvestment Policy
Privatization is a process by which the government transfers the productive activity
from the public sector to the private sector. The policy of disinvestment evolved over a period
of time in India after the implementation of the economic liberalization process in 1991-92.
The evolution of the privatization policy in has been outlined below.
1. Interim budget and Budget Speech, 1991-92: The government of India enunciated a
policy to divest upto 20 per cent of its equity in selected public-sector undertakings to
mutual funds and investment institutions in the public sector, as well as workers in
these firms. The stated purpose of the policy was to place equity across a broad base,
improve management, increase resources to the enterprises and to raise funds for the
general exchequer.
2. Report of Rangarajan Committee on Disinvestment of Shares, 1993: The
Rangarajan Committee emphasized the need for substantial disinvestment. It
recommended that the percentage of equity divested could be upto 49 per cent for
industries reserved for the public sector, and that in exceptional cases upto 74 per cent
of the equity could be divested. In industries not reserved for the public sector, 100
per cent of the equity could be divested. Only the following 6 industries were reserved
for the public sector: (i) coal, (ii) minerals and oils, (iii) armaments, (iv) atomic
energy, (v) radioactive minerals, and (vi) railways.
3. Divestment Commission Recommendations: February 1997 to October 1999: The
Government constituted a five-member Public Sector Disinvestment Commission
under the Chairmanship of G.V. Ramakrishna in August 1996 for drawing a long-
term disinvestment programme for the PSUs referred to the Commission.

85
4. Budget Speech, 1998-99: In the Budget Speech of 1998-99, the Finance Minister
stated that the Government had decided that in the generality of cases, the government
share-holding in public sector enterprises will be brought down to 26 per cent. In case
of Strategic Public-sector enterprises, the government would continue to retain
majority of the holding. The interests of workers shall be protected in all cases.
5. Strategic and Non-strategic classification, 1999: The government classified the
Public-Sector Enterprises into Strategic and non-strategic areas for the purpose of
Disinvestment. Strategic industries were limited to: (i) arms, ammunitions and related
defense industries; (ii) atomic energy; (iii) mining of minerals for the atomic industry;
and (iv) railway transport. All other industries were classified as non-strategic.
6. Address by President to Joint Session of Parliament, February2001: In his
address to the joint session of Parliament in February 2001, the President stated thus:
“The government’s approach to PSUs has a threefold objective: revival of potentially
viable enterprises; closing down of those PSUs that cannot be revived; and bringing
down government equity in non-strategic PSUs to 26 per cent or lower. Interests of
workers will be fully protected through attractive Voluntary Retirement Schemes and
other measures”.
7. National Common Minimum Programme, 2004: The National Common Minimum
Programme (NCMP) of the UPA collation government was released on May 25,
2004. The NCMP confirmed the commitment of the UPA government to a strong and
effective public sector and laid down the following guidelines as far as privatization
of Central PSEs is concerned: (i) all Privatizations will be considered on a transparent
and consultative case-by-case basis; (ii) generally profit-making companies will not
be privatized; (iii) the government would retain exiting ‘navratna’ companies in the
public sector while these companies can raise resources from the capital market.; (iv)
while every effort will be made to modernize and restructure sick public sector
companies and revive sick industry, chronically loss-making companies will either be
sold-off, or closed, after all workers have got their legitimate dues and compensation;
and (v) the government believes that Privatization should increase competition, not
decrease it. Therefore, it will not support the emergence of any monopoly that only
restricts competition.
Since the announcement of Industrial Policy 1991, the coalition forms of different
Governments that came to power adopted the disinvestment policy with minor modifications

86
here and there. Even within the government there were criticism of the disinvestment policy
as even the profit-making enterprises were being privatized. While the Congress government
initiated the process of economic reforms with emphasis on privatization, the BJP-led NDA
government carried forward the banner of privatization, taking advantage of the fact that the
Congress party, being the architect of privatization, was not in a position to oppose it. The
PSUs should be given more powers to make them accountable and profitable in due course of
time. It would be prudent to relook into the disinvestment policy and search for other
alternatives to further improve upon the performance of PSUs.
3.6 Questions
1. Critically discuss the evolution of Indian industries since independence.
2. Analyse the various industrial policies prior to economic reforms in India.
3. Discuss the relevance of PSUs (Public Sector Undertakings) in India. Also,
appraise the performance of PSUs (Public Sector Undertakings) in India.
3.7 Key words
Public Sectors Units : an industrial undertaking either by state or
central government
Industry : any activity which adds value to an input
Disinvestment : divesting of the shares of any undertaking by the
previous owner
3.8 Suggested Reading
Kapila, Uma (Ed.), India’s Economic Reforms, Academic Foundation, New Delhi.
Dutt and Sundaram, (Latest edition) Indian Economy, S.Chand and Company, New
Delhi.
Mishra, S.K. & V.K. Puri Indian Economy, Himalayan Publishing House, Mumbai
(latest edition)
Kapila, Uma (ed) Indian Economy Since Independence, Academic Foundations, Delhi
(latest edition)
87
UNIT-IV
INFRASTRUCTURE
Structure
4.0 Introduction
4.1 Objectives
4.2 Different Types of Infrastructure
4.3 Physical Infrastructure
4.3.1 Power
4.3.2 Transport
4.4 Financial Infrastructure
4.5 Social Infrastructure
4.6 Institutional Infrastructure: Market
4.7. Financing Infrastructure: Problems and Policies
4.8 Sources of Infrastructure Finance
4.9 Suggested Readings
4.0 Introduction
Infrastructure can be defined as the basic physical and organizational structures
needed for the operation of a society or enterprise, or the services and facilities necessary for
an economy to function. The term typically refers to the technical structures that support a
society, such as roads, water supply, sewers, power grids, telecommunications, and so on.
Viewed functionally, infrastructure facilitates the production of goods and services; for
example, roads enable the transport of raw materials to a factory, and also for the distribution
of finished products to markets. In some contexts, the term may also include basic social
services such as schools and hospitals.
An economy’s infrastructure is more conveniently divided in two parts, viz., social
infrastructure and physical infrastructure. Social infrastructure, on the other hand, is directly
concerned with the needs of such services that meet the basic needs of a society like health
services, drinking water, sewerage, sanitation, electricity, education facilities, etc. Physical
infrastructure, on the other hand, is directly concerned with the needs of such production
sectors as agriculture, industry, trade, etc. In physical infrastructure, we include such services
as power, irrigation, transport, telecommunications, etc.
88
4.1 Objectives
To know the meaning and different types of infrastructure in India
Problems of Infrastructure finance in India and the policies for Infrastructure
finance
4.2 Different Types of Infrastructure
Infrastructure can be broadly classified into the following categories:
1. Physical Infrastructure - This may include roads, water, drainage, electricity.
2. Services Infrastructure - Transportation, health and education.
3. Social - Social sector services, especially primary health care, old age homes,
community centres etc,.
In the developing nation due to limited resources the infrastructure is undeveloped or
developing. Lack of basic public utilities like water, all weather (pucca) roads and electricity
is a common problem in a developing country like India. It is even more so in case of health
care facilities, schooling facilities and other services in the social sector. In times of disaster,
even these limited infrastructural facilities are destroyed and are unable to cater to the needs
of the people. The different types of infrastructure in India can be discussed under following
heads:
4.3 Physical Infrastructure
4.3.1 Power
Power or electricity is the essential source of commercial energy. To attain high
economic growth and development, development of power sector is very essential. Year after
year with the gradual development of various sectors like industry and service, the demand
for power is increasing. In order to meet this increasing power requirement a huge amount of
investment is regularly being made on the development of power projects. Some study shows
that India is world’s sixth largest energy consumer, accounting for 3.4 % of global energy
consumption, with Maharashtra as the leading electricity generator among Indian states. Due

89
to upward rise of the India’s economy, the demand for energy has grown at an average of 3.6
% per annum over the past 30 years. The total demand for electricity in India is expected to
cross 950000MW by 2030.
In India, there are broadly four sources of electricity power, they are-Thermal power,
Hydro power, Nuclear power and power from Renewable resources. In terms of power
generation, India is the sixth largest country in the world. About 65 % of the electricity
consumed in India is generated by thermal power plants, 22% by hydroelectric power plants,
3 % by nuclear power plants and rest by 10% from renewable sources like- solar, biomass
wind etc.
During independence era India had power generating capacity is very low and is
confined to only few urban centers on the other hand villages and rural areas are in total
darkness. The Generation and distribution of power was carried out primarily by private
utility companies. But after independence, electricity was made subject to the concurrent
jurisdiction of the state and central governments. In the mid 1970s, government recognized
that relying solely on the SEBs for power development lead to power shortages and large
inter-state imbalances, particularly in light of the uneven distribution of coal and
hydroelectric resources throughout the country. Therefore, in order to supplement the efforts
of the states, the central government increased its role in the generation and transmission of
power. NTPC and National Hydro Power Corporation, Ltd. (NHPC) were created in 1975 by
the central government to establish thermal and hydro generating plants and to install
associated interregional transmission systems. In the same year, the Central Electricity
Authority (CEA) was established in its present form to develop a uniform national power
policy. Additional power generating companies were established later.
The figure in the table 4.1 shows the total installed capacity of power in India as on
30.06.2019. In India six regions produces power with the help of different sources. These are
namely Northern, Southern, Western, Eastern, Northeastern and Island region and also on the
basis of ownership are State, Central and Private Sector. The table shows the combined
installed capacity of all the region of India. Of these power generated through nuclear energy
is totally under the sphere of central government and rests of the sources of energy are
divided among the Central, State and Private sectors. The figures shows that around 63
percent of total power are comes from thermal energy, of which 76 percent are produced by
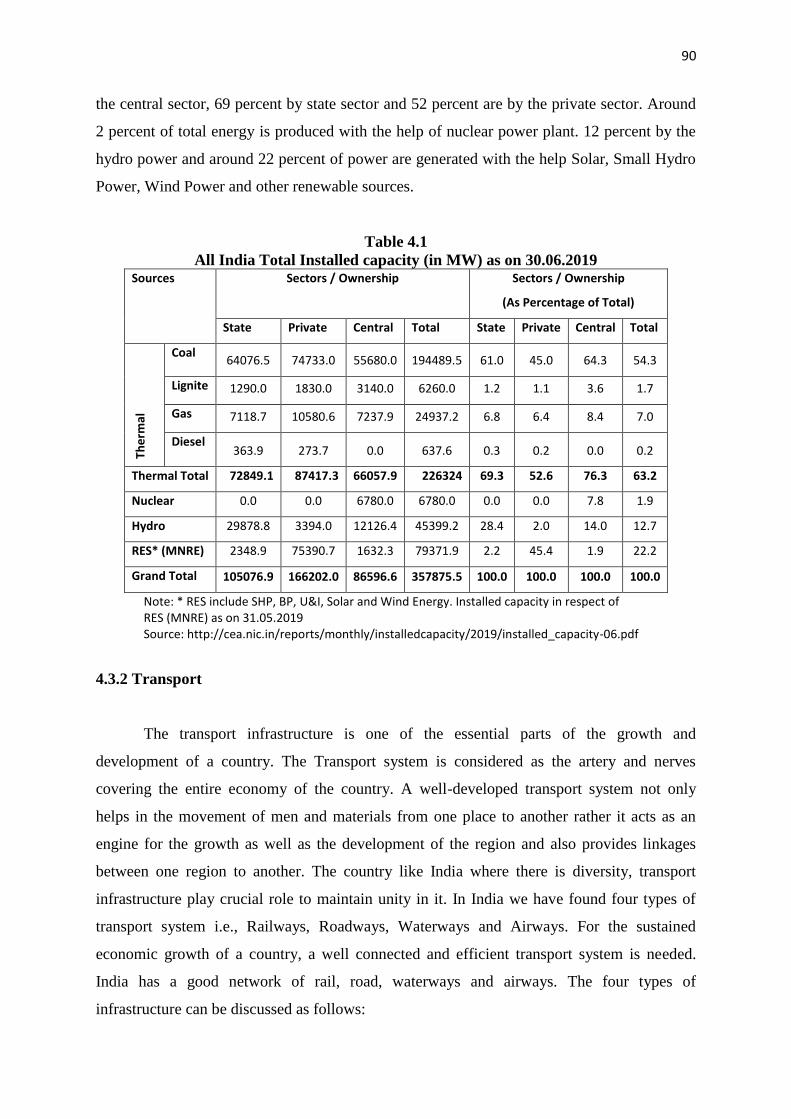
90
the central sector, 69 percent by state sector and 52 percent are by the private sector. Around
2 percent of total energy is produced with the help of nuclear power plant. 12 percent by the
hydro power and around 22 percent of power are generated with the help Solar, Small Hydro
Power, Wind Power and other renewable sources.
Table 4.1
All India Total Installed capacity (in MW) as on 30.06.2019 Sources Sectors / Ownership Sectors / Ownership
(As Percentage of Total)
State Private Central Total State Private Central Total
The
rmal
Coal 64076.5 74733.0 55680.0 194489.5 61.0 45.0 64.3 54.3
Lignite 1290.0 1830.0 3140.0 6260.0 1.2 1.1 3.6 1.7
Gas 7118.7 10580.6 7237.9 24937.2 6.8 6.4 8.4 7.0
Diesel 363.9 273.7 0.0 637.6 0.3 0.2 0.0 0.2
Thermal Total 72849.1 87417.3 66057.9 226324 69.3 52.6 76.3 63.2
Nuclear 0.0 0.0 6780.0 6780.0 0.0 0.0 7.8 1.9
Hydro 29878.8 3394.0 12126.4 45399.2 28.4 2.0 14.0 12.7
RES* (MNRE) 2348.9 75390.7 1632.3 79371.9 2.2 45.4 1.9 22.2
Grand Total 105076.9 166202.0 86596.6 357875.5 100.0 100.0 100.0 100.0
Note: * RES include SHP, BP, U&I, Solar and Wind Energy. Installed capacity in respect of RES (MNRE) as on 31.05.2019 Source: http://cea.nic.in/reports/monthly/installedcapacity/2019/installed_capacity-06.pdf
4.3.2 Transport
The transport infrastructure is one of the essential parts of the growth and
development of a country. The Transport system is considered as the artery and nerves
covering the entire economy of the country. A well-developed transport system not only
helps in the movement of men and materials from one place to another rather it acts as an
engine for the growth as well as the development of the region and also provides linkages
between one region to another. The country like India where there is diversity, transport
infrastructure play crucial role to maintain unity in it. In India we have found four types of
transport system i.e., Railways, Roadways, Waterways and Airways. For the sustained
economic growth of a country, a well connected and efficient transport system is needed.
India has a good network of rail, road, waterways and airways. The four types of
infrastructure can be discussed as follows:

91
a) Railways
Among all the transport systems of the country, Railways occupy the most important
position as it carries nearly 80 percent of total goods traffic and 70 percent of the passenger
traffic. Indian Railways had started its operation in April 16, 1853 with its first Railwys route
of 22 miles (34 kms) from the then Bombay (now Mumbai) to Thane. Over the period of
time , the Indian Railways System has grown into such a big organisation that it has become
Asia’s largest and world’s second largest organisation in terms of its route length. The total
route length of Indian Railways which was 53,600 km in 1950-51, gradually rose to 68442
km in 2017-18 . Out of the total route length, Broad gauge covers 63491 km, Meter gauge
covers 3200 km and narrow gauge covers 1751 kms. For the better management of Indian
Railways, in 1952, the rail networks were divided on the basis of different zones. A total of
six zones came into being in 1952. Again on 6 September 2003 six further zones were made
from existing zones for administration purpose and one more zone added in 2006. The Indian
Railways now has 16 railways zones. These is explain in the table below with its zone and the
zonal headquarter.
Table 4.2
Railway Zones and its Zonal Headquarter No. Name of the Railway Zone Zonal Headquarter
1 Central Railway Mumbai
2 Eastern Railway Kolkata
3 East Central Railway Hajipur
4 East Coast Railway Bhubaneshwar
5 Northern Railway Baroda House, New Delhi
6 North Central Railway Allahabad
7 North Eastern Railway Gorakhpur
8 North Frontier Railway Maligaon, Guwahati
9 North Western Railway Jaipur
10 Southern Railway Chennai
11 South Central Railway Secunderabad
12 South Eastern Railway Garden Reach, Kolkata
13 South East Central Railway Bilaspur
14 South Western Railway Hubli
15 Western Railway Churchgate
16 West Central Railway Jabalpur
Source: www.indianrailways.gov.in
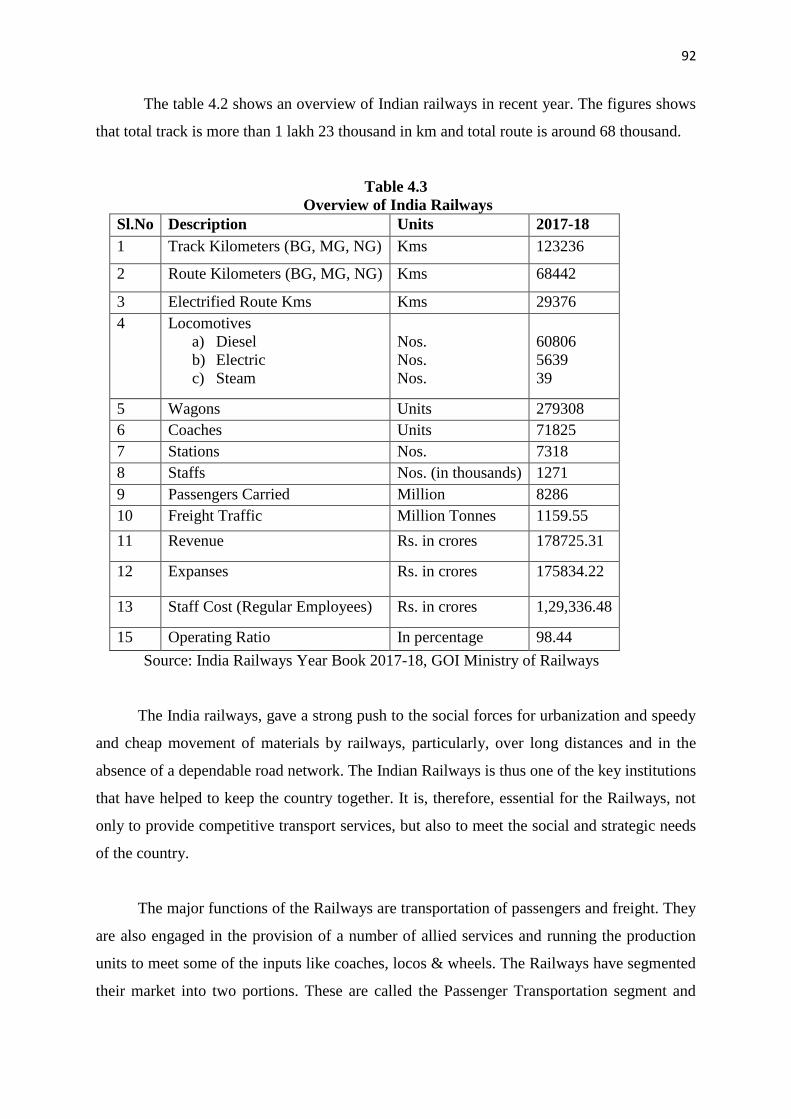
92
The table 4.2 shows an overview of Indian railways in recent year. The figures shows
that total track is more than 1 lakh 23 thousand in km and total route is around 68 thousand.
Table 4.3
Overview of India Railways
Sl.No Description Units 2017-18
1 Track Kilometers (BG, MG, NG) Kms 123236
2 Route Kilometers (BG, MG, NG) Kms 68442
3 Electrified Route Kms Kms 29376
4 Locomotives
a) Diesel
b) Electric
c) Steam
Nos.
Nos.
Nos.
60806
5639
39
5 Wagons Units 279308
6 Coaches Units 71825
7 Stations Nos. 7318
8 Staffs Nos. (in thousands) 1271
9 Passengers Carried Million 8286
10 Freight Traffic Million Tonnes 1159.55
11 Revenue Rs. in crores 178725.31
12 Expanses Rs. in crores 175834.22
13 Staff Cost (Regular Employees) Rs. in crores 1,29,336.48
15 Operating Ratio In percentage 98.44
Source: India Railways Year Book 2017-18, GOI Ministry of Railways
The India railways, gave a strong push to the social forces for urbanization and speedy
and cheap movement of materials by railways, particularly, over long distances and in the
absence of a dependable road network. The Indian Railways is thus one of the key institutions
that have helped to keep the country together. It is, therefore, essential for the Railways, not
only to provide competitive transport services, but also to meet the social and strategic needs
of the country.
The major functions of the Railways are transportation of passengers and freight. They
are also engaged in the provision of a number of allied services and running the production
units to meet some of the inputs like coaches, locos & wheels. The Railways have segmented
their market into two portions. These are called the Passenger Transportation segment and

93
Freight Transportation segment. In the Passenger segment, the Railways have positioned
themselves as carriers of suburban traffic at low cost and as transporters of passengers over
long leads. In the Freight segment, the Railways have positioned themselves as carriers of
large quantities of bulk commodities. The main function of India railways are as follows:
i) Passenger Transportation: Indian Railways operate, around 12000 passenger trains
and transport 23 million passengers daily connecting more than 7000 station. The
passenger services can be segmented into two parts. The second-class and
unreserved travel forms the value segment while all other classes form the premium
segment. The passengers on the Railways come, mainly, from four different
categories namely: Rural passengers, urban commuters, Inter-city business travellers
and long distance passengers.
ii) Freight Transportation: Freight transportation forms a major part of the Railways'
business and accounts for about 68 percent of its revenue. The Railways meet,
approximately, 40 percent of the nation's transportation needs.. The freight business
of the Railways can be classified into two categories. These are bulk commodities
and other cargo. The bulk commodities consist of coal, iron and steel, cement,
fertilizers, food grains, petroleum products and other commodities like iron ore,
limestone etc,. The share of the bulk commodities in the Railways' business has been
increasing in the recent times. Coal, alone, accounts for almost half of the bulk
traffic carried. The share of the bulk commodities in the Railways has increased in
the recent years as the Railways have concentrated on trainloads rather than
wagonloads. A sizable share of the bulk commodities is shipped by the public sector
undertakings. The freight customer are, an industry or an enterprise who wants a
reliable and cost effective transport of the goods from their originating points to the
destinations. In the recent past, due to the liberalization of the economy, the freight
customers have become much more demanding in terms of cost as well as quality of
service. This has necessitated a fresh look by the Indian Railways at the service
being provided by them.
b) Road Ways
The Indian road network, comprising of National Highways, Expressways, State
Highways, Major District Roads, Other District Roads and Village Roads, is globally the
2nd largest spanning 5.5 million kilometres. India’s road infrastructure has seen consistent
improvement in the last few years. Connectivity has improved and road transportation has
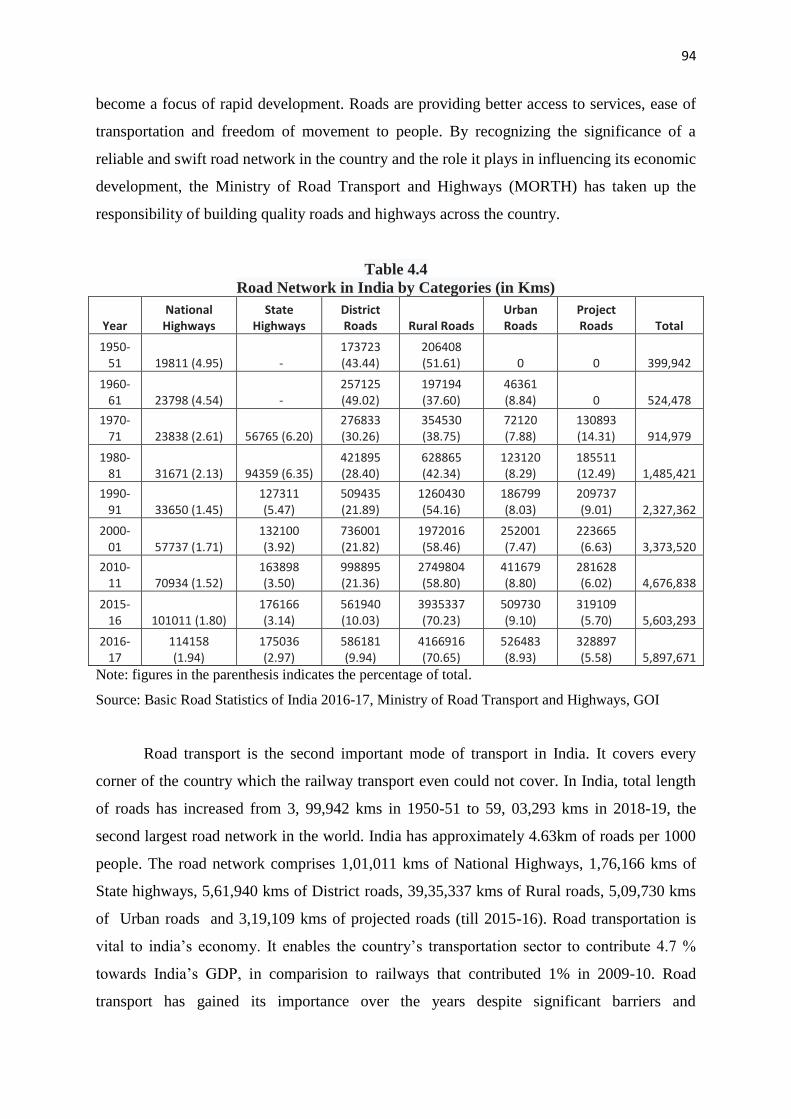
94
become a focus of rapid development. Roads are providing better access to services, ease of
transportation and freedom of movement to people. By recognizing the significance of a
reliable and swift road network in the country and the role it plays in influencing its economic
development, the Ministry of Road Transport and Highways (MORTH) has taken up the
responsibility of building quality roads and highways across the country.
Table 4.4
Road Network in India by Categories (in Kms)
Year National Highways
State Highways
District Roads Rural Roads
Urban Roads
Project Roads Total
1950-51 19811 (4.95) -
173723 (43.44)
206408 (51.61) 0 0 399,942
1960-61 23798 (4.54) -
257125 (49.02)
197194 (37.60)
46361 (8.84) 0 524,478
1970-71 23838 (2.61) 56765 (6.20)
276833 (30.26)
354530 (38.75)
72120 (7.88)
130893 (14.31) 914,979
1980-81 31671 (2.13) 94359 (6.35)
421895 (28.40)
628865 (42.34)
123120 (8.29)
185511 (12.49) 1,485,421
1990-91 33650 (1.45)
127311 (5.47)
509435 (21.89)
1260430 (54.16)
186799 (8.03)
209737 (9.01) 2,327,362
2000-01 57737 (1.71)
132100 (3.92)
736001 (21.82)
1972016 (58.46)
252001 (7.47)
223665 (6.63) 3,373,520
2010-11 70934 (1.52)
163898 (3.50)
998895 (21.36)
2749804 (58.80)
411679 (8.80)
281628 (6.02) 4,676,838
2015-16 101011 (1.80)
176166 (3.14)
561940 (10.03)
3935337 (70.23)
509730 (9.10)
319109 (5.70) 5,603,293
2016-17
114158 (1.94)
175036 (2.97)
586181 (9.94)
4166916 (70.65)
526483 (8.93)
328897 (5.58) 5,897,671
Note: figures in the parenthesis indicates the percentage of total.
Source: Basic Road Statistics of India 2016-17, Ministry of Road Transport and Highways, GOI
Road transport is the second important mode of transport in India. It covers every
corner of the country which the railway transport even could not cover. In India, total length
of roads has increased from 3, 99,942 kms in 1950-51 to 59, 03,293 kms in 2018-19, the
second largest road network in the world. India has approximately 4.63km of roads per 1000
people. The road network comprises 1,01,011 kms of National Highways, 1,76,166 kms of
State highways, 5,61,940 kms of District roads, 39,35,337 kms of Rural roads, 5,09,730 kms
of Urban roads and 3,19,109 kms of projected roads (till 2015-16). Road transportation is
vital to india’s economy. It enables the country’s transportation sector to contribute 4.7 %
towards India’s GDP, in comparision to railways that contributed 1% in 2009-10. Road
transport has gained its importance over the years despite significant barriers and
95
inefficiencies in inter-state freight and passenger movement compared to railways and air.
India’s road network carries over 65 % of its freight and about 85 % of passenger traffic.
The figure in the tables shows the growth of road network since form the time of
independence. It shows that out of total road length rural roads has high in percentage term,
which implies that government stress much on rural connectivity through road network. In
the year 2016-17 rural roads constitute around 70 percent followed by district road (around
10 percent), urban road (around 9 percent), and project roads (6 percent). The figure of
preceding years also follows the same trend of road network in India.
In the recent years government of India undertake major initiative in order to develop
road development. The following are main initiatives are as follows:
1. National Highway Development Projects (NHDP)
The seven phased NHDP is being implemented by the National Highways Authority
of India (NHAI) with a total estimated expenditure of USD 92 billion. It is one of the
largest highway development project in the country since 2000, more than 49,260 km of
the roads are being upgraded to match international standards. The main key project
under NHDP are:
a) Golden Quadrilateral connecting 4 major metropolitan cities viz. Delhi-Mumbai-
Chennai-Kolkata. North South & East West Corridors (NS-EW) connecting
Srinagar to Kanyakumari and Silchar to Porbandar with a spur from Salem to
Cochin.
b) Road connectivity of major ports of the country to National Highways
c) Four-laning of 4,000 km of National Highways up gradation of about 20,000 km
of National Highways to 2-lane paved shoulder
d) Six laning of 6,500 km of existing 4 lane National Highways
e) Development of 1,000 km of fully access controlled expressways under Public
Private Partnership (PPP) model following Design – Build – Finance – Operate
(DBFO) approach. Nine such expressways have been identified along High-
Density Corridors. These corridors will seek to ensure quicker connectivity.
2. Development of Roads in Challenging Terrain
MORTH’s role is crucial in states with hilly terrains as many of these places have
cultural, religious and economic relevance. Further, the roads in hilly areas are
strategically significant due to its proximity to international borders and defence

96
establishments. The Ministry conducted a detailed review of the road network in
Uttarakhand, Himachal Pradesh and Uttar Pradesh with an aim to improve road
connectivity to coastal/border areas, backward areas, religious places, tourist places,
construction / rehabilitation / widening of about 1500 major bridges, 208 Railway
over Bridges (ROBs) and Railway under Bridges (RUBs) and improvement of newly
declared NHs and providing them connectivity to District Head Quarters. The
Bharatmala Pariyojana envisages a “Connectivity Improvement Programme” for
Char-Dham (Kedarnath, Badrinath, Yamunothri& Gangothri in Uttarakhand).
3. Special Accelerated Road Development Programme for North-East (SARDP-
NE)
Improving road and transport infrastructure in the North-East India is a priority for the
Government of India. MORTH plans to upgrade 10,141 km of roads in the region
through three phased SARDP-NE, which aims to improve road connectivity in all
district headquarters in the North Eastern region. ‘Phase A’ of the project includes up
gradation of 4,099 km of road at an estimated cost of USD 3.3 billion. It is expected
to be completed by March 2021. Another 3,723 km of road stretch has been approved
at an estimated budget of USD 9.8 million under the Phase B13. The third phase is the
“Arunachal Pradesh Package of Roads and Highways” under which road construction
of 2319 km road has been approved.
Taking ahead the Prime Minister’s vision to develop North-East India as a
gateway to South-East Asia, the government is implementing the Kaladan Multi
Modal Transit Transport Project to connect Kolkata and Sittwe Port in Myanmar at an
estimated cost of USD 82 million. The project involves constructing more than 200
km long road which passes through the Indo-Myanmar border.
c) Water Transport
Water transport is the oldest mode of transport and also one of the cheapest in today’s
world. The cost of operation of water transport is very less. At p-resent water transport in
India may be divided into two groups:
a. Inland water transport or River transport
b. Coastal or Marine transport

97
Inland water transport is the cheapest among all modes of transport. It is considered as
very useful mode for carrying bulky and heavy commodities of low grade like coal, rae ores,
timber etc. from the point of view of energy consumption Inland Water Transport is now
considered as one of the most efficient modes of transport. Moreover, Inland Water Transport
is a labour intensive mode of transport. The total navigable length is 14,500 km out of which
about 5200 km of the river and 4000 km of canals can be used by mechanised crafts. The
important navigable rivers in India are the Ganga and Brahmaputtra and their tributaries, the
Krishna and Godavari and their Canals, the West-coast and Mahanadi Canals in Orissa, the
Narmada and Tapti, the backwaters and Canals of Kerela, the Buckingham Canal in Tamil
Nadu and Andhra Pradesh. On the other hand, the importance of coastal or marine transport
in India is very high. India has total coastline of 4200 miles and huge volume of international
trade. Twelve major and 185 minor ports provide infrastructural support to these routes.
Approximately 95% of India’s foreign trade by volume and 70% by value moves through
ocean routes. Apart from international trade, these are also used for the purpose of
transportation between the island and the rest of the country.
d) Air Transport
Air transport is the quickest mode of transport for movement of passenger and cargo
traffic, is broadly structured into three distinct functional entities, Viz., regulatory, cum-
development, operational and infrastructure. In India, civil aviation started in 1920 with the
construction of some aerodromes by the Government. In 1927 civil aviation department was
set up. Airport Authority of India (AAI) is a leader PSU under the Ministry of Civil Aviation
engaged in development, building airport infrastructure and managing airport across the
length and breadth of the country including remote and far flung areas. AAI came into
existence in 1995 with the merger of two authorities viz., National Airport Authorities and
International Airport Authority of India. The AAI is a major airport operator managing 126
airport including 21 international airports, 8 customs airports, 78 domestic airports and 19
civil enclaves at military airfields (AAI annual report,2016-17).
4.4 Financial Infrastructure
Financial Infrastructure is an umbrella term involving many institutions, instruments,
markets and variety of services (finance and finance related) provided through them. The
major component of financial infrastructure of the country is the financial institutions.
Financial institutions are two types- banking institutions and non-banking institutions. The
banking institutions cover the central, commercial and co-operative banks. These institutions

98
affect the economy by changing the supply of money. On the other hand non-banking
institutions included insurance companies, pension funds, mutual funds and other term
lending institutions. This type institution affects the economy by changing the demand for
money.
An efficient financial system can influence the long-term growth through three
important channels, namely: 1) increase in the proportion of saving transferred to investment
spending, 2) augmenting private saving rate, and 3) improvement in the social marginal
productivity. The financial intermediaries stimulate economic growth in two ways: (i) by
channeling the individual saving into productive areas of development and (ii) by allowing
the individuals to reduce risk associated with their liquidity needs.
The creation of specialised financial institutions assumes significance in this regard
because supply of credit to the poor involves high risk and carries exorbitant interest rates.
The task of the special financial institutions would be to identify impediments to enhancing
the productivity of existing assets and to find ways and means to overcome these and
simultaneously to promote viable economic activities for the rural poor.
4.5 Social Infrastructure
Social Infrastructure comprises of health, education, drinking water supply, sanitary
conditions and social and personal services. Here, we will discuss briefly, some of these
sectors.
Health
In India there has been manifold increase in the health facilities. There has been a
development in all types of pathology: Allopathy, Ayurveda, Homeopathy and Unnani. All
these various methods of treatment of human illness have developed over the period.
According to the latest data, estimated birth rate, death rate and natural growth rate are
showing a decline trend. Estimated birth rate declined from 25.8 in 2000 to 20.4 in 2016
while the death rate declined from 8.5 to 6.4 per 1000 population over the same period. The
natural growth rate declined from 17.3 in 2000 to 14 in 2016 as per the latest available
information.

99
The SRS (2016) shows that the total fertility rate in 12 States has fallen below two
children per women and 9 States have reached 2.1 and above. The Maternal Mortality Ratio
(MMR) has shown a decrease of 11 points during 2010-12 to 2011-13. According to the latest
data available MMR is highest in Assam i.e., 300 per 1 lakh live births and lowest in Kerela
i.e., 61 per 1 Lakh live births in 2011-13.Infant Mortality Rate (IMR) has declined
considerably i.e., 37 per 1000 live births in 2015; however, there is a huge gap between IMR
of rural (41 per 1000 live births) and urban (25 per 1000 live births). The improvement in
health indicators such as life expectancy, IMR, MMR due to increasing penetration of health
care services across the country, increase the numbers of hospitals in India, growing literacy
among the peoples and implementation of various government health service plans or policies
like- Janani Surakhsha Yojona, provide free medicines and Ambulance , insurance facilities
on major diseases provided by the Government such as AYUSHMAN.
Education
Education is another important social infrastructure. In the education sector, the most
important physical infrastructure is educational institutions. When we look at the figures of
expansion in schools, we find that number of schools (these are primary, upper primary,
secondary and senior secondary schools) have increased from 2.31 lakh in 1951 to 15.22 lakh
in 2015-16. On the other hand, total number of institutions for higher education in India was
51793. Out of which, 799 are Universities (Both Central & State and Deemed University),
39071 were colleges and 11923 were stand alone institutions (like-PGDM and Diploma
degree institutions). As per All India Survey on Higher Education (AISHE) 2017-18, the
Gross Enrolment Ration in higher education has increased from 24.5 percent in 2015-16 to
25.8 percent in 2017-18.
The literacy rate has gone up from only 18.33 per cent in 1951 to 74.04 per cent in
2011, yet it is also true that this rate of growth is extremely slow and India could not achieve
full literacy even after more than 65 years of independence. This also means that India has
the dubious distinction of having the largest number of illiterates in the world. This becomes
clear when we find that India’s Adult and Youth literacy rates are 72.1 and 86.1 percent
respectively, while these rates for Sri Lanka are as high as 92.6 and 98.8 percent respectively.

100
4.6 Institutional Infrastructure: Market
In Indian context market can be divided into two:
i) Money Market
ii) Capital Market
The Money market and Capital market can be discussed in detail
1. Money market:
The Money Market is a market for lending and borrowing of short-term funds. It deals
in funds and financial instruments having a maturity period of one day to one year. It covers
money and financial assets that are close substitutes for money. The instruments in the money
market are of short term nature and highly liquid. The Indian money market consists of two
segments, namely organized sector and unorganized sector. The RBI is the most important
constituents of Indian money market. The organized sector is within the direct purview of
RBI regulation. The unorganized sector comprises of indigenous bankers, money lenders and
unregulated non-banking financial institutions.
The main components of organized money can be discussed as under:
a) Call and Notice Money Market: Under call money market, funds are transacted on
overnight basis. Under notice money market funds are transacted for the period
between 2 days and 14 days. The funds lent in the notice money market do not have a
specified repayment date when the deal is made. The lender issues a notice to the
borrower 2-3 days before the funds are to be paid. On receipt of this notice, the
borrower will have to repay the funds within the given time. Generally, banks rely on
the call money market where they raise funds for a single day. The main participants
in the call money market are commercial banks (excluding RRBs), co-operative banks
and primary dealers. Discount and Finance House of India (DFHI), Non-banking
financial institutions such as LIC, GIC, UTI, NABARD etc. are allowed to participate
in the call money market as lenders.
b) Treasury Bills (T-Bills): Treasury bills are short-term securities issued by RBI on
behalf of Government of India. They are the main instruments of short term
borrowing by the Government. They are useful in managing short-term liquidity. At
present, the Government of India issues three types of treasury bills through auctions,

101
namely – 91 days, 182-day and 364-day treasury bills. There are no treasury bills
issued by state governments. With the introduction of the auction system, interest
rates on all types of TBs are being determined by the market forces.
c) Commercial Bills: Commercial bill is a short-term, negotiable, and self-liquidating
instrument with low risk. They are negotiable instruments drawn by a seller on the
buyer for the value of goods delivered by him. Such bills are called trade bills. When
trade bills are accepted by commercial banks, they are called commercial bills. If the
seller gives some time for payment, the bill is payable at future date (i.e. usance bill).
Generally the maturity period is upto 90 days. During the usance period, if the seller
is in need of funds, he may approach his bank for discounting the bill. Commercial
banks can provide credit to customers by discounting commercial bills. The banks can
rediscount the commercial bills any number of times during the usance period of bill
and get money.
d) Certificates of Deposits (CDs): CDs are unsecured, negotiable promissory notes
issued at a discount to the face value. They are issued by commercial banks and
development financial institutions. CDs are marketable receipts of funds deposited in
a bank for a fixed period at a specified rate of interest. CDs were introduced in India
in June 1989. The main purpose of the scheme was to enable commercial banks to
raise funds from the market through CDs. According to the original scheme, CDs
were issued in multiples of Rs.25 lakh subject to minimum size of an issue being Rs.1
crore. They had the maturity period of 3 months to one year. They are freely
transferable but only after the lock in period of 45 days after the date of issue.
e) Commercial Paper (CP) is an unsecured money market instrument issued in the form
of a promissory note with fixed maturity. They indicate the short-term obligation of
an issuer. They are quite safe and highly liquid. They are generally issued by the
leading, nationally reputed, highly rates and credit worthy large manufacturing and
finance companies is the public as well as private sector.
f) Repos: A repo or reverse repo is a transaction in which two parties agree to sell and
repurchase the same security. Under repo, the seller gets immediate funds by selling
specified securities with an agreement to repurchase the same at a mutually decided
future date and price. Similarly, the buyer purchases the securities with an agreement
to resell the same to the seller at an agreed date and price. The repos in government
securities were first introduced in India since December 1992. Since November 1996,
102
RBI has introduced “Reverse Repos”, i.e. to sell government securities through
auction.
g) Discount and Finance House of India (DFHI): It was set up by RBI in April 1988 with
the objective of deepening and activating money market. It is jointly owned by RBI,
public sector banks and all India financial institutions which have contributed to its
paid up capital. The DFHI deals in treasury bills, commercial bills, CDs, CPs, short-
term deposits, call money market and government securities. The presence of DFHI as
an intermediary in the money market has helped the corporate entities, banks, and
financial institutions to invest their short-term surpluses in money market instruments.
The unorganized money market can be discussed as under:
a) Indigenous Bankers: They are financial intermediaries which operate as banks,
receive deposits and give loans and deals in hundies. The hundi is a short term credit
instrument. It is the indigenous bill of exchange. The rate of interest differs from one
market to another and from one bank to another. They do not depend on deposits
entirely, they may use their own funds.
b) Money Lenders: They are those whose primary business is money lending. Money
lenders predominate in villages. However, they are also found in urban areas. Interest
rates are generally high. Large amount of loans are given for unproductive purposes.
The borrowers are generally agricultural labourers, marginal and small farmers,
artisans, factory workers, small traders, etc.
c) Unregulated non-bank Financial Intermediaries: These consist of Chit Funds, Nidhis,
Loan companies and others.
2. Capital Market
Capital market is the market for medium and long term funds. It refers to all the facilities
and the institutional arrangements for borrowing and lending term funds (medium-term and
long-term funds). The demand for long-term funds comes mainly from industry, trade,
agriculture and government. The central and state governments invest not only on economic
overheads such as transport, irrigation, and power supply but also a basic and consumer
goods industries and hence require large sums from capital market. The supply of funds
comes largely from individual savers, corporate savings, banks, insurance companies,

103
specialized financial institutions and government. Capital market has a crucial significance
to capital formation. Adequate capital formation is indispensable for a speedy economic
development. The main function of capital market is the collection of savings and their
distribution for industrial development. This stimulates capital formation and hence,
accelerates the process of economic development.
The Indian Capital market is divided into two categories:
1) Securities Market 2) The Financial Institution
The securities market consists of the gilt-edge market and the industrial securities market. On
the other hand development financial institution includes such as IFCI, SFC, LIC, IDBI, UTI,
ICICI, etc. They provide medium-term and long-term funds for business enterprises and
public authorities. Apart from the above, there are financial intermediaries in the capital
market such as merchant bankers, mutual funds, leasing companies, venture capital
companies etc. They help in mobilizing savings and supplying funds to investors.
4.7. Financing Infrastructure: Problems and Policies
The government has been the sole financier of infrastructure projects along with being
responsible for implementation, operations and maintenance. There is a paradigm shift in
recognising that this method may not be the best way to execute/finance such mega projects.
The government has made several attempts to create an environment for sustainable and
scalable involvement of the private players in infrastructure development within the country.
Typically, infrastructure finance would be for the infrastructure projects depending on
manufacturing projects, expansion and modernization projects carried out by infrastructure
undertakings in India. Infrastructure finance is highly capital intensive and entails longer
maturity with higher risk and prolonged real rate of returns.
Given the issues surrounding supply of risk-free capital and supply of funds, the
manner in which these scarce resources can be procured is a very important question. With
this constraint, no single entity has sufficient capital to meet large requirements of
infrastructure finance in the country by venturing into risk for large number of investors. In
order to meet the requirements, development of markets/mechanism for long-term finance
becomes imperative and urgent.

104
Infrastructure deficit is one of the leading development challenges at present
for India. Infrastructure plays a crucial role in economic development of a country. In India,
too like many other countries, Infrastructure development is a critical aspect of our growth
strategy and therefore, the sector gets the importance from all stakeholders commensurate
with that role. Traditionally, the government through the budgetary expenditure was
making infrastructure investment. But the present requirement is very huge for the
government and over the last few years, several measures were made by the
government to mobilize finance. In order to make finance in the infrastructure
projects, the government and the private aims to make borrowing from the banking
system, capital market, ECBs (External Commercial Borrowings) etc. India’s
financial system is dominated by banks and also the Non Bank Financial Company’s
(NBFCs) too play an important part in infrastructure financing. There are NBFCs that
specialize in financing infrastructure and certain sector specific NBFCs in the Government
Sector. Of course, banks are the predominant providers of finance to the infrastructure sector.
The flow of bank finance to infrastructure sector has clocked high growth rates. A few
economic characteristics differentiate infrastructure assets from other asset classes. These
characteristics also make it more difficult to match investment demand and financing supply:
Firstly, infrastructure projects are often complex and involve a large number of parties.
Infrastructure often comprises natural monopolies such as highways or water supply, and
hence governments want to retain the ultimate control to prevent an abuse of monopoly
power. This requires complex legal arrangements to ensure proper distribution of payoffs and
risk-sharing to align the incentives of all parties involved.
Secondly, infrastructure projects are long term and are therefore subject to various risks
including those due to changes in policies, delays in clearances, etc. Every event that delays
the implementation of a project leads to cost and time overruns that in turn have a bearing on
the techno-economic viability of the project or would necessitate revision in the price of the
end-product. Very often the infrastructure products are meant to serve public good which
imposes a limitation on ability to determine their price.
Thirdly, where debt financing is dominated by the banking system, the fundamental problem
posed by the asset-liability mismatch is critical. In India, the dominance of PSBs may partly
105
offset this risk because the perceived assurance of government backing provides the requisite
flow of deposits.
4.8 Sources of Infrastructure Finance
The important sources of infrastructure finance in India as shown below:
A. Domestic Sources:
i) Equity Funds:
1. Domestic investors (independently or in collaboration with international investors)
2. Public utilities
3. Dedicated Government Funds
4. Other institutional investors.
ii) Debt Funds:
1. Domestic commercial banks (3-5 year tenure)
2. Domestic term lending institutions (7-10 year tenure)
3. Domestic bond markets (7-10 year tenure)
4. Specialized infrastructure financing institutions such as infrastructure debt funds
B. External Sources:
i) Equity Funds:
1. Foreign investors (independently or in collaboration with domestic investors)
2. Equipment suppliers (in collaboration with domestic or international developers)
3. Dedicated infrastructure funds
4. Other international equity investors
5. Multilateral agencies
ii) Debt Funds:
1. International commercial banks (7-10 year tenure)
2. Export credit agencies (7-10 year tenure)
3. International bond markets (10-30 year tenure)
4. Multilateral agencies (over 20 year tenure)
C. Infrastructure Bonds:
Some bonds have a special provision that allows the investor to save on tax.
These are termed as tax-saving bonds, and are widely used by individual investors as
a tax-saving tool. Infrastructure bonds are available through issues of ICICI and IDBI,
brought out in the name of ICICI Safety Bonds and IDBI Flexi Bonds. These provide

106
tax-saving benefits under Section 80C of the Income-tax Act, 1961, for the investor.
Deep Discount Bonds are suitable for an increase in investment.
These bonds, which are sold at a discount on their face value, are redeemed at
their face value on maturity of the instrument, the difference being gain. Infrastructure
bonds do not offer any protection against high inflation since the rate of interest they
offer is predetermined, and is not indexed for inflation. One can borrow against
infrastructure bonds by pledging them with a bank. The amount depends on the
market value of the bond and the credit quality of the instrument.
Although Infrastructure Bonds are considered to be pretty safe, ICICI and
IDBI bonds are unsecured instruments. The value of the bond is subject to market
forces, if it is to be sold before maturity. One should check the credit rating of such
instruments before taking an investment decision. Since both ICICI and IDBI are
considered to be financially healthy institutions, income from bonds issued by these
institutions is regular. If the bonds have a Call option, it implies that the issuer has the
right to prematurely redeem the bonds if it so desires. Inflation and interest rate
movements are the two significant economic factors that play a vital role in the
investment decisions of Infrastructure Bonds.
The Government and the RBI have made the following efforts to attract investment
into the sector:
1. Setting up of India Infrastructure Finance Company Limited (IIFCL).
2. The National Investment and Infrastructure Fund (NIIF) has been approved to extend
equity support to infrastructure Non-Bank Financial Companies (NBFC). Issue of tax-
free infrastructure bonds has been allowed for rail, roads and irrigation programmes.
3. Issue of rupee denominated bonds in overseas markets.
4. Infrastructure bonds to be issued by IFCI (Industrial Financial Corporation Limited),
LIC, and IDFC (Infrastructure Development Finance Corporation) with tax deduction
incentives for individual tax payers.
5. Promotion of FDI in the infrastructure sector: To facilitate infrastructure financing
100 per cent FDI is allowed under the automatic route in some of the sectors such as
mining, power, civil aviation sector, construction and development projects, industrial
parks, petroleum and natural gas sector, telecommunications, railways and special
economic zones.
6. RBI promotes bank lending for the infrastructure sector.
107
7. Viability Gap funding
8. Liberalized ECB (External Commercial Borrowings) regime for infrastructure
companies. Companies can avail upto $ 750 million for infrastructure projects.
9. Use of foreign exchange reserves for infrastructure projects through (IIFCL)
10. The RBI has categorized infrastructure lending NBFCs into a special category and
allowed concessional type of operations to them.
11. The central government has successively increased its allocation for the sector in each
budget. The budget 2016-17 allocates nearly Rs 2 lakh crore with road sector itself
getting Rs 70000 crore funds from the budget.
12. FIIs are allowed to invest in infrastructure debt funds. Besides, QFIs are also
encouraged to make investment in the sector especially through financing of bonds.
13. Take out financing scheme.
14. Green bond scheme.
4.9 key words:
Physical Infrastructure: it refers to the basic structure required for an economy to
function and service.
Social Infrastructure: the construction and maintenance of facilities that support social
services like health care, education etc.
Financial Infrastructure: it signifies financial assets, financial market and financial
intermediaries.
4.10 Suggested Readings
Annual Reports on India Railways, Various years, www.indianrailways.gov.in
Basic Road Statistics of India 2016-17, Ministry of Road Transport and Highways,
GOI
Handbook of Statistics on Indian Economy, Various Years Reserve Bank of India
http://cea.nic.in/reports/monthly/installedcapacity/2019/installed_capacity-06.pdf
https://www.ibef.org/download/Infrastructure-Report-April-2018.pd
India Infrastructure Report, Various Years
SRS Bulletin, Various Years.

108
UNIT-V
PUBLIC FINANCE AND ECONOMIC REFORMS
Structure
5.0 Objectives
5.1 Introduction
5.2 Trends in Revenue and Expenditure of Central and State Governments
5.3 Public Debt
5.4 Tax Reforms in India
5.5 Deficit Financing and Price Behaviour in India:
5.6Economic Reforms:
5.6.1 Evaluation of Economic Reforms:
5.7 WTO and Indian Economy
5.8 Foreign Capital and MNCs (Multi-national Corporations):
5.9 Questions
5.10Key Words
5.11 Suggested Readings
5.0 Introduction
With the increase in responsibilities of government, their activities are also increasing.
As a results, government budget become more and more important. Today government
budget is much more than a statement of income and expenditure (Choudhaury, 2012).
Government budget reflects taxation, public expenditure policy along with future course of
actions. The budget of union government consists of:
(i) Revenue Budget: Revenue budget is the estimates of receipts and disbursement
relating to revenue account. The revenue receipts of union government are broadly tax
revenue and non-tax revenue. Tax revenue are those revenue receipts which are either
from direct taxes or indirect taxes which includes taxes on income, taxes on property
and capital transactions and taxes on securities and commodities. On the other hand,
non-tax revenues are the revenue collected from sources other than taxes. Non- tax
revenues are divided in to fiscal and other services, interest receipts and dividends
and profit. However, for state government, apart from own tax and own non- tax
revenue, revenue receipts include transfer payments from the centre.

109
(ii) Capital Budget: Capital budget is the estimates of receipts and disbursement relating
to capital account. Capital receipts are non-recurring.
To fulfill the targets set in the budget, government need to spend money, i.e., public
expenditure. Thus, public expenditure has a very important role to attain the goals of a
country like growth, development, equity and stability. The expenditure by government are
broadly:
(i) Revenue Expenditure: Revenue expenditures are those expenditures which neither
create any assets nor reduce liability. For example, salaries of employees, interest
payment on past debt, subsidies, pension etc.
(ii) Capital expenditure: Capital expenditure are those expenditures which create an
asset or reduces liabilities. For example, school building, repayment of loan.
5.1Objectives
The students are expected to acquaint themselves about the various facets of public
finance; including the various fiscal and monetary handles, including the basis of structural
reforms and the increasing role of multinational corporations at the backdrop of
globalization. As such, the students will learn:
Trends in revenue and expenditure of central and state governments
Public debt
Characteristics of tax reforms in India
Deficit financing and price behaviour in India: Consequences and policy suggestions
Foreign capital and MNCs in India
5.2 Trends in Revenue and Expenditure of Central and State Governments
Central Governments:
Table 5.1 highlights the revenue receipts as a percentage of GDP of central
government. The revenue receipts of central government in last few years were erratic as a
percentage of GDP. However, as a percentage of GDP, revenue receipts of union government
increased in 2014-15 (B.E) as compare to 2001-02. As a percentage of GDP, in 2001-02 total
revenue receipts of union government was 8.55 percent and it became 10.87 percent in 2008-
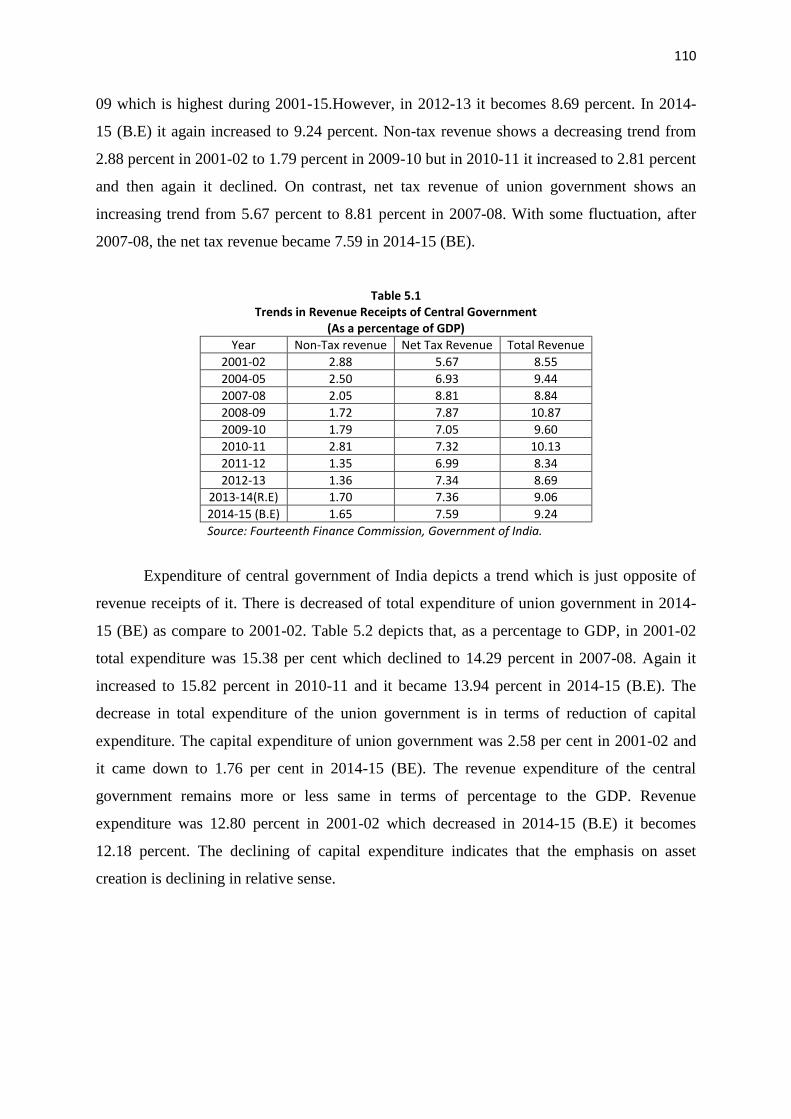
110
09 which is highest during 2001-15.However, in 2012-13 it becomes 8.69 percent. In 2014-
15 (B.E) it again increased to 9.24 percent. Non-tax revenue shows a decreasing trend from
2.88 percent in 2001-02 to 1.79 percent in 2009-10 but in 2010-11 it increased to 2.81 percent
and then again it declined. On contrast, net tax revenue of union government shows an
increasing trend from 5.67 percent to 8.81 percent in 2007-08. With some fluctuation, after
2007-08, the net tax revenue became 7.59 in 2014-15 (BE).
Table 5.1 Trends in Revenue Receipts of Central Government
(As a percentage of GDP)
Year Non-Tax revenue Net Tax Revenue Total Revenue
2001-02 2.88 5.67 8.55
2004-05 2.50 6.93 9.44
2007-08 2.05 8.81 8.84
2008-09 1.72 7.87 10.87
2009-10 1.79 7.05 9.60
2010-11 2.81 7.32 10.13
2011-12 1.35 6.99 8.34
2012-13 1.36 7.34 8.69
2013-14(R.E) 1.70 7.36 9.06
2014-15 (B.E) 1.65 7.59 9.24
Source: Fourteenth Finance Commission, Government of India.
Expenditure of central government of India depicts a trend which is just opposite of
revenue receipts of it. There is decreased of total expenditure of union government in 2014-
15 (BE) as compare to 2001-02. Table 5.2 depicts that, as a percentage to GDP, in 2001-02
total expenditure was 15.38 per cent which declined to 14.29 percent in 2007-08. Again it
increased to 15.82 percent in 2010-11 and it became 13.94 percent in 2014-15 (B.E). The
decrease in total expenditure of the union government is in terms of reduction of capital
expenditure. The capital expenditure of union government was 2.58 per cent in 2001-02 and
it came down to 1.76 per cent in 2014-15 (BE). The revenue expenditure of the central
government remains more or less same in terms of percentage to the GDP. Revenue
expenditure was 12.80 percent in 2001-02 which decreased in 2014-15 (B.E) it becomes
12.18 percent. The declining of capital expenditure indicates that the emphasis on asset
creation is declining in relative sense.

111
Table 5.2 Trends in Expenditure of Central Government
(As a percentage of GDP)
Year Revenue Expenditure Capital Expenditure Total Expenditure
2001-02 12.80 2.58 15.38
2004-05 11.85 3.50 15.35
2007-08 11.92 2.37 14.29
2008-09 14.10 1.60 15.70
2009-10 14.08 1.74 15.82
2010-11 13.37 2.01 15.38
2011-12 12.72 1.76 14.48
2012-13 12.30 1.65 13.95
2013-14 (R.E) 12.33 1.68 14.01
2014-15 (B.E) 12.18 1.76 13.94
Source: Fourteenth Finance Commission, Government of India.
State Government:
Table 5.3 Trends in Revenue Receipts of State Government
(As a percentage of GDP)
Year Own tax Revenue Own non-tax
Revenue
Total Own Revenue
Total Transfers from Union
Total Revenue Receipts
(1) (2) (3) (2+3) (5) (2+3+5)
2004-05 5.6 1.4 7.0 4.1 11.2
2005-06 5.7 1.3 7.0 4.6 11.6
2006-07 5.9 1.6 7.4 5.0 12.2
2007-08 5.8 1.5 7.3 5.2 12.5
2008-09 5.7 1.4 7.1 5.1 12.3
2009-10 5.6 1.4 7.0 4.8 11.7
2010-11 5.9 1.2 7.1 4.9 12.0
2011-12 6.2 1.1 7.3 4.9 12.2
2012-13 6.5 1.2 7.6 4.8 12.4
2013-14 (R.E) 6.6 1.2 7.8 5.4 13.2
2014-15(B.E) 6.5 1.2 7.7 6.5 14.2
Source: Fourteenth Finance Commission, Government of India.
Table 5.3 represents the revenue receipts of state government. The total revenue
receipts of the state governments as a per cent of GDP are increasing. Total revenue receipts
of state governments increased to 14.2 per cent in 2014-15 (B.E) from 11.2 per cent in 2004-
05. Looking into the broad components of revenue receipts of state governments, it is found
that own tax revenue and transfers from centre have increased but own non-tax revenue has
declined. The own revenue receipts of states increased from 7.0 percent in 2004-05 to 7.8
percent in 2013-14 (R.E) but again declined to 7.7 percent in 2014-15 (B.E). Own tax
revenue showed also an upward trend from 5.6 percent in 2004-05 to 6.6 percent in 2013-14
(R.E) and then it declined to 6.5 percent in 2014-15 (BE). Own non-tax revenue showed a

112
decreasing trend. In 2004-05, it was 1.4 percent and it has increased to 1.6 percent in 2006-
07. In 2014-15 (B.E), own non-tax revenue decreased to 1.2 per cent.
Table 5.4 Trends in Revenue and Capital Expenditure of State Government
( As a percentage of GDP)
Year Revenue Expenditure Capital Expenditure Total Expenditure
2004-05 12.4 2.3 14.7
2005-06 11.8 2.5 14.4
2006-07 11.7 2.5 14.3
2007-08 11.6 2.6 14.2
2008-09 12.1 2.8 14.9
2009-10 12.3 2.5 14.9
2010-11 12.0 2.2 14.1
2011-12 11.9 2.3 14.3
2012-13 12.2 2.2 14.4
2013-14 (R.E) 13.2 2.6 15.8
2014-15 (B.E) 13.9 2.7 16.7
Source: Fourteenth Finance Commission, Government of India.
Table 5.4 represents the trends in revenue and capital expenditure of state
governments. Total expenditure of state governments was 14.7 percent in 2004-05 and
remains more or less stable up to 2012-13. As per budget estimate of 2014-15, total
expenditure became 16.7 per cent of GDP. The increase in total expenditure of state
government is accompanied by both revenue expenditure and capital expenditure. Revenue
expenditure was 12.4 per cent in 2004-05 and in 2014-15 (B.E) it becomes 13.9 percent.
Similarly, capital expenditure increased from 2.3 per cent in 2004-05 to 2.7 percent in 2014-
15 (B.E).
5.3 Public Debt
Public debt refers to the borrowings of state governments either from internal sources
or from external sources. According to Raja. J. Chelliah, exponential growth of public debt
has arisen not merely because revenue expenditure has been running ahead of current
revenues but also because capital expenditures financed by borrowings have not yielded
adequate returns (Misra and Puri, 2008).
Debt obligation of central government
The debt obligation of union government can be divided broadly in to three
categories- Internal debt, External debt and other liabilities. However, as many experts
113
includes other liabilities in to internal debt in analysis of fiscal matter in India, the present
analysis also follow the same in rest of the discussion.
a) Internal Debt: Internal debt indicates the borrowings within the country. Internal debt
includes
(i) Market Loans: Market loans are interest bearing and at the time of issue these
have maturity period of 12 months. Market loans are issued by the government
every year. Market loans were Rs. 4,441 crores at the end of march 1971 and it
rose to Rs. 70,520 crores in 1991. Total market loans had risen to Rs.
10,92,472 crores at the end of March 2008.
(ii) Bonds: Bonds category comprises gold bonds, compensation and other bonds.
Other bonds like National Rural Development Bonds and Capital Investments
Bonds. Bonds have ten years’ maturity periods and these carry 7 per cent
interest rates.
(iii) Treasury Bills: Treasury bills regarded as a major short term source to fill the
gap between revenue and expenditure. These are issued every Friday by
Reserve Bank of India. The maturity period of treasury bills are 91 days or
182 days and 364 days.
(iv) Special Floating and Other Loans: Special floating and other loans means
contribution of Government of India to international financial institutions like
IMF (International Monetary Fund), IBRD (International Bank for
Reconstruction and Development), IDA (International Development
Association). At the call of these institutions, Governments are liable to pay
the amount. These are non-negotiable and non-interest bearing.
(v) Special Securities Issued to RBI: The government takes temporary loans from
reserved bank of India and also special securities. They are non-negotiable and
non-interest bearing. Such borrowings are for short periods.
(vi) Ways and Means Advances: To meet the short period expenditure, the
Government of India takes ways and means advances from the Reserve Bank
of India. These debts are for very short periods that is only for 3 months.
(vii) Securities against Small Savings: With the introduction of national small
savings fund (NSSF) system, a large part of small savings have been
converted into securities of central government. The amount of such securities
was Rs. 204799 crore by end of March, 2008.

114
(viii) Small Savings: Small savings are another important internal debt source which
volume is increasing day by day. National Savings Certificates is one example
of such savings.
(ix) Provident Funds: Government also collect money in terms of State Provident
Fund and Public Provident Fund. Outstanding amount under provident fund
was expected to be Rs.76240 crore by the end of March, 2008.
(x) Other Accounts: It includes Postal Insurance and Life Annuity Fund, Hindu
Family Annuity Fund, Borrowing against Compulsory Deposits and Income-
Tax Annuity Deposits and Special Deposits of Non-Government Provident
Fund.
(xi) Reserve Funds and Deposits: Some reserve funds and deposits are interest
bearing and some are not. It includes Depreciation and Reserve Funds of
Railways and Department of Posts and Department of Telecommunications,
deposits of Local Funds, departmental and judicial deposits, civil deposits etc.
c) External Debt: external debts are the borrowings from other countries. External debt
is usually raised in foreign currency and a substantial part of repayment is made also
in foreign currency. Underdeveloped and developing countries borrow from foreign
countries for economic development, high level of investments, purchase capital
equipment, cover deficit balance of payment. Indian Government has borrowed from
number of countries like USA, UK, France, Japan etc. and international financial
institutions like IMF, IBRD, IDA etc.
Table 5.5 Debt Position of Central Governments (Rupees Billion)
Year (end-March)
Internal Debt
Total Internal Liabilities
External Liabilities
Total Liabilities
2018-19 (BE) 69962.20 87036.57 4055.19 91091.76
2017-18 (RE) 64249.17 79895.45 4105.26 84000.71
2016-17 57417.09 72078.03 4081.08 76159.11
2015-16 53048.35 66917.09 4065.89 70982.98
2014-15 47382.91 60450.07 3661.93 64112.00
2013-14 42407.67 54848.48 3744.84 58593.32
2012-13 37645.66 48933.03 3320.04 52253.07
2011-12 32306.22 43471.64 3228.90 46700.54
2010-11 26671.15 37811.35 2784.55 40595.90
2009-10 23283.39 33958.77 2492.88 36451.65
2008-09 20198.41 30361.32 2639.76 33001.08
Source: RBI, accessed from https://dbie.rbi.org.in/DBIE/dbie.rbi?site=publications on 17/08/2019

115
Table 5.5 depicts that the total liabilities of central government increased to Rs. 91091.76
billion in 2018-19 (BE) from Rs.33003.08 billion in 2008-09. Both the internal and external
liabilities depict increasing trends.
Debt obligation of state governments
The debts of the state governments are of following categories:
(i) Internal debts such as market loans and bonds, ways and means advances from RBI,
loans from banks and other institutions and special securities issued to NSSF.
(ii) Loans and advances from central government.
(iii)Provident funds.
(iv) Reserve funds.
(v) Deposits and advances and
(vi) Contingency funds.
The total labilities of state governments was Rs. 16486.50 billion in 2009-10 and it
became Rs.45408.47 billion in 2018-19 (BE). Looking in the different broad components of
debt of states, it is found that debt of states under all heads increased at the end of the
reference period as compared to initial period of study.
Table 5.6 Debt Position of States (Rupees Billion)
Year (End -
March)
Total Internal
Debt
Loans and Advances
from Central Governments
Total Provident
Funds
Reserve Funds
Deposits and
Advances
Contingency Funds
Total Liabilities
2018-19 (BE)
34982.55 1794.80 4192.09 991.15 3400.37 47.51 45408.47
2017-18 (RE)
30649.82 1652.20 3860.03 822.57 3191.18 45.01 40220.82
2016-17 27339.05 1534.63 3579.17 716.38 3082.09 41.77 36293.10
2015-16 23155.22 1482.17 3522.11 1384.61 2595.42 41.73 32181.26
2014-15 18846.99 1471.67 3200.85 995.93 2460.94 61.21 27037.60
2013-14 16370.67 1458.09 3057.97 1494.96 2299.94 31.00 24712.63
2012-13 14558.35 1448.12 2793.65 1315.58 1952.29 34.46 22102.46
2011-12 13228.68 1435.48 2534.46 919.36 1789.77 31.42 19939.16
2010-11 11963.69 1441.70 2282.35 1031.72 1536.56 33.74 18289.76
2009-10 10736.26 1431.52 2005.61 943.50 1345.27 24.33 16486.50
Source: RBI, accessed from https://dbie.rbi.org.in/DBIE/dbie.rbi?site=publications on 17/08/2019

116
5.4: Tax Reforms in India
In August 1991, the tax reforms committee was set up under the chairmanship of Raja
J. Challiah to examine the tax structure and to reform both direct taxes and indirect taxes. The
committee emphasised on making the tax system simple, reduction of rate of taxation, few
exemption and deductions. This committee also gave importance on introducing stability and
rationality in the tax structure.
In case of particular taxes, Challiah Committee recommended the following
measures:
(i) In order to make the direct tax more effective, income tax regime should have
lower rate of taxation with a narrow spread between entry rate and maximum
marginal rate and should contain a minimum of tax incentives.
(ii) The system of subjecting in income of both partnership firms and the partners
to taxation which resulted double taxation and it should be avoided.
(iii) They suggested to lowered corporation tax rate for domestic companies to 40
per cent and for abolition of surcharge. Lowering of tax rate for foreign
companies also suggested. Further, the gap between tax rates on domestic and
foreign companies was suggested to keep around 7.5 percentage point with an
upper limit of 10 percentage points.
(iv) A system of indexation is to be adopted to solve the problem of long term
capital gains and inflation.
(v) For levying wealth tax, this committee make a distinction between productive
and non-productive assets and shares, securities were exempted from wealth
tax.
(vi) Challiah Committee recommended a reduction in general tariff and reduction
in the dispersion in tariff rates and rationalised the system of custom duties.
(vii) This report also recommended to switching over to advoleram rates on a
number of articles to ensure buoyancy in revenue as a result of increased price.
Implementation of Challiah Committee Recommendation:
The basic recommendation is to restore the tax system to its primary function of
generating revenues in an efficient manner. The major changes which have already been
made in the direct and indirect tax policies are:

117
(i) Direct Taxes: Income tax has been restructured with lower taxes, fewer slabs, higher
exemption limit and reduce saving link tax exemptions. To rationalised the taxation
of firms, eliminate the distinction between registered and unregistered firms. In
corporation tax, tax reduce to 30 percent for domestic companies. In case of capital
gains, only capital of price increases would be taxed. The changes of wealth tax have
also made on the basis of taxation from wealth to unproductive assets.
(ii) Indirect Taxes: Government has been also taken several measures since 1991-92 to
reform the indirect tax structure. To reform the indirect tax, reduction the number of
rates, remove exemptions and switch over the advolerem rates. Import duties which
rose to more than 150 percent in several cases before reform, reduced to 10 percent in
2007-08. MODVAT is also extended to all commodities through Central Value
Added Tax (CENVAT). Rakesh Mohan says that country’s next step of reform
should be move towards “Goods and Service Tax”.
Vijay Kelkar Committee (2002) Recommendations on Direct tax:
In 2002 under the chairmanship of Vijay Kelkar direct tax reforms came in India with
the recommendation of task Force on Direct and Indirect Taxes. The main recommendations
of this committee are (GKTODAY, November 23, 2015):
Administration of direct tax:
(i) There should be extension of quality and quantity of taxpayer services and
taxpayers should get easy access to internet and email.
(ii) All citizens should be covered by PAN.
(iii) There should be abolishment of block assessment of search and seizure cases.
(iv) Department should outsource data entry work in order to clear backlog.
(v) Within four month, returns and refund related issues should be addressed.
(vi) To modernise, simplify and rationalize tax collection, Tax Information
Network should be established.
(vii) Requirement for Tax Clearance Certificate should be abolished in case of
leaving the country.
(viii) CBDT should be empowered with necessary administrative and financial
powers.

118
Personal Income Tax:
(i) Increase in exemption limit to Rs.1 lakh for the general categories of taxpayer and
further exemption for senior citizen and widows.
(ii) Rationalize income tax slabs, eliminate surcharge on personal income tax.
(iii) Incentivise home loans by providing interest subsidy on home loans at the rate of 2
percent.
Corporation Tax:
(i) Reduce the corporation tax to 30 percent for domestic companies and 35 percent for
the foreign companies.
(ii) The listed companies should be exempted from tax on dividends and capital gains.
(iii)Increase rate of depreciation for plant and machinery.
(iv) Abolish Minimum Alternate Tax.
Wealth Tax:
(i) Abolition of wealth tax.
Service Tax
In 1994-95, service tax was imposed for the first time. In that year, union service tax
at a rate of 5 per cent was introduced on telephone, general insurance and stock brokerage.
The number of items on which service tax was imposed increases latter on.
State Value Added Tax
From April 1, 2005, at the state level Value Added Tax (VAT) has been introduced.
The two basic rates of VAT are 4 per cent and 12.5 per cent.
Goods and Service Tax
The goods and service tax (GST) is the biggest reform in the country. GST is come
into effect on 1 July 2017. It is a comprehensive, multi stage tax which has replaced many
indirect taxes in India. The main objectives of GST are to eliminate tax on double taxation.

119
At the time of lunching GST in India, there were five different rates of tax (Kagan, J,
February 8, 2019):
Zero percent tax rate for certain foods, book, newspaper, cotton cloth, hotel service
under Rs.1000.
5 percent tax rate to apparel below Rs.1000, package food items, footwear under Rs.
500 etc.
12 percent tax for apparel over Rs. 1000 like frozen meats, sugar, bio-diesel etc.
18 percent tax rate applied to certain luxury items like makeup, swimming pools etc.
which cost more than Rs. 500.
28 percent tax rates applied to 50 luxury product including cars, motor cycles,
ceramic tiles etc.
The rates of GST in India has been kept changing time to time. Table 5.7 depicts the changes
in GST as per 31st council meeting of GST.
Table 5.7 List of rate changes at 31st GST Council Meeting
SL.no List of Goods/Services Changes in Tax Rate
1 Vegetables provisionally preserved but unsuitable for immediate consumption
5% to Nil
2 Vegetables cooked/uncooked via steamed, frozen or boiled (branded)
5% to Nil
3 Music Books 12% to Nil
4 Parts for manufacturing renewable energy devices falling under chapter 84, 85 or 94 of Tariff
5%
5 Natural cork 12% to 5%
6 Fly ash blocks 12% to 5%
7 Walking sticks 12% to 5%
8 Marble rubble 18% to 5%
9 Agglomerated cork 18% to 12%
10 Cork roughly squared or debugged 18% to 12%
11 Articles of Natural cork 18% to 12%
12 Movie Tickets < or = Rs 100 18% to 12%
13 Premium on Third party insurance on Vehicles 18% to 12%
14 Accessories for Handicapped Mobility Vehicles 28% to 5%
15 Power banks 28% to 18%
16 Movie Tickets > Rs 100 28% to 18%
17 Video game consoles, equipment used for Billiards and Snooker and other sport related items of HSN code 9504
28% to 18%
18 Retreated & used pneumatic Rubber Tyres 28% to 18%
19 Colour Television Sets & monitors up to “32 Inches” 28% to 18%
20 Digital & Video Camera recorders 28% to 18%
21 Pulleys, transmission shafts, cranks and gear boxes under HSN 8483 28% to 18%
22 Tax rate on Air travel of pilgrims reduced* 28% to 18%
Source: accessed from https://cleartax.in/s/gst-rates on 17/08/2019

120
5.5 Deficit Financing and Price Behaviour in India:
Government use deficit financing to acquire funds to finance economic development
of the country. If the normal revenue receipts of government from tax and non-tax sources
and borrowings are not sufficient enough to meet its expenditure government relies on deficit
financing. As per Planning Commission of India, deficit financing is equal to the net increase
in the purchasing power of the economy arising through budgetary operations of the
government (Dhar, 2003). In India, deficit financing in proper sense of fiscal deficit was
mainly adopted to enable the government to obtain necessary resources require for five year
plans (Dutt and Sundharam, 2001).
We can analyse deficit financing in the form of revenue deficit and budgetary deficit.
Revenue deficit means deficit in current account. Budgetary deficit indicates the difference
between total expenditure and total receipts (both revenue and capital). Basically, budgetary
deficit known as deficit financing in India. Fiscal deficit is another concept of deficit adopted
by government. Fiscal deficit is defined as budgetary deficit plus borrowing and other
liabilities.
The three types of deficits can be calculated as:
Fiscal Deficit = Revenue Receipts (Non Tax Revenue + Net Tax Revenue) + Capital
Receipts (Only recoveries of loans and other receipts) – Total Expenditure (Plan and
non- plan expenditure).
Budgetary Deficit = Total Expenditure (Revenue + Capital)- Total Receipts (Revenue
+Capital).
Revenue Deficit = Current Revenue Expenditure (Non Plan+ Plan Expenditures)-
Current Revenue Receipts (Net Tax Revenue + Non Tax Revenue).
Table 5.8 shows the deficit financing of India. In 2001-12, as a percentage of GDP, fiscal
deficit was 6.1 percent which decrease to 6.0 percent in 2008-09 but in 2009-10 it raised to
6.5 percent. Revenue deficit also declined from 4.3 percent in 2001-02 to 1.1 percent in 2007-
08. However, it became 5.2 percent in 2009-10. Primary deficit was 1.5 per centin 2001-02
and in 2009-10 it became 3.2 percent. However, in 2004-05 and 2007-08, there was surplus
in case of primary deficit.

121
Table 5.8
Fiscal Indicators of the Union Government
(As a Percentage of GDP)
Year Fiscal Deficit Revenue Deficit Primary Deficit
2001-02 6.1 4.3 1.5
2004-05 4.0 2.5 -0.1
2007-08 2.5 1.1 -0.9
2008-09 6.0 4.5 2.6
2009-10 6.5 5.2 3.2
Source: Fourteenth Finance Commission, Government of India.
Deficit financing and inflationary pressure:
The Government of India has been adopting the policy for financing its
developmental plans. Due to the factors like low level of income, low level of savings and
low capital formation, deficit financing is taking by government of India in increasing
proportion. However, rise in inflationary pressure is the most serious adverse impact of
deficit financing on the economy. Deficit financing increases money supply in the economy
resulting rise in aggregate demand for goods and services. In such situation, if there is lack of
rise in supply of goods and services at the rate with increased aggregate demand, price rise
will occur. In this context, Dr. V.K.R.V. Rao pointed as:
‘Deficit financing is the name of volume of those forced savings which are the result
of increase in prices during the period of the government investment. Thus, deficit
financing helps the country by providing funds for meeting the requirements of
economic growth but at the same time it also create problem of inflationary rise in
prices. Thus, deficit financing must have kept within the manageable limit.’ Dhar,
2003.
Deficit financing becomes self-defeating when it goes too far. The rise in prices
followed by rice in costs which result increase in price further. In such situation if price rise is
controlled, costs continue to increase causing decline of profitability of investment. So, there
will be decrease in investment.
Ways to reduce deficit financing are:
Emphasis should be given on taxed based revenue.
Disinvestment should be done where assets are not used properly.
Government should reduce the subsidies which can help in finance the deficit.
122
Borrowing from both domestic and external sources.
An uncontrolled budget deficit may adversely affect the health of the economy. Therefore,
government should plan the revenues and expenditure in such a way that the economy moves
toward a balanced budget situation.
5.6 Economic Reforms:
In 1991, P.V. Narasimha Rao led Union Government of India introduced the New
Economic Policy (NEP) in response to the suggestions made by World Bank and the
International Monetary Fund. The two broad objectives of the new economic policy were:
(iii)To correct macro imbalances which had destabilised the economy during the late
80’s and early 90’s, such as acute foreign exchange shortage, high rate of inflation,
unsustainable fiscal deficit and current account deficit and growing internal and
external debts.
(iv) To accelerate the overall growth of the economy.
The NEP consists of two major set of measures for fulfilling the above-mentioned objectives.
Stabilization of the economy at the macro level and
Structural adjustments in the economy.
The important arguments in favour of economic reforms 1991 are:
(i) Through market mechanism, economic reforms improve productivity of labour.
(ii) Economic reforms play a very important role in making remedy to the problems of
Public Sector Undertakings.
(iii) Economic reforms attempt to reduce growth of non-plan expenditure through
withdrawal of subsidies on foods, fertilizers, exports and higher education.
(iv) Economic reforms has made sincere attempt to reduce the dependence on domestic
borrowing and deficit financing.
(v) Economic reforms also help the industrial sector from unnecessary regulation.
(vi) The economic reforms also play a very important role to simplify and rationalise the
entire tax structure of the economy.

123
(vii) Economic reforms in India made a provision for increased flow of foreign direct
investment which help to modernize the technology as well as increasing the
productivity.
(viii) The growth of service sector was increasing and industrial sector was
fluctuating during the time of reforms.
The economic reform 1991 has three components:
(i) Liberalization: Liberalization means liberate the trade and industry from unwanted
restrictions. This reforms allowed for opening up economic borders for foreign
investments as well as multinationals. Under liberalization this reform included
expansion of production capacity, abolishing industrial licensing by government and
freedom to import goods. The new economic reforms liberalised all the industries
excepting 18 industries, are decentralised and sell shares without any restrictions.
According to the needs of the market industries are allowed to expand their capacity.
MRTP companies are allowed to expand their size.
(ii) Privatization: Privatization indicates introduction of private ownership in publicly
owned. It refers to giving more opportunities to the private sector and role of public
sector is reduced. Privatization allow the entry of foreign direct investments and aim
to improve the governments’ financial condition. The privatization of economic
reforms includes:
Reducing the number of industries reserved for public sector 17 to 8.
Raised the share of private sector to total investment.
Support of Institutional credit to private sector to raise the efficiency and
productivity of the private sector.
(iii) Globalization: By the word globalization means to connect with the world. In this
context, globalization indicate to integrate the Indian Economy. It encourages private
and foreign trade. Both opportunity and challenges are offered by the globalization of
the economy.
Globalization of Indian Economy made the following changes:
Automatic permission is provided to foreign direct investment up to 51
percent of foreign equity.
Automatic Permission is also provided to high priority industries in case of
foreign technology agreements.

124
To make international adjustment of Indian currency, rupees was devalued in
July 1991 by 20 percent and it stimulate export, discourage import.
On March 31, 1992, a new five year export-import policy was announced to
establish the framework for globalization of India’s foreign trade, to enhance
productivity, competitiveness and modernisation of industries to increase their
export capabilities.
The government has taken various step to increase the flow of foreign
investments like granting foreign technical collaboration of high priority
industries, freedom to import foreign technology to private entrepreneurs, for
financial foreign investment and collaboration proposals established Foreign
Promotion Board (FIPB) and Offering concessions to FERA/ FEMA
companies.
Government has taken various steps for correcting balance of payment deficit
to meet the international competitiveness.
5.6.1 Evaluation of Economic Reforms:
In India economic reforms was introduced in 1991. Economic reforms play a very
important role for the development of Indian economy but there are both positive and
negative sides. There is a dramatic change in nature of institutions and markets, industrial
organisations and structures, social relation to productions. India has responded the global
change in the areas like fiscal policy, monetary policy, public sector policy, industrial policy,
trade policy, foreign direct investment policy etc. The main objective of these policy reforms
is to set the foundation for sustained growth of output and employment through increasing the
global competitiveness. Economic reforms also play an important role to simplify and
rationalise the entire tax structure of the country. It also helps the industrial sector from
unnecessary regulations.
Moreover, unless the profitability of the public sector is improved, the country cannot
allocate more fund on education, health, and rural development. It is not possible to maintain
government control, regulation and also expect to fully exploit the potential dynamism of
various entrepreneurs, professionals and workers at the same time. Similarly, when there is
strict control and licensing of import to protect the domestic industry for which losing the

125
competitiveness of these industries, it cannot be expect to attain sustain growth of its export
at the same time. Moreover, new economic reforms have failed to control inflation and also
fiscal deficit. The subsidies on the fertilizers were removed and it led to an increase in the
cost of production which affected many marginal and small farmers.
Thus, it is argued that there is no alternative of economic reforms but it must be kept in mind
that in Indian economy whatever the policy reforms and restructuring programmes are to be
adopted, it must have its adoptability in Indian soil and must also serve for the general
masses.
5.7 WTO and Indian Economy
The way for setting up of World Trade Organisation (WTO) was paved by the Final
Act of Uruguay round signed by member nations of GATT. On January 1, 1995 WTO was
established with a promise for the entire world economy in respect of international trade. The
WTO agreement was signed by 123nations and India is one among the founder member
nations. WTO is a new international organisation set up as a permanent body and is designed
to play the role of a watchdog in the spheres of trade in goods, trade in services, foreign
investment, intellectual property rights etc. (Misra and Puri, 2008).
The functions of WTO are (Misra and Puri, 2008):
It facilitate the implementation, administration and operation, of this agreement and of
the multilateral trade agreements. Further, WTO provides the framework for
implementation, operation and administration of the plurilateral trade agreements.
To provide the forum for negotiations among its members concerning their
multilateral trade relations in matters dealt with under the agreements in the annexures
to this agreement.
To administer the understanding on rules and procedures governing the disputes
settlement .
To administer the trade policy review mechanism.
The WTO shall cooperate, as appropriate, with the IMF and International Bank for
Reconstruction and Development and its affiliated agencies to achieve greater
coherence in global economic policy making.
The important agreements of WTO are:
(i) Agreement on agriculture (AOA): This agreement provides framework for long term
reform of agricultural trade and domestic policies to increase market orientation in

126
trade of agricultural goods. Further, in the area of market access, domestic support
and export competition, commitments are provided.
(ii) Agreement on trade in textiles and clothing: under this agreement, in force import
quotas on textiles and clothing was decided to phase out by the end of transition
period on January 1, 2005.
(iii)Agreement on market access: There will be reduction of tariffs on industrial and farm
goods by an average of 37 percent.
(iv) Agreement on TRIMs: Introduction of national treatment of foreign investments and
removal of quantitative restrictions was called by The Agreement on Trade Related
Investment Measures (TRIMs).
(v) Agreement on TRIPs: Under Trade Related Intellectual Property Rights agreement,
countries are forced to adopt stringent conditions for protection of the intellectual
property rights. The agreement covers patent, copyrights and related rights,
geographical indicators, industrial designs, layout designs of integrated circuits and
protection of undisclosed information.
(vi) Agreement on services: Trade in services was brought within the ambit negotiations
in the Uruguay Round. It ruled out some obligations like grant of MFN status to the
other member countries in respect of trade in services, maintenance of transparency
and a commitment for liberalization in general terms.
(vii) Dispute Settlement Body (DSB): DSB under WTO seeks to mitigate the
limitations in settlement of disputes under GATT. DSB provides security and
predictability to the multilateral trading system.
India’s Commitments to WTO
The important commitments made by India to WTO are:
Tariff Lines: India bound about 67 per cent of its tariff lines against previous 6 per
cent. With few exceptions, for non-farm goods ceiling bindings of 40 per cent ad
valorem on finished goods and 25 per cent on intermediate goods, machinery and
equipment were under taken.
Quantitative Restrictions (QRs): In order to improve balance of payment, Committee
on Balance of Payments Restrictions had advised India to phase out of QRs. As per

127
agreement between USA and India on 2001, QRs was removed on 714 first and then
again on 715.
TRIPs: As per ruling of the two disputes settlement panels, appropriate amendment of
Patent Act, 1970 by April 19, 1999 was made obligatory for the government of India.
Subsequently, the Patens (Amendment) Act, 1999 was passed by the parliament in
March 1999 to provide exclusive marketing rights which was followed by the Patent
(Amendment) Act, 2002 in May 2002. The Government of India promulgated an
Ordinance on December 23, 2004 to meet the commitment to the WTO to introduce
product patent by January 1, 2005.
TRIMs: Under TRIMs agreement, India notified two TRIMs relating to local content
requirements in the production of certain pharmaceutical products and dividend
balancing requirement in case of investment in 22 categories of consumer items.
GATs: Under GATs agreement, India made commitment in 33 activates where
Foreign Service providers will be allowed to enter.
Customs Valuation Rules: In order to bring Custom Valuations Rules 1998 in India in
conformity with the provisions of the WTO Agreements on implementation of Article
VII of GATT 1994 and Custom Valuation Agreement, legislation was amended.
India’s gains from WTO:
It was expected that the Indian economy will experienced some important advantages
from her membership of WTO. The major gains expected from WTO membership of India
are:
Expansion in trade: It was estimated by World Bank, OECD and GATT secretariat
that world income will be added by 213 to 274 billion US dollar because of
implementation of Uruguay Round package. The GATT Secretariat also estimated
that the largest increases will be in the areas of clothing (60 per cent), agriculture,
fishery and forestry products (20 per cent) and processed food and beverages (19 per
cent). As India’s existing and potential export competitiveness lies in these product
groups, it was expected that large scale benefits will occur to India.
Benefits from phasing out of Multi-Fibre Arrangement (MFA): Due to phasing out of
MFA, the export of clothing and textile was expected to increase. It was thought by

128
many observes that US and European markets will flood by India’s exports of clothes
and textile products.
Improved prospects for agricultural exports: Due to reduction in domestic subsidies
and barriers to trade, the world prices of agricultural products was expected to rise
resulting improvement in export potential of such products that will be a major gain
for India. Further, India has ensured that all major programmes for agricultural
development will be exempted from the disciplines in the Agricultural Agreement.
Thus, by the provisions of Agreements, public distribution system will not affected,
agricultural subsidies provided by developing countries will continue till the specified
time limit and required protection to agriculture sector in undeveloped countries will
continue.
Benefits from multilateral rules and disciplines: Strengthening of multilateral rules
and disciplines under Uruguay Agreement supposed to ensure secured and predictable
international trading system which was thought to be create favourable environment
for India in world economy.
5.8 Foreign Capital and MNCs (Multi-national Corporations):
Foreign Capital in India
The underdeveloped countries are very much depending on foreign capital because
those countries suffer from low level of income, low level of capital formation, low
investments etc. There are three forms of foreign capital that is loans, grants and foreign
investment.
(i) Loans: Loans are available in the form of from developed countries and from
international institutions like IBRD, IMF etc.
(ii) Grants: Any repayment obligations are not available in case of grants and grants
are available in the country through various foundation and international
institutions.
(iii) Foreign Investment: Foreign investments are in the form of direct investment on
entrepreneur and foreign collaboration.
129
Needs of Foreign Capital:
In the underdeveloped countries, foreign capital plays a very crucial role in the
development process. The need of foreign capital is discussed below:
(i) Scarcity of Resources: One of the important reason behind need of foreign capital
in underdeveloped countries like India is scarcity of capital resources. Due to
inadequate capital formation there is lack of capital resources.
(ii) The Technological Gap: In underdeveloped countries like India, there is lack of
technical knowledge. For attaining international competitiveness and to improve
the technology of production foreign capital is very important.
(iii) Initial Risk: In underdeveloped countries, there is lack of experience and lack of
high initial risk for which they facing the problem of lack of flow of domestic
capital. In such a situation, foreign capital plays an important role by taking the
initial risk of investment and help in the flow of domestic capital in the right
direction.
(iv) Building Infrastructures: In the underdeveloped countries, for infrastructural
development there is a huge need of investment. Foreign capital helps in the
development of infrastructure building of underdeveloped countries.
(v) Associated Assistance: For the economic development, technical knowhow,
research and development facilities, business experience are very important and
foreign capital plays a very important role in providing such type of facilities.
(vi) BOP Support: Deficit balance is one of the serious problem of underdeveloped
countries like India. The problem of deficit balance arises in underdeveloped
countries due to more import of capital goods. To meet the crisis of balance deficit
foreign capital plays a very important role.
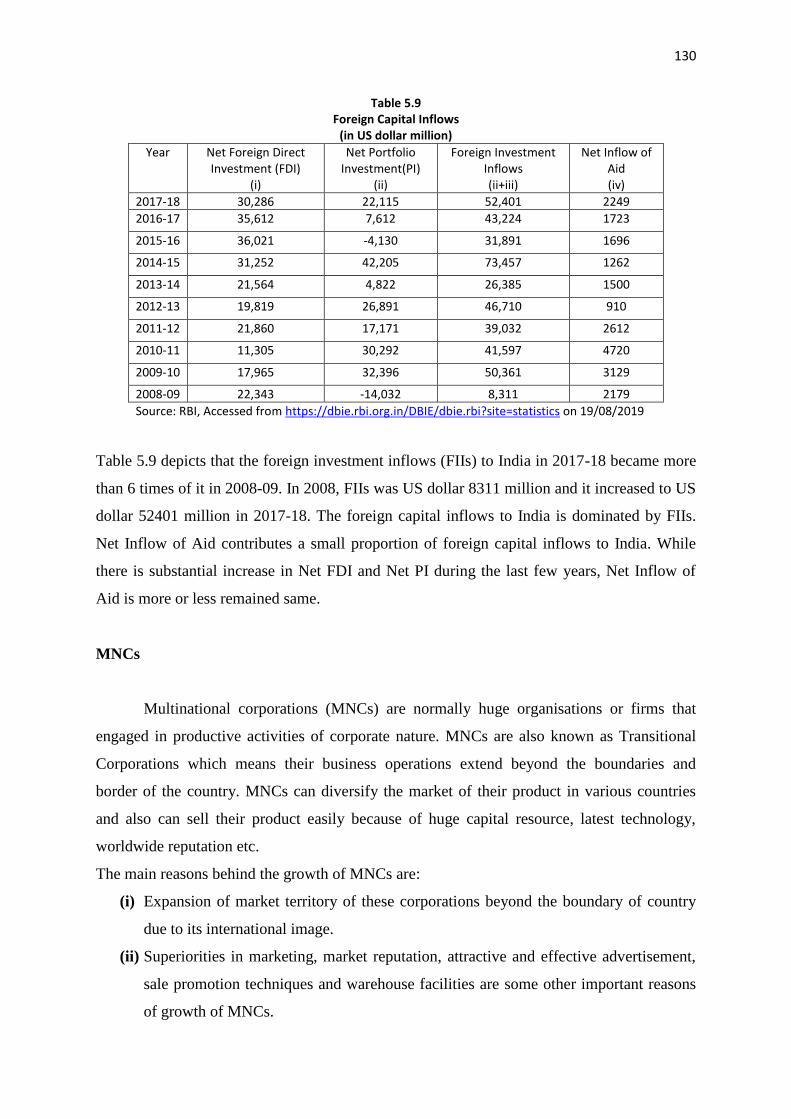
130
Table 5.9 Foreign Capital Inflows
(in US dollar million)
Year Net Foreign Direct Investment (FDI)
(i)
Net Portfolio Investment(PI)
(ii)
Foreign Investment Inflows (ii+iii)
Net Inflow of Aid (iv)
2017-18 30,286 22,115 52,401 2249
2016-17 35,612 7,612 43,224 1723
2015-16 36,021 -4,130 31,891 1696
2014-15 31,252 42,205 73,457 1262
2013-14 21,564 4,822 26,385 1500
2012-13 19,819 26,891 46,710 910
2011-12 21,860 17,171 39,032 2612
2010-11 11,305 30,292 41,597 4720
2009-10 17,965 32,396 50,361 3129
2008-09 22,343 -14,032 8,311 2179
Source: RBI, Accessed from https://dbie.rbi.org.in/DBIE/dbie.rbi?site=statistics on 19/08/2019
Table 5.9 depicts that the foreign investment inflows (FIIs) to India in 2017-18 became more
than 6 times of it in 2008-09. In 2008, FIIs was US dollar 8311 million and it increased to US
dollar 52401 million in 2017-18. The foreign capital inflows to India is dominated by FIIs.
Net Inflow of Aid contributes a small proportion of foreign capital inflows to India. While
there is substantial increase in Net FDI and Net PI during the last few years, Net Inflow of
Aid is more or less remained same.
MNCs
Multinational corporations (MNCs) are normally huge organisations or firms that
engaged in productive activities of corporate nature. MNCs are also known as Transitional
Corporations which means their business operations extend beyond the boundaries and
border of the country. MNCs can diversify the market of their product in various countries
and also can sell their product easily because of huge capital resource, latest technology,
worldwide reputation etc.
The main reasons behind the growth of MNCs are:
(i) Expansion of market territory of these corporations beyond the boundary of country
due to its international image.
(ii) Superiorities in marketing, market reputation, attractive and effective advertisement,
sale promotion techniques and warehouse facilities are some other important reasons
of growth of MNCs.
131
(iii) MNCs have financial superiorities over national firm.
(iv) Technological superiorities of the MNCs over national companies of the
underdeveloped countries.
(v) Due to superior Research and Development facilities, there is effective product
innovation of MNCs.
Collaboration with Indian Industries is a common form of participation of MNCs in
Indian Industries. Foreign capital and foreign collaboration have both favourable and harmful
impact on Indian economy. Foreign collaboration helps the Indian economy to diversify their
product such as steel, light and heavy engineering, petroleum refinery, automobile, chemical
etc. In the initial stage, India only emphasised on consumer goods sector only. Without the
support of technical knowhow and skills from abroad it has been difficult to develop such
basic industries. Thus, Indian industries are gain from foreign collaborations.
But there are also some adverse impacts of foreign collaboration on Indian economy such as:
(i) Outflow of large amount of money in terms of profits, dividends, interests, technical
fee etc.
(ii) Growing tendency of direct and indirect interference of MNCs in the internal Policy
and other affaires.
(iii)Faulty technology transfer leading to transfer of inappropriate technology too much
capital intensive in nature in a labour surplus economy.
5.9 Questions
1. Discuss the trends in revenue receipts and expenditures of central and states in India.
2. Explain the trends in public debt of union government and state governments in India.
Suggest some ways to curtail the debt burden of government.
3. Discuss the economic reforms 1991 and its impact on the economy of India.
4. What are the changes made by government of India due its agreement with WTO?
Discuss the gains India expected to realise from its membership of WTO.
5. Discuss the inflow of foreign capital to India.
5.10 Key Words
Revenue : all the sources of income of the government

132
Tax : a compulsory levy
Non Tax Revenue : all sources of income other than tax e.g. fee,
fines, stamp duty etc.
WTO : World Trade Organisation
5.11 Suggested Readings
Choudhaury, R.K (2012): Public Finance and Fiscal Policy, Kalyani Publishers,
Ludhiana.
Dhar, P. K. (2003): Indian Economy: Its Growing Dimensions, Kalyani Publishers,
Delhi.
Datt, Ruddar and K.P.M Sundharam (2001): Indian Economy, S. Chand & Company
LTD., New Delhi.
GKToday, November 23, 2015, accessed from https://www.gktoday.in/gk/vijay-
kelkar-committee-2002-recommendations-on-direct-taxes/ on
17/08/2019.
Government of India (2019): Fourteenth Finance Commission, accessed from
http://www.prsindia.org/sites/default/files/bill_files/14th_FC_R
eport.pdfon 07/08/2019.
Kagan, J, (2019): Accessed from https://www.investopedia.com/terms/g/gst.asp) on
07/08/2019,February 8.
Misra, S. K. and V. K. Puri (2008): Indian Economy- Its Development Experience,
Himalaya Publishing House, Nagpur.
Singh, J. (2019):Revenue Expenditure and Capital Expenditure of India, accessed
fromhttp://www.economicsdiscussion.net/expenditure/revenue-
expenditure-and-capital-expenditure-of-india-notes/749on
07/08/2019.
Soni, R.N. (2004): Leading Issues in Agricultural Economics (Theoretical& Applied),
Vishal Publishing Co., Jalandhar.

133
UNIT –VI
STRUCTURE OF NORTH EAST ECONOMY
Structure
6.0 Introduction
6.1 Unit objectives
6.2 North East Economy: An overview
6.3 Basic Features of North Eat Economy
6.4 Relative Performance of North East Economy
6.5 Economic Performance of the Region
6.6 Level and Growth of NSDP are per-capita NSDP
6.7 Changing Sectoral composition of state income and Sectoral Contribution to
the Growth of Income with respect to Arunachal Economy.
6.8 Natural Resource Base-Land, Mineral, Water, food
6.9 Status of Human Development in N.E. India
6.10 Summary
6.11 Key Words
6.12 Check your progress
6.13 Question and Exercise
6.14 Further Readings
6.0. Introduction
In this unit you will learn about the economy of North East India. This region
constitutes eight states like Arunachal Pradesh, Assam, Manipur, Meghalaya, Mizoram,
Nagaland, Sikkim and Tripura. The region constitutes around 7.9 percent of the total area of
the country but it contains only 3.8 percent of population of the country as per 2011 census.
Topographically the region is a mixture of hills and plains while Arunachal Pradesh,
Meghalaya, Mizoram, Nagaland and Sikkim are almost entirely hilly. On the other hand,
Assam is basically a plain area. At the same time Manipur and Tripura have both plain areas
and hilly tracts. Wide variation in altitude coupled with abundance of rainfall has given rise
to wide variations in climatic conditions within the region. This in turn has endowed the
region with rich biodiversity. The richness of biodiversity of the region is almost matched by
its ethnic diversity. The coexistence of the diversity of physical and culture development is to
be normally found in the organisation of economic life of the people of the region. However
all the states in this region are an interdependent economic system, both for historical and

134
geo-political reasons. The North Eastern Council (NEC) which was set up in 1971 was the
result of the recognition of this economic interdependence. At the same time the region has
been facing various challenges towards all-round development. These challenges cut across
the spheres of economy, society and polity. This unit / module will focus on the
characteristics of North-East economy, its economic system, the relative economic
performance of states of the region as well as the natural resource base and status of the
human development etc.
6.1 Objectives
After reading this unit you will be able to know:
An overview of North East economy.
Basic features of North East economy.
Relative economic performance of the North Eastern Region and its constitutant
status in the country.
It structural transformation of Arunachal economy.
Natural Resource Base of North Eastern Region.
Status of Human development of North Eastern Region.
6.2. North East Economy – An Overview
A brief introspection of the evolution of the region and its economy in decades after
independence may serve as a very useful reference in analyzing the impact of the more recent
events such as the liberalization process set in motion in 1991.
In August 1947, when India attained independence from the British rule, the North
Eastern Region consisted of three broad administrative units. For example, Manipur and
Tripura were the two princely States and the rest of the region was Undivided Assam
province. The administrative arrangement throughout the then Assam province was not
uniform. While the plain areas were under effective administration of the provisional
government. The tribals inhabited in hill areas were left out of administration. Indeed the hill
areas were classified as ‘excluded’ or ‘partially excluded’ areas. Shifting or ‘Jhum’
cultivation based, self-contained village, was the typical organization of economic life of the
hill tribes. On the other hand, the population of the plains of Assam, Manipur and Tripura

135
were by and large dependent on agriculture. However, in contrast to the hills, the people in
the plains practised settled cultivation with rice as the main crop. The Assam plains had a
significant modern non-agricultural sector, which was developed during the British Raj
foreign capitalists for the purpose of colonial exploitation of the region’s rich natural
resources. This sector consisted of tea industry based on plantation, mining of coal and oil
and oil refining based on minerals, plywood industry etc.
The development in many states of North East India is a post independence
phenomenon since the process of political and administrative reorganization of the region
began only after independence. The constitutional provisions, such as district councils for
integrating erstwhile excluded and partially excluded areas did not lead to desired levels of
development and fulfill the aspirations of the newly emerging political leadership of many of
the hill tribes inhabiting those areas. Consequently, the movement for greater autonomy,
separate statehood soon came up. The central Government responded to some of these
movements by effecting several rounds of political reorganization of the region, which
resulted in the emergence of the present set-up of seven full fledged states. Sikkim which was
annexed in 1975 was included in the region in the nineties.
Thus, there emerged a large number of structurally similar but semi-insular traditional
economies into a single economic system i.e. North East economy. This is the economic
manifestation of a political process. This political process, evolutionary in nature and
democratic in operation, integrated not only a large number of tribes and sub-tribes inhabiting
the region, but also integrated them into the plain areas of the region.
6.3. Basic Features of the North-East Economy
We have equipped ourselves with the introspection of the evolution of North-Eastern
region and its economy and we can now have a brief glimpse of the basic characteristic
features of North East Economy. These are as follows:
a). Large Incidence of International Border: The region consists of 7.9 percent of total
geographical area of the country but it contains more than 20 percent of international border
of the country. In fact, all the states of North East India have international border. The large
international border isolated the region geo-politically. It was left with over 4500 km of
external frontier with Bhutan, China, Myanmar and Bangladesh but no more than a slender
22 km connection with the India mainland. The net effect of all this is the weakening of the
market linkages of the region with the rest of the country.

136
b). Rapid Growth of Population: One of the basic features of the region is the rapid growth
of population in these areas. From the census data of different decades, it is found that the
region’s growth rate of population is much higher than that of India. One of the reasons for
the rapid growth of population is immigration. The population influx from across the border
has largely impacted not only the demographic composition of the region but also their polity
and economies leading to a prolonged disturbed situation in several parts of the region. This,
in turn, has vitiated its environment for investment and growth.
c). Frequent Occurrence of Natural Calamities: Another important feature of the region is
the frequent occurrence of natural calamities like flood, landslides etc. The region consists of
7.9 percent of total area of the country but it also contains around 18 percent of total flood
prone areas of the country. The reasons for frequent occurrence of landslide in hilly areas,
and floods in plain areas of the region, is that of deforestation with high intensity of rainfall in
upstream leading to increased surface water runoff, and soil erosion. On the other hand, high
soil erosion in upstream leads to greater sedimentation in downstream, which causes the rise
in river bed and therefore to higher incidence of bank erosion and floods. Frequent
occurrence of flood and erosion continue to be the major obstacles towards development of
an agrarian economy of the region.
d). Infrastructural Deficiency: There is a broad consensus that the North East lacks the
basic minimum physical, social and administrative infrastructure for development of the
region. Physical infrastructure such as transport and communication, power, irrigation and
market access are grossly inadequate to generate a dynamic growth process. Road is the basic
means of communication in North East India. However, the average road density in the
region is much lower than that of the country. Another important observation is that surface
road as a percentage of road length is only around 30 percent. However, the most important
feature is that most of the States of the region do not have lateral road communication. The
remoteness and terrain involves large unit cost as well as maintenance cost. According to one
estimate, the cost of construction of one km of road in hilly areas of the region is five times
higher than that in the plains, (Sarma, 2018). Thus, the infrastructural deficiency which has
become an inherent feature of the North East has contributed to low productivity and growth
in different sectors of the economy of the region.
e). Unharnessed Resource Endowments: It is a well known fact that North East India is a
highly natural resource endowed region. For example, the region consists of 7.9 percent of
total area of the country, but it contains around 25 percent of total forests of the country.
According to one estimate, the region also has hydropower generation potentials of 57,000

137
MW i.e. 60 percent of the country’s total potentials. The North East is also endowed with
mineral resources like petroleum, and natural gas, limestone etc. Thus, the per capita
availability of natural resources in the region is one of the highest in India but the region is
lags behind in industrial growth and overall economic development. Thus, the case of North
East amply clarifies that the availability of natural resources does not necessarily lead to
industrialization of the location. In contrast, States like Gujarat, is not as richly endowed with
natural resources but has prospered as location of industries.
f). Lack of Industrialization: The process of industrialization in Assam started quite early
i.e. more than one century back. For example, crude oil production and its refining, as well as
tea plantation and plywood industry, are a few old resource based modern industries of the
region. However, both oil and tea industries have not induced any industrial growth based on
their backward and forward linkages. This is supported by the fact that contribution of
industrial sector to the region’s GDP is less than 10 percent. In some hilly states like
Arunachal Pradesh it is even less than five percent. Till the nineties, in the hilly states, there
were a good number of wood-based industries, but the Supreme Court’s restriction on felling
of trees led to the closure of these industries.
g). Imperfection in Factor Markets: In the North Eastern States, the factor markets are
working to their disadvantage. For example, the absence of land market particularly in the
hilly states act as a serious impediment to investment. The labour market has also been
largely distorted by heavy population influx. The credit market started growing in the
seventies in many hilly states but the legal framework regulating the credit is yet to be
institutionalized.
h). Dependence on Common Property Resources: A feature which distinguished many
hilly states of North East India from many other, is the dependence on common property
resources (CPRs) mainly forests. For example, many studies in the past showed that in
several areas around 30 percent of consumption expenditure of the households were derived
from CPRs. The dependence was very high in the past but in recent years it has declined
owing to shrinking of the CPRs. Two factors led to the decline of CPRs. One is the
establishment of individual property rights and the other is rapid deforestation in the region.
6.4 Relative Performance of North East Economy / Economic Performance of the
Region.
The per capita income (PCI) or per capita NSDP is regarded as a relatively good
measure of economic condition performance of a region / State. A region / State with a high

138
PCI is considered as rich. On the other hand if the level of PCI is low, it is considered as
poor. However, the question of high or low comes in two ways (i) comparison of region’s
PCI with Nation’s PCI and comparison of different states of the region. (ii) comparison of
present PCI of the region / State with those in the past.
In order to examine the relative performance of North Eastern Region, the percentage
ratios of per capita NSDP of the region and its constituent states to PCI of the country was
calculated for four decades, depending on the availability of data. The details are furnished in
table 6.1.
Table 6.1
Per Capita NSDP at Current Prices of North Eastern States as Percentage of India’s NNP Per Capita at
Current Prices
Year Arunachal Pradesh Assam Manipur Meghalaya Mizoram Nagaland Tripura Sikkim NE
1980-81 96.37 78.77 87.05 83.49 79.07 88.83 80.18 NA 80.38
1990-91 108.31 85.91 79.79 87.8 89.79 98.33 67.63 NA 85.23
2000-01 87.19 61.04 76.75 78.49 95.41 80.6 85.88 95.28 68.51
2010-11 112.84 61.24 52.46 81.01 94.32 102.88 85.24 201.72 98.96
Source: 1. Handbook of Statistics of Indian Economy, Reserve Bank of India
2. Economic Survey of India from various issues.
Note: The regional NDP per capita has been estimated as the weighted average of NDP per capita of the seven states with
respective population shares as the weights.
From table 1.1, it is clear that throughout the entire period NDP per capita of the region remained below India’s per capita
income. In fact immediately after the post reforms period i.e. during 1990-91 and 2000-01 the gap has widened from 85.23
percent in 1990-91 to 68.51 percent in 2000-01. However, the gap is drastically reduced in 2010-11 due to rapid increase of
per capita NSDP of Sikkim, Nagaland and Arunachal Pradesh. The regional trend is shared by more populus State of Assam,
Manipur and Tripura in the region. However, in contrast to broad regional trends, in Arunachal Pradesh, Nagaland and the
per capita NSDP had crossed or nearer two India’s NNP per capita in eighties and generally remained nearer to India’s figure
in the following decades. On the other hand, Sikkim’s per capita NSDP is more than double than that of the country in 2010-
11.
The analysis of growth in terms of per capita income has it usefulness. However, in
that analysis the picture of growth trends across states gets somewhat clouded because the
population growth rates in the different States in the region have been quite uneven in the
recent decades. In order to capture the relative performance of the States in the region purely
in terms of economic growth, the available NSDP figure at current prices of the region and its
constituent states have been expressed as percentage of India’s NSDP at current prices. These
ratios approximately show the percentage shares of the North Eastern states in India’s
national income. The trend in the ratios is shown in table 6.2. To summarize the trends annual
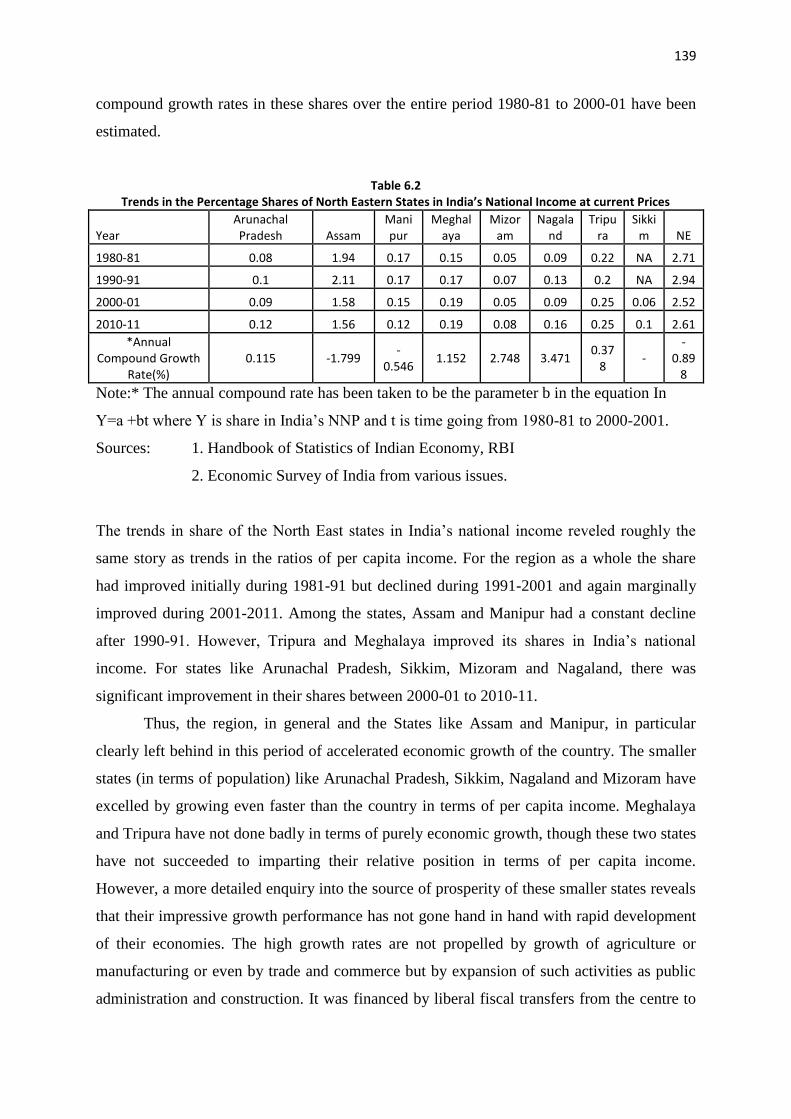
139
compound growth rates in these shares over the entire period 1980-81 to 2000-01 have been
estimated.
Table 6.2 Trends in the Percentage Shares of North Eastern States in India’s National Income at current Prices
Year Arunachal Pradesh Assam
Manipur
Meghalaya
Mizoram
Nagaland
Tripura
Sikkim NE
1980-81 0.08 1.94 0.17 0.15 0.05 0.09 0.22 NA 2.71
1990-91 0.1 2.11 0.17 0.17 0.07 0.13 0.2 NA 2.94
2000-01 0.09 1.58 0.15 0.19 0.05 0.09 0.25 0.06 2.52
2010-11 0.12 1.56 0.12 0.19 0.08 0.16 0.25 0.1 2.61
*Annual Compound Growth
Rate(%) 0.115 -1.799
-0.546
1.152 2.748 3.471 0.37
8 -
-0.89
8
Note:* The annual compound rate has been taken to be the parameter b in the equation In
Y=a +bt where Y is share in India’s NNP and t is time going from 1980-81 to 2000-2001.
Sources: 1. Handbook of Statistics of Indian Economy, RBI
2. Economic Survey of India from various issues.
The trends in share of the North East states in India’s national income reveled roughly the
same story as trends in the ratios of per capita income. For the region as a whole the share
had improved initially during 1981-91 but declined during 1991-2001 and again marginally
improved during 2001-2011. Among the states, Assam and Manipur had a constant decline
after 1990-91. However, Tripura and Meghalaya improved its shares in India’s national
income. For states like Arunachal Pradesh, Sikkim, Mizoram and Nagaland, there was
significant improvement in their shares between 2000-01 to 2010-11.
Thus, the region, in general and the States like Assam and Manipur, in particular
clearly left behind in this period of accelerated economic growth of the country. The smaller
states (in terms of population) like Arunachal Pradesh, Sikkim, Nagaland and Mizoram have
excelled by growing even faster than the country in terms of per capita income. Meghalaya
and Tripura have not done badly in terms of purely economic growth, though these two states
have not succeeded to imparting their relative position in terms of per capita income.
However, a more detailed enquiry into the source of prosperity of these smaller states reveals
that their impressive growth performance has not gone hand in hand with rapid development
of their economies. The high growth rates are not propelled by growth of agriculture or
manufacturing or even by trade and commerce but by expansion of such activities as public
administration and construction. It was financed by liberal fiscal transfers from the centre to
140
those special category states. Such high growth rates, unless stimulated by genuine economic
rules are unlikely to be sustainable for long.
6.5. Level and Growth of NSDP and per capita NSDP of Arunachal Pradesh
So far we touched the concepts of NSDP and per capita NSDP, in analysing the
performance of North East economy. Let us now discuss the level and growth of NSDP and
per capita NSDP of Arunachal Pradesh. Before coming for discussion, let have a glance of
Arunachal economy. Arunachal Pradesh the then North East Frontier Agency (NEFA) started
the journey to development only after independence of the country. Prior to the independence
of the country no modern developmental process was initiated. In fact, at time of
independence, Arunachal economy was basically a mono-economy characterized by
subsistence agriculture and a few cottage industries. After independence the Government of
India took steps two start developmental programmes and in 1953 NEFA was brought under
First Five Year Plan. In the fifties, the Government of India followed a policy of least
intervention with regard to socio-political autonomy, a revivalist approach towards tribal
customs and traditions and a protectionist welfare approach towards economic development
of the states popularly known as Nehru-Elwin policy of tribal development. However, this
policy of development was shifted to the policy of progressive integration since Indo-Chinese
border conflict in 1962 i.e. at the beginning of Third Five Year Plan. In order to make
forthcoming plans fruitful, the National Council of Applied Economic Research (NCAER)
was requested in 1964 to undertake a techno-economic survey of the territory and to
recommend suitable programmes to be undertaken. The report was published in 1967 and
development of physical infrastructural facilities, industrialization and modernization were
the ingredients of the policy suggested in the report. Thus, the actual process of economic
development was started in the territory from the seventies only. Although the first
population census was conducted in the territory in 1961 but reliable economic data was
available from 1971 only. Hence our analysis of level and growth of NSDP and per capita
NSDP of the States will be limited from seventies only. The level of per capita income of
Arunachal Pradesh as compared to India’s, per capita NNP was furnished in table 6.3.
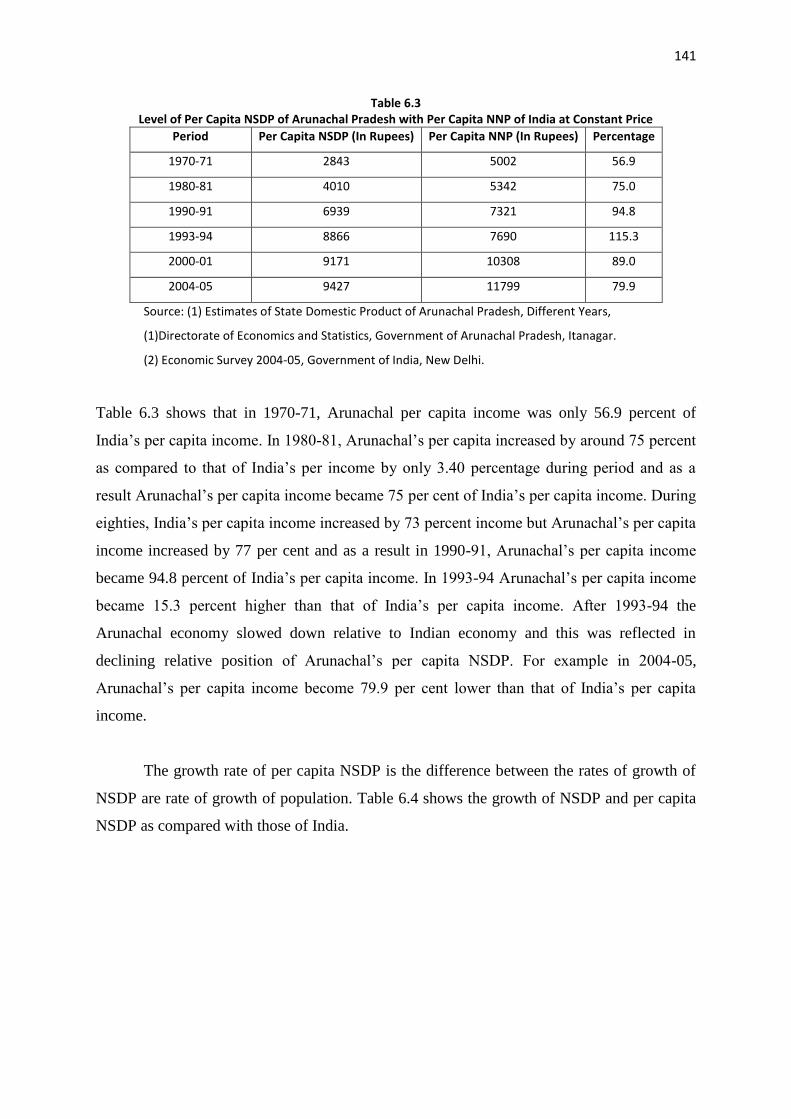
141
Table 6.3 Level of Per Capita NSDP of Arunachal Pradesh with Per Capita NNP of India at Constant Price
Period Per Capita NSDP (In Rupees) Per Capita NNP (In Rupees) Percentage
1970-71 2843 5002 56.9
1980-81 4010 5342 75.0
1990-91 6939 7321 94.8
1993-94 8866 7690 115.3
2000-01 9171 10308 89.0
2004-05 9427 11799 79.9
Source: (1) Estimates of State Domestic Product of Arunachal Pradesh, Different Years,
(1)Directorate of Economics and Statistics, Government of Arunachal Pradesh, Itanagar.
(2) Economic Survey 2004-05, Government of India, New Delhi.
Table 6.3 shows that in 1970-71, Arunachal per capita income was only 56.9 percent of
India’s per capita income. In 1980-81, Arunachal’s per capita increased by around 75 percent
as compared to that of India’s per income by only 3.40 percentage during period and as a
result Arunachal’s per capita income became 75 per cent of India’s per capita income. During
eighties, India’s per capita income increased by 73 percent income but Arunachal’s per capita
income increased by 77 per cent and as a result in 1990-91, Arunachal’s per capita income
became 94.8 percent of India’s per capita income. In 1993-94 Arunachal’s per capita income
became 15.3 percent higher than that of India’s per capita income. After 1993-94 the
Arunachal economy slowed down relative to Indian economy and this was reflected in
declining relative position of Arunachal’s per capita NSDP. For example in 2004-05,
Arunachal’s per capita income become 79.9 per cent lower than that of India’s per capita
income.
The growth rate of per capita NSDP is the difference between the rates of growth of
NSDP are rate of growth of population. Table 6.4 shows the growth of NSDP and per capita
NSDP as compared with those of India.

142
Table: 6.4 Growth Rate of NSDP of Arunachal Pradesh as Compared with the Growth Rate of India (Percent per
Annum)
Period Arunachal Pradesh
India
NSDP Per Capita NSDP NNP Per Capita NNP
1971-1980 7.07 4.14 3.36 1.1
1981-1990 7.81 4.69 4.99 2.83
1991-2000 4.81 2.4 5.93 3.95
2001-2004 2.79 0.4 6.01 4.29
Note: Growth rate is the estimated value of b in log Y= a + bt, expressed in their percentage, Y is NSDP or NNP and per capita values and t is time measured in years. Source: (1) Estimates of State Domestic Product of Arunachal Pradesh, Different Years, and Directorate of Economics and Statistics, Government of Arunachal Pradesh, Itanagar.
(2) Economic Survey 2004-05, Government of India, New Delhi.
Table 6.4 shows that in the seventies, the Arunachal economy performed very
efficiently. Its growth rate was above the national average. NSDP grew at the rate of 7.07
percent per annum during the period against the growth of national income at 3.36 per cent.
However, due to rapid growth of population, Arunachal’s per capita income grew only at
4.14 percent against the 1.10 percent growth of per capita National income. In the eighties,
both Arunachal and Indian economy moved forward but Arunachal economy was ahead of
the National. However, the situation was different during the nineties onwards. The growth
rates of both national income and per capita national income were much higher than those in
Arunachal Pradesh.
6.6 Changing Sectoral Composition in State Income and Sectoral Contribution to
the Growth of Income.
The sectoral composition of income in Arunachal over the period 1970-71 to2009-10
shows a sharp decline in the share of the primary sector and a big increase in the share of
services sector. In recent years, the service sector in Arunachal Pradesh has come to occupy a
predominant position in the state’s income, a position that is higher than agriculture, the
traditional occupation of the people. For example, in 2009-10 the contribution of services
sector was 43.98 percent which was 13.28 per cent higher than that of primary sector. The
details are furnished in Table 6.5.

143
Table 6.5 Changes in Sectoral composition of Net State Domestic Product in Arunachal Pradesh: 1970-71 to 2009-10
(Percentage)
Sl. No. Sub-Sectors and Sectors
1970-71
1980-81
1990-91
2003-04
2009-10
Changes during 1970-2010
1 Agriculture and Sectors 38.33 36.91 35.09 27.43 28.7 -9.63
2 Forestry and logging 20.72 10.23 9.59 3.73 13.99 -6.73
3 Fishing 0.04 0.08 0.72 1.07 0.35 0.31
4 Mining and Quarrying 0.1 0.06 0.79 1.41 2.04 1.94
Primary Sector 59.19 47.28 46.19 33.64 30.74 -28.45
5 Manufacturing 0.85 6.51 6.64 2.49 2.32 1.47
6 Construction 19.58 18.69 17.98 17.9 18.58 -1
7 Electricity, gas and Water -0.1 -2.99 -2.46 -0.25 4.36 4.46
Secondary Sector 20.33 22.21 21.36 20.64 25.27 4.94
8 Transport, Storage and
Communication 1.55 0.36 0.65 7.16 3.9 2.35
9 Trade, Hotel & Restaurants 1.96 4.42 4.95 4.82 3.93 1.97
10 Banking & Insurance 0.1 0.6 1.49 2.93 3.7 3.6
11 Real Estate, Ownership of Dwelling &
Business Service 0.79 7.79 5.29 2.31 2.67 1.88
12 Public Administration 9.98 10.36 8.16 17.79 14.86 4.88
13 Other Sector 6.1 6.98 11.71 11.21 14.92 8.82
Tertiary Sector 20.48 30.51 32.25 46.22 43.98 23.5
Net State Domestic Product 100 100 100 100 100 0
Source: Calculated on the data from estimates of State Domestic Product of Arunachal Pradesh, Different years, Directorate of Economics and Statistics, Government of Arunachal Pradesh, Itanagar
Table 6.5 shows that Arunachal economy experienced a significant structural
transformation. In 1970-71, the primary sector was the most important sector in the economy.
Its contribution to NSDP was as high as 59.19 per cent. During last forty years (1970-71to
2009-10) its contribution sharply and steadily declined. In 2009-10, the contribution of
primary sector declined by 28.45 percentage points as compared to 1970-71. The decline in
primary sector was not translated into rise of the secondary sector. Its relative contribution
remained the same and its position was marginally improved in 2009-10. However the figure
is misleading, the major contribution of the secondary sector came from construction. The
contribution from manufacturing sector was reducing after 1990-91 and it stood only 2.32
percent 2009-10. It was finding that the decline in primary sector was compensated by rapid
growth of services sector. Infact the share increased from 20.48 percent in 1970-71 to 43.98
percent in 2009-10. This happened basically data rapid six in share of public administration
and other sectors.

144
If we briefly look into the sectoral contribution to the growth of income, it was found
from Human Development Report of Arunachal Pradesh, 2005 that during 1970-71 to 2001-
02, agriculture contributed more prolifically to the growth of Arunachal economy than any
other service. Though the growth of agriculture was net very high as compared to other
sectors, yet the size of the sector has meant a substantial contribution during the period.
Agriculture accounted for 35.97 per cent of Arunachal’s NSDP and 32.08 per cent of
Arunachal economic growth come from agriculture. Infact, the primary sector as a whole is
responsible for 39.92 per cent of economic growth during the period. The overall contribution
of the secondary sector was 21.98 per cent of the state’s economic growth. The remaining
38.30 percent came from services sector. In this sector, public administration formed the
largest sub sector and it formed 11.15 per cent growth of NSDP of the State.
6.7 Natural Resource Base – Land, Mineral Water and Forest.
(a) Land: Land is an important natural resource. However, most of the North Eastern
states are land – scarce economies, though the total geographical area is large. The density of
population ranges from 17 persons per square km (Arunachal Pradesh) to 397 (Assam) in
2011. In fact, the density of population in North Eastern states except for Assam is less than
the national average. However, in the states like Arunachal Pradesh, Manipur, Meghalaya,
Mizoram and Nagaland, the hilly terrain constitutes more than 90 percent of the total
geographical area and thus the plain land available for cultivation is around 5 percent only.
We may have an idea of agricultural land resources of the North East region from Table 1.6.
Table 6.6 Land Availabilities in North – Eastern Region 2010-11
State Geographical Area
in hectare Net Sown Area
(000 ha) Per Capita Net
Shown Area (ha)
Per cent of Net Sown Area to
Geographical Area
Arunachal Pradesh
8,374,300 212000 0.15 2.53
Assam 7,843,800 2,811,000 0.09 35.84
Manipur 2,232,700 233000 0.09 10.44
Meghalaya 2,242,900 283000 0.10 12.62
Mizoram 2,108,100 361000 0.33 17.12
Nagaland 1,657,900 123000 0.06 7.42
Sikkim 709,600 77000 0.13 10.85
Tripura 1,048,600 280000 0.08 26.70
NER 26,217,900 1,178,000 0.03 14.49
Source: Basic Statistics of NER, 2015

145
Table 6.6 shows that contrary to common belief, as for as agriculture land is concerned, the
region does not enjoy special advantage as compared to the rest of India. The per capita net
sawn area is low in all the state of North-East India is spite of low population base. As far as
percent of net sawn area to total geographical is concerned, in some states like Arunachal
Pradesh and Nagaland, it is as low as 2.53 percent and 7.42 percent respectively. On the
whole, the region’s net sawn area constitutes only 14.49 percent of its geographical area
which is much lower than the national average.
(b) Mineral Resources: The North Eastern Region is rich in mineral resources. The most
important resources are crude oil and natural gas. If properly utilized, these resources may
prove the path of rapid industrialization in the region. Coal, limestone, chromites etc. also
offer good scope for mineral based industrialization of the region. Table 1.7 provides the
availability of major minerals of the different states of North East India in terms of quantity
and approximate money value.
Table – 6.7 Production of Minerals and Ores in NER 2011-12
State
All Mineral Value
Fuel
Non-Metalic Minerals
Coal
Natural Gas
Petroleum (Crude)
Total Value
Limestone
Minor Mineral
value (rupees)
Quantity (000, tonnes)
Value (rupee
s)
Quantity
Value (rupees)
Quantity (000,
tonnes)
Value (rupee
s)
Quantity (000, tonnes)
Value
(rupees)
Arunachal Pradesh 3874605 221
1464100 40 256040 118
2154465 3874605 0 0 201
Assam 1143901
60 602 398800
0 2905 1859490
5 5025 917473
55 1143302
60 242 5990
0 1523
Manipur 0 0 0 0 0 0 0 0 0 0 270986
Meghalaya
49172145 7206
47739800 0 0 0 0
47739800 3606
1427008 2866
Mizoram 0 0 0 0 0 0 0 0 0 0 72075
Nagaland 0 0 0 0 0 0 0 0 0 0 1711
Sikkim 0 0 0 0 0 0 0 0 0 0 1774
Tripura 4122244 0 0 644 4122244 0 0 4122244 0 0 18787
NER Total 1715591
54 8029 531919
00 3589 2297318
9 5143 939018
20 1700669
09 3848 1486
908 10634
Source: Basic Statistics NER, 2015.
From table 6.7 it is found that in terms of production of mineral value, Assam tops the list
(66.67 percent) followed by Meghalaya (28.67 percent). The rest belongs to Tripura and
Arunachal Pradesh. The four states like Manipur, Mizoram, Nagaland and Sikkim do not

146
have much minerals for economic use. However the region as a whole is rich in mineral
resources. Hence, attempts may be made to examine the economic feasibility for their
exploitation. In fact, and integrated approach is necessary for long term sustainability,
keeping in view the diverse needs of socio-economic activities and environmental
preservation.
(c) Water: The North Eastern Region of India is very rich in terms of many rivers, streams,
floodplain wetlands etc. The rivers Brahmaputra and Barak form the principal drainage of the
region with its numerous tributaries flowing through the different states. In fact, the region
consists of only 7.9 percent of total geographical area of the country but it contains 9.58
percent of rivers and canals, and 19.42 percent of floodplain lakes etc. The large river
systems in the region along with structure of land forms provides ideal condition for
generation of hydro power. The status of major hydro power development in the region is
furnished in table 1.8.
Table 6.8
Status of Hydro Electric Potential Development in North Eastern Region, 2019
Region/ States
Identified Capacity
MW
Capacity in Operation
(percentage)
Capacity under Construction (percentage)
Capacity yet to be Taken up under Construction
(percentage)
1 Arunachal Pradesh
50328 1.03 5.19 93.78
2 Assam 680 53.85 0 46.15
3 Manipur 1784 5.96 0 94.04
4 Meghalaya
2394 14.01 0 85.99
5 Mizoram 2196 2.82 0 97.18
6 Nagaland 1574 5.17 0 94.83
7 Tripura 15 0 0 0
Sub Total (NER)
58971 2.45 4.46 93.1
All INDIA 148701 27.95 7.45 64.6
Source: Ministry of Power, Government of India, 2019
Table 6.8 shows that North Eastern Region has around 40 percent identified hydro power
generator capacity of India and among the states of North East India; Arunachal Pradesh has
the highest potential i.e. around 85 percent of the region’s identified capacity. However as far
the utilization of hydro power is concerned, the region is able to use only 2.45 percent of
identified capacity and 4.46 percent is under construction. Assam is the only state which is
able to use more than 50 percent of its identified capacity. On the other hand Arunachal
Pradesh has the highest potentials but it is able to use only 1.03 percent of identified capacity.

147
Forests: Forests are the most important natural resource of the region and they play an
important role in the economic life of the indigenous people of the hilly areas of the region.
For example, the region consists of around 7.9 percent of total area of the country but it
contains around 25 percent of total forests in India. The coverage of forest area in the region
as per data based on satellite imagery is given in table 1.9.
Table 6.9 Coverage of Actual Forest Area of the North-Eastern Region, 2015 (In Percentage)
State Dense Forest Open Forest Total
Arunachal Pradesh 77.17 22.83 79.96
Assam 46.21 53.78 35.83
Manipur 42.76 57.24 77.69
Meghalaya 57.38 42.62 76.45
Mizoram 32.95 67.05 86.27
Nagaland 46.73 53.03 75.33
Sikkim 79.43 20.52 47.13
Tripura 76.39 23.61 73.68
NER 59.74 40.26 65.34
Source: Basic Statistics of NER, 2015
Table 6.9 shows that around 65.34 percent of total geographical area of the region is
covered under forests. Among the constituent States, Mizoram (86.27 percent) has the highest
coverage followed by Arunachal Pradesh (79.96 percent). On the other hand, Assam has
35.84 percent of its geographical area under forests.
If we take its account only dense forests of good commercial value and ecological
importance, it is only Arunachal Pradesh which can boast of really rich forest resources
having 77.17 percent of the total forests is under dense forests. In other States, major part of
the forest areas belong to the ordinary category consisting of degraded forests. The fact is that
a significant forest area in hilly states being degenerated implies that on the one hand these
are not available for settled agriculture and on the other hand, they do not yield much income
or flow of economic benefits to the region.
6.8. Status of Human Development in North East India
The concept of development has been changing over a period of time. The link
between economic growth and development was a subject of global discussion during second
half of 20th century. By the early 1960s, economic growth has emerged as the goal as well as
indicator of progress in many countries. The process of development as the World Bank
defines aims at raising the income and average material well being of the people of a country.

148
The concept of human development has evolved from the development debate in the 1970s
and 1980s. The increasing visibility and growing popularity of the concept of human
development has created an entirely new paradigm of public policy making particularly in
developing countries. Human development is not just another dimension of development, it is
altogether a new perspective and a revolutionary way to recast own conventional approach to
development. What is ‘new’ in this approach to development is that the focus is on human
beings and not just on the economy. Thus, Human development model enacts a radical shift
of focus from the basket of the goods and services approach to human beings and their choice
sets, their freedoms and especially in shaping their capability and well being (UNDP, 1990).
Thus, the human development index (HDI) is basically a composite index based on three
dimensions of human development i.e. income health and education and the HDI puts equal
emphasis on all the three dimensions of development.
With this background an attempt was made to examine the status of human
development of North Eastern States in India over a time period of around two decades. This
is furnished in table 1.10.
Table 6.10 HDI of North Eastern States and India in 2000 and 2017
State/ Country HDI 2000 HDI 2017
Value Rank in
India Rank in
North-East Value Rank in India
Rank in North-East
Arunachal Pradesh
0.561 17 5 0.658 24 5
Assam 0.453 23 8 0.605 30 8
Manipur 0.525 10 3 0.695 15 3
Meghalaya 0.470 19 7 0.650 26 7
Mizoram 0.532 8 2 0.697 14 2
Nagaland 0.524 14 4 0.676 20 4
Sikkim 0.515 5 1 0.716 10 1
Tripura 0.532 18 6 0.655 25 6
India 0.493 130 - 0.640 131 -
Source: National Human Development Index, 2001 and 2018.
Table 6.10 reflects that there are wide variations of HDI among the states of North East India.
For example, in 2000 there are three states like Sikkim, Mizoram and Manipur which were
within top ten ranked states of India in terms of HDI. This is basically due to high per capita
income and high literary rate of these three states. At the same time there are three states like
Assam, Tripura and Arunachal Pradesh which are in the bottom segment. After a gap of 17
years, i.e. 2017, it was found that there is no doubt of improvement of absolute value of HDI
of all the states of North East but their relative ranks among the states of India has fallen
sharply. For example, in 2017, there is only one state i.e. Sikkim which is among the top ten

149
ranked states of India. In facts, Sikkim is able to keep its position because of steady rise in
per capita income and significant improvement of social sector. On the other hand most of the
states of North East are in bottom segment in 2017. For example, five of the states of North
East like Nagaland, Arunachal Pradesh, Tripura, Meghalaya and Assam were ranked 20 and
above among 29 states of India while the other two Manipur and Mizoram were in range of
14 to 19 category. The most important thing to observe is that the rank of all states of North
East India in human development attainment deteriorated hugely between 2000 and 2017,
obviously deteriorating HDI suggests falling social sector outcomes in relative terms.
Let us have a bird’s eye view of status of human development in Arunachal Pradesh
and its districts. The Department of Economics of Rajiv Gandhi University (formally
Arunachal University) prepared the first Human Development Report of the state in
collaboration with UNDP and State Government which was published in 2005. The report
was based on large scale primary survey in all the districts of the state in order to estimate life
expectancy and human poverty. The HDI in Arunachal Pradesh for 2001 was estimated to be
0.515. Of the three indices of HDI, the value of education index was 0.566, the health index
was 0.484 and the income index had a value of 0.495. However, the districts of Arunachal
Pradesh showed a significant variation in level of HDI. The details are furnished in table
6.11.
Table – 6.11 The Human Development Index for Arunachal and its districts, 2001
Districts/States HDI Value HDI Rank
Tawang 0.555 6
West Kameng 0.573 3
East Kameng 0.362 13
Papumpare 0.573 3
Lower Subansiri 0.425 11
Upper Subansiri 0.438 10
West Siang 0.558 5
East Siang 0.66 1
Upper Siang 0.524 7
Dibang Valley 0.659 2
Lohit 0.518 8
Changlang 0.452 9
Tirap 0.397 12
Arunachal Pradesh 515 -
Source: Arunachal Pradesh HDR 2005
150
Table 6.11 reflects that East Siang district had the first rank with an HDI 0.660.
Dibang Valley was ranked second with an HDI value of 0.659. Papumpare, the district in
which the state capital located was the third place together with West Kameng. On the other
hand East Kameng and Tirap districts were at the bottom as per Human Development Report
of Arunachal Pradesh, 2005.
6.9: Summary
Our analysis reflects a few points which are as follows:
North East India is a heterogeneous in terms of physical features, ethnic composition,
literary rate, urbanization rate and other demographic features as well as stages of
economic development yet the North Eastern states are an inter-dependant economic
system.
The region has a few unique feature like rapid transition of the traditional economies
to an integrated market system but with imperfections in factor market.
In terms of relative economic performance, the North Eastern region is lagging for
behind of national economy particularly after economic liberalization. However there
are wide variations among the different states of North East India.
Arunachal economy performed very efficiently in terms of growth of NSDP and per
capita NSDP during seventies and eighties. However, the situation was different
during nineties.
With rise in per capita income of Arunachal Pradesh, there is rapid structural
transformation of the economy. The services sector in Arunachal Pradesh has come to
occupy a predominant position in State’s income, a position that is much higher than
agriculture, the traditional occupation of the people.
The North Eastern region is rich in natural resources like land, mineral, water, as well
as forests but these resources are not properly used for the economic development of
the region.
The picture of development does not only have brightness, but there are some dark
patches as well. For example, most of the states in North East India are ranked low
and very low in terms of human development index. What is more important is that
their ranks deteriorated over time period 2000-2017.
151
6.10 Key Words:
- Gross Domestic Product: The value of final goods and services produced in
an economy during a period of time. The economy may relate to a country or a
state or a district etc. The period is normally one year.
- Net Domestic Product (NDP): When depreciation of capital is deducted from
GDP, we have NDP.
- Gross National Product: GDP plus net factor income from abroad.
- Net National Product: GDP minus depreciation of capital
- Per capita Income: NNP divided by population.
- Structural Transformation of an economy: This is the changes in the
sectoral composition of incomes labour force etc.
- Shifting cultivation: It is also known as by other names like swidden or slash
and burn cultivation on jhuming or jhum cultivation. This agricultural practice
uses the land extensively.
6.11: Check Your Progress / Questions
I. Short Questions
i. What are the three broad sectors of an economy?
ii. Why is service sector more important in Arunachal Pradesh?
iii. How did the process of development begin in North East India?
iv. What are the three important features of North East economy?
v. What are the important renewable natural resources of North East India?
vi. What do you mean by human development?
II Long Questions
i. Describe on overview of North East economy.
ii. Discuss the basic features of North East economy.
iii. Explain the relative economic performance of North Eastern Region and its
constituent States.
iv. Describe the level and growth of NSDP and per capita NSDP of Arunachal
Pradesh for three decades.
v. Discuss changing sectoral contribution to state income and sectoral contribution to
growth of income of Arunachal Pradesh.
vi. Describe briefly the natural resource base of North East India.

152
vii. Explain the status of human development in North East India and Arunachal
Pradesh.
6.12: Suggested Readings
i. Baruah, Alokesh (ed), India’s North East Development Issues in a Historical
Perspective, Manahor Publish, New Delhi, 2005.
ii. Banarjee Amalesh et. al (eds), Economic Planning and Development of North Eastern
States, Kanishka Publishers, New Delhi, 1999.
iii. Government of Arunachal Pradesh, Human Development Report of Arunachal
Pradesh, 2005.
iv. Government of India, Arunachal Pradesh Development Report, 2009.
v. Mitra, A, Internal Migration and Economic Development in the Hills of North East
India, Omsas, New Delhi, 1999.
vi. Roy, N.C. and P.K. Kuri, Land Reform in Arunachal Pradesh, Classical Publishing
Company, 2001.
vii. Sarma Atul, String of Thoughts on North East India, An Economist’s Perspective,
Aakar Book, New Delhi, 2018.

153
UNIT-VII
AGRICULTURE IN NORTHEAST INDIA
Structure
7.0 Introductions
7.1 Objectives
7.2 Agricultural Practice in the region: Permanent cultivation, shifting cultivation and
its effects, jhum cultivation and the problem of induction of new technology.
7.3 Land Tenure and Problem of Agricultural credit
7.4 Land Use Pattern and Cropping Pattern in Northeast India
7.4.1 Land Use Pattern in Northeast India
7.4.2 Cropping Pattern in Northeast India
7.5 Need for land reform with reference to Arunachal Pradesh
7.6 Agricultural Productivity in Northeast India
7.6.1 Causes of Agricultural Low Productivity in Northeast India.
7.7 Further Readings
7.0 INTRODUCTION
Agriculture in India is considered to be the backbone of the country and also regarded as the
largest sector of the country's economic activity. It is the major sector of the State economy,
in which the majority of people earn their livelihood. Though the share of agriculture in the
aggregate economy has declined rapidly during the planned development of the country, it
assumes a pivotal role in the rural economy. The contributory share of agriculture in GDP has
declined from 53.1 per cent in 1950-51 to 13.1 per cent in 2011-12AE (Economic Survey
2012-13).
7.1 Objectives
Know about the agriculture situation in Northeast India
The Extent of Jhum Cultivation and its effects
Land Tenure, Land Use Pattern and Cropping Pattern in Northeast India
Land Reform in Arunachal Pradesh
Agricultural Productivity and the causes of low productivity
154
7.2 Agricultural Practice in the region: Permanent cultivation, shifting cultivation and
its effects, jhum cultivation and the problem of induction of new technology.
The Northeast India comprises of eight states namely Arunachal Pradesh, Assam, Meghalaya,
Manipur, Mizoram, Nagaland, Sikkim and Tripura with a total geographical area of 262180
km2 which is about 8% of the country’s total area. It lies between 21.5°N to 29.5° N latitude
and 85.5° E to 97.5° E longitude and the majority of the population in the region is
predominantly tribal, which mainly dependent on agriculture and land-based activities.
Agriculture and allied sector is the major source of livelihood for the majority of the
workforce (around 50-70% across the states). The region is characterized with diversified
agro-climatic condition, different soil types, and irregular physical features and the region is
also lagging behind in development. The agricultural practices of North East India are of two
types- (i) Shifting cultivation, and (ii) Settled or plains agriculture. Rice and maize are the
leading crops in both hilly regions and plain areas of the region. The modern agricultural
inputs which are used in agriculture are comparatively low.
The region is endowed with a varied topography and agro-climactic conditions which offer
vast potential for agriculture, horticulture and forestry. However, the region is lagging in
agricultural development contrary to the mainland India. The main reasons behind the low
level of agriculture development in the region is lack of appropriate strategies for the
development of natural resources, inadequate infrastructure facilities and low adoption of
improved technology.
7.2.1. Shifting Cultivation and its effects, Jhum Cultivation and the problem of
induction of new technology
The shifting cultivation commonly known as Jhumming which is one of the most
ancient systems of farming and it is also known as Slash and Burn method of cultivation. On
the basis of archaeological evidence and radio-carbon dating, the origin of shifting cultivation
could be traced back to about 8000 BC in the Neolithic period which witnessed the
remarkable and revolutionary change in man’s mode of production of food as from hunter
and gatherer he became food producer. Earlier cultivators used fire-stone, axes and hoes,
while farmers in the present-day used digging sticks, iron tools, iron digging sticks, daon, hoe
and knives. In the tropical rain forest of Central Africa, Central America and Southeast Asia,
the shifting cultivation is the primitive form of soil utilization.

155
Shifting cultivation is known by different names in different parts of the world. It is
generally known as ‘slash and burn’ and ‘bush fallow’ agriculture. It is termed as Ladcmg in
Indonesia, Caingin in Philippines, Milpa in Central America and Mexico, Ray in Vietnam,
Conuco in Venezuela, Roca in Brazil, Masole in the Congo and Central Africa. It is also
practiced in the highlands of Manchuria, Korea and southwest China. In the hilly states of
Northeast India it is commonly known as Jhum Cultivation. In mainland India, it is know by
various names such as Podu, Dabi, Koman or Bringa in Orissa, as Kumari in Western Ghats,
as Watra in southeast Rajasthan, as Penda, Bewar or Dahia and Deppa or Kumari in the
Bastar district of Madhya Pradesh.
Shifting cultivation has been characterized as rotation of fields rather than rotation of
crops, absence of draught animals and manuring, use of human labour only, employment of
dibble stick or hoe, and short period of occupancy alternating with long fallow periods. When
the natural fertility of land get exhausted after two or three years the fields are abandoned, the
cultivators shift to another clearing, leaving the old one for natural recuperation. Thus such
practice is known as ‘shifting cultivation’.
7.2.2 Steps involve in process of jhum cultivation
a) Selection of the forested hilly land
b) Clearing the forest tract by cutting down the jungle and burning the dried forest wood
into ashes
c) Worship and sacrifice
e) Dibbling and sowing seeds
f) Weeding and protection of crops
g) Harvesting and thrashing
h) Merry making and feasts
i) Fallowing
The usual process demands the selection of a plot on or near the hill side or jungle. The
selection of land is made in the months of December and January. The fertility of the soil is
judged by the color and texture of the soil. In some tribes, community as a whole is
collectively responsible for the clearing of the selected piece of land while in others the
cutting of trees and shrubs is made by the respective family to whom the land has been
allotted. The area allotted per family varies between half hectare to one hectare among the
different tribes, regions and states. The land is cleared of all its undergrowth and the branches
of trees are lopped off. The cleared growth is allowed to dry on the field. This process of
156
clearing which takes over a month is labour intensive, which are being undertaken with
indigenous and primitive equipment’s.
The dried growths, as well as the trees standing in the clearance, are set on fire. The
cultivators take care that the fire should not spread into the forest. After the burning is
complete, the un-burnt or partly burnt rubbish are collected in one place for the complete
burning. The fire kills the weeds, grasses and insects. Then, the ashes are scattered over the
ground and dibbling of seeds begin in March before the advent of pre-monsoon rain. Before
sowing starts, evil spirits are worshipped and sacrifices are made for a good crop and
prosperity to the family. The seeds are sown either by broadcast or dibbling. The dibbling and
planting of seeds is an exclusive job of the female members. The male members broadcast
seeds of crops like millets and small millets, whereas crops like maize, pulses, sesamum and
vegetables are dibbled by females. While dibbling the seeds, the woman walk over the field
with a digging stick or bill-hook in hand, make a hole in the ground, sow a few seeds and
cover it over with earth by pressing it down with her toe.
At the advent of rains, the seeds begin to sprout. Thus, the soil is never ploughed and
no artificial irrigation is made. After sowing the crop, farmer pays cursory attention to the
crop and to remove weeds from the field. The crop is, however, protected from stray cattle
and wild animals by fencing the fields with bamboo. Many Jhumias construct a hut in the
field to look after the crop properly.
7.2.3 Jhum Cycle:
The jhum cycle is influenced by the pressure of population, nature and density of
forests, terrain, angle of slope, texture of soil and the average annual rainfall. Areas of sparse
population generally have longer jhum cycle (15-25 years), while areas with high density of
population have shorter jhum cycle (5-10 years). The patches of land for shifting cultivation
are not selected in any given order or sequence. There is always a room for choice. The
period of consecutive cropping and fallowing differs from region to region and from tribe to
tribe. But over the period of time, with the increase in population the jhum cycle became
shorter and shorter. In brief, in the earlier decades, the period before which the Jhumias
returned to cultivate the same plot was quite long. This was partly due to the limited
population and partly to the better fertility of soil which used to be rested for nearly thirty to
forty years.
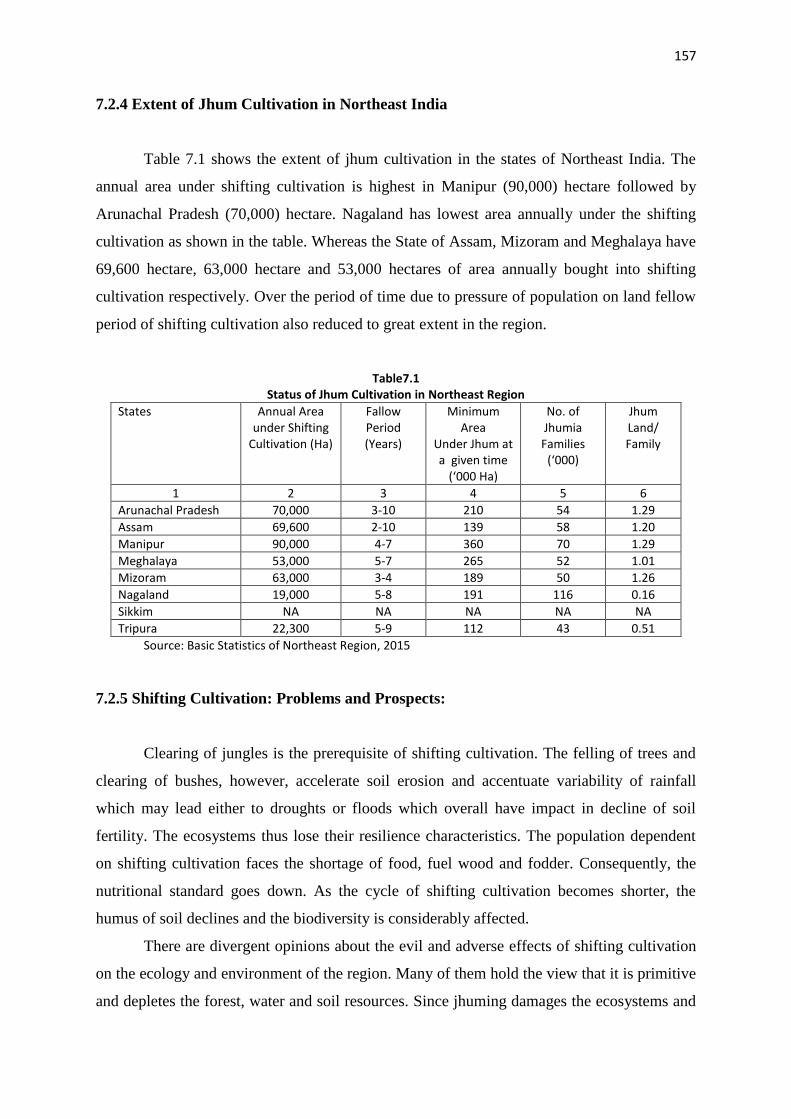
157
7.2.4 Extent of Jhum Cultivation in Northeast India
Table 7.1 shows the extent of jhum cultivation in the states of Northeast India. The
annual area under shifting cultivation is highest in Manipur (90,000) hectare followed by
Arunachal Pradesh (70,000) hectare. Nagaland has lowest area annually under the shifting
cultivation as shown in the table. Whereas the State of Assam, Mizoram and Meghalaya have
69,600 hectare, 63,000 hectare and 53,000 hectares of area annually bought into shifting
cultivation respectively. Over the period of time due to pressure of population on land fellow
period of shifting cultivation also reduced to great extent in the region.
Table7.1 Status of Jhum Cultivation in Northeast Region
States Annual Area under Shifting
Cultivation (Ha)
Fallow Period (Years)
Minimum Area
Under Jhum at a given time
(‘000 Ha)
No. of Jhumia Families
(‘000)
Jhum Land/ Family
1 2 3 4 5 6
Arunachal Pradesh 70,000 3-10 210 54 1.29
Assam 69,600 2-10 139 58 1.20
Manipur 90,000 4-7 360 70 1.29
Meghalaya 53,000 5-7 265 52 1.01
Mizoram 63,000 3-4 189 50 1.26
Nagaland 19,000 5-8 191 116 0.16
Sikkim NA NA NA NA NA
Tripura 22,300 5-9 112 43 0.51
Source: Basic Statistics of Northeast Region, 2015
7.2.5 Shifting Cultivation: Problems and Prospects:
Clearing of jungles is the prerequisite of shifting cultivation. The felling of trees and
clearing of bushes, however, accelerate soil erosion and accentuate variability of rainfall
which may lead either to droughts or floods which overall have impact in decline of soil
fertility. The ecosystems thus lose their resilience characteristics. The population dependent
on shifting cultivation faces the shortage of food, fuel wood and fodder. Consequently, the
nutritional standard goes down. As the cycle of shifting cultivation becomes shorter, the
humus of soil declines and the biodiversity is considerably affected.
There are divergent opinions about the evil and adverse effects of shifting cultivation
on the ecology and environment of the region. Many of them hold the view that it is primitive
and depletes the forest, water and soil resources. Since jhuming damages the ecosystems and
158
should be stopped completely. According to the opposite views, supporting the continuance
of shifting cultivation with necessary and effective reforms, it does little damage to soil
erosion as the high humidity and heavy rainfall in the region do not permit the soil to remain
uncovered for long. Some form of vegetation immediately covers the top soil which checks
the soil erosion.
During the agricultural operations also, as no ploughing, hoeing and pulverization of
soil is done, the soil remains compact. Moreover, jhuming lands are on steep slopes on which
sedentary cultivation cannot be developed easily. In fact, jhuming is a way of life, evolved as
a reflex to the physiographical character of land under special ecosystems. It is practiced for
livelihood and not without the knowledge of its adverse effects. Assessing the fact that
jhuming system cannot be stopped altogether, it is necessary to make the process more
productive so that it may sustain the growing pressure of Jhumias population at a reasonably
good standard of nutrition. For a change in jhuming typology it is essential that the Jhumia is
provided with land where they can cultivate and derive profits permanently.
Once the retrain ability of soil is ensured, then the question of augmenting the soil
fertility through the addition of manures and fertilizers could be meaningful. Measures should
be taken to see that Jhumias are trained in other types of occupations. They should be given
training in raising trees, orchards and plant protection, cottage and small industries, and
indigenous handicrafts. Moreover, they should be trained in the development of dairying,
piggery, sheep-rearing, poultiy, duck-keeping, fisheries, beekeeping, agriculture, etc. New
crops of economic importance have to be developed and their diffusion should be extended in
the isolated hilly areas. In fact, a cropping pattern with higher inputs will enable greater
yields to be obtained per unit area and that will help in detracting the Jhumias from the
uncertain way of life of shifting cultivation.
The main approach to overcome the evil of shifting cultivation should be to change
the jhuming lands into sedentary farms. In the hilly areas, one of the most common measures
that have been adopted in many small tracts with success is the construction and development
of terraces. The different types of terraces can be adopted to fit in with a particular type of
ecosystem. These terraces have a definite advantage towards achieving sedentary farming in
the areas of shifting cultivation. It has been accepted by most of the planners that terracing
has to play a major role if agricultural land use in the hilly tracts is to be made more efficient.
There are, however, many techno economic problems in the development of terraces.
Terracing, apart from being a costly measure, requires adequate irrigation facilities which in
159
the mountainous areas cannot be provided easily. It, therefore, may not be feasible to go for
large scale terracing. The human energy input used in the jhuming, however, can be used for
the development of small terraced farms. In several tracts on the northeastern hill region,
terraces have been developed with the help of local human energy input involving very little
direct monetary input.
Shifting cultivation is one of the greatest threats to the biodiversity of our planet,
destroying about 10 million hectares of tropical forests annually. Nevertheless, it supplies
farming families with food, firewood, medicines and other domestic needs, though it pro-
duces low yields of crops and has almost no potential beyond subsistence farming. Moreover,
where population densities are low and forest areas vast, slash and burn practices are
sustainable and harmonious with the environment. The long term objective should be to de-
velop alternatives to shifting cultivation that are ecologically sound, economically feasible,
and culturally acceptable.
The environmental degradation as a result of shifting cultivation may be checked
substantially by:
i) Developing practical and relevant guidelines for policies that encourage farmers to adopt
technologies that are eco-friendly and environmentally sound;
ii) Improve conditions for people living near the forests by diversifying land use and thereby
increasing food production;
iii) Protect biodiversity and ensure better use of genetic resources;
iv) Increase soil productivity and reduce emission of greenhouse gases by capturing carbon in
the soil. Intensification and modification of traditional systems—prolonged cropping cycles
and decreased fallow periods—will lead to increased soil organic matter and plant biomass;
v) Involve local people at all stages of decision making as well as in all research processes;
vi) Amalgamate the most indigenous knowledge, and national and international experience
and expertise;
vii) Develop suitable strategies for agricultural marketing and subsidies;
viii) Design biological barriers to prevent soil erosion and water runoff;
ix) Develop tree, crop and pasture systems that cycle nutrients and enhance soil fertility,
reducing the need for expensive inorganic fertilizers; and
x) Evaluate policy option for reclamation of degraded lands.
160
7.3 Land Tenure and Problem of Agricultural credit
Northeastern region is inhabited mostly by the tribal population, the land tenure
system in the hills of northeast is much different from that of the plains part of India. Also in
the plains of the North East individual rights over land holding are transferable and buying
and selling of such rights are ordinarily unrestricted. However in the hill areas individual
rights over land is yet to take the form of full property rights in the sense that transfer of these
rights is subject to restrictions. Non-transferability of land holding rights renders land
unsuitable as collateral for the purpose of securing institutional credit to land holders.
Whereas, the plains parts of the northeast region are by and large free from these
problem. This leaves out the Brahmaputra and the Barak Valleys of Assam (80% of the
geographical area of Assam), the Imphal Valley of Manipur (10% of geographical area) and
the plain areas of Tripura (40% of geographical area). The plains as usual are much more
thickly populated than the hills and accommodate about 70% of the population of the region.
Nonetheless the parts of the region comprised of the states of Arunachal Pradesh, Nagaland,
Mizoram and Meghalaya, and the hill districts of Assam, Manipur and Tripura still accounts
for a significant part of the economy of the region in which penetration of bank credit is
hindered by non-establishment of transferable property rights on land.
Agriculture in the plains of northeast region is settled. As the land revenue being an
important source of income for the government, land had been surveyed, titles had been
giving ownership to individuals or institutions, and land holders were given title documents
from the governments. Holding rights conferred in this manner are by and large heritable and
transferable, and hence these rights are of the nature of full property rights as in other parts of
the country. Obviously such land tenure system does not constitute an institutional hurdle for
delivery of bank credit backed up by land as collateral.
In contrast agriculture in the hills of northeast region, traditionally are shifting in
nature. Such agricultural practice makes the population nomadic with no settlement of
population in a fixed location. Land used to be communally held and the right to land used to
be distributed to families according to customary norms by the village council or the village
chief. Also the absence of land revenue did not necessitate cadastral survey and settlement of
land ownership. In this context it is perhaps significant to note that the system of

161
administration established in the plains of the region under British colonial rule was not
extended to the hills. The hills were classified as ‘excluded’ or ‘partially excluded’ areas and
tribal communities living in such areas were allowed to continue with their traditional
arrangements of self-governance. After independence sixth schedule is incorporated in the
constitution in an attempt to integrate these areas while preserving the traditional institution
of self-governance of tribal communities of the region. Meanwhile penetration of market
forces, the practice of settled cultivation and also urbanization has induced settling down of
hill tribal population in fixed locations. The process has been instrumental in emergence of
individual holdings in hill areas. This development has, however, not been backed up with
cadastral survey and land settlement which could have been followed up with giving
documents conferring legal ownership rights over holdings. The evolution of land holding
rights to full property rights has hence remained incomplete.
In those parts of the hills of the North East where individual holdings of land have
emerged, transfer of the holding is possible and it takes place frequently but within the tribal
population only. The details of the modalities of such transfers differ from state to state and
also in some cases even within the state. The transfer by sale of individual holdings within a
village can take place within members of the same tribe, and such transfers are recognised by
the village community. In some cases, sale deeds on plain or stamped papers are executed by
the transacting parties to record the transfer. But the process does not result in any formal
record or documents conferring land holding rights. The Inter-tribal transfer of individual
holdings of village land is generally not in practice, though such transfer of communally held
land are known to be in practice. In towns, transfer of land holdings among individuals of
even different tribes but of the same state is generally permissible. But transfer of land
holding rights to non-tribal is prohibited by law in all the hill areas to prevent alienation of
tribal land.
At present in the hills of northeast region there are two system of land tenure exist: (a)
community ownership of land in areas where shifting cultivation is still practised and the
households enjoy user rights to land allocated to them by traditional authority and (b)
individual ownership of land which is transferable only within members of local tribal
community. The first type of land tenure is not only problematic as far as use of land as
collateral for advancing bank credit is concerned, but does not even create incentives for
investment for land improvement and conservation of its long term use-value. And in the

162
second type, where individual holdings have emerged, problem in use of land as collateral for
bank loan can yet arise because of absence of documents formally entitling individuals with
ownership. Without such a document banks are reluctant to take land holding rights as
collaterals for advancing credit.
7.4 Land Use Pattern and Cropping Pattern in Northeast India
7.4.1 Land Use Pattern in Northeast India
The land use pattern of northeast is shown in table 7.2, where the figure shows the different
uses of land as percentage of total land utilization.
Table 7.2 Land Use Pattern in Northeast India during 2014-15
(As Percentage to total land utilization)
States
Forest
Not
Available for
Cultivation
Permanent
Pastures and other
grazing land
Land Under Misc.Trees crops and
groves
Culturable wasteland
Fallow land
other than
current fallow
Current fallow
Net area sown
Arunachal Pradesh
93.0 0.9 0.2 0.5 0.9 0.9 0.5 3.1
Assam 23.6 31.4 2.1 2.8 1.8 1.1 1.1 36.0
Manipur 80.3 1.3 0.0 0.3 0.0 0.0 0.0 18.1
Meghalaya 42.2 10.7 0.0 7.4 17.4 6.9 2.7 12.8
Mizoram 77.7 3.7 0.5 2.0 0.3 6.2 2.3 7.1
Nagaland 52.2 5.8 0.0 5.6 4.1 6.0 3.0 23.2
Sikkim 76.0 2.3 0.0 0.9 0.9 1.1 1.6 17.4
Tripura 60.0 13.9 0.1 1.0 0.3 0.2 0.1 24.3
All India 23.3 14.3 3.3 1.0 4.1 3.6 4.9 45.5
Source: NEDfi Data Bank, 2019
The above table represents the land use pattern in Northeast India during the year 2014-15.
From the table it can be seen that, Arunachal Pradesh has the highest land under forest
coverage i.e. about 93 percent of the total land is covered by forest followed by Manipur
(80.3 percent). 23.6 percent of the land in Assam is covered under forest which is equivalent
to All India level (23.3 per cent). 31.4 per cent of the total land under Assam is not available
for cultivation. Among all the Northeast Indian state Assam has highest lands that is not
available for cultivation, in the year 2014-15 followed by Tripura and Meghalaya. In Assam
the land under permanent pastures and other grazing land constitute 2.1 per cent of the total
land. Whereas states like Manipur, Meghalaya, Nagaland and Sikkim have zero (refer to
table) pastures and grazing lands. Meghalaya have 7.4 percent of the total land under misc.
163
trees, crops and groves. 17.4 percent of the total land under Meghalaya comes under
wastelands. Other north east states have only margin of land under cultivable wastelands. The
total lands covered under fallow and other than current fallow are greater than the land under
current fallow in all the Northeast state except for Tripura. But at All India level, land
coverage under current fallow (4.9 percent) is higher than land coverage under current Fallow
(3.6 percent). 36 percent of the total land in Assam is used under net area sown, whereas in
Arunachal Pradesh only 3 percent of the total land is covered by net area sown. Thus, form
the above table it can be concluded that in Northeast Indian states the total lands are covered
with forest except for Assam where only 23.6 percent of land is covered by forest.
7.4.2 Cropping Pattern in Northeast India
The table 7.3 represents the cropping pattern of North East Indian states. Cropping pattern
means the proportion of area under various crops at a point of time. The figures are calculated
as total area under various crops at given year divided by total cropped area. From the table
it can be seen that all the states cultivate both food grains (rice, wheat, millets, pulses) and
non food grain (oilseeds, fruits, vegetables, spices). As per the figures the cropping pattern in
the state are dominated by foodgrains in 2012-13 (70% in Arunachal Pradesh, 66 percent in
Assam, 56 percent in Tripura, 61 percent in Nagaland). With food grains rice has the highest
gross cropped area in all the states where cropping pattern are dominated by foodgrains
except in Sikkim where the maize constituted 29 percent of gross cropped area. Mizoram is
the only state whose cropping pattern is dominated by non foodgrain; fruits crop constituting
50 percent (in 2013-14) of the gross cropped area. Among the foodgrains wheat has the
lowest share in the cropping pattern in all the eight states with only marginal or zero shares in
the gross cropped area which is comparatively lower than all India level which is 15 percent
of the gross cropped area. At all India levels the foodrains (54 percent) dominates the
cropping pattern with rice having the highest share in gross cropped area followed by Wheat.

164
Table: 7.3 Cropping pattern in Northeast India
State /Year Rice Wheat Maize Millets Vegetables Oilseeds Spices Pulses
Fruit Crops
ARUNACHAL PRADESH
2012-13 44.2 1.0 16.7 8.0 0.5 11.3 3.57 3.33 30.48
2013-14 44.6 1.0 15.9 7.7 0.5 11.1 3.44 3.28 30.10
2014-15 42.5 1.3 16.1 8.7 0.6 11.7 3.40 3.85 30.10
ASSAM
2012-13 61.0 0.8 0.6 0.1 6.8 7.5 2.37 3.46 3.70
2013-14 59.7 0.8 0.6 0.1 6.9 7.4 2.27 3.66 3.53
2014-15 61.1 0.6 0.7 0.1 7.1 7.5 2.41 3.63 3.56
MANIPUR
2012-13 39.7 0.8 6.3 0.0 7.0 14.3 3.39 9.81 16.81
2013-14 59.1 0.6 6.9 0.0 6.7 9.8 2.78 8.46 14.34
2014-15 58.6 0.6 6.8 0.0 7.7 9.6 2.73 8.41 14.52
MEGHALAYA
2012-13 32.1 0.1 5.1 0.7 11.9 2.9 4.96 1.06 9.75
2013-14 32.0 0.1 5.3 0.8 12.7 4.0 5.10 0.85 10.29
2014-15 32.2 0.1 5.3 0.8 13.0 4.1 5.10 2.36 10.56
MIZORAM
2012-13 12.6 0.0 5.2 0.0 33.9 1.8 19.37 2.67 42.83
2013-14 34.0 0.0 5.1 0.0 36.1 1.8 19.71 3.42 50.48
2014-15 25.5 0.0 3.9 0.0 30.4 1.4 16.07 2.90 41.57
NAGALAND
2012-13 37.5 0.7 14.0 1.8 5.3 13.2 2.00 8.14 7.61
2013-14 38.0 0.6 13.8 1.7 7.7 13.0 1.96 7.58 8.11
2014-15 39.0 0.6 13.8 1.7 7.7 13.0 1.95 7.40 8.11
SIKKIM*
2012-13 8.3 0.4 27.8 4.5 17.8 5.7 18.44 4.44 10.17
2013-14 7.6 0.2 27.2 2.0 17.8 5.4 21.81 4.29 10.90
2014-15 8.1 0.3 29.3 2.2 21.4 5.8 25.06 4.63 0.01
TRIPURA
2012-13 53.7 0.1 0.8 0.0 9.5 1.0 1.20 1.79 12.68
2013-14 53.6 0.0 1.0 0.0 9.9 1.3 1.20 2.57 14.43
2014-15 53.3 0.0 0.9 0.0 10.1 1.8 1.18 2.42 14.86
ALL INDIA
2012-13 22.0 15.4 4.5 0.4 0.2 13.6 1.58 11.97 na
2013-14 22.0 15.2 4.5 0.3 0.3 14.0 1.57 12.55 3.59
2014-15 22.2 15.9 4.6 0.3 0.3 12.9 1.67 11.87 3.08
Source: NEDfi Data Bank
7.5 Need for land reform with reference to Arunachal Pradesh
The term land reforms are reforms of institutional factors related to land. In order to raise the
agricultural production and also increase the level of income and standard of living of the
cultivators, institutional factors along with technical factors are playing an important role.
These institutional factors include land tenure system, land holdings, farming structure, land

165
distribution, intermediaries etc. The term ‘land reforms’ has two different senses. In a narrow
sense, land reforms are concerned with those reforms related to land ownership and land
holdings. But in a broad sense, the term ‘land reforms’ is used to mean those measures of
reforms necessary to raise agricultural productivity which include reforms relating to fixation
of rent on land, abolition of intermediaries, credit and marketing arrangements etc. The land
reform legislation was passed by the Government of India includes following measures:
1. Abolition of intermediaries.
2. Tenancy reforms to regulate fair rent and provide security to tenure.
3. Ceilings on holdings and distribution of surplus land among the landlords.
4. Consolidation of holdings and prevention of their further fragmentation and
5. Development of cooperative farming.
Northeast India being inhabited by tribal population and majority of population are
engage in agriculture and allied activities as their primary occupation. The natures of
agriculture in the hills of northeast are shifting cultivation and such agricultural practice make
the population nomadic and no fixed location of agriculture field. Further in the hills of
northeast land ownership pattern can be classified into two categories: a) community
ownership and b) individual ownership. The community ownership of land generally belongs
to community or tribes, where the land is distributed among the tribal families by the village
chief or village head for agricultural purpose. On the other hand, individual ownership of land
exists possessing some legal documents of land from the respective government after
recognised by their own tribal community or institution. However, in recent times, the
traditional landownership pattern in the tribal societies of the northeast region in general and
Arunachal Pradesh in particular is undergoing rapid transformation. In Arunachal Pradesh
(Land Settlement and Records) Act of 2000, residents of the state did not have land titles. The
only document the indigenous population received to stake claim to a piece of land was a
“land possession certificate” issued by the deputy commissioner of a district, subject to
approval by the forest department and the village council. Actual ownership continued to rest
with the state government. Keeping apart the government land, most of the land across
Arunachal Pradesh was owned by communities and not individuals. Though people had Land
Possession Certificates (LPCs), for the plots which belonged to them but the LPCs didn’t
give them ownership rights of the land. In the absence of the any formal documents regarding
the land ownership make it difficult for the tribal population of the State to make any
collateral agreement or mortgaged it for loans from banks or any other financial institution.
Thus there need of land reform in Arunachal Pradesh so that the tribal population can enjoy

166
full benefit of land ownership and avail bank loans for the development of agriculture and
other sectors of the State economy. In recent the Arunachal Pradesh Land Settlement and
Records Amendment Bill, 2018, which confers ownership rights to indigenous tribal people
including communities and clans possessing LPCs, was passed State assembly. The bill
recognises ownership right of the citizens, particularly indigenous people of the state and
provides them right to give their land on long-term lease up to 33 years, which is extendable
to another 33 years making it to 66 years in total for big and small ventures.
7.6 Agricultural Productivity in Northeast India
The table 7.4 shows the agricultural productivity in terms of kilograms per hectare of the
Northeast Indian states.
Table: 7.4 Trends in Agricultural Productivity of some major crops in Northeast India
State /Year Rice Wheat Maize Millets Oilseeds Pulses
ARUNACHAL PRADESH
2012-13 1032.41 1498.47 1436.04 1032.41 909 1122
2013-14 1049.78 1510.14 1467.04 1049.78 958 1155
2014-15 1038.46 1973.68 1562.50 1038.46 971 1263
2015-16 1002.18 1969.31 1541.52 1002.18 1040 1015
2016-17 5118.35 1969.31 1500.00 5118.35 1040 1011
2017-18 1020.00 1970 1520.52 1020 1040 1020
Assam
2012-13 494.36 1303.92 897.05 494.36 610 598
2013-14 613.97 1292.43 898.12 613.97 613 695
2014-15 603.00 1216.49 3332.74 603.00 670 748
2015-16 673.58 1633.52 3070.42 673.58 694 757
2016-17 616.34 1343.91 2911.28 616.34 643 735
2017-18 584 1386 3132 584 638 748
Manipur
2012-13 767.54 2500.00 2301.44 729 935
2013-14 871.89 2497.78 2246.45 840 937
2014-15 920.14 2601.85 2243.22 863 959
2015-16 949.76 2497.78 2303.89 847 963
2016-17 955.78 2497.78 2194.03 858 973
2017-18 951 2498 2343 870 965
Meghalaya
2012-13 NA 1806.28 1554.02 767.54 695 1019
2013-14 1880.95 2199.67 871.89 1030 1126
2014-15 1909.09 2259.42 920.14 1071 1405
2015-16 1953.13 2284.12 949.76 1091 1442
2016-17 1913.04 2291.23 955.78 1051 1446
2017-18 1928 2293 951 1057 1439
Mizoram
2012-13 1314.14 1078 1061
2013-14 1420.42 1146 1468
2014-15 1514.94 1117 1416
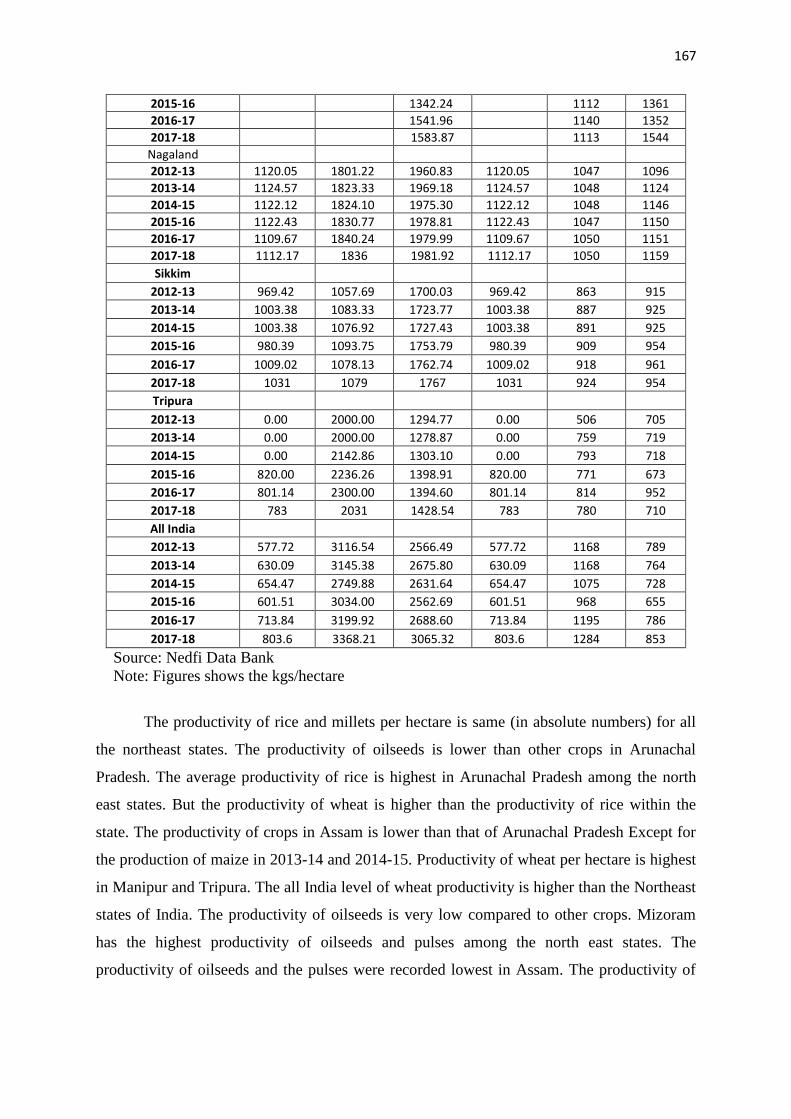
167
2015-16 1342.24 1112 1361
2016-17 1541.96 1140 1352
2017-18 1583.87 1113 1544
Nagaland
2012-13 1120.05 1801.22 1960.83 1120.05 1047 1096
2013-14 1124.57 1823.33 1969.18 1124.57 1048 1124
2014-15 1122.12 1824.10 1975.30 1122.12 1048 1146
2015-16 1122.43 1830.77 1978.81 1122.43 1047 1150
2016-17 1109.67 1840.24 1979.99 1109.67 1050 1151
2017-18 1112.17 1836 1981.92 1112.17 1050 1159
Sikkim
2012-13 969.42 1057.69 1700.03 969.42 863 915
2013-14 1003.38 1083.33 1723.77 1003.38 887 925
2014-15 1003.38 1076.92 1727.43 1003.38 891 925
2015-16 980.39 1093.75 1753.79 980.39 909 954
2016-17 1009.02 1078.13 1762.74 1009.02 918 961
2017-18 1031 1079 1767 1031 924 954
Tripura
2012-13 0.00 2000.00 1294.77 0.00 506 705
2013-14 0.00 2000.00 1278.87 0.00 759 719
2014-15 0.00 2142.86 1303.10 0.00 793 718
2015-16 820.00 2236.26 1398.91 820.00 771 673
2016-17 801.14 2300.00 1394.60 801.14 814 952
2017-18 783 2031 1428.54 783 780 710
All India
2012-13 577.72 3116.54 2566.49 577.72 1168 789
2013-14 630.09 3145.38 2675.80 630.09 1168 764
2014-15 654.47 2749.88 2631.64 654.47 1075 728
2015-16 601.51 3034.00 2562.69 601.51 968 655
2016-17 713.84 3199.92 2688.60 713.84 1195 786
2017-18 803.6 3368.21 3065.32 803.6 1284 853
Source: Nedfi Data Bank
Note: Figures shows the kgs/hectare
The productivity of rice and millets per hectare is same (in absolute numbers) for all
the northeast states. The productivity of oilseeds is lower than other crops in Arunachal
Pradesh. The average productivity of rice is highest in Arunachal Pradesh among the north
east states. But the productivity of wheat is higher than the productivity of rice within the
state. The productivity of crops in Assam is lower than that of Arunachal Pradesh Except for
the production of maize in 2013-14 and 2014-15. Productivity of wheat per hectare is highest
in Manipur and Tripura. The all India level of wheat productivity is higher than the Northeast
states of India. The productivity of oilseeds is very low compared to other crops. Mizoram
has the highest productivity of oilseeds and pulses among the north east states. The
productivity of oilseeds and the pulses were recorded lowest in Assam. The productivity of

168
maize was higher in all India level than the north east states except Assam during the year
2014-15 and 2015-16.
7.6.1 Causes of Agricultural Low Productivity in Northeast India.
The main causes of low agricultural productivity in northeast India can be discussed under
following heads:
Uneconomic and fragmented holdings: The marginalization of farmers is a dominant factor
adversely affecting household income. Over 60.27 per cent of the operational holdings are
below 1.0 ha and 22.18 per cent of the holdings are in the farm size group 1-2 ha. Except
Nagaland, in other North-East states, the size of operational holding is very small. Such small
holdings are uneconomic and results in under-investment in agriculture leading to low input
use and low production.
Low adoption of improved technology: The adoption of HYV seeds in case of rice and
other food crops in the northeast region is very low and also varies from region to region. The
main causes of slow growth of HYV area are the non-availability of suitable seeds,
predominance of traditional seeds in hill areas under Jhum cultivation, short supply of
recommended seeds and defective distribution system. The fertilizer consumption is also low
and variable. There are number of factors limiting the expansion of fertilizer use such as
defective distribution system, poor transport and communication system and inadequate
institutional credit. On the other hand, irrigation is another crucial constraint to agricultural
production, which, at present covers less than 10 per cent of the gross cropped area.
Flood problem in the region: Flood is a major natural disaster regularly causing
inundation and damage of standing crops, delay transplanting of main rice crop (Sali), which
results in low yield. Some studies found that about 3.0 lakh hactare of cropped area are
annually affected by flood in Assam. The worst soil erosion affected districts are North
Lakhimpur, Dhemaji, Darrang and so on.
Technological Constraints
1. Lack of suitable high-yielding rice varieties for diverse upland situations, flood
affected areas, moisture stress conditions, and hill areas
169
2. Alternative crops for escaping pre-monsoon showers to avoid the problem of pre-
harvest sprouting of crop in flood, free period
3. Develop improved crop management practices for shifting cultivation
4. Improvement and standardization of production techniques of fruits and vegetable
crops
5. Use of improved post harvest management including pest and disease management
and processing techniques for the major cash crops and horticultural crops
6. Land and water management technique specifically for acid soils
7. Economic packages for integrated farming systems combining crop cultivation with
livestock, fishery, etc.
8. Integrated livestock management system for increased livestock products as well as
draught power. The facilities of storage, processing and marketing are particularly
deficient for perishable commodities. The access to institutional credit facility to the
farmers must be improved substantially.
Attitude towards Agriculture
Agriculture is the most preferred activity of a large section of the population in the region, yet
the method of cultivation is indigenous. In view of the rapid technology turn over,
appropriate strategy for HRD is required to maximize farm income through adoption of
cutting-edge modern technology. The farmers usually stick to old practices and the younger
generation distracts, which makes agriculture an occupation of elderly people living in rural
areas. To attract enterprising youths to take up farming as profitable occupation and to
reverse the out-migration, innovative strategy such as commercialization of agriculture and
adoption of improved methods must be promoted.
Socio-economic Constraints
The North-East India has diverse ethnic groups and social systems bound with customs and
traditions. These factors clearly differentiate the type of economic activities and the economic
status of the population, which inhibit the adoption of modern methods. Carefully prioritized
strategies for agricultural development of the region may become instrumental to break the
deadlock.

170
7.7 Further Readings:
1. Alam K, Agriculture development in northeast India: Constraint and Prospects, Deep
& Deep Publication
2. Barah B C (2007) Strategies for Agricultural Development in the North-East India:
Challenges and Emerging Opportunities, India Journal of Agriculture Economics Vol
62 No 1 Jan-Mar
3. Barah B C , Agriculture development in Northeast India: Challenges and
Opportunities, Indian Council of Agricultural Research (ICAR)
4. Bezboruah M P, Land Tenure System in North East India: A Constraint for Bank
Financing? Dialogue January-March, 2007, Volume 8 No. 3
5. Karmakar K G, Agriculture and Rural Development in Northeast India: The Role of
NABARD, ASCI Journal of Management, No 37 vol 2
6. NEDFi Data Bank
7. Roy N C and Kuri P K , Land Reform in Arunachal Pradesh, Classical Publishing
House, New Delhi
8. Sharma C K and Borgohain Bhaswati,(2019) The New land Settlement Act in
Arunachal Pradesh, Economc and Political weekly, vol 54 No 23
9. Strategy for Agriculture Research in the Northeast India, Policy Paper , National
Academy of Agriculture Science, 2001
10. Yadav P K, Slash and Burn Agriculture in Northeast India, Expert Opinion in
Environment Biology, vol 2 issue 1.
171
UNIT – VIII
DEVELOPMENT OF SECONDARY AND TERTIARY SECTOR IN NORTHEAST
INDIA
Structure
8.0 Introduction
8.1 Objectives
8.2 Present Status of Industries in Northeast Region
8.3 Industries in North Eastern Region
8.3.1 Agro-based Industries
8.3.2 Forest-based Industries
8.3.3 Textile-based Industries
8.3.4 Mineral-based Industries
8.3.5 Other Industries
8.4 Distribution of Micro, Small, Medium Enterprise in NER
8.5. Factors inhibiting the growth of Industries in North East
8.6 Infrastructure Development: Power, Transport, Communication
8.7 Market and Banking
8.7.1 North Eastern Development Finance Corporation Ltd (NEDFi)
8.7.2 Small Industries Development Bank of India (SIDBI)
8.7.3 Promotional & Developmental Activities
8.7.4 Industrial Development Bank of India (IDBI)
8.8 Further Readings
8.0 Introduction
The tem Industry refers mainly to the manufacturing activity. Industrialisation relates
to the organisation of manufacturing activity for increasing production in business
enterprises. Industrialisation is a process of economic development where an increasing
proportion of local resources are mobilised to establish a technically up-to-date and
diversified economic processing. It implies, not merely development of certain industries, but
certain basic changes in the structure, technology and organisation of economic activity.
The North-East India has got its definite identity due to its peculiar physical,
economic and socio-cultural characteristics. This region consists of eight states viz., Assam,
Arunachal Pradesh, Manipur, Meghalaya, Mizoram, Nagaland, Tripura, Sikkim. The NER of
India covers an area of 2.62 lakh sq.km. It accounts for 7.9% of total geographical area of the
country. With a total population of 46 million (2011), it accounts for 3.8% of total population

172
of India. There are differences among the eight States in the North Eastern region with
respect to their resource endowments, level of industrialisation as well as infrastructural
facilities. The industrial sector has mainly grown around tea, petroleum (crude), natural gas
etc. in Assam and mining, saw mills and steel fabrication units in other parts of the region.
The full potential of the region is yet to be exploited and this has left the economy in a
primarily agrarian state.
The North East Region has often been termed as industrially backward region of the country.
Among the various reasons for its lack of connectivity, backwardness is the major form. The
region also shares international borders with China, Tibet, Myanmar, Bangladesh, Nepal,
and Bhutan, and is considered to be of vital geopolitical and economic importance.Bolstering
the economic development and investment potential of the region is thus a key aspect of
India’s Act East policy, which focuses on improved socioeconomic, trade, and business
engagement with East Asia and the ASEAN states.
8.1 Objectives
To know the status of MSME in Northeast India and the factor inhabiting the
growth of these industries
Infrastructure development in Northeast India
Role of financial institution in the development of the NE region
8.2 Present Status of Industries in Northeast Region
The Northeast Region is industrially underdeveloped despite the fact that the region is
endowed with vast potential of natural resources in term of forest, hydro-electricity, bio-
diversity, etc,. The present contribution of the industries in respective State domestic product
of NER can be explained with the help of table.
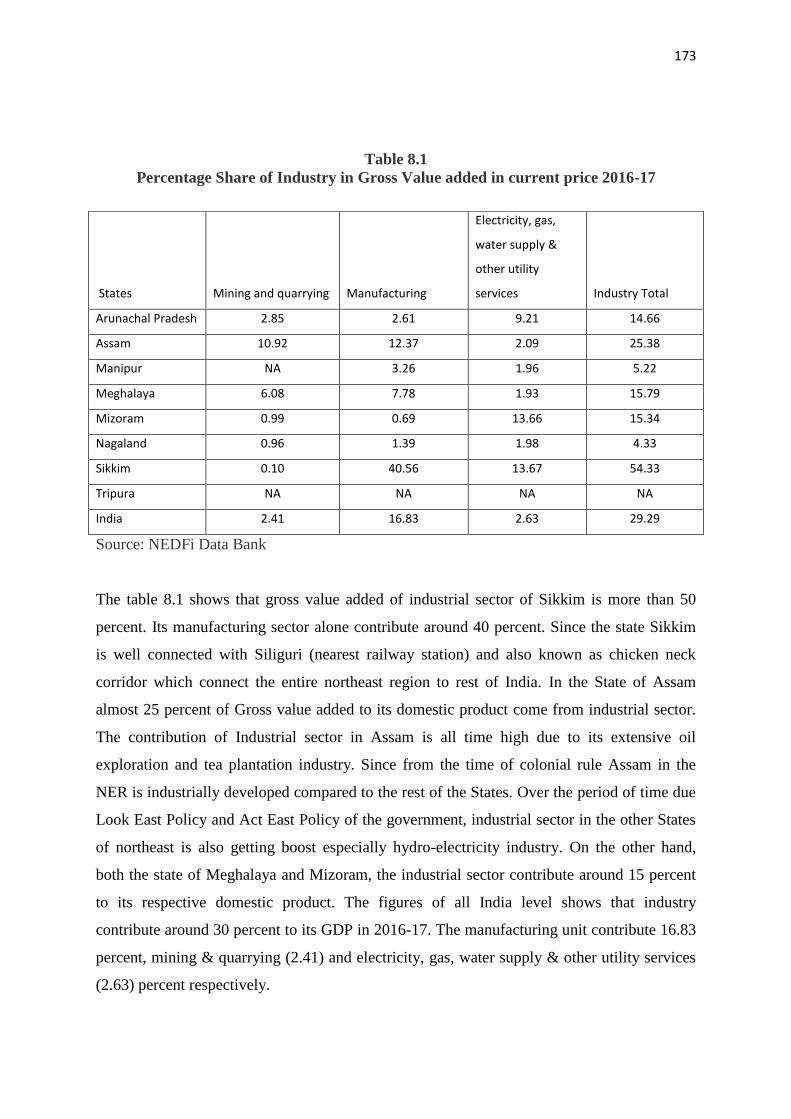
173
Table 8.1
Percentage Share of Industry in Gross Value added in current price 2016-17
Source: NEDFi Data Bank
The table 8.1 shows that gross value added of industrial sector of Sikkim is more than 50
percent. Its manufacturing sector alone contribute around 40 percent. Since the state Sikkim
is well connected with Siliguri (nearest railway station) and also known as chicken neck
corridor which connect the entire northeast region to rest of India. In the State of Assam
almost 25 percent of Gross value added to its domestic product come from industrial sector.
The contribution of Industrial sector in Assam is all time high due to its extensive oil
exploration and tea plantation industry. Since from the time of colonial rule Assam in the
NER is industrially developed compared to the rest of the States. Over the period of time due
Look East Policy and Act East Policy of the government, industrial sector in the other States
of northeast is also getting boost especially hydro-electricity industry. On the other hand,
both the state of Meghalaya and Mizoram, the industrial sector contribute around 15 percent
to its respective domestic product. The figures of all India level shows that industry
contribute around 30 percent to its GDP in 2016-17. The manufacturing unit contribute 16.83
percent, mining & quarrying (2.41) and electricity, gas, water supply & other utility services
(2.63) percent respectively.
States Mining and quarrying Manufacturing
Electricity, gas,
water supply &
other utility
services Industry Total
Arunachal Pradesh 2.85 2.61 9.21 14.66
Assam 10.92 12.37 2.09 25.38
Manipur NA 3.26 1.96 5.22
Meghalaya 6.08 7.78 1.93 15.79
Mizoram 0.99 0.69 13.66 15.34
Nagaland 0.96 1.39 1.98 4.33
Sikkim 0.10 40.56 13.67 54.33
Tripura NA NA NA NA
India 2.41 16.83 2.63 29.29
174
8.3 Industries in North Eastern Region
Industrially, the states in the region hardly have any industrial base, except perhaps Assam,
because of its traditional tea, oil and wood based industries .To some extent Meghalaya has
made some headway in setting up of small and medium industries. In recent years the “Look
East Policy” of Government of India has made North East more important and strategic. The
region has to gear up to take up more challenges and capitalize on the opportunities thrown
open by the huge market in the South East Asian Countries. The industries of this region can
be broadly classified as under:
8.3.1 Agro-based Industries
Agriculture is the main occupation of the people of North Eastern Region. SSI units based on
the agricultural products plays a significant role in the economy of NER since the early stages
of development. Most of the units are engaged in the manufacturing or processing of food
products. Agro based products like paddy; ginger, chilly, orange, and maize, banana, passion
fruits, mustard, turmeric, sugarcane and such other crops are grown intensively throughout
the entire region. Rice mill, paddy dehusking, gur making, chow making, oil mill, spice
grinding, small flour mill, pickle making, chips making, banana fibre extraction unit etc. are
some of the important agro-based industries under the category of food products and allied
industries.
8.3.2 Forest-based Industries
Nature has bestowed the NER with varieties of flora and fauna. The entire region is rich in
forest and forest resources. Small scale and cottage industrial units based on the forest
resources occupy a dominant place in the industrial sector of the economy. Different species
of bamboo, varieties of timbers like teak, eucalyptus, rubber, pine, magnolia and oak, cane,
medicinal plants and herbs, broom etc. are some of the important forest products of the
region. Wood Products like furniture making, door and window making, automobile body
building , saw mill, bamboo ply, mat ply, fibre board, decorative items like telephone stand
etc., bamboo products like bamboo bags, hats, baskets, tooth picks, mats, cane furniture’s,

175
carpentry works, citronella oil producing units etc. are some major forest-based SSI units in
NER.
8.3.3 Textile-based Industries
Since time immemorial, the tribal societies of NER were characterized by the use of colourful
traditional dresses prepared by the local weavers. Handloom and weaving is a popular
household industry among the tribal’s. Handloom industry plays an important role for socio-
economic development in the region in addition to safeguard the age old custom, tradition
and culture. The modern textile industries have not been developed in this region; most of the
traditional loin- loom has been replaced by zo-loom and fly shuttle looms due to their higher
working capacity. The use of improved power loom is very few in numbers among the hill
people. Most of the looms are operated by hands. Some textile units such as readymade
garments of cotton and wool, knitting and embroidery, tailoring etc. are there in the state.
Most of the handlooms are specialized in the production of traditional dresses.
8.3.4 Mineral-based Industries
Mineral-based industries of the north eastern region include railway workshops, engineering
industry, and re-Rolling Mills, steelworks, motor-vehicle workshops, galvanised wire units,
cycle factories, aluminium utensils industry, cycle spare parts, steel wire net, barbed wire,
cement industry etc. Moreover, the non-metal based industries include petroleum oil industry
and natural gas-based industry.
8.3.5 Other Industries
It includes power generation industry, fertiliser industry, paper products printing press,
chemical industry, metal industry, rubber & plastic based industries, leather industries etc.
8.4 Distribution of Micro, Small, Medium Enterprise in NER
The table 8.2 shows the statewise distribution of MSME in the NER. The figures show that in
NER, Assam has highest number of MSME which is around 12 lakhs unit followed by
Tripura that is around 2 lakhs unit. It is to be noted that due to various bottleneck presence in

176
the region, numbers of micro enterprise are highest in the region. In the state of Assam alone
around 12.10 lakhs of micro enterprise registered in the State. The household industry
especially silk weaving industry is generally found in every household in Assam. It is also
famous for production Eri and Muga silk in the region. The state of Tripura has also around 2
lakh micro enterprise followed by Manipur. On the other hand, rest of the NER has negligible
amount of micro enterprise. In case of small and medium it is almost nill in the region. The
figures of NER shows that around 18 lakhs of micro enterprise is registered.
Table 8.2 State-wise Distribution of MSME in Northeast Region
State Estimated number of enterprise (in Lakhs)
Micro Small Medium MSME
Arunachal Pradesh 0.22 0.00 0.00 0.23
Assam 12.10 0.04 0.00 12.14
Manipur 1.80 0.00 0.00 1.80
Meghalaya 1.12 0.00 0.00 1.12
Mizoram 0.35 0.00 0.00 0.35
Nagaland 0.91 0.00 0.00 0.91
Sikkim 0.26 0.00 0.00 0.26
Tripura 2.10 0.01 0.00 2.11
NER 18.86 0.05 0.00 18.92
All India 630.52 3.31 0.05 633.88
Source: NEDFi Data Bank
8.5. Factors inhibiting the growth of Industries in North East
1. Inefficient Manpower: Manpower plays an important role in any industry. The inefficiency
of manpower in small- scale industries due to illiteracy, ignorance, lack of training facilities
etc. affected the growth of small- scale industries.
2. Lack of Credit Facility: Another major problem of small- scale industries is the lack of
credit facilities. Before nationalisation, commercial banks were not interested in providing
finance to this sector. This situation has been changed after nationalisation of commercial
banks but it is still far from satisfactory.
3. Old and Obsolete Machineries: The small- scale industries are facing the problem in
production due to old and obsolete machineries. They are unable to compete with the
products of large- scale industries.
4. Lack of Marketing Facilities: The small- scale industries also facing the problem of
marketing their products. There is lack of organised marketing facilities for these industries.
They have to depend on the middlemen for selling their products. In many cases the market

177
for their products remains untapped.
5. Old Designs: The small- scale industries are continuing with the age old designs. The
products are unable to meet the modern demand.
6. Scattered Plantation & Uneven Distribution The most important challenge which affects
the marketing of produces in the region is the scattered plantation and uneven distribution of
products which is uneconomical and inefficient. This in particular resulted in distress sale of
surplus product in the local market as it could not attract big buyers from outside.
7. Lack of road and transportation facility Another major challenge is the non-availability of
proper transportation network, across the region covering urban, semi-urban and rural areas;
which in particular affects the movement of produces from the region to other parts of the
country. As a result, increase in transportation cost or damage of goods during transportation
or both contributing to low economic return. Most seasonal crops produced in one area
cannot be taken to other part of the region for marketing due to lack of proper logistic support
& poor transportation facilities.
8. Lack of good marketing agencies and other distribution channel Lack of appropriate
marketing agencies in the region till date, is one of most important factor due to which the
supply chain for the sale of farm based produces gets affected. Normally, private traders and
middlemen pre-dominate the market and trading of agricultural produce in the region.
8.6 Infrastructure Development: Power, Transport, Communication
Table 8.3
Status of Installed capacity (in MW) of Power in Northeast Region (As on 30.06.2019)
States Sources of Power Total
Thermal Nuclear Hydro Res (MNRE)
Assam 1196.79
0.00
457.08
60.98
1714.85
Arunachal
Pradesh
83.87 0.00 116.55 136.50 336.92
Meghalaya 155.29 0.00 394.27
32.65
582.21
Tripura 662.55
0.00 68.49
25.42
756.46
Manipur 154.67
0.00 95.34
8.92
258.93
Nagaland 81.03
0.00 57.33
31.67
170.03
Mizoram 71.51
0.00 97.94
36.98
206.43
Total NER 2581.83
0.00 1427.00
333.12
4341.94
Source: http://www.cea.nic.in/reports/monthly/installedcapacity/2019/installed_capacity-06.pdf

178
Table 8.3 shows that highest installed capacity of power among the NE states found in Assam
(1714.85 MW), followed by Tripura (756.46 MW) and Meghalaya (582.21 MW). Total
install capacity of power in the whole NE states found 4341.94 MW in 2019 which is higher
than the all the NE states. Though in India, there are four type of power installed capacity, but
in the NE states we have found only three type sources where power are installed. These are-
Thermal, Hydro and Res (MNRE). Among these three, NE states highest depends on the
Thermal power in case of power installation followe3d by Hydro and Res (MNRE).The
highest installed capacity of thermal power found in Assam (1196.79 MW) followed by
Tripura (662.55 MW) and Meghalaya (155.29 MW). In case of Hydro, Assam and
Meghalaya has found the highest capacity to installed power. Regarding the Res (MNRE),
Arunachal Pradesh (136.50 MW) has the highest capacity to installed power followed by
Assam (60.98 MW).
Table 8.4
Total Length of Roads and Railways in Northeast region
State Roads (in Kms.) Railways (in Kms.)
Arunachal Pradesh 30692 12
Assam 329520 2443
Manipur 24776 1
Meghalaya 21727 -
Mizoram 8108 2
Nagaland 36114 11
Sikkim 8243 -
Tripura 39365 193
NER 498545 2662
All India 4703293 66687
` Source: NEDfi Data Bank
Table 8.4 shows the road infrastructure among the north-eastern states in India is not much
satisfactory than the other parts of India. Except Assam, the length of road in the other NE
states is comparatively very. The lowest length of the road is found in Mizoram (8108 kms)
followed by Sikkim (8243 kms). On the other hand in case rail transport, out of the eight NE
states two states still does not have any rail connectivity viz., Sikim and Meghalaya. Out of
the total length of the rail transport in NE states, majority of rail transport is found in Assam
(2443 kms) and only 1 km rail transport is found in Manipur.
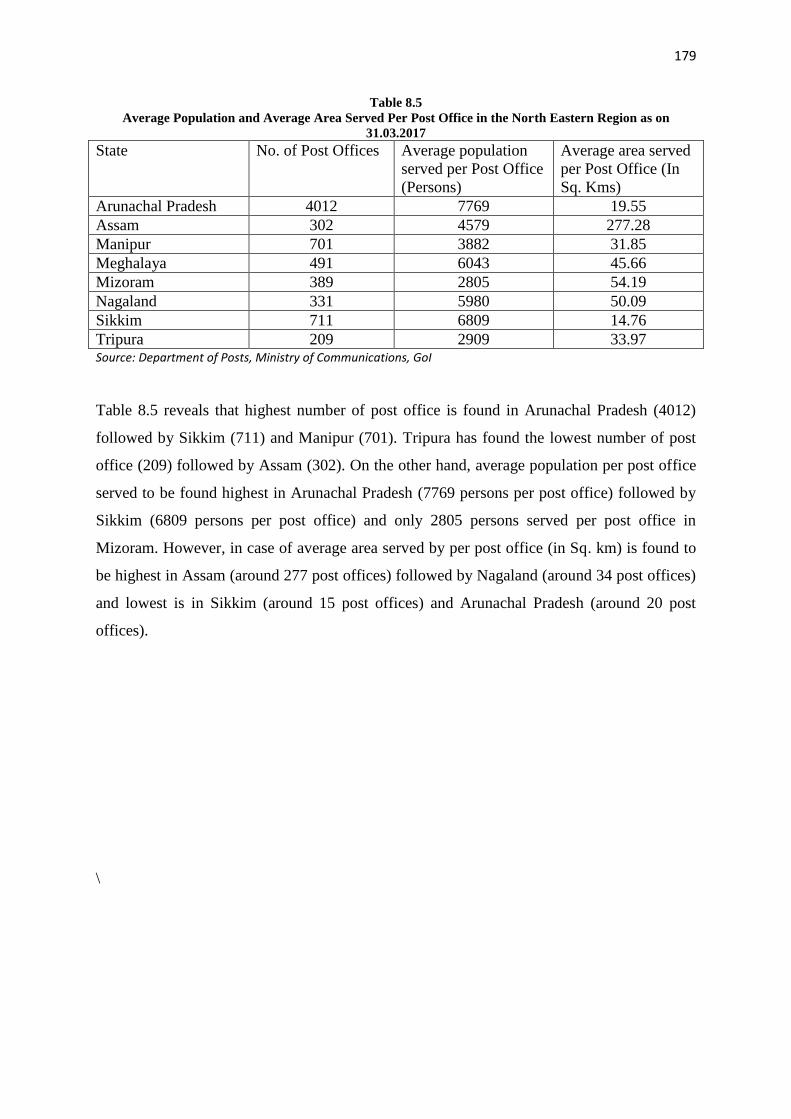
179
Table 8.5
Average Population and Average Area Served Per Post Office in the North Eastern Region as on
31.03.2017
State No. of Post Offices Average population
served per Post Office
(Persons)
Average area served
per Post Office (In
Sq. Kms)
Arunachal Pradesh 4012 7769 19.55
Assam 302 4579 277.28
Manipur 701 3882 31.85
Meghalaya 491 6043 45.66
Mizoram 389 2805 54.19
Nagaland 331 5980 50.09
Sikkim 711 6809 14.76
Tripura 209 2909 33.97 Source: Department of Posts, Ministry of Communications, GoI
Table 8.5 reveals that highest number of post office is found in Arunachal Pradesh (4012)
followed by Sikkim (711) and Manipur (701). Tripura has found the lowest number of post
office (209) followed by Assam (302). On the other hand, average population per post office
served to be found highest in Arunachal Pradesh (7769 persons per post office) followed by
Sikkim (6809 persons per post office) and only 2805 persons served per post office in
Mizoram. However, in case of average area served by per post office (in Sq. km) is found to
be highest in Assam (around 277 post offices) followed by Nagaland (around 34 post offices)
and lowest is in Sikkim (around 15 post offices) and Arunachal Pradesh (around 20 post
offices).
\
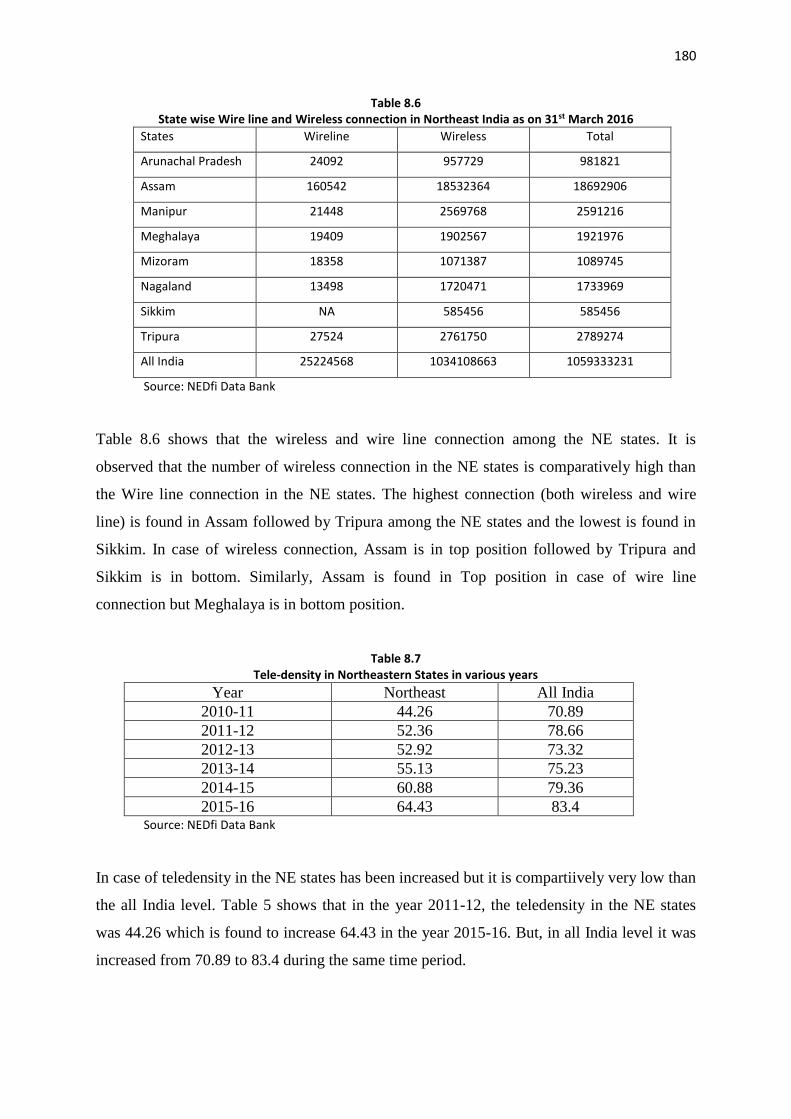
180
Table 8.6 State wise Wire line and Wireless connection in Northeast India as on 31st March 2016
States Wireline Wireless Total
Arunachal Pradesh 24092 957729 981821
Assam 160542 18532364 18692906
Manipur 21448 2569768 2591216
Meghalaya 19409 1902567 1921976
Mizoram 18358 1071387 1089745
Nagaland 13498 1720471 1733969
Sikkim NA 585456 585456
Tripura 27524 2761750 2789274
All India 25224568 1034108663 1059333231
Source: NEDfi Data Bank
Table 8.6 shows that the wireless and wire line connection among the NE states. It is
observed that the number of wireless connection in the NE states is comparatively high than
the Wire line connection in the NE states. The highest connection (both wireless and wire
line) is found in Assam followed by Tripura among the NE states and the lowest is found in
Sikkim. In case of wireless connection, Assam is in top position followed by Tripura and
Sikkim is in bottom. Similarly, Assam is found in Top position in case of wire line
connection but Meghalaya is in bottom position.
Table 8.7 Tele-density in Northeastern States in various years
Year Northeast All India
2010-11 44.26 70.89
2011-12 52.36 78.66
2012-13 52.92 73.32
2013-14 55.13 75.23
2014-15 60.88 79.36
2015-16 64.43 83.4 Source: NEDfi Data Bank
In case of teledensity in the NE states has been increased but it is compartiively very low than
the all India level. Table 5 shows that in the year 2011-12, the teledensity in the NE states
was 44.26 which is found to increase 64.43 in the year 2015-16. But, in all India level it was
increased from 70.89 to 83.4 during the same time period.

181
8.7 Market and Banking
8.7.1 North Eastern Development Finance Corporation Ltd. (NEDFi)
The North Eastern Development Finance Corporation Ltd (NEDFi) is a Public
Limited Company registered under the Companies Act 1956 on 9th August, 1995. It is
notified as a Public Financial Institution under Section 4A of the said Act and was registered
as an NBFC in 2002 with RBI. The shareholders of the Corporation are IDBI, SBI, LICI,
SIDBI, ICICI, IFCI, SUUTI, GIC and its subsidiaries. The management of NEDFi has been
entrusted upon the Board of Directors comprising representatives from shareholder
institutions, DoNER, State Governments and eminent persons from the NE Region and
outside having wide experience in industry, economics, finance and management.
In 1994, the I. K. Borthakur Committee Report conceptualized the formation of a
North-Eastern Development Bank to cater to the needs of the region. Following the report,
the then Finance Minister, Dr. Manmohan Singh, in his budget speech in March 1995
announced setting up of a development bank for the North Eastern States of India. At the
time of its establishment, the corporation was placed under the Ministry of Finance, Banking
Division for administrative purpose. However, with the formation of Ministry of
Development of North Eastern Region (DoNER), Govt. of India in 2004, the Corporation has
been placed under the Ministry of DoNER for administrative purpose.
NEDFi provides financial assistance to micro, small, medium and large enterprises for
setting up industrial, infrastructure and agri-allied projects in the North Eastern Region of
India and also Microfinance through MFI/NGOs. Besides financing, the Corporation offers
Consultancy & Advisory services to the state Governments, private sectors and other
agencies. It conduct sector or state specific studies under its Techno-Economic Development
Fund (TEDF) and is the designated nodal agency for disbursal of Govt. of India incentives to
the industries in the North-East India under North–East Industrial and Investment Promotion
Policy 2007 (NEIIPP 2007). The promotional activities include mentoring through BFC,
Water Hyacinth Craft, NEDFi Convention Center, NEDFi Pavillion etc.
NEDFi is the premier financial and development institution of the North East of India
whose main objectives as per its Memorandum of Association are to carry on and transact the
business of providing credit and other facilities for promotion, expansion and modernization

182
of industrial enterprises and infrastructure projects in the North Eastern Region of India, also
carry on and transact business of providing credit and other facilities for promotion of agro-
horticulture, medicinal and sericulture plantation, aquaculture, poultry, dairy and animal
husbandry development in order to initiate large involvement of rural population in the
economic upsurge of the society and faster economic growth of the region. NEDFi aims to be
a dynamic and responsive organization to catalyze the economic growth of the North-East. It
assists in the efficient formation of fixed assets by identifying, financing and nurturing eco-
friendly and commercially viable projects in the region. It strives to achieve highest standard
of quality in terms of services to the entrepreneurs by rendering in-depth counseling, timely
advices and assistance for building quality enterprises on a sustained basis.
8.7.2 Small Industries Development Bank of India (SIDBI)
The SIDBI (Small Industries Development Bank of India) is a wholly owned subsidiary of
IDBI (Industrial Development Bank of India), established under the special Act of the
Parliament 1988 which became operative from April 2, 1990. The role of Small Industries
Development Bank of India (SIDBI), as the principal financial institution for the promotion,
financing and development of industry in the small scale sector is mainly two fold; Financing
and Developmental. In the sphere of financing, SIDBI operates a number of schemes tailored
to meet the specific requirements of target groups and activities. While the financial
assistance to small scale units is largely provided under refinance scheme operated through a
large network of bands and State level financial institutions, SIDBI is extending direct
assistance for development of other important areas like infrastructure, marketing
organizations, supply of raw materials, ancillary development and technology upgradation.
8.7.3 Promotional & Developmental Activities
SIDBI has put greater emphasis on the promotional and developmental (P&D) needs of the
Micro Small and medium Enterprises (MSMEs) in NER for their capacity building and
holistic development. It may be noted that the Committee on Financial Sector Plan for the
North Eastern Region under Smt. Usha Thorat, Dy. Governor, RBI has made certain
recommendations for SIDBI to implement its developmental programmes, viz. Cluster
Development Programmes and Rural Industries Programme in all the States of North East.

183
SIDBI has geared up to deepen its support in the recommended areas. The support of the
Bank under various promotional and developmental programmes in the NER, are as under:
a) Rural Industries Programme: The rural industries programme aims at creation of
employment through enterprise promotion in rural and semi-urban areas and
addressing problems such as rural unemployment, urban migration, under-utilisation
of know-how and latent rural resources. Under the Bank’s Flagship P&D Programme,
viz. RIP, 22 districts in NER have so far been covered, out of which, 12 are currently
under implementation.
b) Entrepreneurship Development Programme:
The Entrepreneurship Development Programme aims at promotion of self employed
ventures. It also enables in order to generate employment opportunities, especially in far
flung and rural areas targeting less privileged sections of the society like women and SC/ST.
The EDPs are conducted in the cluster or for a heterogeneous group of entrepreneurs The
Bank has conducted around 288 EDPs benefiting around 13141 participants till june 30,
2011.
c) Cluster Development Programme :The Cluster Development Programmes is a
comprehensive package of business development services, such as technology upgradation,
capacity building, environment marketing, credit quality WTO, information dissemination
etc.
d) Skill-cum-technology Upgradation Programme: Skill-cum-Technology Upgradation
Programme is structured to improve the performance of existing MSME unit by
developing/strengthen managerial skill and technical competence of the entrepreneur and
senior executives of small enterprises. STUP also aims at creating awareness amongst the
SME units on process improvements, technological developments etc. and inducing the units
to upgrade their technological level. The Bank has so far conducted over 133 STUPs/Skill
Development Programme benefiting over around 4192 participants in the entire NER as on
June 30, 2011.
e) Strengthening SME Sector with a view to strengthening the SME sector, the Bank supports
reputed management/technology institution for offering management development
programmes.
f) Marketing Initiatives: As an important ingredient of its P&D initiatives, the Bank
supports various marketing events with the intention of providing appropriate marketing
linkages to the trainees of EDPs and RIP, etc.
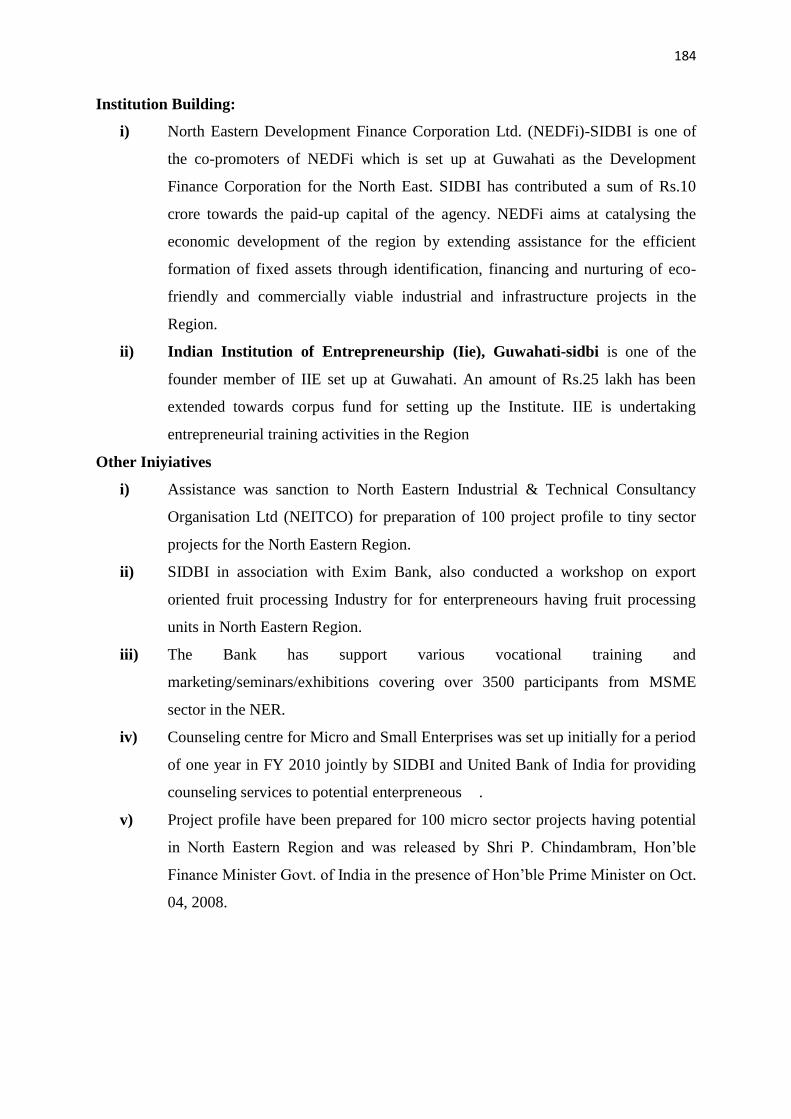
184
Institution Building:
i) North Eastern Development Finance Corporation Ltd. (NEDFi)-SIDBI is one of
the co-promoters of NEDFi which is set up at Guwahati as the Development
Finance Corporation for the North East. SIDBI has contributed a sum of Rs.10
crore towards the paid-up capital of the agency. NEDFi aims at catalysing the
economic development of the region by extending assistance for the efficient
formation of fixed assets through identification, financing and nurturing of eco-
friendly and commercially viable industrial and infrastructure projects in the
Region.
ii) Indian Institution of Entrepreneurship (Iie), Guwahati-sidbi is one of the
founder member of IIE set up at Guwahati. An amount of Rs.25 lakh has been
extended towards corpus fund for setting up the Institute. IIE is undertaking
entrepreneurial training activities in the Region
Other Iniyiatives
i) Assistance was sanction to North Eastern Industrial & Technical Consultancy
Organisation Ltd (NEITCO) for preparation of 100 project profile to tiny sector
projects for the North Eastern Region.
ii) SIDBI in association with Exim Bank, also conducted a workshop on export
oriented fruit processing Industry for for enterpreneours having fruit processing
units in North Eastern Region.
iii) The Bank has support various vocational training and
marketing/seminars/exhibitions covering over 3500 participants from MSME
sector in the NER.
iv) Counseling centre for Micro and Small Enterprises was set up initially for a period
of one year in FY 2010 jointly by SIDBI and United Bank of India for providing
counseling services to potential enterpreneous .
v) Project profile have been prepared for 100 micro sector projects having potential
in North Eastern Region and was released by Shri P. Chindambram, Hon’ble
Finance Minister Govt. of India in the presence of Hon’ble Prime Minister on Oct.
04, 2008.

185
8.7.4 Industrial Development Bank of India (IDBI)
Industrial Development Bank of India (IDBI) established under Industrial Development Bank
of India Act, 1964, is the principal financial institution for providing credit and other facilities
for developing industries and assisting development institutions. Till 1976, IDBI was a
subsidiary bank of RBI. In 1976 it was separated from RBI and the ownership was transferred
to Government of India. IDBI is the tenth largest bank in the world in terms of development.
The National Stock Exchange (NSE), the National Securities Depository Services Ltd.
(NSDL), Stock Holding Corporation of India (SHCIL) are some of the Institutions which has
been built by IDBI. IDBI consist of a Board of Directors, consisting of a chairman and
Managing Director appointed by the Government of India, a Deputy Governor of the RBI
nominated by that bank and 20 other Directors are nominated by the Central Government.
The board had constituted an Executive Committee consisting of 10 Directors, including the
Chairman and Managing Director. The executive committee is empowered to sanction
financial assistance. The Head office of IDBI is located in Mumbai. The bank has five
regional offices, one each in Kolkata, Guwahati, New Delhi, Chennai and Mumbai. Besides
the bank have 21 branch offices.
Developmental Activities of IDBI:
(1) Promotional Activities:
In fulfillment of its developmental role, the bank continues to perform a wide range of
promotional activities relating to developmental programmes for new entrepreneurs,
consultancy services for small and medium enterprises and programmes designed for
accredited voluntary agencies for the economic upliftment of the underprivileged.
These include entrepreneurship development, self-employment and wage employment in the
industrial sector for the weaker sections of society through voluntary agencies, support to
Science and Technology Entrepreneurs’ Parks, Energy Conservation, Common Quality
Testing Centers for small industries.
(2) Technical Consultancy Organisations:
With a view to making available at a reasonable cost, consultancy and advisory services to
entrepreneurs, particularly to new and small entrepreneurs, IDBI, in collaboration with other
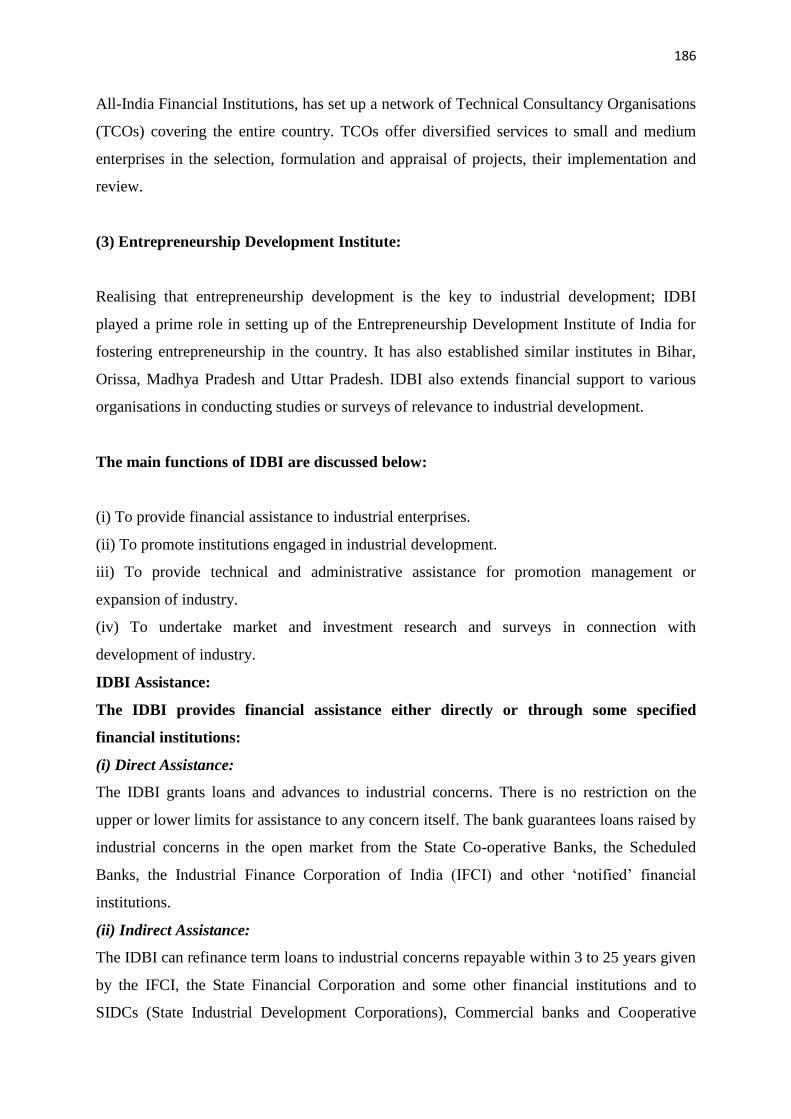
186
All-India Financial Institutions, has set up a network of Technical Consultancy Organisations
(TCOs) covering the entire country. TCOs offer diversified services to small and medium
enterprises in the selection, formulation and appraisal of projects, their implementation and
review.
(3) Entrepreneurship Development Institute:
Realising that entrepreneurship development is the key to industrial development; IDBI
played a prime role in setting up of the Entrepreneurship Development Institute of India for
fostering entrepreneurship in the country. It has also established similar institutes in Bihar,
Orissa, Madhya Pradesh and Uttar Pradesh. IDBI also extends financial support to various
organisations in conducting studies or surveys of relevance to industrial development.
The main functions of IDBI are discussed below:
(i) To provide financial assistance to industrial enterprises.
(ii) To promote institutions engaged in industrial development.
iii) To provide technical and administrative assistance for promotion management or
expansion of industry.
(iv) To undertake market and investment research and surveys in connection with
development of industry.
IDBI Assistance:
The IDBI provides financial assistance either directly or through some specified
financial institutions:
(i) Direct Assistance:
The IDBI grants loans and advances to industrial concerns. There is no restriction on the
upper or lower limits for assistance to any concern itself. The bank guarantees loans raised by
industrial concerns in the open market from the State Co-operative Banks, the Scheduled
Banks, the Industrial Finance Corporation of India (IFCI) and other ‘notified’ financial
institutions.
(ii) Indirect Assistance:
The IDBI can refinance term loans to industrial concerns repayable within 3 to 25 years given
by the IFCI, the State Financial Corporation and some other financial institutions and to
SIDCs (State Industrial Development Corporations), Commercial banks and Cooperative
187
banks which extend term loans not exceeding 10 years to industrial concerns. IDBI
subscribes to the shares and bonds of the financial institutions and thereby provide
supplementary resources.
8.8 Further Readings:
1. Nayak P "Role of Financial Institutions in Promoting Entrepreneurship in Assam
Small Scale Sector in Assam, "General Economics and Teaching 0509018, University
Library of Munich, Germany. https://ideas.repec.org/p/wpa/wuwpgt/0509018.html
2. Haokip Thongkhola, India’s Look East Policy: Prospects and Challenges for
Northeast India, In Zahid Hussain (ed). India’s Look East Policy and North East
India: Achievements and Constraints, New Delhi: Concept Publishing, 2012
3. Sarma Amiya & Bezbaruah M P , Industry in the Development Perspective of North
East India, Dialogue January - March, 2009 , Volume 10 No. 3
4. Baishya Kankana, Industrial Development in North East India: Challenges and Issues,
https://www.academia.edu/11767076/Industrial_Development_in_NE_India
5. Annual Report on Micro, Small, Medium Enterprise, various Years
6. NEDFi Data Bank

188
UNIT- IX
Section - I
Fiscal issues of North Eastern states
Structure
9.0 Introduction
9.1 Objectives
9.2 Receipts
9.3 Expenditure
9.4 Concept of Deficit
9.5 Expenditure
9.6 Deficits
9.7 Outstanding Debt and Liabilities
9.8 14th Finance Commission’s recommendation in share of Central Taxes
9.9 Let us sum up
9.10 Key terms
9.11 Long type question.
9.12 Short type questions:
9.13 Suggested Readings
9.0 Introduction:
In order to understand the fiscal issues we need to understand the basic components of
a budget. The budget has got two sides namely (i) Receipts and (ii) Expenditure
Receipts Expenditure
(A) Revenue Receipts
i. Tax Revenue
a) own tax revenue
b) share in central taxes
ii. Non tax Revenue
a) grants from the centre
b) own non-tax revenue
(B) Revenue Expenditure
i. Social service
ii. Economic service
iii. interest payment
iv. organ of the state
(C) Capital Receipts
a) Borrowings
b) Non debt capital receipt’s
c) Recoveries of loan and advance
(D) Capital Expenditure
i. Social Service
ii. Economic service
iii. Loan and Advance
189
iv. Organ of the state
9.1 Objectives:
The objectives of the present unit are:
1. To understand the fundamental components of a budget.
2. To understand the different sources of revenue of the Government.
3. To understand the various types of expenditures.
4. To understand the implications of finance commission awards to the State
Governments of North Eastern States.
9.2 Receipts
Own tax revenue
Generally all state and national government collect taxes. A state government collects
taxes like state excise duties and other taxes like sales tax etc. (Now state GST). These types
of collections are kept under own tax revenue head.
Share in central taxes:
Central government collects taxes like Income tax, corporation duty, export duty,
imports duty etc. Finance commission decides about the sharing of centrally collected taxes
between the centre and state government. As per 14th Finance commission 42% of the
centrally collected taxes are distributed among the different states by a formula devised by
finance commission.
Non-tax revenue:
The third important source of revenue to the state government is non-tax revenue. Under it,
there are two important sub-components namely (i) Own non-tax revenue and (ii) Grants
from the central government.
Own non-tax revenue: The state government collects different types of non-tax revenues
like fees, fines, royalties etc. The examples are- (i) Patients pay some fee in government

190
hospitals for treatment (ii) Fines collected by Police (iii) Royalty received by the government
from leasing out mines etc..These are kept under this head.
Grants from the central government: Apart from share in central taxes, the central
government gives some grants to the state government under different programmes and
schemes. These types of grants are kept under non-tax revenue.
Capital receipts:
Under receipts side of a budget, capital receipt is the second important component. Capital
receipts’ has two sub-components namely (i) Borrowings (ii) Non-debt capital receipts.
Borrowings: The state Governments borrows from different agencies like central
government and banking institutions like commercial banks, NABARD, pension funds etc.
Further, they also issue public bond to raise revenue. Receipts through these agencies are
treated as internal debt of the government.
Non-Debt Capital receipts: When the state government sells some public asset, the accrual
is kept under this head. Examples are (i) Selling up of government land and old vehicles (ii)
Disinvestment proceedings of public sector units etc.
Recoveries of Loan and Advance: The government gives loan to state public sector
undertakings, and government servants. The recovery amount is kept under this head.
9.3 Expenditure
The expenditure statement of the government is divided into two components (i)
Revenue expenditure and (ii) Capital expenditure.
(a) Revenue expenditure: The expenditure which is of recurring type is known as revenue
expenditure. The examples are (i) salary to employees (ii) Expenditure on petroleum (iii)
office expenditure.
Revenue Expenditure has got four important components:
(a) Revenue expenditure in social service: It includes revenue expenditure in Health,
Education, Child nutrition and drinking water etc. These types of expenditures are
known as Human Development Expenditure.
(b) Revenue expenditure in Economic service: Here, revenue expenditure incurred in
economic service like agriculture, industry tourism etc. are included.
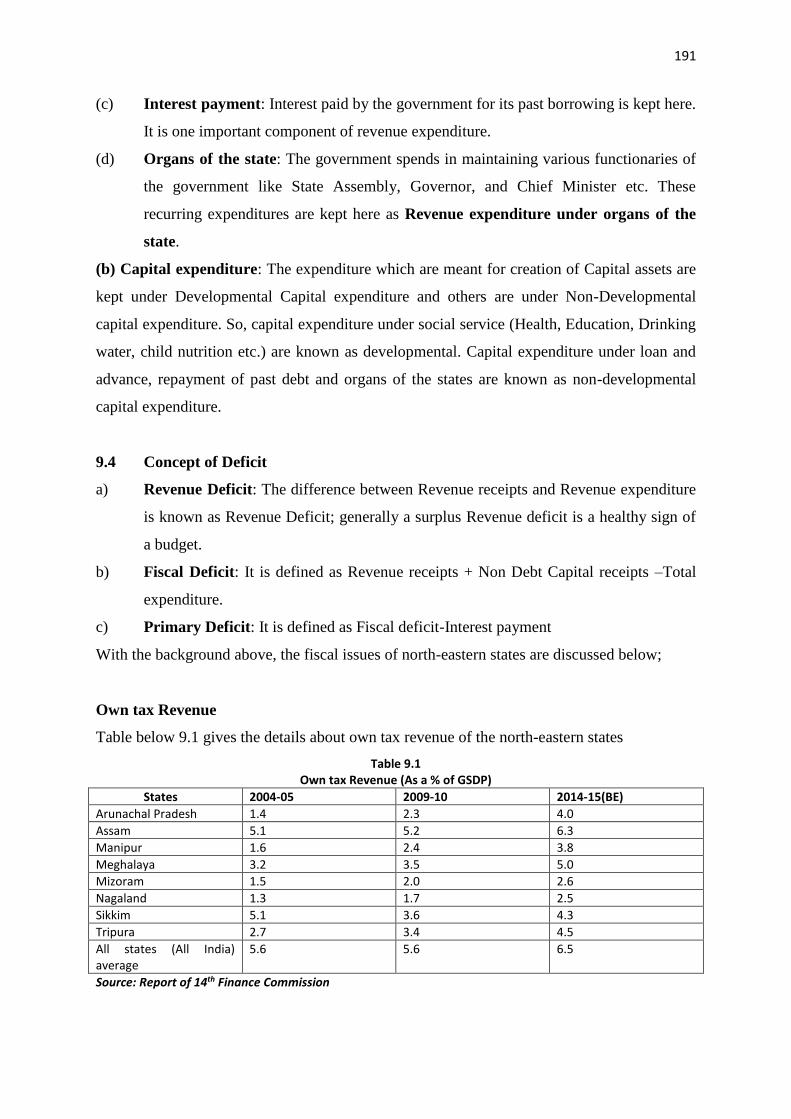
191
(c) Interest payment: Interest paid by the government for its past borrowing is kept here.
It is one important component of revenue expenditure.
(d) Organs of the state: The government spends in maintaining various functionaries of
the government like State Assembly, Governor, and Chief Minister etc. These
recurring expenditures are kept here as Revenue expenditure under organs of the
state.
(b) Capital expenditure: The expenditure which are meant for creation of Capital assets are
kept under Developmental Capital expenditure and others are under Non-Developmental
capital expenditure. So, capital expenditure under social service (Health, Education, Drinking
water, child nutrition etc.) are known as developmental. Capital expenditure under loan and
advance, repayment of past debt and organs of the states are known as non-developmental
capital expenditure.
9.4 Concept of Deficit
a) Revenue Deficit: The difference between Revenue receipts and Revenue expenditure
is known as Revenue Deficit; generally a surplus Revenue deficit is a healthy sign of
a budget.
b) Fiscal Deficit: It is defined as Revenue receipts + Non Debt Capital receipts –Total
expenditure.
c) Primary Deficit: It is defined as Fiscal deficit-Interest payment
With the background above, the fiscal issues of north-eastern states are discussed below;
Own tax Revenue
Table below 9.1 gives the details about own tax revenue of the north-eastern states
Table 9.1 Own tax Revenue (As a % of GSDP)
States 2004-05 2009-10 2014-15(BE)
Arunachal Pradesh 1.4 2.3 4.0
Assam 5.1 5.2 6.3
Manipur 1.6 2.4 3.8
Meghalaya 3.2 3.5 5.0
Mizoram 1.5 2.0 2.6
Nagaland 1.3 1.7 2.5
Sikkim 5.1 3.6 4.3
Tripura 2.7 3.4 4.5
All states (All India) average
5.6 5.6 6.5
Source: Report of 14th Finance Commission

192
In 2004-05 own tax revenue at all India average was 5.6% of GSDP. The states like
Arunachal Pradesh, Manipur, Mizoram, Nagaland and Tripura had very low level of own tax
revenue, where as the states like Assam and Sikkim had comparatively better own tax
revenue.
In 2009-10, all the states have improved their own tax improved their own tax
revenue as a % of GSDP, except Sikkim. However, they were much below the national
average. Assam performed better, as compared to others but the figure did not change much.
In 2014-15, own tax revenue of all the states substantially changed. At all India
average it became 6.5%. For the states like Arunachal Pradesh, Assam, Meghalaya, Sikkim
and Tripura, it became above 4 percent of GSDP. In the states like Mizoram and Nagaland,
though there was improvement, but it remained around 2.5 percent of GSDP.
In a nut cell we can say that for all the North Eastern states, there was substantial
improvement in own tax revenue collection in 2014-15 as compared to previous periods.
However, they are yet to reach all India average in their own tax revenue collection effort.
Total Transfer from the Central Government
Total transfer from the Central Government is composed of two components of receipts side
of budget. First one is share in Central taxes and the second is grants from the centre. Table
5.2 gives the total transfer from the Central government to North Eastern states.
Table 9.2 Total transfer from Central Government (% of GSDP)
States 2004-05 2009-10 2014-15(BE)
Arunachal Pradesh 36.7 48.3 58.8
Assam 11.5 12.7 20.7
Manipur 31.0 41.6 53.1
Meghalaya 18.4 21.5 38.1
Mizoram 51.7 51.9 55.0
Nagaland 28.8 32.4 56.9
Sikkim 46.7 27.3 39.1
Tripura 24.3 24.3 32.4
All states (All India) average
4.1 4.8 6.5
Source: Report of 14th Finance Commission
Table 9.2 shows dependency of the states on Central Government. In 2004-05 the highest
dependency on Central inflow (as a percent of GSDP) was observed in the states of Mizoram,
Sikkim and Arunachal Pradesh and the least was in Assam. The All India average was 4.1%.

193
In 2009-10, again the highest dependency was observed in Mizoram, Arunachal
Pradesh and Manipur. In 2014-15, there was substantial improvement in Central transfer
occurred the states like Arunachal Pradesh, Manipur, Mizoram and Nagaland, where Central
inflow constitutes more than 50% of GSDP.
Thus, we can observe that central inflow is quite substantial in North Eastern States as
compared to all India average.
9.4 Expenditure
(a) Revenue Expenditure
Table 9.3 gives the Revenue expenditure of North Eastern states
Table 9.3 Revenue Expenditure (% of GSDP)
States 2004-05 2009-10 2014-15(BE)
Arunachal Pradesh 43.3 49.4 53.1
Assam 19.2 22.1 27.5
Manipur 32.2 36.5 50.9
Meghalaya 24.3 25 40.8
Mizoram 52 21.4 52.8
Nagaland 28.9 30.9 50.3
Sikkim 99.1 44.6 41.8
Tripura 24.5 27.4 28.4
All states (All India) average
12.4 12.3 13.9
Source: Report of 14th Finance Commission
In 2004-05, at all India level, Revenue expenditure was 12.4% of GSDP. All the North-
Eastern states had higher revenue expenditure as compared to national average. The highest
was observed in Sikkim, where it was 99% of GSDP. The other states where revenue
expenditure was substantially high are Arunachal Pradesh and Mizoram.
In 2009-10, revenue expenditure remained almost same as that of 2004-05.
Substantial increase was observed in Arunachal Pradesh and Manipur.
In 2014-15, substantial increment in revenue expenditure took place in Arunachal
Pradesh, Manipur, Mizoram and Nagaland where it was above 50% of GSDP.
So, we can infer that for all North-Eastern states, there was substantial improvement
in revenue expenditure as compared to national average over time. The states, where it is
substantial are Arunachal Pradesh, Manipur, Mizoram and Nagaland. Only in Assam and
Tripura it is around 27-28% of GSDP.
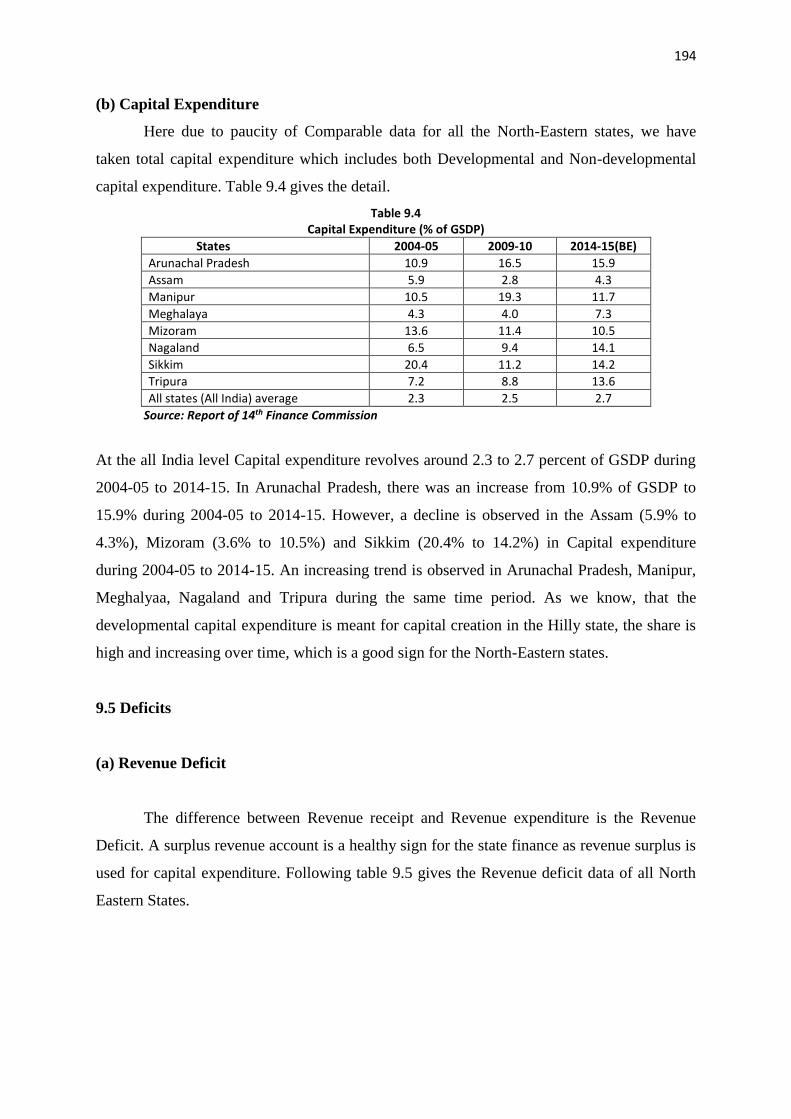
194
(b) Capital Expenditure
Here due to paucity of Comparable data for all the North-Eastern states, we have
taken total capital expenditure which includes both Developmental and Non-developmental
capital expenditure. Table 9.4 gives the detail.
Table 9.4 Capital Expenditure (% of GSDP)
States 2004-05 2009-10 2014-15(BE)
Arunachal Pradesh 10.9 16.5 15.9
Assam 5.9 2.8 4.3
Manipur 10.5 19.3 11.7
Meghalaya 4.3 4.0 7.3
Mizoram 13.6 11.4 10.5
Nagaland 6.5 9.4 14.1
Sikkim 20.4 11.2 14.2
Tripura 7.2 8.8 13.6
All states (All India) average 2.3 2.5 2.7
Source: Report of 14th Finance Commission
At the all India level Capital expenditure revolves around 2.3 to 2.7 percent of GSDP during
2004-05 to 2014-15. In Arunachal Pradesh, there was an increase from 10.9% of GSDP to
15.9% during 2004-05 to 2014-15. However, a decline is observed in the Assam (5.9% to
4.3%), Mizoram (3.6% to 10.5%) and Sikkim (20.4% to 14.2%) in Capital expenditure
during 2004-05 to 2014-15. An increasing trend is observed in Arunachal Pradesh, Manipur,
Meghalyaa, Nagaland and Tripura during the same time period. As we know, that the
developmental capital expenditure is meant for capital creation in the Hilly state, the share is
high and increasing over time, which is a good sign for the North-Eastern states.
9.5 Deficits
(a) Revenue Deficit
The difference between Revenue receipt and Revenue expenditure is the Revenue
Deficit. A surplus revenue account is a healthy sign for the state finance as revenue surplus is
used for capital expenditure. Following table 9.5 gives the Revenue deficit data of all North
Eastern States.

195
Table 9.5 Revenue Deficit (% of GSDP)
States 2004-05 2009-10 2014-15(BE)
Arunachal Pradesh 0.2 -8.0 -14.5
Assam 0.5 1.4 -2.3
Manipur -1.8 -10.4 -8.00
Meghalaya 0.8 -2.1 -5.1
Mizoram -4.00 -5.0 -7.5
Nagaland -2.7 -4.4 -10.4
Sikkim -9.7 -8.4 -11.0
Tripura -4.4 -1.2 -9.4
‘+’ indicates Deficit and ‘–‘ indicates surplus Source: Report of 14th Finance Commission
Table 9.5 reveals that in 2004-05 except three states namely Arunachal Pradesh, Assam and
Meghalaya, all the states were enjoying revenue surplus. In 2009-10, only Assam had
revenue deficit. However, in 2014-15 all the North-Eastern states are enjoying revenue
surplus, highest being enjoyed by Arunachal Pradesh, Nagaland, Sikkim and Tripura.
Therefore, we may infer that the fiscal healths of all North-Eastern States are sound.
(b)Gross Fiscal Deficit
In term of Budget identity, Gross Fiscal Deficit shows the quantum of borrowing by
the sub national governments. Table 9.6 gives the Gross Fiscal Deficit of all North-Eastern
States.
Table 9.6 Total transfer from Central Government (% of GSDP)
States 2004-05 2009-10 2014-15(BE)
Arunachal Pradesh 11.1 5.8 1.4
Assam 3.9 4.2 2.0
Manipur 8.8 8.9 3.7
Meghalaya 4.8 1.8 2.2
Mizoram 8.8 5.9 2.7
Nagaland 3.7 5.0 3.7
Sikkim 10.7 2.8 3.2
Tripura 2.7 7.5 4.2
Source: Report of 14th Finance Commission
In 2004-05, Gross Fiscal Deficit (GFD) was highest for Arunachal Pradesh (11.1%).
12th Finance Commission proposed to reduce it to 3% of GSDP as a result FRBM was
enacted in the state. As a result of which GFD was reduced substantially to 5.8% in 2009-10
and further to 1.4% in 2014-15. All the north-eastern states enacted FRBM act and in 2014-
15, there was substantial reduction in GFD of all states. However, in 2014-15 the states like

196
Manipur, Nagaland, Sikkim and Tripura, the GFD was found to be at a higher side and
maximum was observed in Tripura (4.2%), Manipur (3.7%) and Nagaland 3.7%.
9.7 Outstanding Debt and Liabilities
Borrowing or Gross Fiscal deficit leads to accumulation of debt. 12th Finance
Commission recommended 30% of GSDP as the safe limit to maintain Debt sustainability of
the State Government and recommended for enactment of state level Fiscal Responsibility
and Budget Management Act (FRBM). Following it, all State Government enacted FRBM
Act.
Table 9.7 below gives the total outstanding Debt and Liabilities of the North-Eastern
states.
Table 9.7 Outstanding Debt and Liabilities (% of GSDP)
States 2004-05 2009-10 2014-15(BE)
Arunachal Pradesh 51.0 42.7 36.2
Assam 32.9 29.7 21.7
Manipur 60.00 66.9 49.2
Meghalaya 33.1 29.9 25.9
Mizoram 101.1 69.00 30.7
Nagaland 48.2 51.9 47.2
Sikkim 63.7 37.3 29.9
Tripura 47.00 37.4 33.00
Source: Report of 14th Finance Commission
In 2004-05, outstanding liabilities of all the North-Eastern states were above the limit
prescribed by 12th Finance Commission. The highest was observed in Mizoram, where the
ratio exceeded 100% of GSDP. In Assam and Meghalaya it was comparatively low.
In 2009-10, outstanding liabilities of all states got reduced except Manipur. Two
states namely Assam and Meghalaya achieved the target fixed by 12th Finance Commission.
However, in Manipur and Mizoram liabilities was substantially higher than the other states.
In 2014-15, there was further decline in outstanding liabilities as a % of GSDP for all
states. The maximum was observed in Manipur, Nagaland and Arunachal Preadesh and the
lowest was observed in Assam.
9.8 14th Finance Commission’s recommendation in share of Central Taxes
14th Finance Commission substantially increased the share of state in divisible pool of
centrally collected taxes. 13th Finance Commission gave a share of 32 percent and 14th
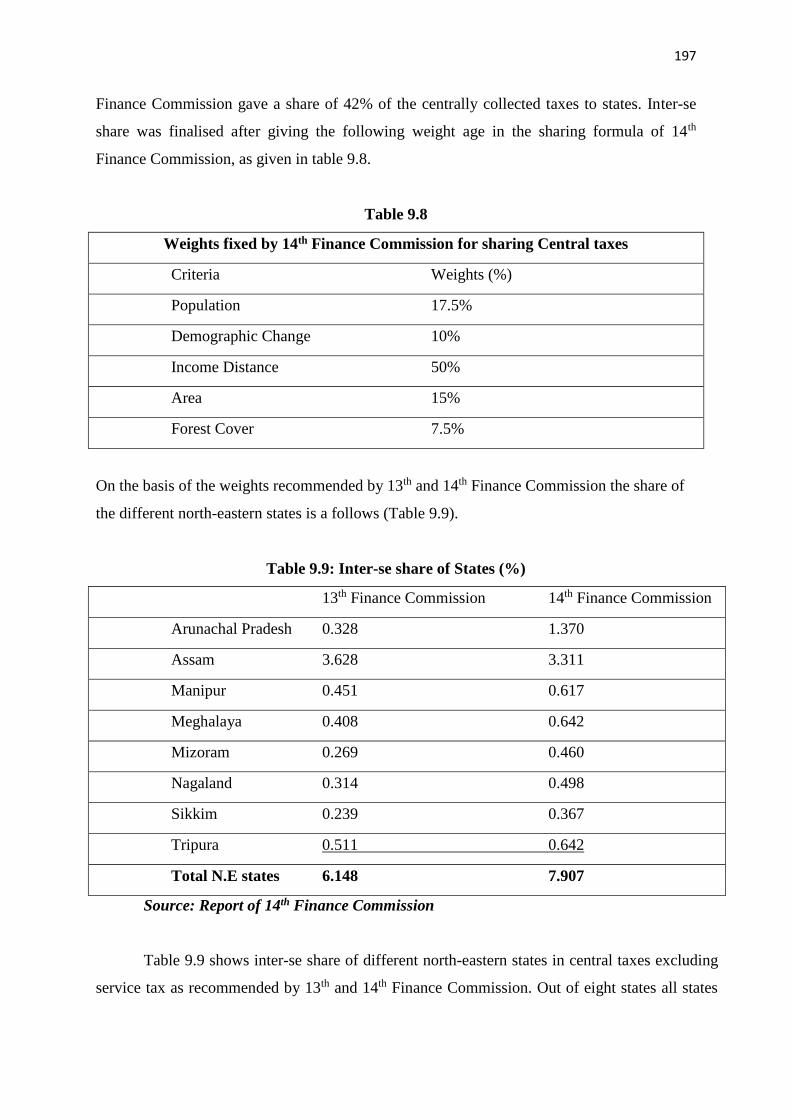
197
Finance Commission gave a share of 42% of the centrally collected taxes to states. Inter-se
share was finalised after giving the following weight age in the sharing formula of 14th
Finance Commission, as given in table 9.8.
Table 9.8
Weights fixed by 14th Finance Commission for sharing Central taxes
Criteria Weights (%)
Population 17.5%
Demographic Change 10%
Income Distance 50%
Area 15%
Forest Cover 7.5%
On the basis of the weights recommended by 13th and 14th Finance Commission the share of
the different north-eastern states is a follows (Table 9.9).
Table 9.9: Inter-se share of States (%)
13th Finance Commission 14th Finance Commission
Arunachal Pradesh 0.328 1.370
Assam 3.628 3.311
Manipur 0.451 0.617
Meghalaya 0.408 0.642
Mizoram 0.269 0.460
Nagaland 0.314 0.498
Sikkim 0.239 0.367
Tripura 0.511 0.642
Total N.E states 6.148 7.907
Source: Report of 14th Finance Commission
Table 9.9 shows inter-se share of different north-eastern states in central taxes excluding
service tax as recommended by 13th and 14th Finance Commission. Out of eight states all states
198
except Assam had an increase in their respective share in central taxes. The maximum gain in
share was achieved by Arunachal Pradesh in 14th Finance Commission award as compared to
13th Finance Commission. Taking all the states together, 13th Finance Commission gave a share
of 6.148 percent to North-East, where as 14th Finance Commission gave a share of 7.907% out of
the total divisible pool of central taxes (excluding service tax). Thus, 14th Finance Commission
award was boon to north-eastern states in general and Arunachal Pradesh in particular.
9.9 Let us sum up:
The North-Eastern States are basically dependent on Central taxes except the State of
Assam.
The States like Arunachal Pradesh, Manipur, Mizoram, Nagaland and highly
dependent on central transfer, where the Assam is least dependent.
Own tax revenue base of the North Eastern States except Assam is low.
Data Revenue and Capital expenditure of all the states are high as compared to
national average.
All the north Eastern states enjoy revenue surplus in recent times.
Gross Fiscal Deficit of all the States in declining over time and is within manageable
level.
During 2004-05, total outstanding debt and liabilities of all North Eastern States was
quite high, which has declined over time. However, except Assam, Meghalaya,
Sikkim, Mizoram all other states have little bit higher level of outstanding liabilities in
2014-15.
In the centrally collected taxes (except service tax) 13th Finance Commission gave a
share of 6.148 percent, where as 14th Finance Commission gave a share of 7.907
percent.
The gain of Arunachal Pradesh in the award of 14th Finance Commission is
maximum, where it got a share of 1.37%. In 13th Finance Commission award it got a
share of 0.328%.

199
Check Your Progress
Answer in 50 words
(1) Define Own Tax Revenue.
(2) What is Transfer from the Central Government ?
(3) Differentiate between Revenue expenditure and Capital Expenditure
(4) What are the sources of borrowings of state government ?
(5) What is fiscal Deficit ?
9.10 Key terms:
1. Revenue Receipts
2. Tax revenue
3. Non-tax revenue
4. Own non-tax revenue
5. Grants from the Center
6. Share in Central taxes
7. Finance Commission
8. Revenue Deficit
9. Fiscal Deficit
9.11 Long type question.
1. Explain the different component of a Budget.
2. What is Revenue Deficit and Fiscal Deficit?
3. Explain the role of central transfer in the budget of North Eastern States.
4. Analyse the trend in revenue and Capital expenditure of North Eastern States?
5. Examine the trend in revenue and Fiscal Deficit of North Eastern States.
6. Critically analyse the outstanding Debt and liabilities of North Eastern States.
7. Explain the 13th and 14th Finance Commission’s award to North Eastern States.

200
9.12 Short type questions:
Write short notes on
1. Revenue Receipt.
2. Capital Receipt
3. Revenue Expenditure
4. Capital Expenditure
5. Fiscal Deficit
6. Revenue Deficit.
9.13 Suggested Readings
(1) Report of 13th Finance Commission, Government of India 2009
(2) Report of 14th Finance Commission, Government of India 2014

201
UNIT-X
Section - II
Fiscal issues of North Eastern states
Structure
10.0 Introduction
10.1 Objectives
10.2 Types of Planning
10.3 Economic Planning in India
10.3.1 Objectives of Economic Planning in India
10.3.2 Evaluation of the Five Year Plans
10.3.3 NITI (National Institution for Transforming India) AAYOG
10.3.4 Regional Disparities in Growth rates
10.4 Five Year Plans and North Eastern States of India
10.5 Problems and Prospects of North East Economy in the background of
economic liberalisation of India- Opening of NE economy
10.6 Key Words
10.7 Check Your Progress
10.8 Long Type Questions
10.9 Suggested Reading
10.0Introduction
Planning: Meaning and Importance
Economic Planning is defined as “a continuous process which involves decisions, or choices,
about alternative ways of using available resources, with the aim of achieving particular goals
at some time in the future.” A central authority, like the State, possessing the powers of
implementation, does the planning.
Importance of Planning:
Planning plays an important role in the country especially in the Underdeveloped Country
like India for the following reasons.
1. Limited resources: Since the resources- physical, natural, capital or human, are scarce,
planning provides a method of rational and considered choice for securing the optimum
combination of inputs.

202
2. The need for social justice: In a free enterprise economy, market forces operate in such a
way that economic growth do not necessarily trickle-down. Often the growth ignores those
people who deserve attention and need. Therefore, in such situation Planning helps to identify
those deficiencies in the economy and the social structure, which demand the largest attention
from the standpoint of economic growth.
3. Mobilisation of Resources and its allocation:
Since the resources are constraints, the plan for mobilising resources and savings is a
necessary counterpart of the scheme of investment. The resources has to be allocated and
distributed equally in the different sectors of the economy. In developing countries like India,
the choice of development projects should rest on social benefits rather than private
profitability. Hence, the intervention of state becomes necessary to optimise social gain from
the utilisation of scarce resources.
10.1Objectives
(1) To understand meaning and objectives of Planning
(2) To have an understanding of the planning process in the last few decades and the
outcome in regional imbalance in North East India.
(3) To have an idea of look East policy and its implication to North Eastern states of
India.
10.2 Types of Planning:
The economic planning can broadly be of two types-
1. Indicative Planning:
This type of planning is democratic in nature. In this type of planning, the sphere of state
intervention is limited to a) formulation of a plan and b) adoption of indirect controls. The
state can issue guidelines, and not directives, leaving it to the market forces to decide their
course of action. The capitalist economy follow this type of planning.
2. Imperative Planning: The socialist economy follow this type of planning. It is totalitarian
in nature and works based on directions. It is made imperative on the production units to
follow the plan and to fulfil the targets.
However, in a mixed economy like India both indicative and imperative planning co-exist.

203
10.3 Economic Planning in India:
The government of India set up the Planning Commission in 1950 to make an assessment of
the material, capital and human resources of the country and to formulate a plan for its most
effective and balanced utilisation of the country’s resources. India’s experience with the
economic planning is unique one as it is within the framework of a democratic mixed
economy.
The National Planning Commission was a non-statutory, non-constitutional body. The major
functions of the Commission was to formulate a plan for the most effective and balanced
utilisation of the country’s resources. The main objectives of the Planning commission are the
following:
1. To increase production to the maximum possible extent to achieve higher level of national
and per capita income.
2. To achieve full employment.
3 To reduce the inequalities of income and wealth
4. To set up a socialist society based on equality, justice, and absence of exploitation.
The Indian economy is gradually moving towards indicative planning where the Planning
Commission concerns itself with the building of a long-term strategic vision of the future and
decides on priorities of the nation.
10.3.1 Objectives of Economic Planning in India
The government of India launched the first Five-Year Plan in 1951. It initiated a process of
development aimed not merely at raising the standards of living of the people and opening
out to them new opportunities for a richer and more varied life. This was sought to be
achieved by planning for growth and social justice. The basic aims of Economic Planning in
India in the earlier plans was to bring about rapid economic growth through development of
agriculture, industry, power, transport and communications and all other sectors of the
economy. It aimed to achieve higher living standards. Nehru and Gandhi had differed on
what economic policy should be, but they agreed on the centrality of economic development
goals a top priority after independence, The Nehruvian view- derived predominantly from
Fabian socialism. It endorse the need for rapid development led by state economic activity
and planning. Within this broad objective, the early plans laid emphasis on the following:
1. Increase in national income.
2. Pushing up the rate of investment.

204
3. Ensuring social justice and equity.
4. Increase in employment.
5. Elimination of poverty.
6. To improve the three high-priority areas- agricultural production, the manufacturing
capacity and the balance of payments.
The Second and Third Five Year Plans elaborately discussed some of these objectives. The
subsequent plans simply reiterated the same objectives. Although, the broad objectives of
planning remained the same, the relative emphasis and priorities shifted as the process of
growth went ahead. The Fifth and Sixth Five Year Plan accorded the top priority on removal
of poverty and self-reliance. The Seventh Plan stressed the modernisation. Modernisation
implies a shift in the sectoral composition of production, diversification of activities and
advancement of technology and institutional innovations to transform a feudal and colonial
economy into a modern and independent economy.
The economic growth has been the major objective from the first to the present times. The
country has witnessed fluctuations in the rate of economic growth but somehow it grows
gradually. However, the social justice remain eluded and therefore the Eleventh Five year
Plan introduced the objective of achieving faster and more inclusive growth which aims to
provide greater opportunity for employment, greater capabilities, access to opportunities and
security to protect the means of livelihood. The same objectives was carried forward in the
Twelve Five Year Plans as well but with an aim to achieved sustainable developments
10.3.2 Evaluation of the Five Year Plans:
The First Five-Year Plan (1951-56) provided an incisive general analysis of the nature of the
country’s development problem and various options from mobilising resources and achieving
development with more equal distribution. In this period, India faced three major problems-
influx of refugees, severe food shortage, and mounting inflation. The first five year plan gave
special emphasise to the rural labor and land reforms. The plan projected an increase in
savings and investment as a proportion of national income would rise from an estimated 5-6
percent in the early 1950s to 20 percent by 1968-69. It attempted a process of all-round
development, which would ensure a rising national income and a steady improvement in the
living standard of the people over a period of time.
The second five-year plan (1956-61) was more ambitious than the previous plan. It followed
the two-sector model framed by P.C. Mahalanobis. One sector produced consumer goods and
205
the other investment goods, with sector-specific capital as the only factor of production.
Based on the strategy of this model, the second plan aimed at heavy industrialisation with
particular emphasis on the development of basic and heavy industries such as iron and steel,
heavy chemicals, heavy engineering etc. Thereafter, the Government announced its Industrial
Policy in 1956 accepting the establishment of a socialistic pattern of a society as the goal of
economic policy.
The dominant growth orientation articulated in the Mahalanobis strategy of the Second Plan
continued into the Third Plan. The Third Plan set its goal the establishment of a “self-reliant
and self-generating economy.” It gave top priority to agriculture but it laid adequate
emphasis on the development of basic industries. Later, the Third Plan shifted its priority to
development to defense and development due to India’s conflict with China in 1962 and with
Pakistan in 1965. However, a reasonable success was achieve during Second and Third Five
Year Plan. Public sector investment in infrastructure and indirectly productive investments in
universal intermediaries like steel, coal, power, and heavy electrical machinery increased
considerably. Nevertheless, very little was achieve in case of small scale, cottage, and village
industries as means of providing employment. In terms of aggregate performance, this phase
witnessed a sustained growth in per capita incomes, distinct acceleration in public sector
investment and in the growth of industrial output.
The first three five year plans was successful but due to two consecutive droughts and the
foreign exchange crisis of the mid-1960s, the fourth plan could not be established as per the
plan. The increased defence expenditure due to the conflict with China and Pakistan put the
economy under severe strain. Therefore, three annual plans (1966-1969) called as Plan
Holiday were implemented.
The Fourth Five Year Plan (1969-74) had two principal objectives- “growth with stability
and progressive achievement of self-reliance.” It aimed at 5.5 percent average rates of
growth in the national income and the provision of minimum for the weaker sections of the
community. It also emphasised on the food security after facing two droughts.
The Fifth Plan (1974-79) recognised the inadequacy of growth and industrialisation to
improve the living conditions of the people, particularly the poor. The concept of ‘minimum
needs’ and slogans of Garibi Hatoa and ‘growth with social justice’ were the main concern
of this plan.
There were two Sixth Plan (1978-83) due to the instability of the government; the first Sixth
Plan framed by the Janata Dal was not successful. After the congress, defeated Janata dal, a
new Sixth Plan was formulated (1980-85). While admiring Nehru Model the congress plan

206
shifted pattern of industrialisation with lower emphasis on heavy industries and more on
infrastructure. The Sixth Plan witnessed a reasonable growth rate of 5.4 percent.
The Seventh Plan (1985-90) emphasis on the programmes and policies, which would increase
the growth in food grain production, increase employment opportunity and raised
productivity. It was also during this period that a reappraisal of the import-substitution
strategy begins and a gradual liberalisation of the Indian economy is initiated.
The Eight Plan (1990-95) was overtaken by the crisis (balance of payment crisis, a raising
debt burden, huge budget deficits, inflation, and recession in industry) of 1991 and the
economic reforms. Due to this crisis, two-year plan holiday was introduced and it demanded
a full appraisal of the planning methodology and the Eight Plan represents the first efforts at
planning for a market-oriented economy.
After liberalisation, planning that was practised in the first four decades after independence
was no longer tenable. The Ninth Plan was prepared under the United Front Government and
was released in March 1998. Its focus was on “Growth with Social Justice and Equality.”It
assigned priority to agriculture and rural development with a view of generating adequate
productive employment and eradication of poverty.
Following liberalisation, the subsequent Five Year Plans were indicative in nature. Therefore,
the role of the public sector in the Indian economy has considerably shrunk and is shrinking
further. The Tenth Five Year Plan (2002-07) aimed of doubling the per capita income in the
next ten year. It aimed to achieve the 8 percent GDP growth rate for 2002-07. It also aimed to
improve the basic social services, especially suggested health, availability of drinking water
and basic sanitation. Universal access to primary education was given importance. The Tenth
Plan recorded a highest growth rate in all the five year plans.
The Eleventh Five Year Plan (2002-2012) envisages a high growth of GDP like Tenth Plan
and set goal in the form of moving “Towards Faster and More Inclusive Growth.” The
economy has performed well on the growth front, averaging 7.9 percent; the goal was
paradoxically anti-labour and pro-corporate sector. This was in conflict with the goal of
providing secure income and employment for common person. There was no policy for
improvement of small and medium enterprises and small peasant agriculture. The removal of
poverty required special attention but the planning commission were silent on some issues
like food security, strengthening price support system, creation of price stabilisation fund for
agricultural commodities, universalising crop insurance, protection to peasantry from
subsidised imports of agricultural commodities and land reform.

207
10.3.3 NITI (National Institution for Transforming India) AAYOG:
On 1st January 2015, the NITI Aayog came into existence as the government’s premier
thinktank. It replaced the erstwhile Planning Commission. The cabinet resolution lists 13
different tasks to NITI Aayog which may be grouped under four major heads, namely:
i) Fostering cooperative federalism by providing structured support to states on a
continuous basis;
ii) Formulation of a strategic vision and long term policies and programme
framework both for the macro economy and for different sectors;
iii) Acting as a knowledge and innovations hub and providing research inputs by
undertaking and accessing globally available research and
iv) Providing a platform for interdepartmental coordination.
v) NITI Aayog will have Prime Minister as its Chairman, vice-chairman cum Chief-
Executive Officer (CEO), five fulltime members and two part time members,
apart from four central government ministers.
10.3.4 Regional Disparities in Growth rates:
India is a vast and diverse country. There is a regional variation in the growth and
development of the states. Some states are exceedingly doing well than others in terms of
growth of Gross State Domestic Product Growth. The inequalities exists not only between the
states but also within the states. Even in some of the States with comparatively small
geographical area, the levels of development are very uneven, especially in the Himalayan
region of Nagaland, Mizoram, Arunachal Pradesh, Jammu & Kashmir (J&K), Himachal
Pradesh and Uttarakhand. The unequal levels of development in the larger States, including
several regions like Vidarbha region of Maharashtra; Koraput, Bolangir and Kalahandi
(popularly known as KBK districts) of Orissa; Bundelkhand region, Eastern UP and parts of
Central UP, northern Bihar, tribal areas of Jharkhand and Chhattisgarh, Andhra Pradesh,
Maharashtra, UP and north Karnataka are a few examples. Such regional inequalities both
between states and within states pose a serious development challenge to the Indian economy.

208
Table 10.1 State Wise Growth Rate in SDP for different plans period
State\UT
Eighth Plan Ninth Plan
Tenth Plan (2002-2007)
Eleventh Plan (2007-2012)
Andhra Pradesh 5.4 5.5 8.2 8.2
Bihar 3.9 3.7 6.9 9.9
Chhattisgarh 8.8 7.7
Goa 9.0 5.7 8.5 9.1
Gujarat 12.9 2.8 11.0 9.5
Haryana 5.2 6.1 9.0 9.0
Jharkhand 5.0 9.3
Karnataka 6.2 5.8 7.7 7.2
Kerala 6.5 5.2 8.3 8.2
Madhya Pradesh 6.6 4.5 5.0 9.2
Maharashtra 8.9 4.1 10.1 8.6
Odisha 2.3 5.1 9.2 7.1
Punjab 4.8 4.0 6.0 6.7
Rajasthan 8.0 5.3 7.1 8.5
Tamil Nadu 7.0 4.7 9.7 7.7
Uttar Pradesh 5.0 2.5 5.8 7.1
West Bengal 6.3 6.5 6.2 7.3
Special Category States
Arunachal 5.0 6.6 6.2 8.5
Assam 2.8 1.8 5.0 6.8
Manipur 3.7 4.7 5.7 6.2
Meghalaya 4.0 7.2 6.7 7.8
Mizoram N.A 5.7 5.9 10.8
Nagaland 7.2 6.5 7.4 6.2
. Sikkim 4.6 6.6 7.7 22.8
Tripura 6.7 9.4 6.9 8.9
Average NE 4.9 6.1 6.4 9.8
All India 7.5 5.5 7.8 8.0
Source: Planning Commission, twelve Five Year Plan (2012-2017).
Different scholars attributes many reasons for the regional disparities in India. They are
inequities in access to social and physical infrastructure, lack of private sector investment,
access to credit, and quality of human capita. In addition, institutions matter, and regions with
better law and order and governance benefit in the form of higher and sustained growth.
Taking note of the regional disparities the eleventh Five Year Plan laid emphasise on the
reduction of inter-state inequalities in Per Capita Income (PCI). The increase in PCIs in turn
will depend on the growth rates. Therefore, the acceleration of growth rates and related
indicators are important to achieve the objective.
The growth rates of SDP show several interesting convergence trends. The growth rate of
Orissa (2.3) and Bihar (3.9) which was the lowest in Eight Plan has increased significantly to
7.7 and 9.9 per cent respectively. Similarly, MP, UP and Rajasthan have all recorded growth
rates of 7 per cent or more in the Eleventh Plan. Other states like Gujarat, Goa, Jharkhand and

209
Haryana also recorded an increase in growth rate of more than 9 per cent in Eleventh Five
Year Plan.
In case of the Special Category States, Sikkim recorded, the highest growth rate in Eleventh
Plan (22.8) followed by Mizoram (10.8) and Tripura (8.9). The growth rate of State Domestic
Product (SDP) of Arunachal Pradesh has increased from 5.0 per cent in Eight Plan to 8.5 per
cent in Eleventh Plan. All states has recorded an increased in the growth rate except Nagaland
whose growth rate fluctuates from 7.2 percent in eighth plan to 6.5 in Ninth Plan, 7.4 per cent
in Tenth Plan, and 6.2 percent in Eleventh Plan.
10.4 Five Year Plans and North Eastern States of India
NER comprises of eight States of the North- East (NE), including Assam, Arunachal Pradesh,
Manipur, Meghalaya, Mizoram, Nagaland, Tripura and Sikkim. Special requirements of the
NER and the need for significant levels of investment are now well recognised. Accordingly,
efforts have been made since inception of the planning process to address the problems in the
critical areas of development with special programmes and funding arrangements. There has
also been continuous attempt to supplement development efforts of the Special Category
States of NER by the Centre by providing Central Plan Assistance. Some of the programmes,
like BADP, HADP, grants under Article 275(1) and BRGF are attempts to address some of
the area specific problems in a limited way. Setting up of the North-Eastern Council (NEC)
under NEC Act, 1971, as regional planning body has been another sincere step for balanced
development of the region. In the latter part of the Ninth Plan, the announcement of ‘New
Initiatives for the North Eastern Region’ in October 1996 gave further boost to the
development process. Earmarking of at least 10 per cent of the Plan Budget of the Central
Ministries/Departments for NER and creation of Non-lapsable Central Pool of Resources
(NLCPR) were the outcome of this announcement. Both of these helped transfer of resources
to the region.
Larger Plan investments and focus on infrastructure development has helped growth in this
region. It is encouraging to note that there has been substantial improvement in the growth
rate in the NE States, particularly in the Eleventh Plan. The growth rate of 6.1 per cent in the
Ninth Plan improved to 6.4 per cent in the Tenth Plan, though less than the National Average
of 7.8 per cent. The average GSDP growth of these States during Eleventh Plan improved to
9.8 per cent against 8 per cent at the national level. Average growth of NE States exceeded

210
the National average in the Eleventh Plan. If the exceptional growth of Sikkim is excluded,
the average of seven States was 7.9 per cent. This improvement in the growth is due to
concerted efforts of the Centre and the State.
The North-Eastern states has a large potential to develop and outgrow others states. It has
vast untapped natural resources which if utilise properly can make the region vibrant. It has a
large potential for producing hydro power of around 50000 MW but the pace of
implementation has been poor. However, its evacuation of power poses a major challenge for
several reasons. Firstly, lack of connectivity is one of the main problem. The entire capacity
of power has to be evacuated through a narrow strip of about 25 km in West Bengal.
Although no forest clearance is needed, land acquisition issues could pose problems, which
need to be tackled. Second, the number of hydro power plants coming up in the region,
especially in Arunachal Pradesh, is expected to be spread over the Twelfth and Thirteenth
Plans but the transmission system has to be devised as a onetime operation and may therefore
have redundancy initially. This will increase the costs of transmission. Thirdly, a number of
States including Arunachal Pradesh, Tripura and Manipur do not have adequate 132/220/400
KV systems and this may cause problems in evacuation of power. Fourthly, the distribution
system is inadequate and consequently leads to large power losses.
The development of roads in the North-East had been taken up by special programme under
Special Accelerated Road Development Programme for North-East (SARDP-NE). It is
proposed that the balance works under these programmes, which includes connectivity of all
State capitals of North-East with two or four-lane NHs with paved shoulders and connecting
all district headquarters with two-lane NHs will be taken up for completion. SARDP-NE
Phase-B for which work has been taken up to prepare DPRs would be completed. It is
planned to develop and complete the Trans- Arunachal Pradesh Highway during the Plan.
The Twelfth Five- Year Plan proposed to connect all the state capitals in the North East with
the rest of the country by railways. New lines for connecting state capitals of Arunachal
Pradesh, Manipur, Nagaland, Mizoram, and Meghalaya have been sanctioned and works are
in progress. The work on these railway lines will be expedited so that all state capitals in the
North East Region are on the rail map by 2020.

211
10.5 Problems and Prospects of North East Economy in the background of economic
liberalisation of India- Opening of NE economy.
Indian Economy was highly regulated during the first four decades of economic planning
(1950-1990). On the one hand, the five-year plan focused on development of public sector for
setting up of heavy and basic industries; on the other hand, it restricted the growth of private
sector. India was facing huge balance of payment crisis, sick public sector enterprises,
economic and financial crisis in early 1990s, which led to the introduction of New Economic
Policy (NEP) in 1991. The three basic elements of economic reforms were liberalisation,
privatisation, and globalisation of the Indian economy.
The government of India initiated the process of globalisation in 1991 and adopted different
measures to integrate her economy with the world economy. One measure is liberalisation.
Liberalisation is a process of opening up the national economy through the measures of de-
control and de-regulation in order to facilitate the free flow of capital. Since, India has
decided to integrate its economy with the rest of the world, the questions that arises is to what
extent its different regions, and sub-regions has been integrated with the world. While there
are many prospects for the development of North Eastern States in the backdrop of Economic
Liberalisation, it is not free from problems.
The problems are:
1. Lack of Entrepreneurial Class: At the local or regional level, the presence of a competitive
entrepreneurial class is a pre requisites criterion to reap the benefits of liberalisation. The
greatest benefit of liberalisation is to be borne by the entrepreneurial class. However, North
Eastern states lack entrepreneurial class. The entrepreneurial activities are absent among the
tribal community and hardly any tribal engaged in trading or commercial activities.
Therefore, the benefits would be reap by the rich mainland entrepreneurial class.
2. Lack of Physical Infrastructures: The North Eastern states can hardly attract private
investment due to lack of physical infrastructures like road, railways and electricity.

212
3. Socio-Political Conditions: The socio-political conditions of North East acts as
disincentive to the private investors. Outsiders are somehow considers as threat to the Tribals
of north east for political or historical reasons. Inner Line Permits have been implemented in
many states of North East, which regulates the free movement and the licensing principle is
discriminatory in many states. Insurgency problem that exists in North Eastern states like in
Nagaland, Assam and Some part of Arunachal Pradesh is a hindrance to attract the foreign
and private investor. They collect taxes from the traders, entrepreneur, professionals, and
even white-collar employee for their interest against the protection of the region.
Propects:
While the states have manifold problems in respect to the liberalisation, there are huge
prospects for the region to develop at par with the other states of India. The North Eastern
States lags behind rest of the India in terms of economic indicators like industrial growth,
power supply, urbanisation, credit facilities etc. Therefore, the people of this regions has the
right to demand the development of own regions. If economic development has to be,
meaningful it has to meet the specific needs of the regions.
After economic liberalisation, Indian economy has integrated with the world economy
through FDIs capital flow and trade. This has opened up new avenues for exporters,
entrepreneurs, and businesspersons across the country. North- Eastern regions has huge
untapped natural resources, hotspots of unique tribal cultures and festivals, it has a huge
potential to benefits from liberalisation. The region has vast mineral deposits, forest products,
medicinal plants, horticultural products, traditional handlooms, and handicrafts items etc.
These items can substantially improve its economic development process through effective
participation in global trade and commerce. The region has 98% international borders with
Bangladesh, Mynanmar, China, Bhutan and Nepal for which it can also develop boarder trade
with the neighbouring countries
The government of India has initiated Look East Policy for which Northeast can benefit a
lot.As part of Look East Policy, India is now one of four summit level partners – along with
China, Japan, and Korea – of the Association of South East Asian Nations (ASEAN). Trade
between India and ASEAN countries is expanding significantly. India has signed free trade
area (FTA) agreements with Thailand and Singapore. There are a number of structures of
213
sub-regional cooperation in place including the Mekong-Ganga Cooperation (MGC) and
BIMSTEC (Bangladesh, India, Myanmar, Sri Lanka, and Thailand – Economic Cooperation).
Outside of ASEAN and bilateral trade between India and China has improved significantly.
The Look East Policy was renamed as Act East Policy and it was unveiled at the 12th
ASEAN-India Summit in 2014. India was ASEAN sixth largest trading partner in 2017.
Economic integration with South East Asia and its immediate neighbours offers enormous
growth potential for Northeast. It could end the long decades of isolation for the remote
region and turn it into a strategic bridge giving India access to the East. While markets in the
North-East are much smaller than other regions in India,
The regions has a huge hydropower potential and if it is tapped and utilised properly it can be
exported to its neighbouring international trade partners. The small-scale industries like
pickle making, handlooms and handicrafts will also grow if proper roads and connectivity is
built up. North East India is a hub of tourist attraction. Therefore, the development of roads
and communication will boost its tourism sector.
However, there exists certain bottlenecks which ultimately curtail the promising future of
northeast .Ethnic conflicts and insurgencies, presence of paramilitary forces, tight security
apparatus, under developed physical infrastructure, lack of entrepreneurial spirit, lack proper
marketing channels etc, pose serious challenges to the development of northeast. A broad
based inclusive strategy can address these challenges and lead the regional economy towards
sustained economic growth and social development.
10.6Key Words
(1) Economic Planning
(2) Indicative Planning
(3) Imperative Planning
(4) NITI Aayog
(5) Look East Policy

214
10.7 Check Your Progress
Explain in 50-100 words
(a) Explain the importance of Economic Planning
(b) What are various types of Planning?
(c) Explain various objectives of Planning.
(d) What are the objectives of Planning in India?
(e) What is NITI Aayog? How is it different from Planning Commission?
(f) What is Look East policy?
10.8 Long Type Questions
(1) Explain the Planning process and outcome in the context of North East India
(2) Critically examine the objectives of Planning of different five years plan in India with
reference to North Eastern States.
(3) Give an outline of emerging regional disparities in growth rate during 8th to 11th five year
plan in India.
(4) Explain the problems and prospects of Look East Policy in the context of North Eastern
States.
10.9 suggested Reading
1. Datt and Sundharam (2016) Indian Economy (72nd Edition) S. Chand and
Company Pvt.Ltd.
2. (Bhattacharjee, 1998)Bhattacharjee, G. D. and R. K. (Ed.). (1998).
Liberalisation And North East India. In Liberalisation and India’s North-East
(pp. 275–284). Commonwealth Publishers.
3. Indian Economic Policy, Development Strategies in India, Indira Gandhi
National Open University 2012, New Delhi.
215
4. Mishra and Puri (2018): Indian Economy (28th Revised Edition), Himalaya
Publishing House.
5. (Purkayastha, 1998)Purkayastha, G. D. and R. K. (Ed.). (1998). Liberalisation
And North East India. In Liberalisation and India’s North-East (pp. 275–
284). Commonwealth Publishers.
6. Twelfth Five-Year Plan (2012/2017)/Planning Commission, Government of
India.
7. Uma Kapila (2017) Indian Economy since Independence, A comprehensive
and Critical Analysis of India’s Economy, 1947-2017, Academic foundations
New Delhi.