m&a event study: men’s wearhouse & gap
TRANSCRIPT

M&A Event Study Men’s Wearhouse & Gap
TEOH, Khye Shyang MONEY, Ruben KIEW, Dorothy HO, Anh

ABSTRACT
The objective of this report is to analyse the impact of an unexpected corporate event on stock prices,
thereupon evaluating the market efficiency theory. We employed an event study to evaluate the impact of an
acquisition announcement from two different M&A bidders in the apparel industry – Men’s Wearhouse and
Gap. We found insufficient evidence to suggest that there were significant positive abnormal returns at the
5% significance level and this supports the semi-strong market efficiency theory.
INTRODUCTION
MOTIVES FOR MERGERS & ACQUISITIONS
A merger occurs when a company strengthens its market position by combining with another company to
form a new company. An acquisition occurs when a company (acquirer/bidder) bids for another company
(target) with the intention of controlling the target’s operations. Rationales for acquisitions by companies
include the ability increase market power and eliminate competition while benefiting from ‘economies of
scale’. An acquisition is financially viable when the synergies generated exceed the cost of acquisition.
EMPIRICAL EVIDENCE
Franks et al (1991), Mulherin & Boone (2000), and Kuiper et al (2003) whose studies covered over 700 US
companies spanning over 15 years in aggregate found that shareholders of the acquiring firm experience
returns between 0 and -1%. In contrast, Bradley et al (1988) found returns were around 1% for his sample.
Casper Flugt published a paper in 2009 where he found that M&A announcements by European firms
generate positive abnormal returns for acquiring shareholders in the short-term; his research covered 22
companies during 2000-2008. Out of the three parametric tests done, the average CAR value was found to
be significant for only one. Further testing on returns for domestic and cross-border M&A led Flugt to find that
out of 22 cases, 12 reported insignificant negative results whilst the remaining 10 showed positive returns.
He also concluded that the average cumulative return is statistically close to 0.
Krishna Reddy, Sazali Abidin and Song Chen (2012) researched 30 companies from China, 40 from India
and 32 from the US during 2004-2007. They found evidence supporting their null hypothesis that bidders
generate zero market and mean adjusted returns, and concluded that company value does not increase after
an M&A. The CAAR even suggested that US companies’ value on average are lower after M&A.
2 | P a g e

HYPOTHESIS
Based on empirical findings of various studies, we have decided to form a null hypothesis which states that
an acquisition announcement will not general positive abnormal returns for M&A bidders.
H0: Acquisition announcement by Men’s Wearhouse and Gap will not generate positive abnormal returns for
their shareholders in the short term
H1: Acquisition announcement by Men’s Wearhouse and Gap will generate positive abnormal returns for their
shareholders in the short term
DATA & METHODOLOGY
DATA COLLECTION & SAMPLING
The market studied is the New York Stock Exchange Composite Index as both chosen companies are listed
on this index. Men’s Wearhouse made the announcement to acquire Jos. A. Bank on 18 July 2013 for $1.3
billion while Gap announced their plans to acquire Intermix for $130 million on 3 January 2013. Both were
market surprises because the targets were in a different marketspace (luxury apparel). The total period
covered is 31 July 2012 to 13 September 2013 for Men’s Wearhouse and 18 January 2012 to 4 March 2013
for Gap. This period is then separated into an estimation period (day -240 to -40) and an event period (day -
40 to +40). The estimation period’s returns are used to calculate the standard deviation, and CAPM intercept
and slope. The data was sourced from a Bloomberg terminal.
METHODOLOGY
Financial event studies are used to detect the presence of event-induced returns within an event period. The
underlying architecture of the study is similar to that introduced in Fama et al (1969) where abnormal returns
are measured by deviations from market model predictions. Previous studies have suggested that stock
prices and essentially the market, assimilate new information almost instantaneously, preventing any
profitable arbitrage trading due to systematic over/under-reaction and supporting the market efficiency theory.
A stock is typically expected to yield returns equal to the market and remain within the confidence interval in
a statistical test. The single factor market index model (eqn. 1) is used to test for abnormal returns (eqn. 3).
Such returns are returns beyond what would be predicted from market movements alone and are represented
in the error term (eqn. 2) of the model. Adding the abnormal returns (eqn. 4) may reduce the noise of other
components of stock movement.
3 | P a g e
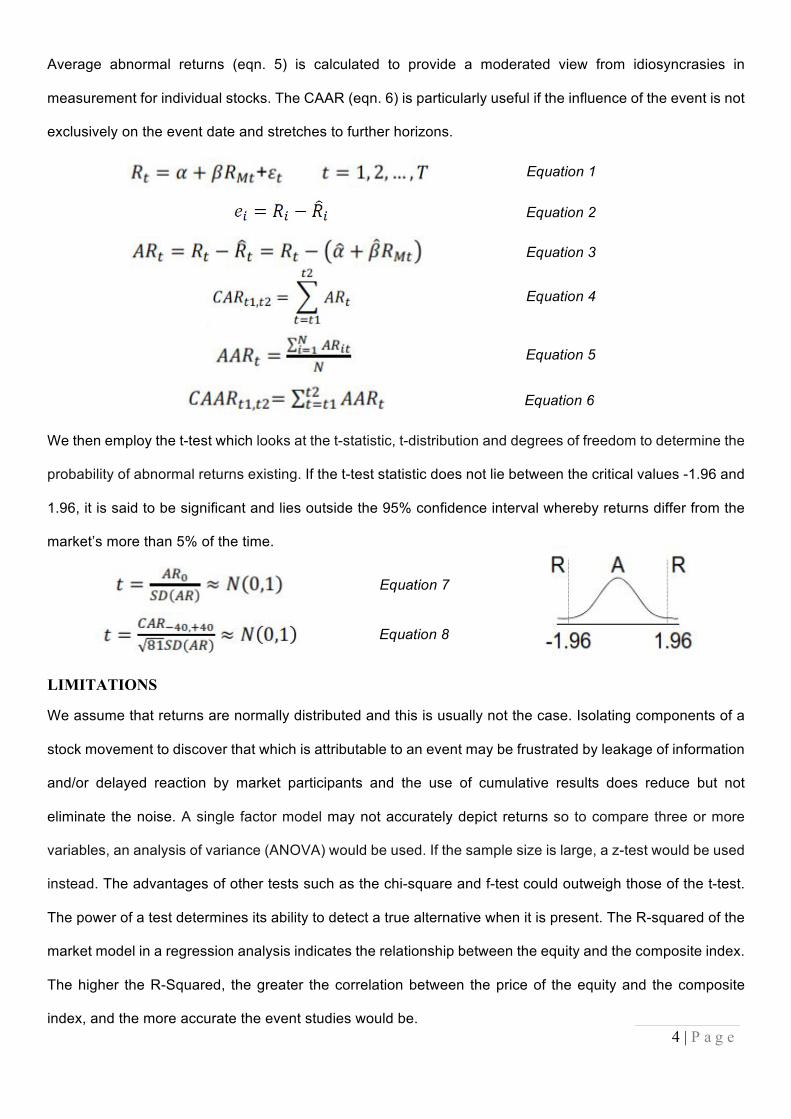
Average abnormal returns (eqn. 5) is calculated to provide a moderated view from idiosyncrasies in
measurement for individual stocks. The CAAR (eqn. 6) is particularly useful if the influence of the event is not
exclusively on the event date and stretches to further horizons.
We then employ the t-test which looks at the t-statistic, t-distribution and degrees of freedom to determine the
probability of abnormal returns existing. If the t-test statistic does not lie between the critical values -1.96 and
1.96, it is said to be significant and lies outside the 95% confidence interval whereby returns differ from the
market’s more than 5% of the time.
LIMITATIONS
We assume that returns are normally distributed and this is usually not the case. Isolating components of a
stock movement to discover that which is attributable to an event may be frustrated by leakage of information
and/or delayed reaction by market participants and the use of cumulative results does reduce but not
eliminate the noise. A single factor model may not accurately depict returns so to compare three or more
variables, an analysis of variance (ANOVA) would be used. If the sample size is large, a z-test would be used
instead. The advantages of other tests such as the chi-square and f-test could outweigh those of the t-test.
The power of a test determines its ability to detect a true alternative when it is present. The R-squared of the
market model in a regression analysis indicates the relationship between the equity and the composite index.
The higher the R-Squared, the greater the correlation between the price of the equity and the composite
index, and the more accurate the event studies would be.
Equation 1
Equation 2
Equation 3
Equation 4
Equation 7
Equation 5
Equation 6
Equation 8
4 | P a g e
-0.2
-0.15
-0.1
-0.05
0
0.05
0.1
-40 -30 -20 -10 0 10 20 30 40
Ret
urns
Time (days relative to announcement)
CUMULATIVE AVERAGE ABNORMAL RETURNS
-0.12
-0.1
-0.08
-0.06
-0.04
-0.02
0
0.02
0.04
0.06
-40 -30 -20 -10 0 10 20 30 40
Ret
urns
Time (days relative to announcement)
ABNORMAL RETURNS
Men's Wearhouse Gap
-0.05
-0.04
-0.03
-0.02
-0.01
0
0.01
0.02
0.03
0.04
-40 -30 -20 -10 0 10 20 30 40
Ret
urns
Time (days relative to announcement)
AVERAGE ABNORMAL RETURNS
-0.5
-0.4
-0.3
-0.2
-0.1
0
0.1
0.2
0.3
-40 -30 -20 -10 0 10 20 30 40
Ret
urns
Time (days relative to announcement)
CUMULATIVE ABNORMAL RETURNS
Men's Wearhouse Gap
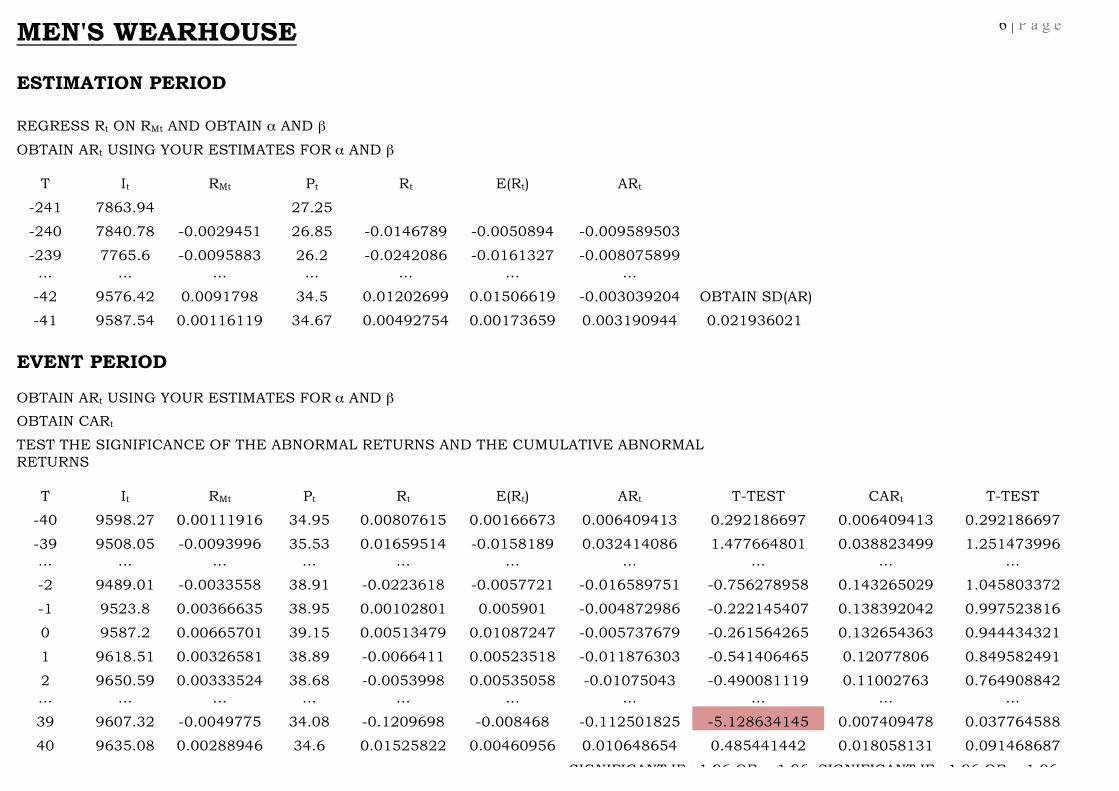
MEN'S WEARHOUSE 6 | P a g e
ESTIMATION PERIOD
REGRESS Rt ON RMt AND OBTAIN α AND β
OBTAIN ARt USING YOUR ESTIMATES FOR α AND β T It RMt Pt Rt E(Rt) ARt
-241 7863.94 27.25
-240 7840.78 -0.0029451 26.85 -0.0146789 -0.0050894 -0.009589503
-239 7765.6 -0.0095883 26.2 -0.0242086 -0.0161327 -0.008075899 … … … … … … …
-42 9576.42 0.0091798 34.5 0.01202699 0.01506619 -0.003039204 OBTAIN SD(AR)
-41 9587.54 0.00116119 34.67 0.00492754 0.00173659 0.003190944 0.021936021
EVENT PERIOD
OBTAIN ARt USING YOUR ESTIMATES FOR α AND β OBTAIN CARt
TEST THE SIGNIFICANCE OF THE ABNORMAL RETURNS AND THE CUMULATIVE ABNORMAL RETURNS
T It RMt Pt Rt E(Rt) ARt T-TEST CARt T-TEST
-40 9598.27 0.00111916 34.95 0.00807615 0.00166673 0.006409413 0.292186697 0.006409413 0.292186697
-39 9508.05 -0.0093996 35.53 0.01659514 -0.0158189 0.032414086 1.477664801 0.038823499 1.251473996 … … … … … … … … … …
-2 9489.01 -0.0033558 38.91 -0.0223618 -0.0057721 -0.016589751 -0.756278958 0.143265029 1.045803372
-1 9523.8 0.00366635 38.95 0.00102801 0.005901 -0.004872986 -0.222145407 0.138392042 0.997523816
0 9587.2 0.00665701 39.15 0.00513479 0.01087247 -0.005737679 -0.261564265 0.132654363 0.944434321
1 9618.51 0.00326581 38.89 -0.0066411 0.00523518 -0.011876303 -0.541406465 0.12077806 0.849582491
2 9650.59 0.00333524 38.68 -0.0053998 0.00535058 -0.01075043 -0.490081119 0.11002763 0.764908842 … … … … … … … … … …
39 9607.32 -0.0049775 34.08 -0.1209698 -0.008468 -0.112501825 -5.128634145 0.007409478 0.037764588
40 9635.08 0.00288946 34.6 0.01525822 0.00460956 0.010648654 0.485441442 0.018058131 0.091468687
SIGNIFICANT IF >1.96 OR <-1.96 SIGNIFICANT IF >1.96 OR <-1.96

GAP 7 | P a g e
ESTIMATION PERIOD
REGRESS Rt ON RMt AND OBTAIN α AND β OBTAIN ARt USING YOUR ESTIMATES FOR α AND β
T It RMt Pt Rt E(Rt) ARt
-241 7766.95 18.64
-240 7819.37 0.00674911 19.37 0.03916309 0.00896056 0.030202532
-239 7829.33 0.00127376 18.63 -0.0382034 0.00417944 -0.04238285 … … … … … … …
-42 8311.36 0.01094218 35.65 -0.0019597 0.01262197 -0.01458166 OBTAIN SD(AR) -41 8234.91 -0.0091983 35.11 -0.0151473 -0.0049648 -0.010182468 0.01799816
EVENT PERIOD
OBTAIN ARt USING YOUR ESTIMATES FOR α AND β OBTAIN CARt TEST THE SIGNIFICANCE OF THE ABNORMAL RETURNS AND THE CUMULATIVE ABNORMAL RETURNS
T It RMt Pt Rt E(Rt) ARt T-TEST CARt T-TEST
-40 8240.26 0.00064967 35.37 0.0074053 0.00363449 0.003770812 0.209510984 0.003770812 0.209510984
-39 8312.35 0.00874851 35.94 0.01611535 0.01070645 0.005408902 0.30p0525302 0.009179714 0.360650116 … … … … … … … … … …
-2 8443.51 0.01531234 31.04 0.02004601 0.01643803 0.003607976 0.200463591 -0.254809038 -2.267015167
-1 8632.01 0.02232484 31.37 0.01063144 0.0225614 -0.011929956 -0.66284311 -0.266738994 -2.343302816
0 8607.79 -0.0028058 32.09 0.02295186 0.00061711 0.022334755 1.240946593 -0.244404239 -2.120746247
1 8667.68 0.00695765 32.1 0.00031162 0.00914266 -0.008831035 -0.490663204 -0.253235274 -2.171058148
2 8636.91 -0.00355 31.2 -0.0280374 -0.0000326 -0.02800471 -1.555976302 -0.281239984 -2.382948943 … … … … … … … … … …
39 8874.19 0.00061677 33.87 0.02885784 0.00360576 0.025252079 1.403036732 -0.331894111 -2.061704669
40 8901.05 0.00302676 33.65 -0.0064954 0.00571017 -0.012205595 -0.678157927 -0.344099706 -2.124289454
SIGNIFICANT IF >1.96 OR <-1.96 SIGNIFICANT IF >1.96 OR <-1.96
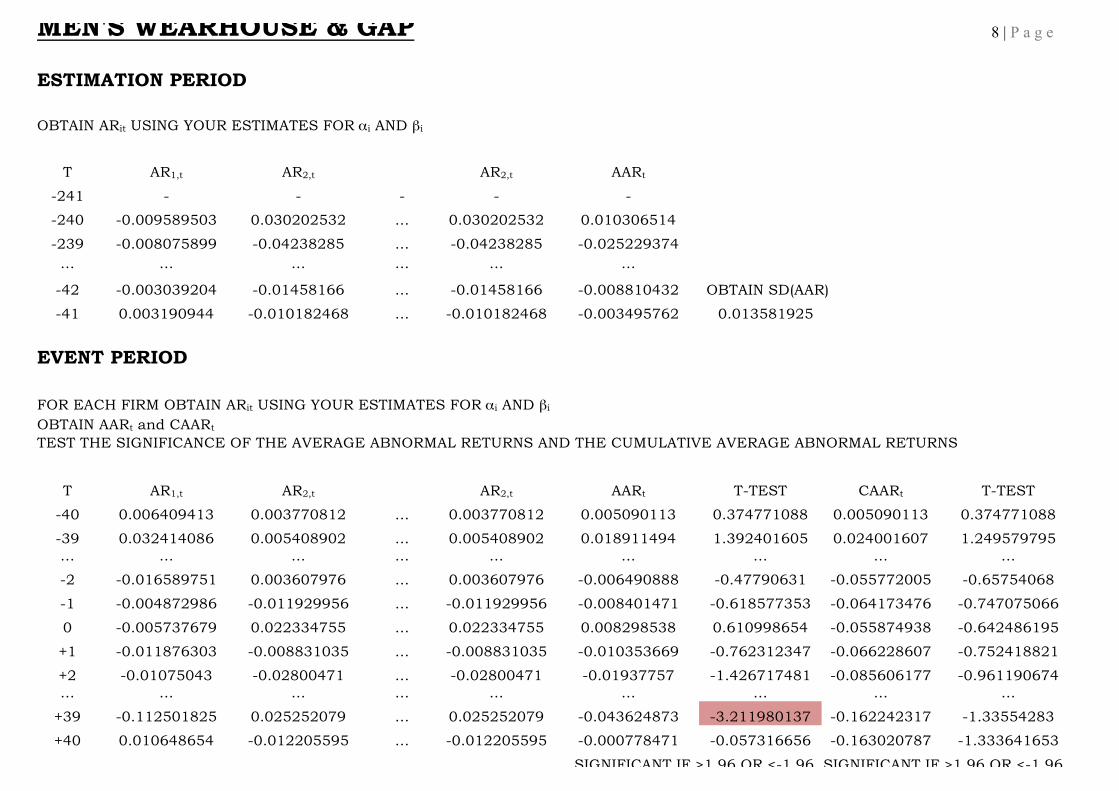
MEN'S WEARHOUSE & GAP 8 | P a g e
ESTIMATION PERIOD
OBTAIN ARit USING YOUR ESTIMATES FOR αi AND βi
T AR1,t AR2,t AR2,t AARt
-241 - - - - -
-240 -0.009589503 0.030202532 … 0.030202532 0.010306514
-239 -0.008075899 -0.04238285 … -0.04238285 -0.025229374 … … … … … …
-42 -0.003039204 -0.01458166 … -0.01458166 -0.008810432 OBTAIN SD(AAR)
-41 0.003190944 -0.010182468 … -0.010182468 -0.003495762 0.013581925
EVENT PERIOD
FOR EACH FIRM OBTAIN ARit USING YOUR ESTIMATES FOR αi AND βi OBTAIN AARt and CAARt TEST THE SIGNIFICANCE OF THE AVERAGE ABNORMAL RETURNS AND THE CUMULATIVE AVERAGE ABNORMAL RETURNS
T AR1,t AR2,t AR2,t AARt T-TEST CAARt T-TEST
-40 0.006409413 0.003770812 … 0.003770812 0.005090113 0.374771088 0.005090113 0.374771088
-39 0.032414086 0.005408902 … 0.005408902 0.018911494 1.392401605 0.024001607 1.249579795 … … … … … … … … …
-2 -0.016589751 0.003607976 … 0.003607976 -0.006490888 -0.47790631 -0.055772005 -0.65754068
-1 -0.004872986 -0.011929956 … -0.011929956 -0.008401471 -0.618577353 -0.064173476 -0.747075066
0 -0.005737679 0.022334755 … 0.022334755 0.008298538 0.610998654 -0.055874938 -0.642486195
+1 -0.011876303 -0.008831035 … -0.008831035 -0.010353669 -0.762312347 -0.066228607 -0.752418821
+2 -0.01075043 -0.02800471 … -0.02800471 -0.01937757 -1.426717481 -0.085606177 -0.961190674 … … … … … … … … …
+39 -0.112501825 0.025252079 … 0.025252079 -0.043624873 -3.211980137 -0.162242317 -1.33554283
+40 0.010648654 -0.012205595 … -0.012205595 -0.000778471 -0.057316656 -0.163020787 -1.333641653
SIGNIFICANT IF >1.96 OR <-1.96 SIGNIFICANT IF >1.96 OR <-1.96
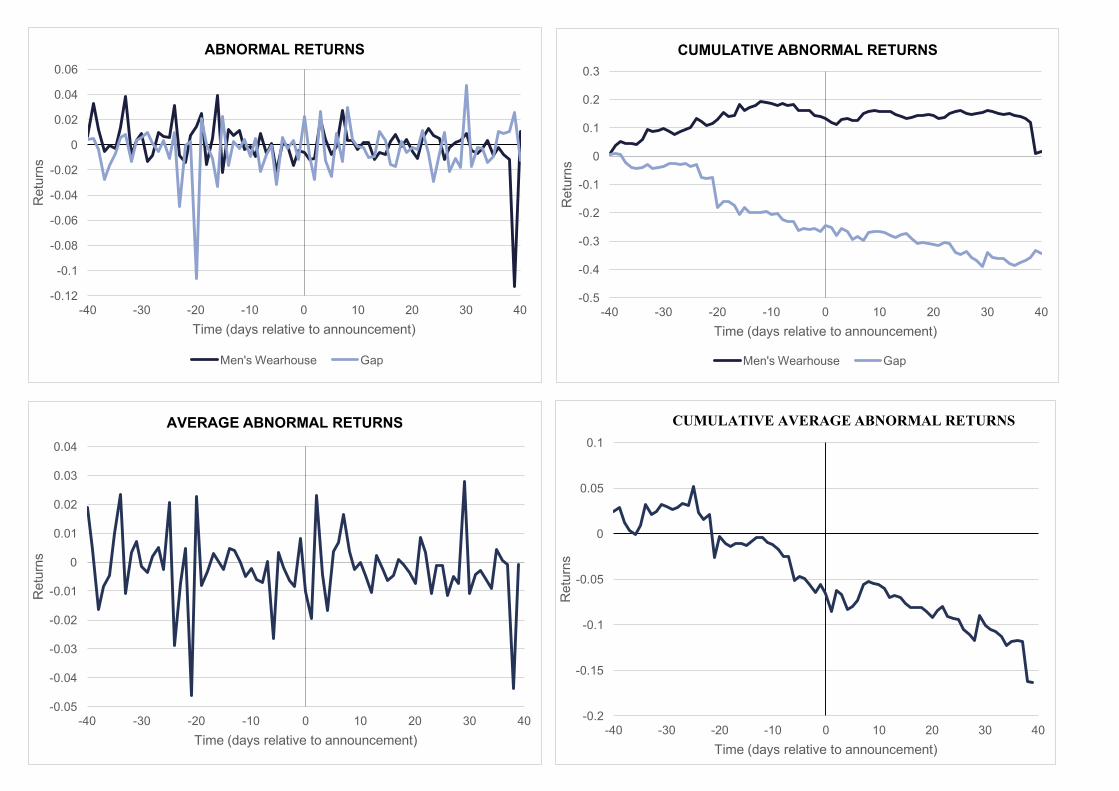
RESULTS The pattern of abnormal returns for both Men’s Wearhouse and Gap appear consistent before and after the
acquisition announcement on the graph but we noticed that for both stocks, their AR increased 2 days before
the acquisition announcement and decreased in the 2 days after. Men’s Wearhouse saw abnormal returns
of -1.66% on day -2, increasing to -0.57% on the announcement day and then decreasing to -1.08% in the
following 2 days. Gap’s AR increased from 0.36% to 2.23% and then fell to -2.8%.
A possible explanation for this would be that the market viewed the acquisitions as unprofitable but
considering that the stock prices had been fluctuating in a similar manner, this is not justified. Instead, the
shares could just be in a liquid industry with high trading volumes and volatility.
It is unlikely that Gap’s 2.2% AR will be sufficient to offset transaction and financing costs and yield trading
profit. Also, these results were insignificant under the t-test. Men’s Wearhouse only had 1 day of significant
abnormal loss while Gap had two – these focal points occurred more than 20 days away from the
announcement date, leading us to assume little or no relationship to the announcement. Therefore, we find
no evidence from the AR results to reject our null hypothesis and the semi-strong market efficiency theory.
When looking at cumulative results for each company, we observe a sideways drift with a sudden fall at the
end for Men’s Wearhouse but a downward trend that slowed down after the announcement for Gap.
Men’s Wearhouse’s CAR fluctuated around 15% until a sudden drop from 12.0% to 0.74% on day 39. We
observed a fall of 1 percentage point in its CAR 2 days prior to 13.3% on the day of the announcement and
a further 2 percentage points in 2 days after. The sudden drop was, however, not regarded as a significant
result by the t-test with a value of 0.038. Nonetheless, since the deal was a market surprise and accurate
valuation of synergies takes time, a time lag would not be surprising if abnormal returns could be earned.
Gap’s CAR fell 24 percentage points from 0.377% on day -40 to -24.4% upon the announcement but fell
only a further 10 percentage points after that. 17 of the days prior to and all the days from the announcement
day had significant CAR results under the t-test. Of these, only day -20 and +30 had significant AR.
We deduce that although there were a large number of days with significant CAR, these occurrences are
not linked to our acquisition announcement but the slow-down of the declining CAR could be due to the
market reacting to a favourable acquisition and attempting to reverse the bad revenue projections received
before. Our facts and figures continue to present no evidence to reject our null hypothesis but in Gap’s case,
oppose the semi-strong market efficiency theory because the market did not seem to accurately adjust to
remove abnormal returns for Gap’s stock. 9 | P a g e
The CAAR had a noticeable downward trend over the whole period with a fall of around 5 percentage points
on day -21 pushing the CAAR into the negative territory for the rest of the event period. Despite the graphical
significance, our t-test downplays it with a t-test statistic of 0.335. The AAR of -4.62% on the following day
however is regarded as highly significant with a t-test statistic of -3.40. This indicates that the market is
efficient in the weak form because reaction upon knowledge of a negative CAAR was not instantaneous.
There were only 4 significant AAR results and no significant CAAR results. These 4 results were more than
20 days away from the announcement date so we have discounted their significance. The CAAR t-test
statistic remained consistently close to 0 and its closest to a critical value is -1.33 for the period (-40,40). At
this point, the AAR increased over 4 percentage points from -4.36%. This is probably greatly influenced by
the movement of Men’s Wearhouse’s CAR so a similar argument is presented. Having said that, we once
again fail to uncover any concrete evidence to reject our null hypothesis and the semi-strong market
efficiency theory.
CONCLUSION Based on the event study we carried out to test our hypothesis which states that an acquisition
announcement will not yield positive abnormal returns for bidding shareholders in the short term and the
market is efficient in the semi-strong form, we conclude that we have found insufficient evidence to reject
the null hypothesis and the semi-strong market efficiency theory. This is similar to the findings of other
papers including Franks et al (1991), Mulherin & Boone (2000), and Kuiper et al (2003). However, we remain
sceptical about the market’s ability to remain efficient in the long term especially since we already found
possible gaps in the theory in the short run. Our study has a number of limitations including that of the event
study methodology and the absence of further research into the other factors for stock movements such as
the possibility of insider trading. Another caveat to be mentioned is that an M&A deal has long term
implications so a longer event period may provide more accurate results.
REFERENCES
Craig Mackinlay, A. (1997). Event Studies in Economics and Finance. http://staff.ui.ac.id/system/files/users/ratnadewi_aaa/material/mackinlayp.pdf
Flugt, C. (2009). Shareholder wealth effects of mergers and acquisitions: An empirical investigation of short-term performance in the European market. http://pure.au.dk/portal/files/8464/217003.pdf
Reddy, K. Abidin, S. Chen,S . (2012). Do M&As Create value? The Pre-and-Post M&A Performance of Chinese and Indian Companies. http://www.mfsociety.org/modules/modDashboard/uploadFiles/conferences/MC20~67~p17e1fsvt91cb3e2
2p3qbml1pj41.pdf
10 | P a g e