maat 4 | mobility analysis of amputees
TRANSCRIPT

Full Terms & Conditions of access and use can be found athttps://www.tandfonline.com/action/journalInformation?journalCode=iidt20
Disability and Rehabilitation: Assistive Technology
ISSN: 1748-3107 (Print) 1748-3115 (Online) Journal homepage: https://www.tandfonline.com/loi/iidt20
Mobility Analysis of AmpuTees (MAAT 4):Classification tree analysis for probability of lowerlimb prosthesis user functional potential
Shane R. Wurdeman, Phillip M. Stevens & James H. Campbell
To cite this article: Shane R. Wurdeman, Phillip M. Stevens & James H. Campbell (2019): MobilityAnalysis of AmpuTees (MAAT 4): Classification tree analysis for probability of lower limb prosthesisuser functional potential, Disability and Rehabilitation: Assistive Technology
To link to this article: https://doi.org/10.1080/17483107.2018.1555290
© 2019 The Author(s). Published by InformaUK Limited, trading as Taylor & FrancisGroup
Published online: 11 Feb 2019.
Submit your article to this journal
View Crossmark data

Mobility Analysis of AmpuTees (MAAT 4): Classification tree analysis forprobability of lower limb prosthesis user functional potential
Shane R. Wurdemana,b, Phillip M. Stevensa,c and James H. Campbella
aDepartment of Clinical and Scientific Affairs, Hanger Clinic, Austin, TX, USA; bDepartment of Biomechanics, University of Nebraska at Omaha,Omaha, NE, USA; cSchool of Medicine, University of Utah, Salt Lake City, UT, USA
ABSTRACTPurpose: To develop a predictive model to inform the probability of lower limb prosthesis users’ func-tional potential for ambulation.Materials and Methods: A retrospective analysis of a database of outcomes for 2770 lower limb pros-thesis users was used to inform a classification and regression tree analysis. Gender, age, height, weight,body mass index adjusted for amputation, amputation level, cause of amputation, comorbid health statusand functional mobility score [Prosthetic Limb Users Survey of Mobility (PLUS-MTM)] were entered aspotential predictive variables. Patient K-Level was used to assign dependent variable status as unlimitedcommunity ambulator (i.e., K3 or K4) or limited community/household ambulator (i.e., K1 or K2). The clas-sification tree was initially trained from 20% of the sample and subsequently tested with the remain-ing sample.Results: A classification tree was successfully developed, able to accurately classify 87.4% of individualswithin the model’s training group (standard error 1.4%), and 81.6% within the model’s testing group(standard error 0.82%). Age, PLUS-MTM T-score, cause of amputation and body weight were retainedwithin the tree logic.Conclusions: The resultant classification tree has the ability to provide members of the clinical care teamwith predictive probabilities of a patient’s functional potential to help assist care decisions.
� IMPLICATIONS FOR REHABILITATION� Classification and regression tree analysis is a simple analytical tool that can be used to provide sim-
ple predictive models for patients with a lower limb prosthesis.� The resultant classification tree had an 81.6% (standard error 0.82%) accuracy predicting functional
potential as an unlimited community ambulator (i.e., K3 or K4) or limited community/ householdambulator (i.e., K1 or K2) in an unknown group of 2770 lower limb prosthesis users.
� The resultant classification tree can assist with the rehabilitation team’s care planning providing prob-abilities of functional potential for the lower limb prosthesis user.
ARTICLE HISTORYReceived 10 July 2018Accepted 29 November 2018
KEYWORDSMobility; outcomes;K-level; ambulator
Introduction
Lower limb prosthetic rehabilitation within the United States cur-rently relies on the Medicare Functional Classification Level sys-tem to provide reimbursement eligibility guidelines for prostheses[1]. Although the Medicare Functional Classification Level, or com-monly referred to K-level classification, was originally introducedby the United States Health Care Financing Administration in1995 to provide coverage guidelines for Medicare beneficiarieswith lower limb amputation, it has since been widely adopted byprivate payers [2,3]. Subsequently, a patient’s K-level assignmentoften has a large impact on the patient’s prosthesis prescription[2,4,5], with some commentary going so far as to note “K-leveldesignation is important because it is the driving factor in thedecision on what prosthetic device to provide” [6].
The K-levels consist of five classifications of ambulatory func-tion for individuals with a lower limb amputation with a primary
division occurring between K2 and K3. Patients that are K3 andabove are classified as unlimited community ambulators with aplan of care that aligns with a more active individual. In order tomeet the demands of the unlimited community ambulator, thesepatients have increased access to advanced technologies such ashydraulic/pneumatic knee joints, microprocessor controlled com-ponents, and feet with higher elastic energy return due to materi-als such as carbon fibre [1,2,6].
Within the United States, the overseeing physician determinesthe status or potential for a patient to be an unlimited commu-nity ambulator or a limited community ambulator. The K-level is adetermination from the prescribing physician utilizing their clinicaljudgment. As part of that clinical judgment, the prescribing phys-ician often depends on members of the rehabilitation team suchas therapists and prosthetists for increased clinical insight [5]. Inworking through the determination process, clinicians may usevarious factors such as age, cause and level of amputation, body
CONTACT Shane R. Wurdeman [email protected] Department of Clinical and Scientific Affairs, Hanger Clinic, 10910 Domain Dr., Ste. 300, Austin, TX78758, USA� 2019 The Author(s). Published by Informa UK Limited, trading as Taylor & Francis GroupThis is an Open Access article distributed under the terms of the Creative Commons Attribution-NonCommercial-NoDerivatives License (http://creativecommons.org/licenses/by-nc-nd/4.0/),which permits non-commercial re-use, distribution, and reproduction in any medium, provided the original work is properly cited, and is not altered, transformed, or built upon inany way.
DISABILITY AND REHABILITATION: ASSISTIVE TECHNOLOGYhttps://doi.org/10.1080/17483107.2018.1555290
mass index and comorbid health as well as assessment and out-come instruments such as the Amputee Mobility Predictor[2,3,5,7]. With respect to K-levels, there is limited evidence tomatch such factors with care planning [2,3]. Increased guidancecould better assist the design of care plans based on the expecta-tions that a given individual will realize unlimited communityambulation or limited community/household ambulation.
In other arenas of healthcare, improved clinical decision-mak-ing processes are becoming possible through the use of “big”data. The increase in computing power and statistical insights hasprovided the ability to synthesize “big” data into complex predict-ive models to inform evidence-based decision trees. Despiteincreased utility and growing use of decision trees across health-care, such predictive models have not been implemented withinprosthetic rehabilitation. This is likely due to the inherent needfor large datasets and the limited availability of such data withinprosthetic care. The lack of implementation of such predictivemodels in prosthetic rehabilitation hinders evidence-based deci-sion making. Without studies developing and testing predictivemodels, it is unclear if such decision trees could effectively deter-mine proper care pathways more effectively than random deci-sion selection.
Thus, the purpose of this study was to develop a classification-based decision tree for patients with a lower limb prosthesis as ameans to examine the applicability for future applications of pre-dictive decision trees in the field of prosthetic rehabilitation. Thespecific goal was the development of a model that effectivelyinforms the care pathway by providing the probability of apatient being a limited community or household ambulator (i.e.,K2 or below within the K-level classification) or an unlimited com-munity ambulator (i.e., K3 or above), henceforth labelled as thepatient’s functional potential. It was hypothesized that the endingnodes within the decision tree would provide probabilities forfunctional potential determination greater than randomdetermination.
Methods
Study design
We performed an analysis based on review of a database contain-ing patient information and outcomes from April 2016 through
March 2018. Outcomes and patient information within the data-base were collected from multiple clinics across the United Statesspanning regions including Northwest, Southwest, RockyMountains, Midwest, Southeast, Northeast and East. Cases wereexcluded from the model if there were any missing pre-dictor variables.
This database review was approved and deemed exempt frompatient consent by Western Investigational Review Board(Protocol #20170059).
Classification and regression tree analysis
While traditional predictive models such as logistic and linearregression are feasible, these models can have issues with theirimplementation and ultimately interpretation by healthcare pro-viders with perceived “black box” results [8,9]. Classification andregression tree analysis (CART) is a technique that is gainingpopularity within healthcare due to its ease of interpretation andimplementation [8,10–15] Common examples can be noted forguidelines on paediatric head trauma [16–18] and paediatricabdominal injuries [19–21]. Specifically, CART analysis starts with alarge group of individuals, and then makes a series of binarynode splits based on some criterion that improves group purity inorder to effectively classify individuals. The end result is an easilyinterpretable logic tree with a series of splits (i.e., branches) lead-ing to end nodes (i.e., leaves) represented in an illustrated figureformat. Each branch, and in turn, each leaf, yields a classificationprobability which ultimately drives the end decision. Due to thesequential binary splitting process, in order to allow for multiplebranches and leaves, the initial starting sample must be substan-tial enough to allow multiple splits.
In order to illustrate CART analysis, consider a classic probabil-ity example. A six-sided die holds the probability of 1/6, or16.67%, of rolling a “6”. If one were to roll the die 100 times, a“6” would likely come up 16 times (16%), but might only comeup 11 times, or 11%, due to some associated error. This errorwould decrease with increased sampling. If, however, one was toroll the die enough times and continue to note that a “6” appears90% of the time, then it would be possible to conclude that it isa trick die causing the probability of a “6” to be much higher.Consider though if the characteristic that made it a trick die wasan embedded magnet causing a magnetic force that flipped thedie to a “6”. If the person were to roll the die 1000 times on awood board and 1000 times on a metal surface, a “6” would thenappear 1067 times (167 plus 900 on wood and metal surfacesrespectfully). Looking at the output, the conclusion would be aprobability of 0.5335 for a “6” to appear. Thus, the individualwould be left to believe the chances of rolling a “6” is practicallyequivalent to a coin toss. But, if more information on the mag-netic die was provided, very quickly the probability of a “6” canbe adjusted by assessing the surface on which the die willbe rolled.
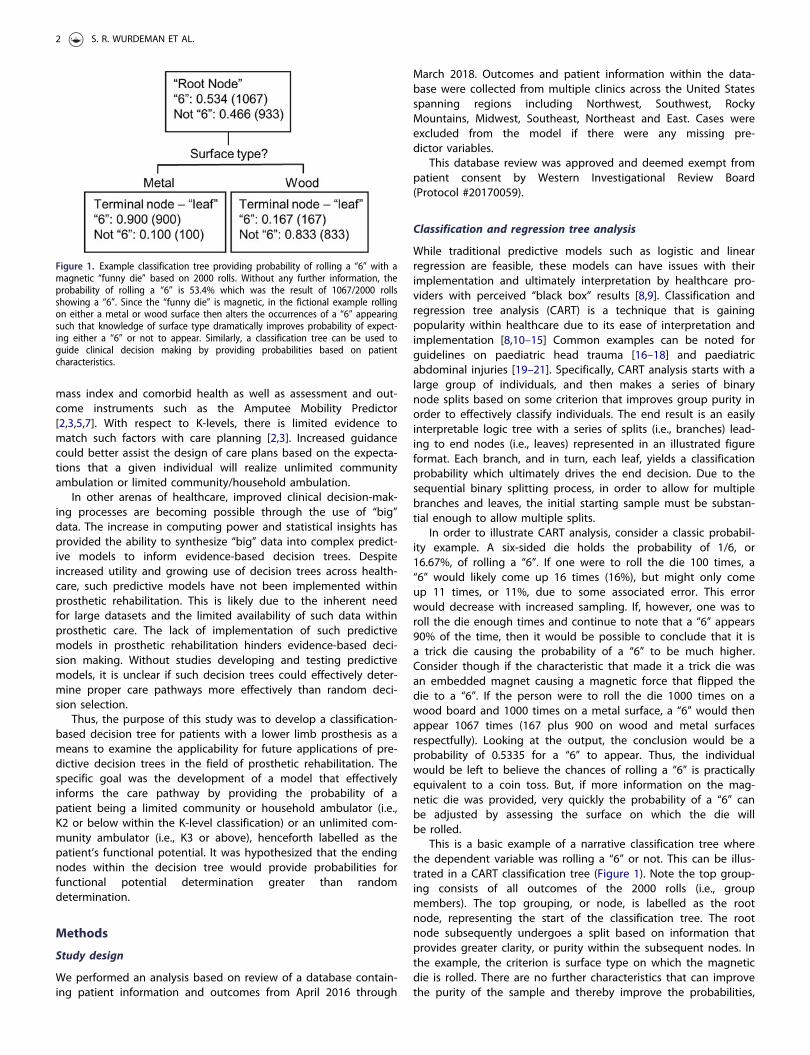
This is a basic example of a narrative classification tree wherethe dependent variable was rolling a “6” or not. This can be illus-trated in a CART classification tree (Figure 1). Note the top group-ing consists of all outcomes of the 2000 rolls (i.e., groupmembers). The top grouping, or node, is labelled as the rootnode, representing the start of the classification tree. The rootnode subsequently undergoes a split based on information thatprovides greater clarity, or purity within the subsequent nodes. Inthe example, the criterion is surface type on which the magneticdie is rolled. There are no further characteristics that can improvethe purity of the sample and thereby improve the probabilities,
Figure 1. Example classification tree providing probability of rolling a “6” with amagnetic “funny die” based on 2000 rolls. Without any further information, theprobability of rolling a “6” is 53.4% which was the result of 1067/2000 rollsshowing a “6”. Since the “funny die” is magnetic, in the fictional example rollingon either a metal or wood surface then alters the occurrences of a “6” appearingsuch that knowledge of surface type dramatically improves probability of expect-ing either a “6” or not to appear. Similarly, a classification tree can be used toguide clinical decision making by providing probabilities based on patientcharacteristics.
2 S. R. WURDEMAN ET AL.

and thus the classification tree is complete with two terminalnodes, or leaves. Had additional characteristics been identified, itmay have been possible to further split the second layer nodes.In that case, the nodes that split would be labelled as branchesand the third layer nodes would become the leaves.
It is possible that there may have been other characteristics orfactors that were also recorded that would not provide anyimproved predictive ability, such as which hand was used to rollthe die or eyes open/closed when rolling the die. A CART analysisshould assess all recorded factors at each node to identify thosethat best improve dependent variable prediction. Since the ana-lysis is reperformed on the groups at each node, each nodebecomes increasingly pure. This instills CART with an additionalbenefit over traditional regression analysis by reducing error andbeing able to explain higher variance at each node [8,22].
Importantly, during the CART analysis at each node, the modelmust determine whether a factor is important through the use ofsome sort of purity criterion. While there are several methods, themost common for classification trees is the Gini impurity index[8,11,12,16,19,22]. The Gini impurity index determines the optimalmeans for splitting the members of a node by maximizing thedecrease in impurity. Splitting the membership into two groupsmakes it possible to then look at the “purity” on each side of thesplit. In our example with the die, choosing the factor of surfaceon which the die is rolled resulted in a split of 1000 and 1000rolls. On the metal surface, the “purity” is:
PM ¼XC
i
xiC
1� xiC
� �¼ 900
10001� 900
1000
� �
þ 1001000
1� 1001000
� �¼ 0:18 (1)
and the wood surface is:
PW ¼XCi
xiC
1� xiC
� �¼ 167
10001� 167
1000
� �
þ 8331000
1� 8331000
� �¼ 0:28 (2)
The average then is 0.23. If the same calculation were appliedto another factor such as rolling the die with right or left hand,now the Gini purity calculations are (assuming there was noimpact and this factor yielded a 0.5 probability):
PRight ¼XC
i
xiC
1� xiC
� �¼ 500
10001� 500
1000
� �
þ 5001000
1� 5001000
� �¼ 0:5 (3)
PLeft ¼XC
i
xiC
1� xiC
� �¼ 500
10001� 500
1000
� �
þ 5001000
1� 5001000
� �¼ 0:5 (4)
The average for this factor is 0.5, which is a higher impurity. Thus,the factor for surface type would be a better choice to maximizethe decrease in impurity. If the independent factors were continu-ous or interval rather than dichotomous variables, the same pro-cess is implemented but more “cut points” are tested goingthrough the entire scale.
Importantly, it is possible to split members of nodes continu-ously until there is only a single member within each terminalnode. This, however, comes with the trade-off of increased classifi-cation error when implementing the model to predict classifica-tion on an unknown sample. As a result, limits must be put onthe minimum number of members in a node before it can beallowed to split into subsequent nodes, and minimum number ofmembers allowed in a leaf should also be set.
Lastly, a classification tree should be tested for repeatability.This process is done by partitioning the dataset into multipledatasets so that a large dataset can be used to “train” the classifi-cation tree, or build the model, and smaller datasets can be usedto test the accuracy of predicting the correct classification of anunknown group. For the die example, perhaps the 2000 rolls usedto develop the classification tree were part of a larger set of 5000rolls. Then one might take three additional datasets of 1000 rollsto confirm classification accuracy for the model. Based on theresults, factors such as node limits can be adjusted to yield thehighest classification accuracy for the targeted category.Importantly, the improved classification accuracy of one categorywill sacrifice the accuracy of the other category so it is criticalthat the analysis yield to clinical oversight.
Predictor variables
Variables included within the CART analysis model for individualswith lower limb amputation included gender, height, weight,cause of amputation, history of smoking, body mass index(adjusted for limb loss [23,24]), comorbid health status and age.Additionally, three variables from patient-reported outcome meas-ures were included, the satisfaction and quality of life measuresfrom the Prosthesis Evaluation Questionnaire Well-Being subsec-tion [25,26] and the Prosthetic Limb Users Survey of Mobility T-Score (PLUS-MTM) [27–29]. For comorbid health, the FunctionalComorbidity Index [30] was entered as an interval variable. Levelof amputation was entered as a categorical variable separatinginto primary levels of amputation between hip disarticulation andpartial foot amputation. Bilateral amputations were grouped andcoded as a single group.
The demographic variables are reviewed with patients as rou-tine standard of care. The PLUS-MTM is a patient-reported out-comes questionnaire, administered via the 12 question format[31]. The PLUS-MTM is a validated, reliable instrument for assessingfunctional mobility in individuals with a lower limb prosthesis[28]. As it is not valid for those who have not received a pros-thesis, individuals that had assessments for their initial prosthesiswere thus excluded. The Prosthesis Evaluation Questionnaire isalso a patient-reported outcomes questionnaire [25]. In its entir-ety, it is an exhaustive review of multiple constructs with regardsto the use of an external prosthesis with each of its multiple sub-sections also valid for administering separately. For the purposesof the participating clinics, only the Well-Being subsection isadministered, comprising of questions that ask individuals toreport their health satisfaction and quality of life. Although origin-ally administered as a continuous visual analogue scale, it hassince been administered in the form of a discrete interval scalesuch as is currently the case utilizing a 1–10 response scale toimprove clinical feasibility [26,32].
Data reduction and analysis
Data was examined prior to analysis to remove multiple entriesusing only the most recent records and to eliminate records
CART AMPUTEE FUNCTIONAL POTENTIAL 3

where data had not been completed yet. Categorical variableswere coded. Cause of amputation was reduced to diabetes/vascu-lar disease, trauma, infection without diabetes, cancer, congenitaland other. The dependent variable of functional potential wascoded based on the patient’s assigned K-level, with K1 and K2categorized as limited community/household ambulators, and K3and K4 individuals categorized as unlimited community ambula-tors. The decision was made to design a model to inform thesebroad classifications (rather than K-levels) for three reasons: 1)such a model will have more universal application extendingbeyond the United States payer system, 2) CART methodology
lends itself better to binary dependent variables and 3) such amodel is better suited to inform rehabilitation potential ratherthan payer classification but can simultaneously serve to assistwith K-level determination.
A CART analysis was implemented through the MatlabVR func-tion ‘fitctree’ with modifications to allow optimization of the tree.Gini impurity is the most commonly used method for node splittingin CART analysis and was used for the current analysis [22]. A robustsample size of 20% of the dataset was utilized to train the model.The remaining dataset was used to test the model. Testing themodel allows for risk assessment (or misclassification analysis) andstandard error assessment of the model. The branch and leaf sizewere run through an optimization procedure that yielded greatestmean classification of patients with lowest associated testing accur-acy for those that were limited community/household ambulators.The decision was made to optimize for limited community/house-hold ambulators a priori due to noted imbalance of subjects classi-fied as limited community/household ambulators which made itmore difficult to accurately classify such individuals.
Statistical analysis
To test the hypothesis and examine the ability of each nodewithin the model to inform the functional potential determinationof a patient beyond random selection, each branch and leaf nodewas subsequently tested utilizing a one-sided non-parametric rankorder test. Essentially, each node of the classification tree pro-vided an associated probability for the classifications of functionalpotential. Using the premise that any significant classificationshould provide a better probability than random selection, foreach of the test cases, 19 random assignments of functionalpotential were generated through MatlabVR random number gen-erator. This yielded 20 total assignments (19 random plus theCART results). The subsequent classification error was determinedfor these 19 random assignments and compared to the classifica-tion error from the assigned node within the CART analysis. Therank order of the classification error associated with each nodewas then used to determine significance at p � 0.05, noting thata ranking of 1 or 20 is consistent with the top or bottom 5% [33].
Results
The initial data extraction returned 9773 cases, which yielded 2770cases with full data sets to be included (Table 1; flowchart Figure 2).
Table 1. Subject demographics according to group.
Training Group (n¼ 554) Testing Group (n¼ 2216)
Gender 149 F 576 FAge (years) 57.0 (14.7) 57.2 (14.5)Height (cm) 174.4 (11.4) 174.6 (11.2)Mass (kg) 89.2 (23.5) 89.9 (23.1)Body Mass Index (kg/m2) 31.5 (7.1) 31.7 (7.2)Amputation LevelBelow-knee 355 1454Above-knee 144 512Bilateral 55 250
Cause of AmputationPVD/ diabetes 228 1098Trauma 174 616Infection (without diabetes) 59 186Cancer/Tumour 26 90Congenital 25 66Other 42 160
Functional Comorbidity Index 2.51 (2.16) 2.33 (1.96)PLUS-MTM T-Score 47.1 (12.2) 46.9 (11.7)Unlimited Community Ambulators 431 1756
Mean (SD). PVD: peripheral vascular disease; PLUS-MTM: Prosthetic Limb Users Survey of MobilityTM.
Figure 2. Eligibility flow chart, from 9773 outcomes entries, 2770 met inclusioncriteria and were utilized for building and testing the classification and regressiontree analysis model. FCI: Functional Comorbidity Index; PLUS-MTM: ProstheticLimb Users Survey of MobilityTM.
4 S. R. WURDEMAN ET AL.

This resulted in a training sample size of 554 patients, and test sam-ple size of 2216. The low return of full data sets was not unexpectedgiven the inclusion criteria for complete data and certain factors(e.g., comorbid health) are only reviewed at evaluation type appoint-ments and not necessarily at follow-ups or adjustments.
Classification tree
The classification tree ultimately ended with 7 branches and 9leaves (Figure 3). Among the 16 branch and leaf nodes, 12 testedsignificant compared to the random class assignment (Figure 3).The four non-significant nodes included three terminal leaves, all
of which however had branch nodes that were significant at p� 0.05.
The optimal size for each leaf and branch was 13 and 30. ThePLUS-MTM T-Score, age, cause of amputation and weight wereultimately included as decision factors within the classificationtree. Overall correct classification of the tree for the original train-ing sample was 87.4%, with a risk of 12.6% and standard error1.4% (Table 2). Among the training sample, the correct classifica-tion for limited community/household ambulators was 77.2% and90.3% for unlimited community ambulators. For the testing sam-ples, the overall correct classification was 81.6% (risk 18.4%, stand-ard error 0.82%). Among the training sample, the correctclassification for limited community/household ambulators for thetesting samples was 68.7% and 85.0% for unlimited communityambulators (Table 2).
Discussion
The goal of this study was to effectively develop a classificationtree that could provide probabilities associated with identifyingindividuals with a lower limb prosthesis as either limited commu-nity/household ambulators or unlimited community ambulators tohelp inform prosthetic rehabilitation plans of care. The goal wassuccessfully accomplished, developing a classification tree thatwas able to correctly classify 87.4% of individuals in the trainingsample and then 81.6% of the subsequent testing samples. It washypothesized that the nodes within the classification tree wouldinform the functional potential determination with greater prob-ability than random selection. This hypothesis was largely sup-ported with 12 out of 16 nodes ultimately providing the ability todetermine appropriate functional potential beyond ran-dom selection.
Model strengths
The use of a CART analysis and subsequent production of a classi-fication tree for the care of individuals with lower limb prosthesesis unique. There is growing popularity and use of classificationtrees across healthcare (e.g., see references [8,10–15]). The classifi-cation tree developed in this analysis provides probability fordetermining a patient’s functional potential. In the United Statespayer system, this has the benefit of assisting with determinationof a patient as either K2 or below (i.e., limited community/house-hold ambulator), or K3 and above (unlimited community ambula-tor). For example, if a clinician has a patient who reports aPLUS-MTM T-Score of 49.5, and is aged 75, and amputation due todiabetes, the patient has a 92.9% probability of being an unlim-ited community ambulator (Figure 3, Node 13). Additionally, theclinician can put together a plan of care to maintain the patient’smobility level knowing that if the patient’s mobility drops downbelow 49.5 the probability of being an unlimited community
Figure 3. Classification tree developed and tested based on data from 2770patients. The overall correct classification rate was 87.4%, with a risk of 12.6%and standard error 1.4% when training the model. Correct classification for lim-ited community/household ambulators was 77.2% and 90.3% for unlimited com-munity ambulators. Each node displays class probability and membership inparentheses for training sample. U: unlimited community ambulator, in MedicareFunctional Classification System would be K3 or K4; L: limited community/house-hold ambulator, in Medicare Functional Classification System would be K2 or K1.�node classification significantly different than random assignment process, clini-cians should obtain more information for patients not ending in these nodeswhen making functional potential determination.
Table 2. Classification table for training and testing groups.
Group Observed
Predicted
L U Percent correct
Training L 95 28 77.2%U 42 389 90.3%Overall Percentage 24.7% 75.3% 87.4%
Testing L 316 144 68.7%U 263 2493 85.0%Overall Percentage 26.1% 73.9% 81.6%
L: limited community/household ambulator; U: unlimited community ambulator.
CART AMPUTEE FUNCTIONAL POTENTIAL 5

ambulator drops as well, thus informing proactive physical ther-apy or prosthetic componentry that can drive improved mobility.
Model weaknesses
As with any model, the strength of the model is predicated onthe data used to inform the model. In this case, while the trainingsample size was adequate, far exceeding those used in many pre-dictive models, the model’s accuracy could likely be improvedwith a richer and more diverse dataset. Specifically, the model didnot include any physical performance measures despite the useof these in some clinical practices to help inform functionalpotential [2,3,5,7]. The Amputee Mobility Predictor, in particular, isa physical performance measure that was designed to informfunctional potential and would thus be expected to improve themodel’s accuracy and predictive ability, and indeed has been toan extent tried to be utilized within predictive modelling [2,3].Similar to our results, Dillon et al. were able to predict K2 and K3functional potential at approximately 80% accuracy. However, theclinical implementation of physical performance measures is morechallenging with time and space constraints and subsequently,the current study’s classification tree arguably has greater clinicalutility. In light of Dillon et al.’s findings, it would seem the add-ition of physical performance measures in conjunction withpatient report outcomes for future predictive models warrants fur-ther investigation.
In clinical applications, it is also important to understand theimportance of non-significant nodes. In particular, if a patient fallson a non-significant node (i.e., nodes 8, 15 or 17), then it wouldserve prudent to gather more information in support of functionalpotential determination such as perhaps an Amputee MobilityPredictor. Additionally, it is always important to recognize deci-sion trees as population-based guidance and there may be spe-cific cases that physicians and other healthcare providers feel donot align with the decision tree and in such instances, furtherinformation should be collected to support reasoning individualshould be considered an exception.
Study limitations
A limitation of the study is that the model was built retrospect-ively which resulted in limited ability to implement specific meas-ures for the purpose of building the classification model. Aretrospective approach is also limiting as it prevents inputtingdata such as the Amputee Mobility Predictor. This is due to thefact that the Amputee Mobility Predictor provides functionalpotential decision guidance thus creating bias if the same individ-ual administers the test and makes functional potential determin-ation. The PLUS-MTM is a new instrument that has not beenimplemented or advertised for guidance of functional potentialwhich allows it to be applied within this study in the retrospectivemanner.
Additionally, it should be noted that the results from CARTanalysis do not imply factors that impact a patient’s mobility orfunctional potential. Specifically, the results are descriptors thatcarried the most information within the analysis towards classifica-tion. However, there are factors that impact a patient’s functionalpotential more directly on the principle of a cause and effect. Thesimplest example would be a patient’s desire to ambulate. Theprobability of a patient achieving unlimited community ambulatorstatus if the patient does not wish to leave their home is probably100%. It is also important to recognize that some variables mayhave never reached significance to be used as a splitting criterion
due to lack of representation within the population, or inability toprovide the highest level of information at any single node. Inother words, consider Functional Comorbidity Index where it hasbeen reported that individuals with increased FunctionalComorbidity Index had reduced mobility [34], yet this failed to bea factor within the current model. Functional Comorbidity Indexmay have just provided the second most information and thuswas not utilized within the current decision tree.
Clinical application
Despite the limitations and weaknesses, the classification tree rep-resents a start to working towards better informed decision mak-ing for the care team. There will be certain patient demographicsthat will require further information and justification to help guidefunctional potential decision making. For example, if a patientscores a 50.0 on the PLUS-M, is age 70, weighs 100 kg, and causeof amputation is diabetes, then the care team is aware that thepatient’s probability of being an unlimited community ambulatoris 92.9% (Figure 3, node 11). Furthermore, the team can planahead knowing that if the patient’s mobility on the PLUS-M drops,the patient’s probability of being an unlimited community ambu-lator drops to possibly less than 50% (Figure 3, node 17).Additionally, as the patient ages, the probability would furtherdecline (Figure 3, node 15). In both cases, the team would wantto do further assessments to fully inform the functional potential.Although the classification tree provides a probability of 57.1%that the person will be a limited community/household ambulator(Figure 3, node 17), without significance from a random assign-ment, it should not be considered enough to make a clinical deci-sion and further information and testing is warranted. Intuitively,a probability of 57.1% is not much better than a coin toss, indi-cating that the factors used in this analysis are not enough toinform functional potential for this individual. However, despitethat, knowing how probabilities change with dynamic factorssuch as age, mobility and weight, the care team is now able tobetter plan necessary steps to provide optimal care as these fac-tors change.
Conclusion
Decision trees are commonly used in data mining to create amodel that predicts the value of a target (or dependent variable)based on the values of several inputs (or independent variables).The current study had the intention of developing a classification-based decision tree through CART analysis, to present the basiccharacteristics of decision trees and to examine the applicabilityand possible future applications in the field of prostheticrehabilitation.
A large lower limb prosthetic users database (n = 9773) con-taining patient information and outcomes was utilized to informthe classification tree with the goal of providing the probability ofa patient’s status as an unlimited community ambulator (i.e., K3or K4) or a limited community/household ambulator (i.e., K1 orK2). It was hypothesized that the decision tree could inform thefunctional potential determination beyond random selection.Results overall supported the hypothesis with 12/16 decisionnodes resulting in significance. Ultimately, the classification treewas able to accurately classify 87.4% of individuals within themodel’s training group (standard error 1.4%), and 81.6% withinthe model’s testing group (standard error 0.82%). The resultantclassification tree should be viewed as effectively having the abil-ity to provide members of the clinical care team with probabilities
6 S. R. WURDEMAN ET AL.

of a patient’s functional potential and subsequent ability to helpguide care decisions.
Disclosure statement
The authors report no conflicts of interest.
Funding
Support for this work was partially provided by a Small GrantAward [EB-043016] from the American Orthotics and ProstheticsAssociation.
References
[1] LCD: Lower Limb Prostheses [Internet]: Noridian Medicare;c2013 [cited 2013 Aug 9; accessed 2015 Jul 15]. Availablefrom: https://www.noridianmedicare.com/dme/coverage/docs/lcds/current_lcds/lower_limb_prostheses.htm
[2] Dillon MP, Major MJ, Kaluf B, et al. Predict the medicarefunctional classification level (K-level) using the amputeemobility predictor in people with unilateral transfemoraland transtibial amputation: A pilot study. Prosthet OrthotInt. 2018;42:191–197.
[3] Gailey RS, Roach KE, Applegate EB, et al. The amputeemobility predictor: an instrument to assess determinants ofthe lower-limb amputee’s ability to ambulate. Arch PhysMed Rehabil. 2002;83:613–627.
[4] Hafner BJ, Smith DG. Differences in function and safetybetween Medicare functional classification level-2and -3 transfemoral amputees and influence of pros-thetic knee joint control. J Rehabil Res Dev 2009;46:417–433.
[5] Borrenpohl D, Kaluf B, Major MJ. Survey of U.S. practi-tioners on the validity of the Medicare FunctionalClassification Level system and utility of clinical outcomemeasures for aiding K-level assignment. Arch Phys MedRehabil. 2016;97:1053–1063.
[6] Amputee Coalition of America. Do you know your K-level?In Motion 2013;23(5):24–27.
[7] Sansam K, Neumann V, O’Connor R, et al. Predictingwalking ability following lower limb amputation: a sys-tematic review of the literature. J Rehabil Med. 2009;41:593–603.
[8] Henrard S, Speybroeck N, Hermans C. Classification andregression tree analysis vs. multivariable linear and logisticregression methods as statistical tools for studying haemo-philia. Haemophilia. 2015;21:715–722.
[9] Harrell FE, Jr, Lee KL, Mark DB. Multivariable prognosticmodels: issues in developing models, evaluating assump-tions and adequacy, and measuring and reducing errors.Statist Med. 1996;15:361–387.
[10] Crowe M, O’Sullivan M, Cassetti O, et al. Weight statusand dental problems in early childhood: classificationtree analysis of a national cohort. Dent J (Basel). 2017;5(3):25.
[11] Phakhounthong K, Chaovalit P, Jittamala P, et al. Predictingthe severity of dengue fever in children on admissionbased on clinical features and laboratory indicators: appli-cation of classification tree analysis. BMC Pediatr. 2018;18:109.
[12] Wang Y, Liu Z, Chen S, et al. Identifying at-risk subgroupsfor acute postsurgical pain: a classification tree analysis.Pain Med. 2018;19(11):2283–2295.
[13] Linden A, Yarnold PR. Estimating causal effects for survival(time-to-event) outcomes by combining classification treeanalysis and propensity score weighting. J Eval Clin Pract.2018;24:380–387.
[14] Linden A, Yarnold PR. Identifying causal mechanisms inhealth care interventions using classification tree analysis. JEval Clin Pract. 2018;24:353–361.
[15] Facchinello Y, Richard-Denis A, Beausejour M, et al. The useof classification tree analysis to assess the influence of sur-gical timing on neurological recovery following severe cer-vical traumatic spinal cord injury. Spinal Cord. 2018 ;56:687–694.
[16] Kuppermann N, Holmes JF, Dayan PS, et al.; PediatricEmergency Care Applied Research Network (PECARN).Identification of children at very low risk of clinically-important brain injuries after head trauma: a prospectivecohort study. Lancet. 2009;374:1160–1170.
[17] Kuppermann N, Holmes JF, Dayan PS. Head injury decisionrules in children. Lancet. 2017;390:1487–1488.
[18] Nishijima DK, Yang Z, Urbich M, et al. Cost-effectiveness ofthe PECARN rules in children with minor head trauma. AnnEmerg Med. 2015;65:72–80.e6.
[19] Holmes JF, Lillis K, Monroe D, et al; Pediatric EmergencyCare Applied Research Network (PECARN). Identifyingchildren at very low risk of clinically important bluntabdominal injuries. Ann Emerg Med. 2013;62:107–116.e2.
[20] Halaweish I, Riebe-Rodgers J, Randall A, et al. Compliancewith evidence-based guidelines for computed tomographyof children with head and abdominal trauma. J PediatrSurg. 2018;53:748–751.
[21] Nishijima DK, Yang Z, Clark JA, et al. A cost-effectivenessanalysis comparing a clinical decision rule versus usual careto risk stratify children for intraabdominal injury after blunttorso trauma. Acad Emerg Med. 2013;20:1131–1138.
[22] Breiman L, Friedman J, Olshen R, et al. Classification andregression trees. New York (NY): Chapman and Hall;1994.
[23] Tzamaloukas AH, Patron A, Malhotra D. Body mass indexin amputees. JPEN J Parenter Enteral Nutr. 1994;18:355–358.
[24] Tzamaloukas AH, Leger A, Hill J, et al. Body mass index inpatients with amputations on peritoneal dialysis: error ofuncorrected estimates and proposed correction. Adv PeritDial. 2000;16:138–142.
[25] Legro MW, Reiber GD, Smith DG, et al. Prosthesis evalu-ation questionnaire for persons with lower limb amputa-tions: assessing prosthesis-related quality of life. Arch PhysMed Rehabil. 1998;79:931–938.
[26] Wurdeman SR, Stevens PM, Campbell JH. Mobility analysisof AmpuTees (MAAT I): quality of life and satisfaction arestrongly related to mobility for patients with a lower limbprosthesis. Prosthet Orthot Int. 2018;42:498–503.
[27] Hafner BJ, Morgan SJ, Abrahamson DC, et al. Characterizingmobility from the prosthetic limb user’s perspective: use offocus groups to guide development of the prosthetic limbusers survey of mobility. Prosthet Orthot Int. 2016;40:582–590.
[28] Hafner BJ, Gaunaurd IA, Morgan SJ, et al. Construct validityof the Prosthetic Limb Users Survey of Mobility (PLUS-M) in
CART AMPUTEE FUNCTIONAL POTENTIAL 7

adults with lower limb amputation. Arch Phys Med Rehabil.2017;98:277–285.
[29] Hafner BJ, Morgan SJ, Askew RL, et al. Psychometric evalu-ation of self-report outcome measures for prosthetic appli-cations. J Rehabil Res Dev. 2016;53:797–812.
[30] Groll D, To T, Bombardier C, et al. The development of acomorbidity index with physical function as the outcome. JClin Epidemiol. 2005;58:595–602.
[31] Prosthetic Limb User Survey [Internet]; c2013 [cited 2016Dec]. Available from: www.plus-m.org
[32] Franchignoni F, Giordano A, Ferriero G, et al. Measuringmobility in people with lower limb amputation: Rasch ana-lysis of the mobility section of the Prosthesis EvaluationQuestionnaire. Acta Derm Venereol. 2007;39:138–144.
[33] Wurdeman SR, Myers SA, Stergiou N. Amputation effectson the underlying complexity within transtibial amputeeankle motion. Chaos. 2014;24:013140.
[34] Wurdeman SR, Stevens PM, Campbell JH. Mobility analysisof AmpuTees II: comorbidities and mobility in lower limbprosthesis users. Am J Phys Med Rehabil. 2018;97:782–788.
8 S. R. WURDEMAN ET AL.