machine learning applied to sensor data analysis machine ... · identification by machine learning...
TRANSCRIPT

Machine Learning Applied to Sensor Data Analysis
Yokogawa Technical Report English Edition Vol.59 No.1 (2016)
Machine Learning Applied to Sensor Data AnalysisGo Takami *1 Moe Tokuoka *1 Hirotsugu Goto *1 Yuuichi Nozaka *1
IoT and big data have already become household words and people are becoming increasingly interested in how to effectively use enormous amounts of collected data. Meanwhile, the third boom of artificial intelligence has emerged, and relevant technologies including machine learning are evolving rapidly. Yokogawa believes that technologies for machine learning can enable advanced maintenance such as degradation diagnosis and predictive maintenance by being applied to sensor data analysis in the field of industrial automation. This paper outlines the theory of machine learning and introduces an application example of analyzing the data of pH sensors.
INTRODUCTION
As exemplified by Internet of Things (IoT), recently, we are able to obtain data on various things, such as GPS
position information and home appliance usage, via digital communication. And greater efforts are being made to provide an environment to collect such data and easily store it in, for example, the cloud. The enormous amount of collected data is called big data, and the focus is on how to effectively use the big data (1). Meanwhile, the third boom of artificial intelligence has emerged (2)(3), and the fields of artificial intelligence and machine learning have evolved to such an extent that artificial intelligence has beaten a professional human Go player (4). Various industries are trying to learn patterns from an enormous amount of data using machine learning techniques and discover new facts from the patterns that cannot be noticed by humans and use them to solve problems. Attention is also paid to the IoT technology in the industrial automation (IA) field. One example is to install many wireless devices in a plant to obtain a large amount of data, such as equipment vibration and temperature data, then analyze the data and use
the results to ensure stable plant operation (5).We are paying attention to the measurement data of sensors
installed in a plant and expect to be able to introduce a new preventive maintenance service of sensors by applying a machine learning technique called a deep learning technique (6). Current maintenance operation greatly depends on the experience and intuition of maintenance technicians. We hope that the use of the deep learning technique will add new features to maintenance operation, such as advanced deterioration diagnosis and predictive maintenance of sensors. This paper outlines the machine learning techniques, describes experiment examples using the machine learning techniques, and shows a possibility of advanced deterioration diagnosis of sensors.
OUTLINE OF MACHINE LEARNING TECHNIQUES
The following describes the differences between the general analysis techniques and machine learning techniques. In the general analysis techniques, humans create a model for a problem to be solved. One of such models is a linear model; if parameters A, B, and C are estimated to have a linear relationship, a linear analysis technique applies a linear model to estimate the linearity of parameter D. There is also a well-known analysis technique in quality engineering in which variations from sample data are calculated and a human
27 27
*1 Filed Digital Innovation Department, New Field Development Center, IA Platform Business Headquarters
Machine Learning Applied to Sensor Data Analysis
Yokogawa Technical Report English Edition Vol.59 No.1 (2016) 2828
applies a model to estimate that points located at the edge of a bell curve are error points. Meanwhile, in the machine learning techniques, the machine (program) automatically generates models by learning patterns from a collection of data. When automatically generating models, the machine learning techniques learn models using a principle called an Occam’s razor (the hypothesis with the fewest assumptions is nearest to the truth). As a result, many of the models thus created are elusive. Therefore, it is said that it is often difficult for humans to interpret what the models created by the deep learning technique mean (Table 1). However, we believe that is the reason why the use of the machine learning techniques has potential to learn and find things from a collection of data that cannot be noticed by humans and to generate models for things such as experience and intuition that are difficult to be formulated.
Table 1 Differences between general analysis techniques and machine learning techniques
General analysis techniques
Machine learning techniques
Who creates model
Human Machine (program)
Examples of model
Linear model, polynomial model, etc.
Models that cannot be understood intuitively (e.g., neural model)
Use of Machine Learning TechniquesThere are many machine learning techniques (7). Users
choose a machine learning technique to suit the purpose of use. In general, there are two steps to use the machine learning techniques. The first step is a learning step to find patterns from a collection of data. The second step is an evaluation step to estimate unknown data using the learning results.
The learning step is to learn patterns from a collection of data using machine learning algorithms and generate models (Figure 1). A training module in Figure 1 is available for each machine learning technique. The user inputs the data to be learned (teacher data) into the training module, and the training module generates models using the built-in algorithms.
Training module
Model Teacher data
Generate
Figure 1 Learning step flow
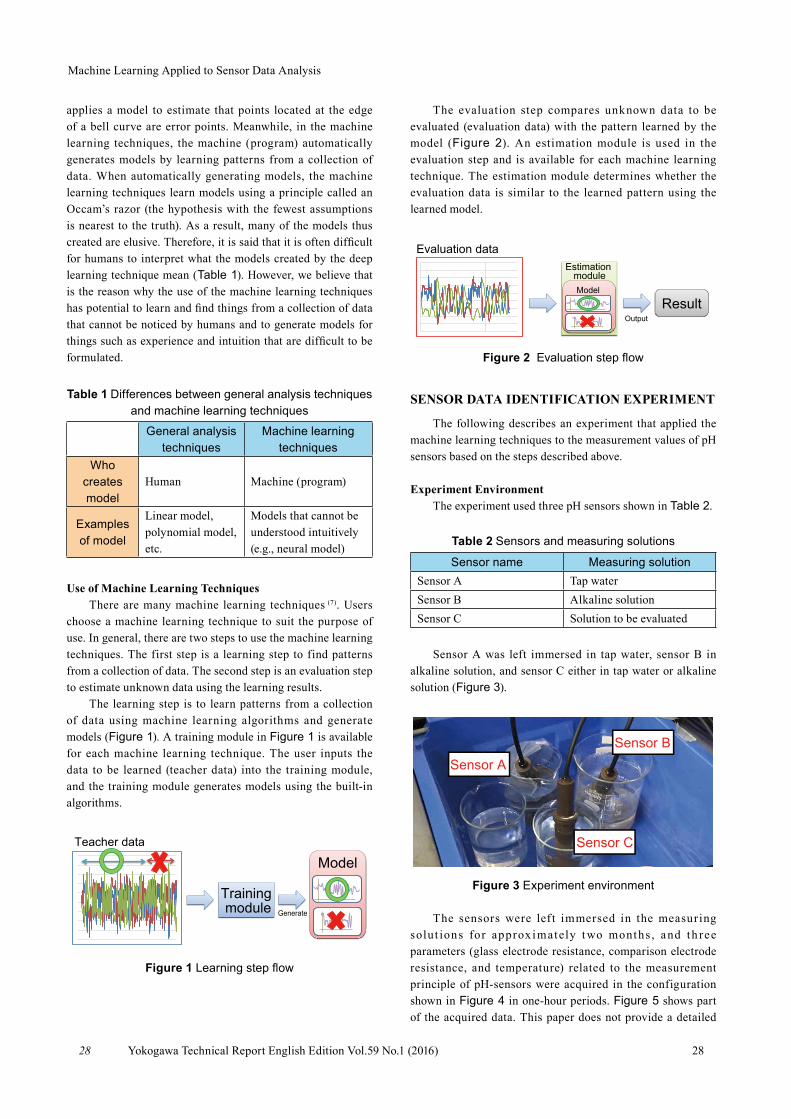
The evaluation step compares unknown data to be evaluated (evaluation data) with the pattern learned by the model (Figure 2). An estimation module is used in the evaluation step and is available for each machine learning technique. The estimation module determines whether the evaluation data is similar to the learned pattern using the learned model.
Estimation module
Result
Evaluation data
Output
Model
Figure 2 Evaluation step flow
SENSOR DATA IDENTIFICATION EXPERIMENT
The following describes an experiment that applied the machine learning techniques to the measurement values of pH sensors based on the steps described above.
Experiment EnvironmentThe experiment used three pH sensors shown in Table 2.
Table 2 Sensors and measuring solutions
Sensor name Measuring solutionSensor A Tap waterSensor B Alkaline solutionSensor C Solution to be evaluated
Sensor A was left immersed in tap water, sensor B in alkaline solution, and sensor C either in tap water or alkaline solution (Figure 3).
Sensor A
Sensor C
Sensor B
Figure 3 Experiment environment
The sensors were lef t immersed in the measuring solut ions for approx imately t wo months , and th ree parameters (glass electrode resistance, comparison electrode resistance, and temperature) related to the measurement principle of pH-sensors were acquired in the configuration shown in Figure 4 in one-hour periods. Figure 5 shows part of the acquired data. This paper does not provide a detailed

Machine Learning Applied to Sensor Data Analysis
Yokogawa Technical Report English Edition Vol.59 No.1 (2016)
explanation about the pH sensor, but it is known that when alkaline solution continues to be measured, there will be slight changes in the glass electrode and comparison electrode compared with tap water. However, it is difficult for a human to determine by just looking at the data in Figure 5 which solution sensor C is measuring. So we made an experiment using the data in Figure 5 to see whether the measuring solution can be identified by a machine learning technique.
PH8ERP (Yokogawa)pH sensor
YFGW410 (Yokogawa)Field wireless management station YFGW510 (Yokogawa)Field wireless access point
FLXA21 (Yokogawa) Two-wire liquid analyzer
HART communication
FN310 (Yokogawa) Field wireless multi-protocol module
FN110 (Yokogawa) Field wireless communication module
Figure 4 Configuration for acquiring data
-4
-2
0
2
4
6
2015/11/12 2015/11/22 2015/12/2 2015/12/12 2015/12/22
-4
-2
0
2
4
6
2015/11/12 2015/11/22 2015/12/2 2015/12/12 2015/12/22
-4
-2
0
2
4
6
2015/11/12 2015/11/22 2015/12/2 2015/12/12 2015/12/22
Sensor A(Tap water)
Sensor B(Alkalinesolution)
Sensor C(Evaluation
solution)
Glass electrode Comparison electrodeTemperature
Glass electrode Comparison electrodeTemperature
Glass electrode Comparison electrodeTemperature
Figure 5 Acquired sensor data
Identification by Machine Learning TechniqueA machine learning technique used for identification
in this experiment is called a deep learning technique. The first learning step lets a deep-learning training module learn the patterns of tap water and alkaline solution. The learning process creates teacher data by attaching label “1” to the data of sensor A that measures the tap water (almost neutral) and attaching label “-1” to the data of sensor B that measures the alkaline solution. The created teacher data is input to the deep-learning training module to create model X that learned the patterns of tap water and alkaline solution as shown in Figure 6. In the next evaluation step, the data of sensor C to be evaluated is input to the estimation module as evaluation data. The estimation module compares the evaluation data with the patterns learned by model X. Figure 7 shows the comparison results.
Figure 7 shows a plotted graph of the sensor C data that
was input to the estimation module one by one, where “1” indicates the data determined to be close to the sensor A data and -1 indicates the data determined to be close to the sensor B data. Only at the beginning of the data acquisition process did the estimation module determine that the sensor C data is close to the sensor A data (that is, close to the measurement pattern of tap water). After that point, however, the estimation module determined that the sensor C data is close to the measurement pattern of the alkaline solution at almost all points. The solution measured by sensor C is alkaline solution, so the estimation result of the machine learning technique agreed with the fact.
Estimation module
Figure 7result
Evaluation data
Output
Model X Sensor C (Evaluation object)
Training module Model X
Teacher data
Generate
Sensor A (Tap water): 1
Sensor B (Alkaline): -1
Figure 6 Model generation and estimation image
-2
-1
0
1
2
2015/11/14 2015/11/24 2015/12/4 2015/12/14 2015/12/24
Deep learning result
Deeplearningresult
Sensor A(Tap water)
Sensor B(Alkaline)
Figure 7 Estimation results
EXPECTATIONS FOR DETERIORATION ANALYSIS
The results described above show that the machine learning technique learns the pattern of tap water and the pattern of alkaline solution and can identify slight differences in the patterns even though it is difficult for a human eye to identify such differences in the data. This allowed us to conclude that the machine learning technique will be able to represent slight changes with numeric values, which indicate the deterioration in the performance of the sensor caused by changes in the electrode, etc. that occur over time and that
29 29

Machine Learning Applied to Sensor Data Analysis
Yokogawa Technical Report English Edition Vol.59 No.1 (2016)
cannot be identified by a human eye, so we carried out the following experiment.
Deterioration Determination ExperimentWe used the sensors B and C used in the above
experiment and performed the learning and evaluation steps shown in Figure 8. In the first learning step, we prepared teacher data by attaching label “1” (normal) to the first half of the sensor B data and attaching label “-1” (deterioration) to the second half of the data to create a model that can determine deterioration (changes over time). The created data was input to the deep-learning training module to generate a model Y that learned the patterns of the first half and the second half of the data as shown in Figure 8. In the next evaluation step, the sensor C data to be evaluated was input to the estimation module as evaluation data. Figure 9 shows the output results of the estimation module.
-4
-2
0
2
4
6
2016/1/7 2016/1/17 2016/1/27 2016/2/6
Glass electrode Comparisonelectrode
Temperature
Second half of data: -1
Training module Model Y
Sensor B
Teacher data
First half of data: 1
Estimation module
Figure 9result
Evaluation data
Output
Model Y Sensor C
Second half of data: -1First half of data: 1
Figure 8 Creation of deterioration estimation model and evaluation by estimation module
-1.5-1
-0.50
0.51
1.5
2016/1/7 2016/1/17 2016/1/27 2016/2/6
Sensor C output results
Sensor Coutput results
50-section average
Figure 9 Estimation results
The graph in Figure 9 shows plotted deep learning output values obtained by inputting the sensor C data to the estimation module one by one. The moving average in the measurement results remains in the neighborhood of 0.5 at
the beginning, so the estimation module determines that the sensor C evaluation data is more similar to the pattern of the first half of the learning data (1: normal) than to the pattern of the second half (-1: deterioration). The output values gradually decline in the second half. Which means the estimation module determines that the sensor C evaluation data is becoming gradually more similar to the second half of the learning data (-1: deterioration) over time. This allowed us to conclude that there is the possibility of creating a sensor deterioration estimation model by using the deterioration sensor data and normal sensor data.
CONCLUSION
This paper outlines the machine learning techniques and describes a sensor identification experiment and the results of a deterioration determination experiment that suggest the possibility of understanding the sensor deterioration process. We believe there is a great possibility that analysis of sensor data using the machine learning techniques can be used for the preventive maintenance such as sensor deterioration estimation. Furthermore, the machine learning techniques described in this paper do not take into consideration knowledge and know-how specific to the pH sensor at all, so we believe that they can be generally applied to various kinds of sensor data.
In the future we will increase the number of sensor deterioration examples and want to apply the machine learning techniques to things such as prediction of maintenance and repair cycles that have been dependent on the experience and intuition of human workers up to now. We also plan to incorporate a highly accurate preventive maintenance function, which is achieved by machine learning, into ISA100-compliant devices.
Finally, allow us to express our sincere gratitude to Mr. Satish Godachikonda at Yokogawa IA Technologies India Private Limited (YTI) for help in creating the program of this project.
REFERENCES
(1) Makoto Shirota, “The Impact of Big Data,” Toyo Keizai, 2012 (in Japanese)
(2) Yutaka Matsuo, “Will Artificial Intelligence Exceed Human? What Is beyond Deep Learning,” Kadokawa, 2015 (in Japanese)
(3) Shohei Hido, Yukino Baba, et al., “Training Book for Data Scientists: Int roduct ion of Machine Learning,” Gijutsu-Hyohron, 2015 (in Japanese)
(4) Google Inc., AlphaGo, 2016, https://deepmind.com/alpha-go.html(5) ARC White Paper, “Process Automation and the IoT: Yokogawa’s
VigilantPlant Approach to the Connected Industrial Enterprise,” ARC Advisory Group, 2015
(6) Takayuki Okaya, “Machine Learning Professional Series: Deep Learning,” Kodansha, 2015 (in Japanese)
(7) Mariette Awad, Rahul Khanna, “Efficient Learning Machines,” Apress Media, 2015
* YFGW and FLXA are registered trademarks of Yokogawa Electric Corporation.
3030