machine learning model on rainfall - a predicted approach
TRANSCRIPT

Machine Learning Model on Rainfall - A Predicted Approach for Bangladesh
Yousuf Zaman Student Id: 012102012
A Thesis
in
The Department
of
Computer Science and Engineering
Presented in Partial Fulfillment of the Requirements
For the Degree of Master of Science in Computer Science and Engineering
United International University
Dhaka, Bangladesh
February, 2018
© Yousuf Zaman, 2018

i
Approval Certificate This thesis titled "Machine Learning Model on Rainfall - A Predictive Approach for Bangladesh” submitted by Yousuf Zaman, Student ID: 012102012, has been accepted as Satisfactory in fulfillment of the requirement for the degree of Master of Science in Computer Science and Engineering on February, 2018. Board of Examiners 1. ______________________________ Supervisor Dr. Mohammad Nurul Huda, Professor & MSCSE Co-Ordinator United International University
2. ______________________________ Head Examiner Suman Ahmed Asst. Professor Department of CSE Director, Center for Development of IT Professionals United International University 3. ______________________________ Examiner-I Mohammad Moniruzzaman Asst. Professor. Department of CSE United International University
4. ______________________________ Examiner-II Novia Nurain Asst. Professor Department of CSE United International University

ii
Declaration This is to certify that the work entitled “Machine Learning Model on Rainfall - A Predictive Approach for Bangladesh" is the outcome of the research carried out by me under the supervision of Dr. Mohammad Nurul Huda, Professor & MSCSE Co-Ordinator, United International University. ________________________________________ Yousuf Zaman, 012102012 Computer Science & Engineering. In my capacity as supervisor of the candidate’s thesis, I certify that the above statements are true to the best of my knowledge. ________________________________________ Dr. Mohammad Nurul Huda Professor & MSCSE Co-Ordinator

iii
Abstract
Mankind have been attempting to predict the weather from prehistory. For good reason for knowing
when to plant crops, when to build and when to prepare for drought and flood. In a nation such as
Bangladesh being able to predict the weather, especially rainfall has never been so vitally important.
The proposed research work pursues to produce prediction model on rainfall using the machine
learning algorithms. The base data for this work has been collected from Bangladesh Meteorological
Department. It is mainly focused on the development of models for long term rainfall prediction of
Bangladesh divisions and districts (Weather Stations). Rainfall prediction is very important for the
Bangladesh economy and day to day life. Scarcity or heavy - both rainfall effects rural and urban
life to a great extent with the changing pattern of the climate. Unusual rainfall and long lasting rainy
season is a great factor to take account into. We want to see whether too much unusual behavior is
taking place another pattern resulting new clamatorial description. As agriculture is dependent on
rain and heavy rainfall caused flood frequently leading to great loss to crops, rainfall is a very
complex phenomenon which is dependent on various atmospheric, oceanic and geographical
parameters. The relationship between these parameters and rainfall is unstable. Beside this changing
behavior of clamatorial facts making the existing meteorological forecasting less usable to the users.
Initially linear regression models were developed for monthly rainfall prediction of station and
national level as per day month year. Here humidity, temperatures & wind parameters are used as
predictors. The study is further extended by developing another popular regression analysis
algorithm named Random Forest Regression. After then, few other classification algorithms have
been used for model building, training and prediction. Those are Naive Bayes Classification,
Decision Tree Classification (Entropy and Gini) and Random Forest Classification. In all model
building and training predictor parameters were Station, Year, Month and Day. As the effect of

iv
rainfall affecting parameters is embedded in rainfall, rainfall was the label or dependent variable in
these models. The developed and trained model is capable of predicting rainfall in advance for a
month of a given year for a given area (for area we used here are the stations (weather parameters
values are measured by Bangladesh Meteorological Department). The accuracy of rainfall
estimation is above 65%. Accuracy percentage varies from algorithm to algorithm.
Two regression analysis and three classification analysis models has been developed for rainfall
prediction of 33 Bangladeshi weather station. Apache Spark library has been used for machine
library in Scala programming language. The main idea behind the use of classification and
regression analysis is to see the comparative difference between types of algorithms prediction
output and the predictability along with usability.
This thesis is a contribution to the effort of rainfall prediction within Bangladesh. It takes the strategy
of applying machine learning models to historical weather data gathered in Bangladesh. As part of
this work, a web-based software application was written using Apache Spark, Scala and HighCharts
to demonstrate rainfall prediction using multiple machine learning models. Models are successively
improved with the rainfall prediction accuracy.

v
Acknowledgments
This thesis is the result of one year of work during which I have been accompanied and supported
by many people. I hereby express deep gratitude and thanks to, Dr. Mohammad Nurul Huda,
Professor, United International University, Dhaka, whose continuous motivation, guidance,
suggestions, crucial help and kind attention, enabled me to execute this research.
It is honor to remember Mohammad Moniruzzaman, Assistant Professor, United International
University, who is my inspiration to pursue for the knowledge in the era of big data and text
processing at the time of under graduation.
I want to be further honored by remembering Arijit Mitra (https://www.linkedin.com/in/ari-mitra-
48475451/ ), CTO, Apurba Technologies Inc, United Kingdom, who paved my way to the Big Data
and Machine Learning in professional path.
I further acknowledge all the helps and supports from my class mates and other teachers of United
International University.
I specially want to thanks to Jahidul Islam (https://www.linkedin.com/in/mohammad-jahidul-
islam-424a835/ ), my co-worker and colleague who participated in this research work along with
me.
Finally, I remember and express my gratitude to Almighty Allah for enabling me going fine with
this research work continuously alongside my family and job and a lot of other critical unusual
issues.
Yousuf Zaman

vi
Contents
Approval Certificate ………………………………………………………………….… (i)
Declaration……………………………………………………………………………… (ii)
Abstract……………………………………………….………………………..….……..(iii)
Acknowledgement ……………………………………….…………………………….. (v)
Contents…………………………………………………….……………………………(vi)
List of Tables………………………………………………………….………………....(x)
List of Figures……………………………………………………….……………..…….(xi)
Introduction ................................................................................................................................. 1
1.1 Background ......................................................................................................................... 1
1.2 Literature Survey ................................................................................................................. 3
1.3 Problem Statement ............................................................................................................... 4
1.4 Introduction to Data Used for this Research and Statistical Analysis .................................... 5
1.5 Organization of Thesis ....................................................................................................... 13
History and Background of Rainfall prediction ....................................................................... 15
2.1 Bangladeshi’s Rainfall ....................................................................................................... 15
2.2 Hydrological Cycle ............................................................................................................ 16
2.3 Walker Circulation ............................................................................................................ 17
Thesis Lab Work Web Application .......................................................................................... 18
3.1 Training and Building Model: ............................................................................................ 19
3.1.1 Data Preparation: .................................................................................................................... 19 3.1.2 Monthly Data: ......................................................................................................................... 19
3.1.3 Daily Data:.............................................................................................................................. 19
3.1.4 Machine Learning Algorithms: ................................................................................................ 20
3.2 Implementation: ................................................................................................................. 21
3.2.1 Technology those are used in this developed lab web application. ............................................ 21 3.2.2 Why Apache Spark: ................................................................................................................ 21
3.3 Web Application:............................................................................................................... 22
vii
3.4 Home Page: ....................................................................................................................... 22
3.5 Statistical Average Data Visualization: .............................................................................. 23
3.6 Statistical Total Data Visualization: ................................................................................... 24
3.7 Live Prediction: ................................................................................................................. 25
3.7.1 Monthly Prediction: ................................................................................................................ 25 3.7.2 Daily Prediction: ..................................................................................................................... 26 3.7.3 Filtering Criteria: .................................................................................................................... 26
3.8 Prediction Result: .............................................................................................................. 28
3.8.1 Random Forest Regression Prediction result for monthly for the year of 2026, January to December. ....................................................................................................................................... 28 3.8.2 Linear Regression Daily Prediction for the year of 2030, July 1st to 15th. .................................. 28
3.9 Bulk Prediction Result: ...................................................................................................... 29
Machine Learning - Classification Vs. Regression ................................................................... 31
4.1 Classification Problems: .................................................................................................... 31
4.1.1 Type of classification: ............................................................................................................. 32 4.1.2 Algorithm of Classifications: ................................................................................................... 32
4.2 Regression Problems: ........................................................................................................ 32
4.2.1 Regression Algorithms: ........................................................................................................... 32
4.3 Data Model: ....................................................................................................................... 32
4.4 Co-relation Matrix: ............................................................................................................ 33
4.5 Classification Model Data Setup: ....................................................................................... 33
4.5.1 Minimum maximum rainfall data set matrix: ........................................................................... 34 4.5.2 Monthly Prediction Model – Label and Feature columns: ........................................................ 35 4.5.3 Daily Prediction Model – Label and Feature columns: ............................................................. 35
Regressions Analysis and Rainfall Prediction .......................................................................... 36
5.1 Liner Regression ................................................................................................................ 36
5.1.1 Correlation Coefficient ............................................................................................................ 38 5.1.2 Model Evaluation .................................................................................................................... 39 5.1.3 Model Building and Training: ................................................................................................. 39 5.1.4 Model Data Type .................................................................................................................... 40 5.1.5 Model Preparation: .................................................................................................................. 41
5.1.6 Training the model .................................................................................................................. 41 5.1.7 Model Testing: ........................................................................................................................ 43 5.1.8 Monthly Prediction: ................................................................................................................ 43 5.1.9 Prediction Result ..................................................................................................................... 44

viii
5.1.10 Daily Prediction .................................................................................................................... 44 5.1.11 Daily Prediction Result.......................................................................................................... 45 5.1.12 Linear Regression Evaluation: ............................................................................................... 46
5.2 Random Forest Regression ................................................................................................ 46
5.2.1 Why Random Forest: .............................................................................................................. 47 5.2.2 Model Data: ............................................................................................................................ 48 5.2.3 Model Building and Training: ................................................................................................. 48 5.2.4 Model Preparation: .................................................................................................................. 49
5.2.5 Training the model: ................................................................................................................. 50 5.2.6 Model Testing: ........................................................................................................................ 51 5.2.7 Prediction from Lab Work Application: ................................................................................... 51 5.2.8 Monthly Prediction: ................................................................................................................ 51 5.2.9 Prediction Result: .................................................................................................................... 52 5.2.10 Random Forest Regression Evaluation: ................................................................................. 53
5.3 Comparative Analysis with actual Vs Predicted for Both Regression ................................. 53
Classification Analysis and Rainfall Prediction ....................................................................... 54
6.1 Decision Tree Classification .............................................................................................. 54
6.1.1 Entropy ................................................................................................................................... 55
6.1.2 Gini Index or Gini Split ........................................................................................................... 56 6.1.3 Data Model Type: ................................................................................................................... 57 6.1.4 Model Building and Training: ................................................................................................. 58 6.1.5 Testing the Model ................................................................................................................... 59 6.1.6 Prediction using Web Application ........................................................................................... 59 6.1.7 Prediction Filtering ................................................................................................................. 60 6.1.7.1 Monthly Prediction:.............................................................................................................. 60 6.1.7.2 Daily Prediction: .................................................................................................................. 61
6.1.8 Prediction Result ..................................................................................................................... 61 6.1.8.1 Monthly Prediction Result: ................................................................................................... 61
6.1.8.2 Daily Prediction Result:........................................................................................................ 62
6.1.9 Decision Tree Monthly Model Testing Accuracy Matrix: ........................................................ 62
6.2 Naïve Bayes Classification: ............................................................................................... 63
6.2.1 Advantages: ............................................................................................................................ 64 6.2.2 Disadvantages ......................................................................................................................... 64 6.2.3 Data Based Model Type .......................................................................................................... 65 6.2.4 Model Building and Training: ................................................................................................. 66

ix
6.2.5 Testing the Model: .................................................................................................................. 67 6.2.6 Prediction using Web Application: .......................................................................................... 67 6.2.7 Prediction Filtering ................................................................................................................. 67 6.2.7.1 Monthly Prediction:.............................................................................................................. 67
6.2.7.2 Daily Prediction ................................................................................................................... 68
6.2.8 Prediction Result: .................................................................................................................... 68 6.2.8.1 Monthly Prediction Result: ................................................................................................... 69
6.2.8.2 Daily Prediction Result:........................................................................................................ 69
6.2.9 Naïve Bayes Model Accuracy Matrix: ..................................................................................... 70
6.3 Random Forest Classifier ................................................................................................... 71
6.3.1 How Random Forest Algorithm Works ................................................................................... 72 6.3.2 Advantages of Random Forest Classifier: ................................................................................ 73 6.3.3 Data Based Model Type .......................................................................................................... 73 6.3.4 Model Building and Training .................................................................................................. 74
6.3.5 Testing the Model ................................................................................................................... 75 6.3.6 Prediction using Web Application: .......................................................................................... 76 6.3.7 Prediction Filtering: ................................................................................................................ 76 6.3.7.1 Monthly Prediction ............................................................................................................... 76
6.3.7.2 Daily Prediction ................................................................................................................... 77
6.3.8 Prediction Result: .................................................................................................................... 77 6.3.8.1 Monthly Prediction Result: ................................................................................................... 77
6.3.8.2 Daily Prediction Result:........................................................................................................ 78
6.3.9 Random Forest Model Accuracy Matrix: ................................................................................. 79
6.4 Comparative Analysis of the Classification Algorithms Model .......................................... 79
Conclusion and Future Scope ................................................................................................... 81
7.1 Conclusion ........................................................................................................................ 81
7.1.1. Classification Algorithm Accuracy: ........................................................................................ 82 7.1.2. Regression Algorithm Evaluation Matrix Comparison: ........................................................... 83
7.2 Future Scope ...................................................................................................................... 84
Appendix A ................................................................................................................................ 89
x
List of Tables
Table 1.1: Daily Maximum Rainfall - Sample Data 7
Table 1.2: Daily Total Rainfall - Sample Data 8
Table 4.1: Co-relation Matrix of Monthly Data 33
Table 4.2: Co-relation matrix of Daily Rainfall Data 33
Table 4.3: Minimum Maximum Rainfall Data Matrix 34
Table 4.4: Data Classification Matrix 34
Table 4.5: Monthly Prediction Feature Column 35
Table 4.6: Daily Prediction Feature and Label column 35
Table 4.7: Linear Regression Evaluation Matrix 46
Table 4.8: Random Forest Regression Evaluation Matrix 53
Table 6.1: Decision Tree Monthly Prediction Accuracy Matrix 62
Table 6.2: Naive Bayes Classification Model Accuracy Matrix 70
Table 6.3: Random Forest Classification Accuracy Matrix 79
Table 7.1: Classification Algorithms Accuracy Matrix 82
Table 7.2 Regression Algorithms Evaluation Matrix 83

xi
List of Figures
Figure 1.1: GDP of Bangladesh from Agriculture 1
Figure 1.2: Raw Data collected from BMD 5
Figure 1.3: Rainfall Data visualization, Year wise Avg. rainfall in mm (millimeter) 8
Figure 1.4: Year Wise Average Temperature in degrees 9
Figure 1.5: Year wise Average Humidity in Percentage in the air 9
Figure 1.6: Yearly wind speed observations in Km 10
Figure 1.7: Monthly Average Rainfall in mm(millimeter) for all the year 10
Figure 1.8: Monthly Average Temperature 11
Figure 1.9: Month Wise Average Humidity 12
Figure 1.10: Month Wise Average Wind Speed 12
Figure 2.1: Do you Remember 15
Figure 2.2: Ecological Cycle 16
Figure 3.1: Lab Work Environment 18
Figure 3.2: After cleaning rainfall raw data 20
Figure 3.3: Machine Learning Lab Application Home Page 23
Figure 3.4: Lab Application Statistical Average Data Graph 24
Figure 3.5: Lab App Statistical Total Data Visualization 25
Figure 3.6: Lab App LIVE Prediction Filter 25
Figure 3.7: Lab App Daily Prediction Filter 26
Figure 3.8: Live Prediction Result using Random Forest Regression 28
Figure 3.9: Live Prediction Result using Linear Regression 29
Figure 3.10: Bulk Prediction Data Visualization 30
Figure 4.1: Classification Vs Regression 31
Figure 4.2: Code - Dynamic Class Value Calculation 34
Figure 5.1: Linear Regression Point and Data Example 37
Figure 5.2: Code - Linear Regression Model Configuration 41
Figure 5.3: Code - Linear Regression Model Fitting and Accuracy Testing 42

xii
Figure 5.4: Linear Regression Model in Disk 42
Figure 5.5: Code - Linear Regression LIVE Testing Result 43
Figure 5.6: Linear Regression - Live Testing Filtering UI 43
Figure 5.7: Linear Regression - LIVE Prediction Result 44
Figure 5.8: Linear Regression - Daily LIVE Prediction Filtering 45
Figure 5.9: Linear Regression - Daily LIVE Prediction Result 45
Figure 5.10: Random Forest Regression 47
Figure 5.11: Code - Random Forest Regression Parameter Configuration 49
Figure 5.12: Code - Random Forest Model Fitting and Evaluation 50
Figure 5.13: Random Forest Daily Model Saving 50
Figure 5.14: Random Forest Monthly Model Saved 50
Figure 5.15: Code - Random Forest Regression LIVE Testing Processing 51
Figure 5.16: Random Forest Regression Monthly Prediction Filter 52
Figure 5.17: Random Forest Regression Monthly LIVE Prediction Result 52
Figure 5.18: Regression Analysis Model Comparative Graph 53
Figure 6.1: Decision Tree - Process Visualization 54
Figure 6.2: Code - Decision Tree Model Configuration 58
Figure 6.3: Decision Tree Model File in Disk 59
Figure 6.4: Code - Decision Tree Testing 59
Figure 6.5: Decision Tree LIVE monthly prediction 60
Figure 6.6: Decision Tree LIVE Monthly Prediction Filter 61
Figure 6.7: Decision Tree Monthly Live Prediction Result 61
Figure 6.8: Decision Tree Daily LIVE Prediction Result 62
Figure 6.9: Sample Naive Base Data Set 64
Figure 6.10: Code - Naive Bayes Training Model 66
Figure 6.11: Naive Bayes Model Saved to Disk 66
Figure 6.12: Code - Naive Bayes Model Testing 67
Figure 6.13: Naive Bayes Monthly LIVE Prediction UI 67

xiii
Figure 6.14: Naive Bayes Daily Live Prediction Filter 68
Figure 6.15: Naive Bayes Monthly LIVE Prediction Result 69
Figure 6.16: Naive Bayes Daily Live Prediction Result 69
Figure 6.17: Random Forest Classifier Diagram 71
Figure 6.18: Random Forest Classifier Flows 71
Figure 6.19: Random Forest Classifier Data Distribution Example 72
Figure 6.20: Random Forest Classifier Model Configuration 74
Figure 6.21: Random Forest Classifier Model Saved 75
Figure 6.22: Code - Random Forest Classifier Model Testing 75
Figure 6.23: Random Forest Classifier Monthly Prediction Filter 76
Figure 6.24: Random Forest Classifier Daily LIVE Filter 77
Figure 6.25: Random Forest Classifier LIVE Monthly Predict Result 77
Figure 6.26: Random Forest Classifier LIVE Daily Predict Result 78
Figure 6.27: Comparative Classification Analysis output 10 79
Figure 6.28: Comparative Classification Analysis output 50 80
Figure 6.29: Comparative Classification Analysis output 95 80
Figure 7.1: Classification Algorithm Accuracy for Monthly Model 82
Figure 7.2: Classification Algorithms Accuracy - Daily Model 82
Figure 7.3: Regression Algorithms Co efficient 83
Figure 7.4: Regression Analysis RMSE Values 83

1
Chapter – 1
Introduction
1.1 Background
Subcontinental rainfall prediction is so important for Bangladesh’s economy and day to day
life is highly based on agriculture. Around 70% of the total population lives in rural areas and
majority of them are dependent on rain-fed agriculture. About 60% of Bangladesh’s
geographical area is used for agriculture [33, 35]. The Bangladeshi’s agriculture, which
accounts for 17-20% of the gross domestic product (GDP), is largely dependent on rain. About
13-18% of Bangladesh total annual exports are agricultural products. The variability of rainfall
in amount, time and space affects agriculture, which hampers the economy.
Figure 1.1: GDP of Bangladesh from Agriculture

2
About 80% of Bangladeshi’s annual rainfall is received between June –September. This is the
main season for rain fed agriculture. 60% of cultivated area is rain-fed, as only 40% of area is
under irrigation. Irrigation water is also dependent on monsoon.
The performance of monsoon rainfall affects the crop productivity, agriculture investment, and
migration of people from villages to urban areas, poor infrastructure and services. Major issues
related to rainfall forecasting are, variation in predictand-predictor relationship, inter
correlation between the predicators, changing predictability. [38]
Many researchers [1, 2, 3, 4, 5, 8,9,10,11,12,13,14,15] have worked on prediction of
subcontinental rainfall, yet it remains a subject of research to improve the prediction accuracy.
Hence application of computing tools/methods to societal problem is the main motivation of
work.

3
1.2 Literature Survey
Long-range forecasting can be broadly divided into four categories, (a) periodicity approach, (b)
Correlation approach, (c) extended synoptic approach and (d) the dynamical approach [90].
Bangladeshi's Meteorological Department (BMD) is primary government agency in Bangladesh for
weather prediction. [39]
First forecast issued by IMD in 1886, was based on relationship between Himalayan snow
cover and Bangladeshi’s summer monsoon rainfall [40]. Sir Gilbert [14, 12] introduced
correlation and regression techniques. In 1988 IMD introduced power regression and
parametric model. IMD used a 16 parameters power regression model for the period of 1988
to 2002 with model error 4%. These 16-parameters are based on temperature, pressure, wind
and snow-cover. The relationship of these parameters with rainfall is declining day by day.
Because of this declining relationship, 10 parameters were dropped in 2003. In 2003 IMD used
a two-stage forecasting strategy based on the previous 6 parameters and some of newly added
parameters. First stage forecast was issued in April and the second stage was issued June. From
20032006 forecasting was done using 8-parameter and 10-parameter power regression models
[40]. In 2007 BMD introduced statistical forecast system based on ensemble technique. In
2009, second stage (August – September) rainfall forecast was issued over the entire country.
From 2010, operational forecast for the rainfall during the second half of the monsoon season
(August-September) and that during the September over the country is started. BMD has
introduced many changes in the approach and scope of rainfall prediction methods [7, 15, 42].
Although IMD rainfall prediction model accuracy is good, the model is dependent on set of
predictors.

4
Most of the studies of Bangladeshi’s monsoon forecasting are based on empirical and statistical
techniques. These statistical techniques are from simple correlation analysis to advanced
procedures such as canonical correlation analysis and neural networking. Almost all of the
predictors identified so far have been based on correlation analysis, but it is highly sensitive to
lag period over which it is calculated. This imposes certain limitations on the reliability of the
predictors. The most commonly used technique for monsoon forecasting is linear regression
analysis.
El-shafie,M. Mukhlisin [41] used Artificial Neural Network to predict rainfall-runoff
relationship in a catchment area of Japan. They proposed a model with the use of the feed
forward back propagation with hyperbolic tangent neurons in the hidden layer and linear
neuron in the output layer. Model performance is evaluated by other statistical indexes like
correlation coefficient and mean square error. Proposed model is found to be more accurate.
G. Incerti and E. Feoli [9] suggested drought risk index by applying an artificial neural network
classifier to bioclimatic time series. The ANN for operational temporal units calculates a DRI
value ranging between -1 and 1.The operational temporal units are generated by window
shifting along time series and window is defined by fast Fourier transform (FFT).
Variety of rainfall prediction models are developed using methods such as Linear regression
method, linear regression method, polynomial regression, sliding window correlation, artificial
neural network and other soft computing methods, still the rainfall accuracy is not achieved to
the desired level. There is scope for investigation of the techniques used for rainfall prediction.
1.3 Problem Statement
The proposed research project work aims to develop Bangladesh’s rainfall prediction model.
Rainfall in Bangladesh is strongly dependent upon geographical location of the Indian
subcontinent; hence it is proposed to develop rainfall prediction model over homogeneous
regions of Bangladesh and sub divisions (regions) of Bangladesh. Model will be developed

5
over Bangladeshi’s homogeneous regions viz. Bangladesh Meteorological Department have
33 weather station where daily rainfall, humidity, temperatures and win speed is measured.
Data has been collected from Bangladesh Meteorological Department
1.4 Introduction to Data Used for this Research and Statistical Analysis
To understand the problem, we researched the data in some statistical way and prepared the
data for the machine learning. In the preparation stages we went through the following stages.
Raw Data Stage: BMD (Bangladesh Meteorological Department). What we got form the
BMD is the row data as below.
Figure 1.2: Raw Data collected from BMD
All rainfall related data have been collected from Bangladesh meteorological department.
Provided data have different types of sub category and each of those categories data has the
daily based rainfall related data.

6
Provided data has following category.
- Rainfall (millimeter)
- Humidity (percentage of water in the air)
- Wind Speed (Kilometer)
- Temperature (heat degrees)
Each of those categories has 3 different columns in the data file. For rainfall it has
- Daily Minimum Rainfall Data
- Daily Maximum Rainfall Data
- Daily total Rainfall Data
For Temperature, it has data file like:
- Daily Minimum Temperature Data
- Daily Maximum Temperature Data
- Daily Average Temperature Data
For Humidity, it has data file like:
- Daily Minimum Humidity Data
- Daily Maximum Humidity Data
- Daily Average Humidity Data
For Wind Speed, it has following data file:
- Daily Minimum Wind Speed Data
- Daily Maximum Wind Speed Data
- Daily Average Wind Speed Data
Data File’s Column Structure:
Each data file has almost same column structure those are like:
- Station - Year - Month - 1 (Day 1) - 2 (Day 2) - 3 (Day 3) - …. - 30 (Day 30) - 31 (Day 31)

7
In the given column structure, for rainfall data, Station, Year, Month will be same, but Day’s
column will contain the Daily Total, Minimum, Maximum value for corresponding data file.
Individual File Structure:
Rainfall Data:
Rainfall data has in three sub category those are:
- Daily Total Rainfall
- Daily Minimum Rainfall
- Daily Maximum Rainfall
Each data file has same column structure. Its having Station, Year, Month, all days of the month,
and those day’s column containing corresponding rainfall value whether it is Maximum, Minimum
or Total.
Daily Maximum Rainfall
Daily maximum rainfall data file has following structure:
Days of the month
Station Year Month 1 2 3 4 5 … 30 31
Dhaka 2003 1 0 0 0 0 0 … 0 0
Dhaka 2003 2 0 0 0 0 0 …
Dhaka 2003 3 0 0 0 0 0 … 14.2 11
Table 1.1: Daily Maximum Rainfall – Sample Data
Total Rainfall Daily
Having columns Station, Year, Month and all days of the month where those days contains the
total rainfall for that corresponding day’s column.

8
Station Year Month 1 2 3 4 5 … 30 31
Dhaka 1970 1 0 0 0 0 0 … 0 0
Dhaka 1970 2 0 0 0 0 0 …
Dhaka 1970 3 0 0 0 0 6 … 11 0
Dhaka 1970 4 1 7 4 0 0 … 0
Table 1.2: Daily Total Rainfall – Sample Data
Before we proceeded with the machine learning analysis we opt for some statistical analysis
to get some overview and understanding of the future result that we are expecting to get from
machine learning model using various Machine learning algorithm. In line with the same
purpose, as we are working with other four parameters like temperature, humidity and wind
speed. In the subsequent images, it has been showed the same graph that displays the average
yearly temperature, humidity and wind speed.
Figure 1.2: Rainfall Data visualization, Year wise total rainfall in mm (millimeter) Figure 1.3: Rainfall Data visualization, Year wise Avg. rainfall in mm (millimeter)

9
Figure 1.4: Year Wise Average Temperature in degrees
Temperature deviates less than the other parameters, almost same average all around the year. So,
we don’t expect a great influencer the temperature is.
Figure 1.5: Year wise Average Humidity in Percentage in the air

10
Wind speed is dying down year by year. As the wind speed declines, the different pattern of climate
is being observed in last few years.
Figure 1.6: Yearly wind speed observations in Km
Now let’s have a look at the monthly observation of the rainfall data for all the years. The graph
below displays all the years average rainfall by month. What we see the July is the most rain prone
month. At the time of prediction, we will try to predict for some future years with the month of
July to see whether our model act as the actual picture is.
Figure 1.7: Monthly Average Rainfall in mm(millimeter) for all the year

11
This graph let us have a feeling how the other co-efficient works together with the rainfall. As
yearly statistics given, we also included the monthly graphs for all the years in different graphs.
What we see in the graph above is June and July are the most rain prone months.
When the whole bunch of Machine Learning model will be developed, we will test the model with
a future year to have an overview how it looks like. Off course the changing pattern of the weather
will impact the scenario a lot.
Figure 1.8: Monthly Average Temperature
Like the rainfall, the temperatures work behind the scene. Though, the statistical analysis done and
displayed, for the Machine Learning Prediction, we did only prediction and analysis for rainfall.

12
Figure 1.9: Month Wise Average Humidity
Figure 1.10: Month Wise Average Wind Speed
13
1.5 Organization of Thesis
Thesis is organized into following chapters. Major highlights of the chapters are given as
below.
Chapter-1(This chapter): Introduction - It briefly introduces the importance of modeling and
prediction of Bangladeshi’s rainfall. It depicts the literature survey on the rainfall prediction
methodologies, motivation and problem statement. It further describes the brief summary of
other chapters in the thesis. It also introduces the readers with the data have been used for the
various machine learning algorithm.
Chapter-2: History and Background of Rainfall. It introduces Bangladeshi’s rainfall and
hydrological cycle. Rainfall prediction models developed with regression method using
atmospheric parameters are discussed in this chapter.
Chapter-3: Thesis Lab Work Application – All the technological work and data preparation
took almost about a 1000 hours of lab work. In this chapter we discussed the lab work
application.
Chapter-4: Machine Learning: Classification Vs Regression – We depict where a comparative
picture between the Classification and Regression algorithms as we worked with the both. The
chapter fairly go through with our fair understanding of what are the classification algorithms
are and what are the Regression Analysis are - their advantages and disadvantages from
various perspective.
Chapter-5: Regressions Analysis and Rainfall Prediction – In this chapter we discussed the
Regression analysis models mainly Linear Regression and Random Forest. Both are very
popular in the realm of Artificial intelligence and Machine learning. We put all our thoughts
and findings for the subject area in the chapter for the mentioned algorithm.
Chapter -6: Classification Analysis and Rainfall Prediction – Like chapter 5, in this chapter
we discussed about the classification Analysis and rainfall prediction. We covered here the

14
decision tree, Naïve Bays Classification, and Random Forest Classifier. For each and every
algorithm implementation we have sub-section to prove that our algorithm works with the
given subject data properly.
Chapter-7: Conclusion and Future Scope - It brings out a brief summary of the work carried
out and conclusions derived from the research work along with the scope for future.

15
Chapter – 2
History and Background of Rainfall prediction
2.1 Bangladeshi’s Rainfall
Bangladesh is a tropical Country, and its precipitation varies considerably in a frequency,
intensity, and as in duration. The largest amount of precipitation (around 75%) falls as rain
during the monsoon season, whereas, moderate amount of precipitation falls as snow (around
25%) during the winter season. Besides these two major precipitation periods, minor quantity
of rain falls either as post monsoon rain or as pre-monsoon rain. [38]
Monsoon precipitation - The monsoon causes about 75% of annual precipitation covering
almost the entire country. During summer season, south-westerly monsoon winds blow at
speeds as high as 30 km/hr. To get a clearer view of the
Figure 2.1: Do you Remember

16
These winds get divided into two branches, Arabian Sea branch and Bay of Bengal branch. The
monsoon winds of these two branches travel through and strike the mountains or hills which
cause the rain over the country [43]. On the Earth’s surface, there are asymmetries of land and
Ocean. The differential heating of land and Ocean causes variations in the intensity of the
annual oscillation of the thermal equator and hence regional variations in the intensity of
monsoon. The southwesterly wind flow occurring over most parts of Bangladesh and
Bangladeshi’s sea gives rise to southwest monsoon over Bangladesh from June to September.
2.2 Hydrological Cycle
Most of the earth’s water sources such as rivers, lakes, oceans and underground sources get
their supplies from the rains. Water rises up to the atmosphere as vapor from the earth, which
is then precipitated back in the form of rain. This evaporation and precipitation continues
forever and thereby, a balance is maintained between the two. This process is known as
hydrologic cycle. It is graphically represented as shown in Figure below.
Figure 2.2: Ecological Cycle

17
Water evaporates from exposed water surfaces like streams, rivers, and oceans in the form of
water vapor. As evaporation continues, the amount of atmospheric vapor goes on increasing.
But since atmosphere can hold only certain fixed amount of water vapor, a state is reached
when any further addition of vapor will get condensed on the surfaces. The vapor may get
condensed in different forms, such as mist, rain, snow, hail etc. The water which comes back
to the surface of the earth in its various forms like rain, snow etc. is known as precipitation.
The prospective precipitation in the area is primarily dependent upon the weather conditions
of the area like atmospheric pressure, temperature, humidity etc. The interaction between these
variables leads to formation of winds and cyclones, which cause precipitation.
The liquids are constantly changed into vapor through the process of evaporation. The
evaporation losses from water surface depend upon factors such as area of the water surface,
depth of the water in the water body, humidity, wind velocity, temperature, atmospheric
pressure, quality of water.
2.3 Walker Circulation
Sir Gilbert Walker was the first meteorologist systematically examined the relationship
between subcontinental monsoon rainfall and global circulation factors. The Walker
Circulation or the Southern Oscillation is an important mode of operation of the tropical
atmosphere generally characterized by the exchange of air between the eastern and western
hemispheres. The interaction between the atmosphere and the sea at the air-sea interface results
in the coupling of the circulation systems of the atmosphere at the ocean. Since 70% of the
earth’s surface is covered with water and changes in the sea surface temperature are much
slower than atmospheric deviations, it is apparent that the inter-annual variability of the sea
surface temperature may be responsible for the variability of the atmospheric circulation and
may be well reflected in the rainfall system. [13]

18
Chapter – 3 Thesis Lab Work Web Application
Rainfall prediction by leveraging historical data using machine learning models taking place in the
recent years by many researchers in universities all over the world to avoid climatological
unpredictability.
Machine learning has seen a massive rise in popularity in recent years (article). This has attributed
to availability of data, computing power and computational frameworks such as Apache Spark. It
has seen wide spread commercial adoption (publicly available list). Due to this track record and
the thesis authors commercial experience in this technology, the apache spark ecosystem was
selected to build a software application capable of applying multiple machine learning models to
a set of historical rainfall data.
Figure 3.1: Lab Work Environment

19
To analyze, data collection, model building, training, testing and prediction, we spent almost 1000
hours of lab work. In this process, we had to implement different types of functionality for common
task. We had to train, test and save the model to disk for future live data testing.
Testing using those model, is going to be complex and not user friendly.
Which is why we are planning to develop a web application by which anybody from anywhere can
see and use our developed model to predict rainfall over the web.
3.1 Training and Building Model:
For machine learning training and prediction, we collected rainfall data from Bangladesh
Meteorological Department (BMD) which has 46 years of rainfall from 1970 to 2016 for all 33-
weather station.
3.1.1DataPreparation:
Data we got from BMD, were not in well formatted to train and use for machine learning
algorithms input format. Those needed to do lots of cleansing and transposing. After cleaning and
transposing, we created two types of data file. One is monthly data and daily data.
3.1.2MonthlyData:
Monthly data has the calculated total monthly rainfall from the whole data file for each year and
station. It has columns like: Station, Year, Month and Rainfall.
3.1.3DailyData:
Daily data has the individual day wise rainfall data along with month, year and station. After
cleansing and transposing, the daily data file has columns like: Station, Year, Month, Day and
Rainfall. Data is look like as bellow:
20
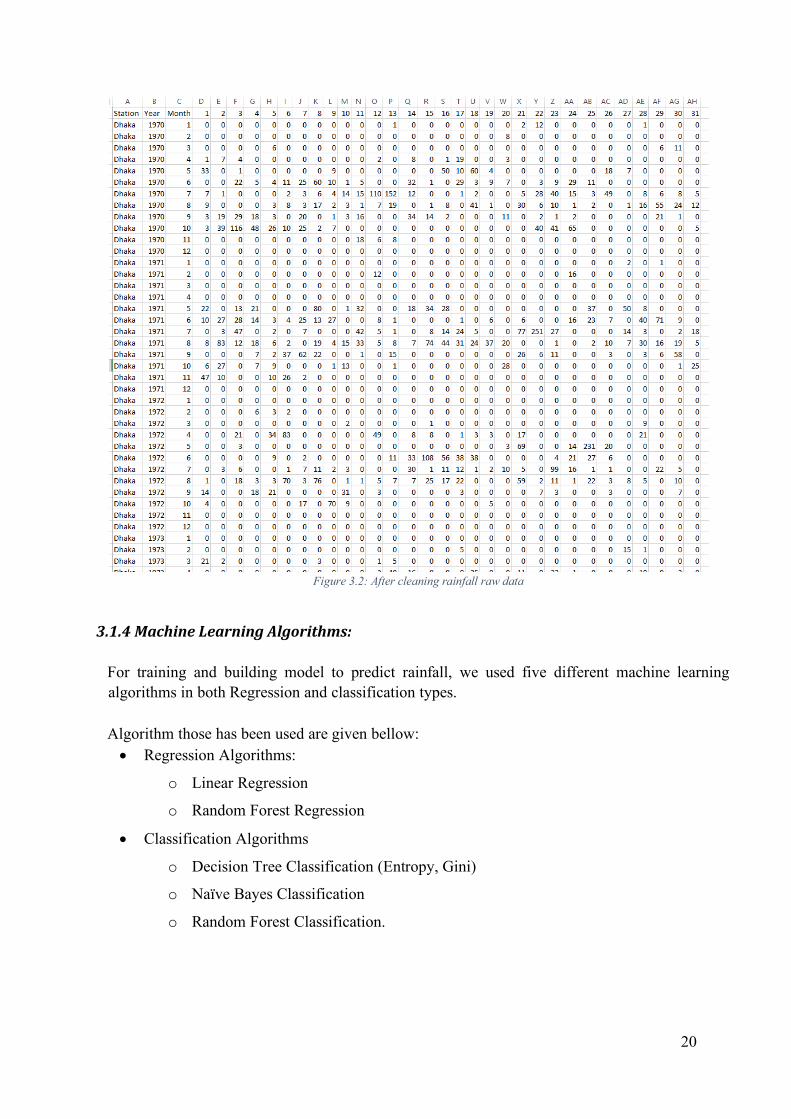
Figure 3.2: After cleaning rainfall raw data
3.1.4MachineLearningAlgorithms:
For training and building model to predict rainfall, we used five different machine learning algorithms in both Regression and classification types. Algorithm those has been used are given bellow: • Regression Algorithms:
o Linear Regression
o Random Forest Regression
• Classification Algorithms
o Decision Tree Classification (Entropy, Gini)
o Naïve Bayes Classification
o Random Forest Classification.

21
3.2 Implementation:
To develop and implement the prediction model, training, testing and prediction, we need to
choose machine learning library by which we can use our data. There are different popular well-
known machine learning libraries are available. Those are like: Google Tensorflow,
DeepLearning4j, Apache Spark, Scikit-Learn etc.
We used Apache Spark for our machine learning library and Scala as development platform.
3.2.1Technologythoseareusedinthisdevelopedlabwebapplication.• Apache Spark (ML) – Machine Learning Library [44]
• Scala – Programming Language [45]
• Scala Play Framework [46]
• HighChart – Graph Visualization [47]
• jQuery – JavaScript Library
• BootStrap, CSS, HTML
• Intellij Idea as IDE
3.2.2WhyApacheSpark: Apache Spark is an all-purpose data processing and machine learning tool can be used for a variety
of operations. Data scientist, application developer can integrate Apache Spark into their
application to query, analyze, transform as scale. It is 100 times faster than Hadoop MapReduce.
It can handle petabytes of data at once, distribute over a cluster of thousands of cooperating virtual
or physical servers. Apache Spark has been developed in Scala and it support Python, R, Java and
off course Scala.

22
3.3 Web Application:
Web application has been developed and integrated all features within the application where user
can view statistical data in graph. Also, can predict rainfall by choosing different year, month, and
station by using different machine learning algorithm.
The web application has been hosted to a server which can be access by using the given web url. Application URL:
3.4 Home Page:
Home page has the gist information about the whole research summary.
- Five types of algorithm have been used, those names were in the home page.
- Rainfall unit information
- Monthly Maximum Minimum Rainfall, Temperature, Humidity, Wind Speed value
- Daily Maximum Minimum Value for all four parameters
- Co-relation between “Rainfall” with feature column in Daily Data.
- Co-relation between “Rainfall” with feature column in monthly data.
- Naïve Bayes Classification Training, Testing accuracy for both Monthly and Daily Model
in 3 different output class (95, 50, 10) model.
- Random Forest Regression Evaluation Matrix both Monthly and Daily Model.
- Radom Forest Classification accuracy matrix for both monthly and daily model in 3
different output (95, 50, 10) class model.
- Decision Tree classification accuracy matrix for both monthly and daily model for 3
different output class models.

23
Figure 3.3: Machine Learning Lab Application Home Page
3.5 Statistical Average Data Visualization:
We have been provided 46 years of rainfall data from 1970 to 2016. Those data has been cleansed,
transposed and formatted and visualized in the graph on this application.
This page has all different types of graph for Rainfall, temperature, wind speed and humidity
related data for monthly, station wise and yearly.

24
Figure 3.4: Lab Application Statistical Average Data Graph
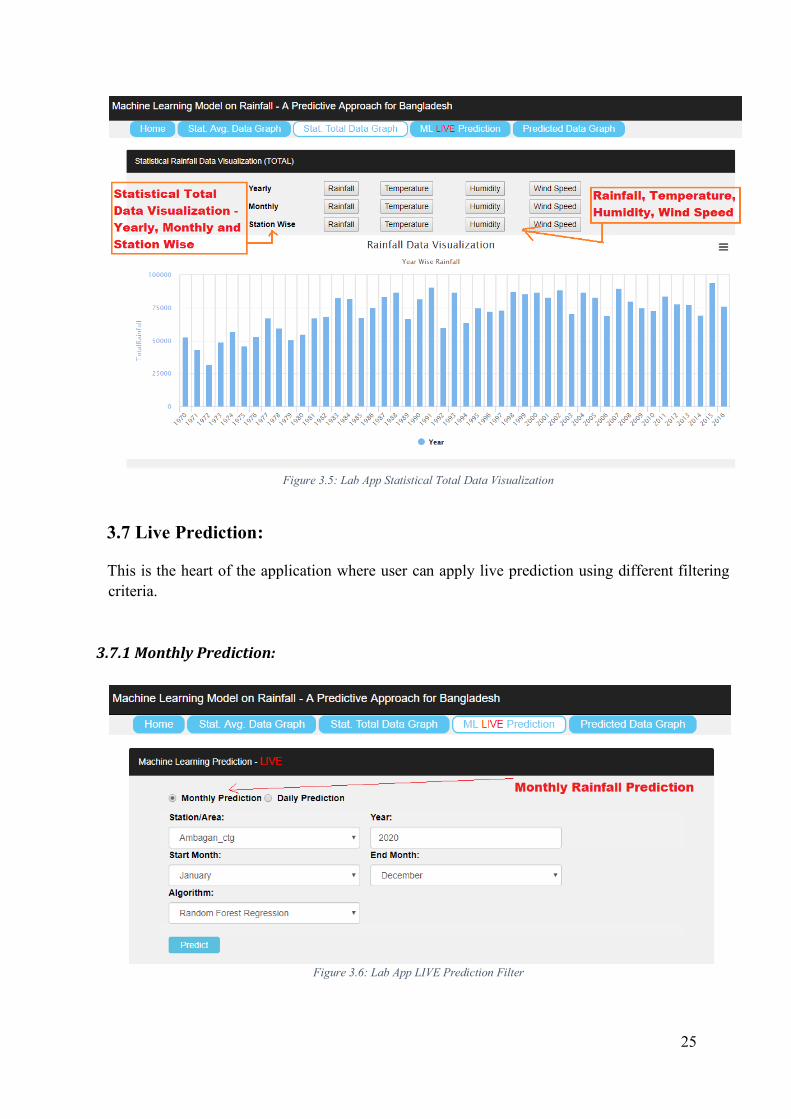
3.6 Statistical Total Data Visualization:
This page has the graphical visualization of total rainfall, total average temperature, humidity,
wind speed in the graphical view.
It has filtering option for Monthly, Yearly, Station Wise graph also have option to see temperature,
Rainfall, Wind Speed, Humidity.
25
Figure 3.5: Lab App Statistical Total Data Visualization
3.7 Live Prediction:
This is the heart of the application where user can apply live prediction using different filtering criteria.
3.7.1MonthlyPrediction:
Figure 3.6: Lab App LIVE Prediction Filter

26
3.7.2DailyPrediction:
Figure 3.7: Lab App Daily Prediction Filter
3.7.3FilteringCriteria:
User will have option to filter or select different criteria for prediction. Monthly or Daily: User can select monthly prediction or daily prediction. If user select monthly prediction, it needs to give Start Month, End Month.
If user select daily prediction, it needs to give Start Month, Then Start Day and End Day. Select Station: User needs to select any weather station from the list of 33 weather station in Bangladesh.
Year: User have option to give any year in numeric format to predict.
Start and End Month:

27
If the user selects Monthly prediction, it will have option to give both Start and End month. If the user selects only daily, it will give one Start Month.
Start Day, End Day: If user select Daily Prediction, it needs to give start day and end day for the prediction.
Algorithm Selection: For regression algorithm, it will not have any class list in the drop down.
If user select classification algorithm, user have to choose output class from the class drop down.

28
3.8 Prediction Result:
3.8.1RandomForestRegressionPredictionresultformonthlyfortheyearof2026,JanuarytoDecember.
Figure 3.8: Live Prediction Result using Random Forest Regression
3.8.2LinearRegressionDailyPredictionfortheyearof2030,July1stto15th.

29
Figure 3.9: Live Prediction Result using Linear Regression
3.9 Bulk Prediction Result:
We did bulk prediction programmatically from 2018 to 2040 for all Station and month.
We have all of those prediction result in graphical visualization format.

30
Figure 3.10: Bulk Prediction Data Visualization

31
Chapter – 4 Machine Learning - Classification Vs. Regression
Machine learning or the predictive modeling filed is primarily concerned with minimizing the error
of a model. Also expecting the most accurate predictions possible.
Often for machine learning algorithm selection, the first thing we will do to get to know whether
the learning task is classification or regression problem. Which can help to pick algorithm. For
understanding the classification and regression, the given bellow description will help.
Figure 4.1: Classification Vs Regression
4.1 Classification Problems:
For classification problem, the target value is a discrete number of values. In this classification
problem, the labels (Y) basically comes in categorical form and represent a finite e number of
classes. This classification algorithm will work for:
- By given input feature to predict, whether a cancer is in primary stage or not.
- Given an image to correctly classify as containing Dog or cat.

32
- From given email, whether it is spam or not. [31]
4.1.1 Type of classification:
- Binary Classification
- Multi-class classification
4.1.2 Algorithm of Classifications:
- Logistic Regression
- Naïve Bayes Classification
- Decision Tree Classification
- Random Forest Classification
- K-Nearest Neighbors
- Linear SVC (Support Vector Classifier)
- Etc. [31]
4.2 Regression Problems:
In the concept of regression problem, it is the goal to predict continuous valued output. Where
training label column will be a continuous value and it also predict the continue numeric value
instead of classification types of value.
4.2.1 Regression Algorithms:
- Linear Regression
- Random Forest Regression
- Support Vector Regression (SVR)
- Etc. [31]
4.3 Data Model:
In the rainfall prediction model, there is a requirement to be able to predict for both monthly and
daily prediction. To handle Monthly and Daily prediction, it needs to think for two different type
of model training where features column will be different.
- Daily Model (for daily data prediction)
- Monthly Model (for monthly data prediction)

33
4.4 Co-relation Matrix:
Co-relation matrix better different features column compared to label column.
Co-relation between label column “Rainfall” – Monthly Data
Feature Column Co-relation Value
Year 0.0198016893
StationIndex 0.061898457
Month 0.129563521
Table 4.1: Co-relation Matrix of Monthly Data
Co-relation between label column “Rainfall” – Daily Data
Feature Column Co-relation Value
Year 0.00833775848
StationIndex 0.02606314927
Month 0..05455440358
Day -0.00351661184
Table 4.2: Co-relation matrix of Daily Rainfall Data
4.5 Classification Model Data Setup:
Classification algorithm have to have classified data for the label or target column. But in our
current system we have continuous data for Rainfall which is the target variable.
Which is why, we needed to distinguish those value into several classification or output class.
Each number of classification data set has corresponding model training and built. By which user
can chose different classification parameter for testing the data. Which give different value for
different classification of target variable.

34
4.5.1Minimummaximumrainfalldatasetmatrix:
Monthly Type Minimum Maximum
Monthly 0 3001
Daily 0 590
Table 4.3: Minimum Maximum Rainfall Data Matrix
Classification matrix for both monthly type:
In our machine learning library, it only supports maximum 100 classification of the label column.
Which is why it has been taken three options to see different variation of classification and model
those are 95 output class, 50 output class and 10 output class.
The classification value has been calculated dynamically based on given output class number:
Figure 4.2: Code - Dynamic Class Value Calculation
The matrix is looking like this:
Monthly Type Min Max Output Class
Block Size Example:
Monthly 0 3001 95 31 If rainfall is 100, the value will be 100/31= 3.2
Monthly 0 3001 50 60 If rainfall is 100, the value will be 100/60= 2
Monthly 0 3001 10 300 If rainfall is 100, the value will be 100/300= 0.3
Daily 0 590 95 6 If rainfall is 100, the value will be 100/6= 16.6
Daily 0 590 50 11 If rainfall is 100, the value will be 100/6= 9.09
Daily 0 590 10 59 If rainfall is 100, the value will be 100/6= 1.6
Table 4.4: Data Classification Matrix

35
4.5.2MonthlyPredictionModel–LabelandFeaturecolumns:
For monthly prediction, the model has been developed using those features and label column data
as data set. After training the model, the model file has been saved into the disk for future use.
For testing, that specific model has been used where test data is dynamically generated according
to use input from the developed application.
Column Type Column Name
Label Rainfall (Classified)
Feature-1 Station
Feature-2 Year
Feature-3 Month
Table 4.5: Monthly Prediction Feature Column
4.5.3DailyPredictionModel–LabelandFeaturecolumns:
Daily prediction model needs to have daily data in the data set, and for model building, it needs to
have the day value in the model also. Which is why feature column having the day column for the
Daily model building.
Column Type Column Name
Label Rainfall (Classified)
Feature-1 Station
Feature-2 Year
Feature-3 Month
Feature-4 Day
Table 4.6: Daily Prediction Feature and Label column

36
Chapter – 5
Regressions Analysis and Rainfall Prediction
Regression Analysis is one of the most popular statistical methods in Data Science to understand
the relationships among the variables of your interests better. And using it appropriately can help
us predict how a variable of our subject area/interest will look like in future based on other
variables.
And one of the most common ways for performing the analysis is to build linear regression models.
In Exploratory, you can build them directly in the UI with a few clicks.
5.1 Liner Regression
Linear regression is one of the most well understood and well-known algorithms in the statistical
and machine learning world. Linear regression has been developed in the field of statistics, which
has been studied as a model for understanding the relationship between input and output of
numerical variables. And now it has been borrowed by machine learning. It is bath a statistical
algorithm also a machine learning algorithm.
It is a very simple approach for supervised learning. Though it may seem, there are several other
best practice and most used algorithm compared to linear regression, but still is a useful and widely
used statistical learning method. It is used to predict a quantitative response Y from the predictor
variable X. [18, 19]

37
Figure 5.1: Linear Regression Point and Data Example
For Linear regression it is assumed that there is a linear relationship between X and Y.
The mathematical relationship or equation is look like this:
Where:
• y is the response
• β values are called the model coefficients. These values are “learned” during the model
fitting/training step.
• β0 is the intercept
• β1 is the coefficient for X1 (the first feature)

38
• βn is the coefficient for Xn (the nth feature)
To calculate the prediction in practical it needs have Standard deviation, mean value and
correlation coefficient value of corresponding data set’s individual data.
Standard Deviation:
where ∑ means "sum of", x is a value in the data set, µ is the mean of the data set, and N is the
number of data points in the population.
5.1.1CorrelationCoefficient
Where:
- n is the sample size.
- Xi, Yi are the single samples indexed with i.
Fundamentally there is no different for simple or multiple regression. Both works fine for different
parameters. For multiple regression, the equation will be like this:
Where
- B : Different coefficient
- X : Various independent variables.

39
5.1.2ModelEvaluation
As this is a regression problem, it is application for the accuracy here that much. Regression
problem has evaluation matrix for comparing continuous values and for this linear regression
problem, Root Mean Squared Error (RMSE) has been used. RMSE is the square root of the mean
of squared errors (MSE).
Using the R2 and RMSE value, it can be determined the accuracy or ability to predict the value
using linear regression.
Linear Regression Drawbacks:
Linear regression is very well known and well-studied regression algorithm to predict and it old
also. But there are some drawbacks of it, because it is making an assumption that the data it is
using will have linear relationship, but in the real-world scenario that is not true.
[20, 21]
5.1.3ModelBuildingandTraining:
In this research work, our goal is to build or create a model for predicting rainfall using different
types of feature parameters and label columns.
For model building and development, we used Apache Spark as the machine learning library and
Scala as programming language [44, 45].
Model Preparation using Apache Spark in Scala:

40
5.1.4ModelDataType
It has two types of model those are:
- Monthly Data Model
- Daily Data Model
For Monthly Data Model the columns are:
- Feature Column:
o Station
o Year
o Month
- Label Column:
o Rainfall
For Daily Data Model the columns are:
- Feature Column:
o Station
o Year
o Month
o Day
- Label Column:
o Rainfall
41
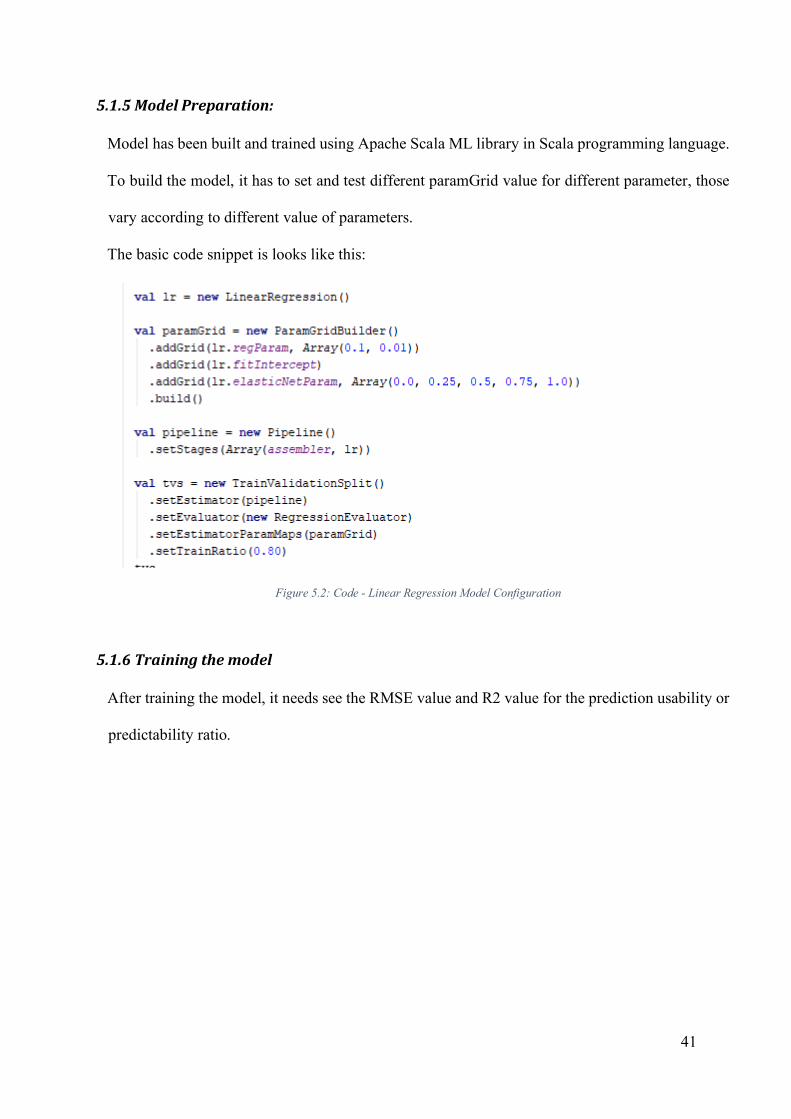
5.1.5ModelPreparation:
Model has been built and trained using Apache Scala ML library in Scala programming language.
To build the model, it has to set and test different paramGrid value for different parameter, those
vary according to different value of parameters.
The basic code snippet is looks like this:
Figure 5.2: Code - Linear Regression Model Configuration
5.1.6Trainingthemodel
After training the model, it needs see the RMSE value and R2 value for the prediction usability or
predictability ratio.

42
Figure 5.3: Code - Linear Regression Model Fitting and Accuracy Testing
After saving the linear regression model, model files were saved to the disk.
Figure 5.4: Linear Regression Model in Disk

43
5.1.7ModelTesting:
Model has been tested using different input data value from file.
As there is an application has been developed using this algorithm to predict rainfall value from
web. And that application is usable for all from anywhere, which have option to predict using live
input data.
Figure 5.5: Code - Linear Regression LIVE Testing Result
5.1.8MonthlyPrediction:
Filter the prediction using user interface, which is available online for everybody.
Figure 5.6: Linear Regression – Monthly Live Testing Filtering UI

44
5.1.9PredictionResult
Figure 5.7: Linear Regression – Monthly LIVE Prediction Result
5.1.10DailyPrediction
Daily prediction for rainfall feature can be accessible from anywhere and anybody can use that
prediction model to predict the rainfall by selecting:
- Year
- Station
- Start Month
- Start Day
- End Day
- Algorithm Name

45
Figure 5.8: Linear Regression - Daily LIVE Prediction Filtering
5.1.11DailyPredictionResult
Figure 5.9: Linear Regression - Daily LIVE Prediction Result
46
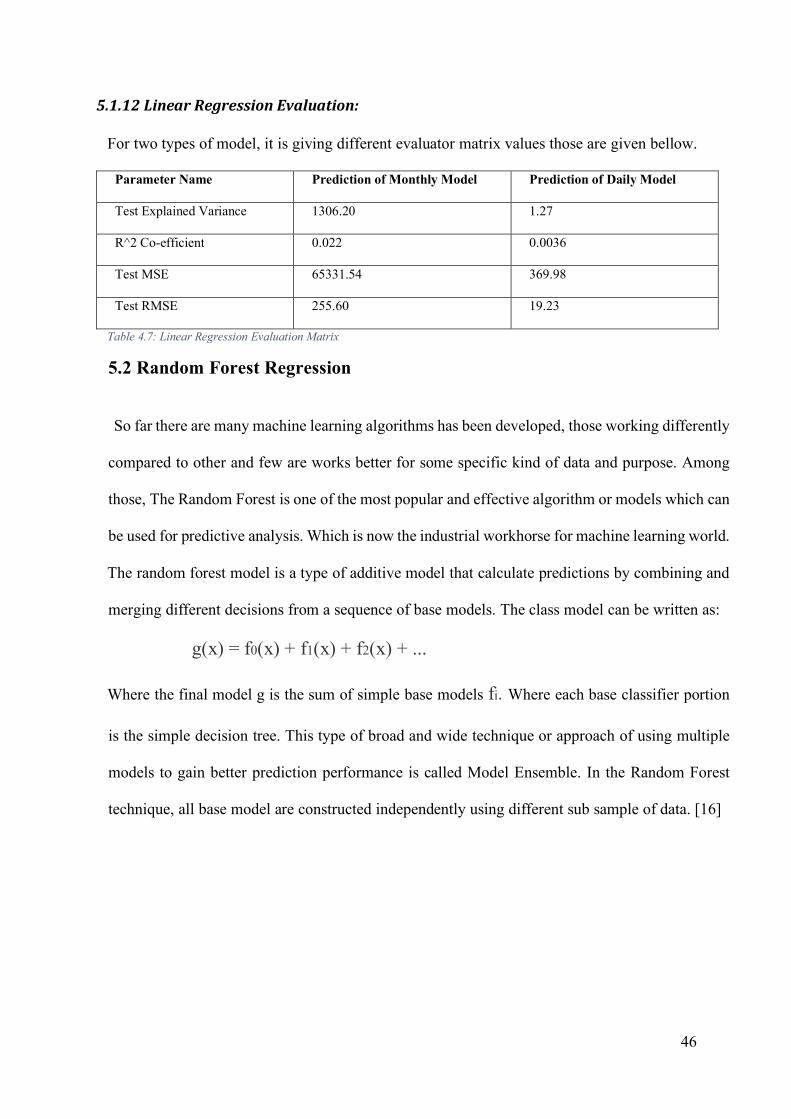
5.1.12LinearRegressionEvaluation:
For two types of model, it is giving different evaluator matrix values those are given bellow.
Parameter Name Prediction of Monthly Model Prediction of Daily Model
Test Explained Variance 1306.20 1.27
R^2 Co-efficient 0.022 0.0036
Test MSE 65331.54 369.98
Test RMSE 255.60 19.23
Table 4.7: Linear Regression Evaluation Matrix
5.2 Random Forest Regression
So far there are many machine learning algorithms has been developed, those working differently
compared to other and few are works better for some specific kind of data and purpose. Among
those, The Random Forest is one of the most popular and effective algorithm or models which can
be used for predictive analysis. Which is now the industrial workhorse for machine learning world.
The random forest model is a type of additive model that calculate predictions by combining and
merging different decisions from a sequence of base models. The class model can be written as:
g(x) = f0(x) + f1(x) + f2(x) + ...
Where the final model g is the sum of simple base models fi. Where each base classifier portion
is the simple decision tree. This type of broad and wide technique or approach of using multiple
models to gain better prediction performance is called Model Ensemble. In the Random Forest
technique, all base model are constructed independently using different sub sample of data. [16]

47
Figure 5.10: Random Forest Regression
5.2.1WhyRandomForest:
Under the hood, Random Forest algorithm is working using different/multiple decision trees. A
decision tree is built top-down from a root note and then partitioned the data into different sub set
which contains instances with similar values.
For regression tree, as the expected or target variable is a real value in number, it fit a regression
model for the target variable using each of the independent variables. After that, each independent
variable data is splitting into several split points. And the Sum of Squared Error (SSE) has been
calculated for each split point between the actual values and the predicted values. This process
will recursively continue until the entire data is being covered.
Random forest can be used for regression analysis and are called as Regression Forest. [17]
Our Approach:
For rainfall prediction analysis, it needs to have a process, when it can give the real value as
prediction instead of classification value. That’s why random forest comes into first place.

48
5.2.2ModelData:
It has two types of model those are:
- Monthly Data Model
- Daily Data Model
For Monthly Data Model the columns are:
- Feature Column:
o Station
o Year
o Month
- Label Column:
o Rainfall
For Daily Data Model the columns are:
- Feature Column:
o Station
o Year
o Month
o Day
- Label Column:
o Rainfall
5.2.3ModelBuildingandTraining:
In this research work, our goal is to build a model for predicting rainfall using different types of
feature parameters and label columns.
For model building and development, we used Apache Spark as the machine learning library and
Scala as programming language.
Model Preparation using Apache Spark in Scala:
As there are two types of model it needed to build and predict two types of prediction those are
Monthly and Daily Prediction.

49
These two types of prediction is manually handled while model building with a parameter, but for
both type, all parameter are same.
5.2.4ModelPreparation:
For model preparation, it can be used different parameter by which it can be found optimal result
according the expected. Each combination of parameters do the cross validation and keep the best
model according to some performance indication. Parameters were fixed by changing and
checking the performance accuracy.
Figure 5.11: Code - Random Forest Regression Param Configuration
50
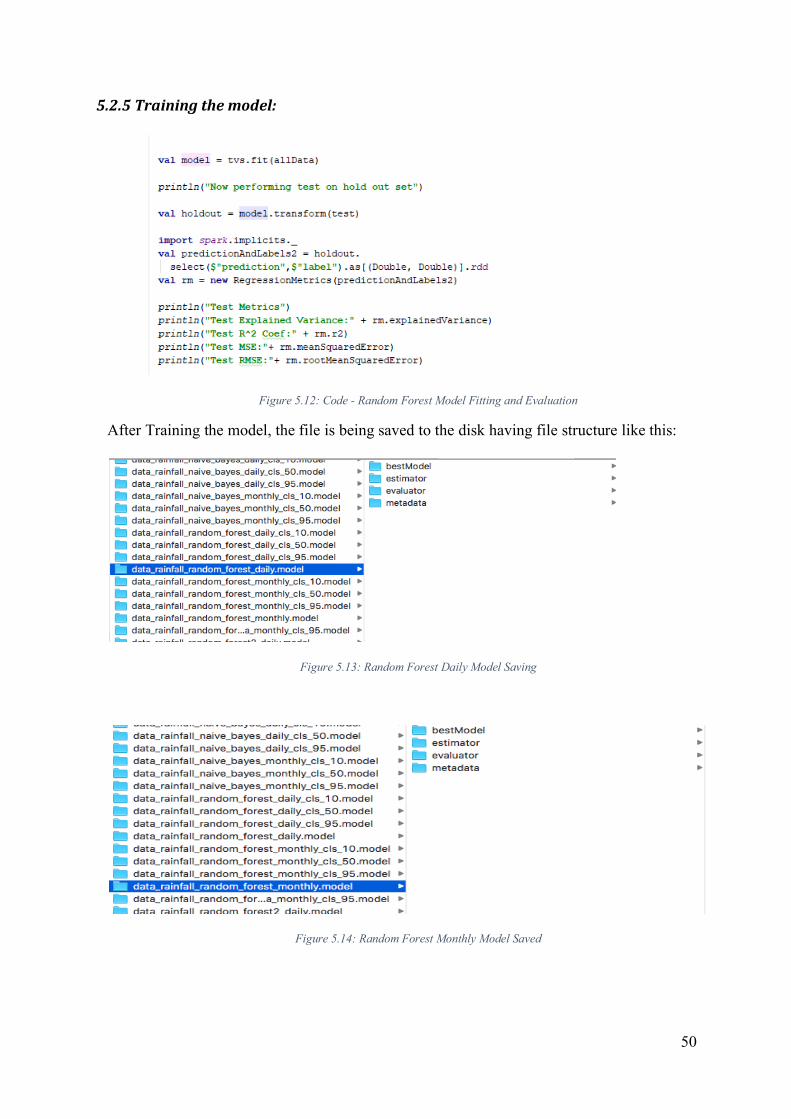
5.2.5Trainingthemodel:
Figure 5.12: Code - Random Forest Model Fitting and Evaluation
After Training the model, the file is being saved to the disk having file structure like this:
Figure 5.13: Random Forest Daily Model Saving
Figure 5.14: Random Forest Monthly Model Saved

51
5.2.6ModelTesting:
For model testing in lab work, I retrieved the model that was created while training the model and
use that saved model to test for new dynamic test data.
It has two different type of model for training, testing or prediction like Monthly and Daily.
For both type code is same, it will decide dynamically based on input type or desired monthly type
then call the corresponding model from the disk.
Test code snippet are given bellow:
Figure 5.15: Code - Random Forest Regression LIVE Testing Processing
5.2.7PredictionfromLabWorkApplication:
One web application has been developed for the prediction, by which anybody can select desired
algorithm, can give input/feature columns value form UI and make the prediction.
URL: http://ml.bigalogy.com
5.2.8MonthlyPrediction:
The application is open for all, and anybody can predict rainfall using own parameters.
The filter or selection of prediction UI is looks like this:

52
Figure 5.16: Random Forest Regression Monthly Prediction Filter
5.2.9PredictionResult:
Based on given filtering criteria the application will give the prediction value in the response page
which is looking like this:
Figure 5.17: Random Forest Regression Monthly LIVE Prediction Result

53
5.2.10RandomForestRegressionEvaluation:
For two types of model, it is giving different evaluator matrix values those are given bellow.
Parameter Name Prediction of Monthly Model Prediction of Daily Model
Test Explained Variance 23466.43 36.67
R^2 Co-efficient 0.57 0.12
Test MSE 28965.64 327.21
Test RMSE 170.19 18.09
Table 4.8: Random Forest Regression Evaluation Matrix
5.3 Comparative Analysis with actual Vs Predicted for Both Regression
Below graphs shows the comparative analysis of the actual Vs predicted values. We tempted to
test the model with a year for which data included in the training set. We wanted to see how it
would be with the actual vs predicted values. Here we used the Dhaka Weather station for 2015’
data.
Figure 5.18: Regression Analysis Model Comparative Graph
0
100
200
300
400
500
600
700
January
February
March
AprilMay
JuneJuly
August
September
October
November
December
Regression Algorithm comparative Analysis
Actual Random Forest Reg Linear Regression

54
Chapter – 6
Classification Analysis and Rainfall Prediction
The main goal of classification is to predict the target class (Yes/ No). If the trained model is for
predicting any of two target classes. It is known as binary classification. Considering the student
profile to predict whether the student will pass or fail. Considering the customer, transaction details
to predict whether he will buy the new product or not. These kind problems will be addressed with
binary classification. If we have to predict more the two target classes it is known as multi-
classification. Considering all subject details of a student to predict which subject the student will
score more. Identifying the object in an image. These kind problems are known as multi-
classification problems.
6.1 Decision Tree Classification
Among supervised machine learning, Decision Tree classification is one of the popular
classification tree algorithm where the data is continuously split according to a certain parameter.
The tree can be explained by two entities, those are Nodes and the second is Leaves. Leaves are
the decisions or the final outcomes. On the other hand, decision nodes are where the data is split.
In decision tree, the tree itself is the model, which will be used to predict the target variable [23].
Figure 6.1: Decision Tree - Process Visualization

55
6.1.1Entropy
Entropy is defined by the degree of randomness of elements or in other way, it is measure of
impurity. Mathematically, it can be calculated with the help of probability of the items as like the
given bellow equation as:
It is the measure of the amount of uncertainty or randomness in data.
It is the negative summation of probability times the log of probability of item x. [24]
Lower value of H(s) give the less uncertainty while higher value imply high uncertainty.
Let’s have a data of some binary decision like:
From above data set, the entropy can be calculated like this:
One thing to remember, the entropy value 0 means, all member belongs to the same class and 1
means that half of them belong to one class and other half belongs to other class.
Here the value 0.940 which means the distribution is fairly random.
For more than 2 labels, the entropy formula will be as follows:
Yes No Total
9 5 14

56
6.1.2GiniIndexorGiniSplit
The impurity (purity) measure used in building decision tree in CART is Gini Index.
The Gini index is calculated by subtracting the sum of the squared probabilities of each class from
one.
Usability of Gini Index:
- It is used for larger partitions.
- Perfectly classified gini index would be zero.
- Evenly distributed would be 1 – (1 / No of classes)
- Algorithm works like: 1 – ( P(class1)^2 + P(class2)^2 + … + P(classN)^2)
- Maximum value of gini index could be when all target values are equally distributed.
- Minimum value of gini index will be 0, when all observations belongs to one label. [26]
Advantages of Decision Tree:
- Easy to understand
- Useful in data exploration
- Less data cleaning required
- Data type is not a constraint.
- Non-parametric method.
Disadvantages of Decision Tree:
- Overfitting
- Not fit for continuous variables. [25]
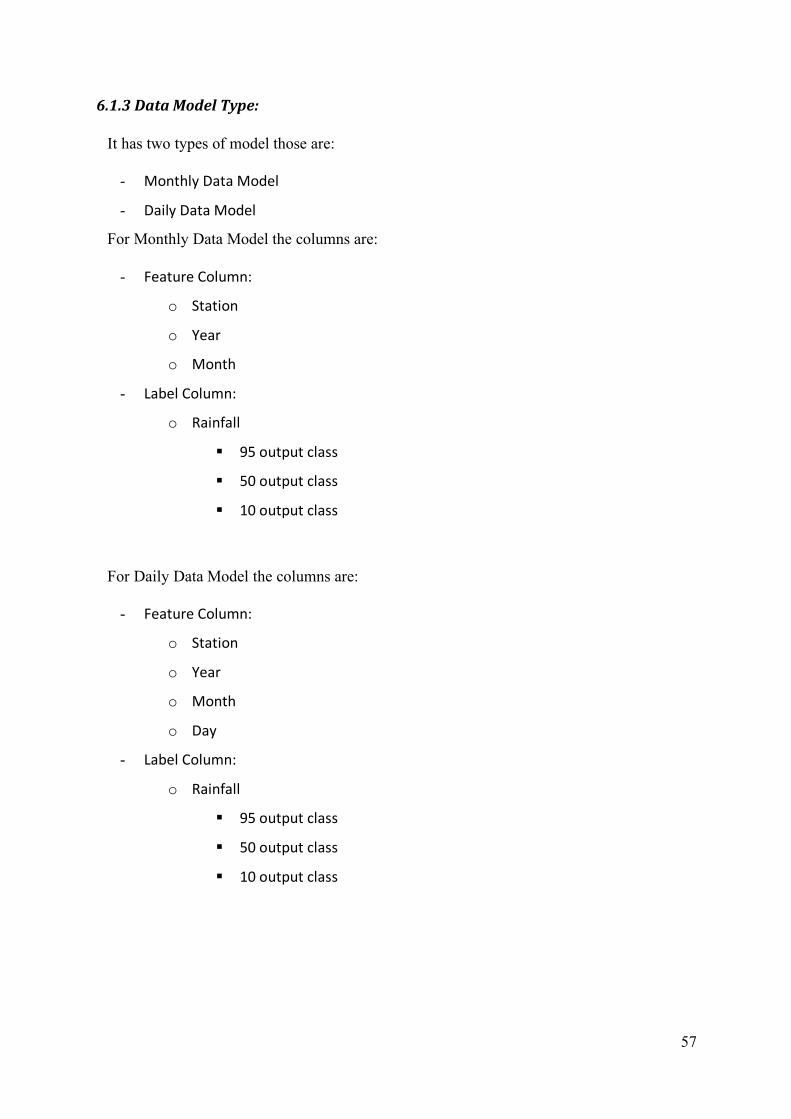
57
6.1.3DataModelType:
It has two types of model those are:
- Monthly Data Model
- Daily Data Model
For Monthly Data Model the columns are:
- Feature Column:
o Station
o Year
o Month
- Label Column:
o Rainfall
§ 95 output class
§ 50 output class
§ 10 output class
For Daily Data Model the columns are:
- Feature Column:
o Station
o Year
o Month
o Day
- Label Column:
o Rainfall
§ 95 output class
§ 50 output class
§ 10 output class

58
6.1.4ModelBuildingandTraining:
First of all, data has been recalculated according to the classification value and those data has been
used to train the model.
After the model training, the trained model has been saved to disk.
Which will be used for testing in future.
Figure 6.2: Code - Decision Tree Model Configuration
After saving the model file into disk, the file will look like this:

59
Figure 6.3: Decision Tree Model File in Disk
6.1.5TestingtheModel
It can be testing programmatically using the same model which was saved to the disk and then
giving the test data in identical data format.
Figure 6.4: Code - Decision Tree Testing
6.1.6PredictionusingWebApplication
Web based application has been developed by which anybody from anywhere can test and do live
prediction according to user’s data choice.
Few screenshots have been added here of that web application.

60
6.1.7PredictionFiltering
User will have option to choose two different algorithms from the drop down for Decision Tree
those are:
- Decision Tree Classification – Entropy
- Decision Tree Classification – Gini
6.1.7.1MonthlyPrediction:
Figure 6.5: Decision Tree LIVE monthly prediction
Having two different decision tree algorithms:
It has three output class under the decision tree each algorithm:

61
6.1.7.2DailyPrediction:
Figure 6.6: Decision Tree LIVE Monthly Prediction Filter
6.1.8PredictionResult
Prediction result taken from the lab work application by putting some future time to predict the
amount of rainfall we are expecting predicted by our model.
6.1.8.1MonthlyPredictionResult:
Figure 6.7: Decision Tree Monthly Live Prediction Result
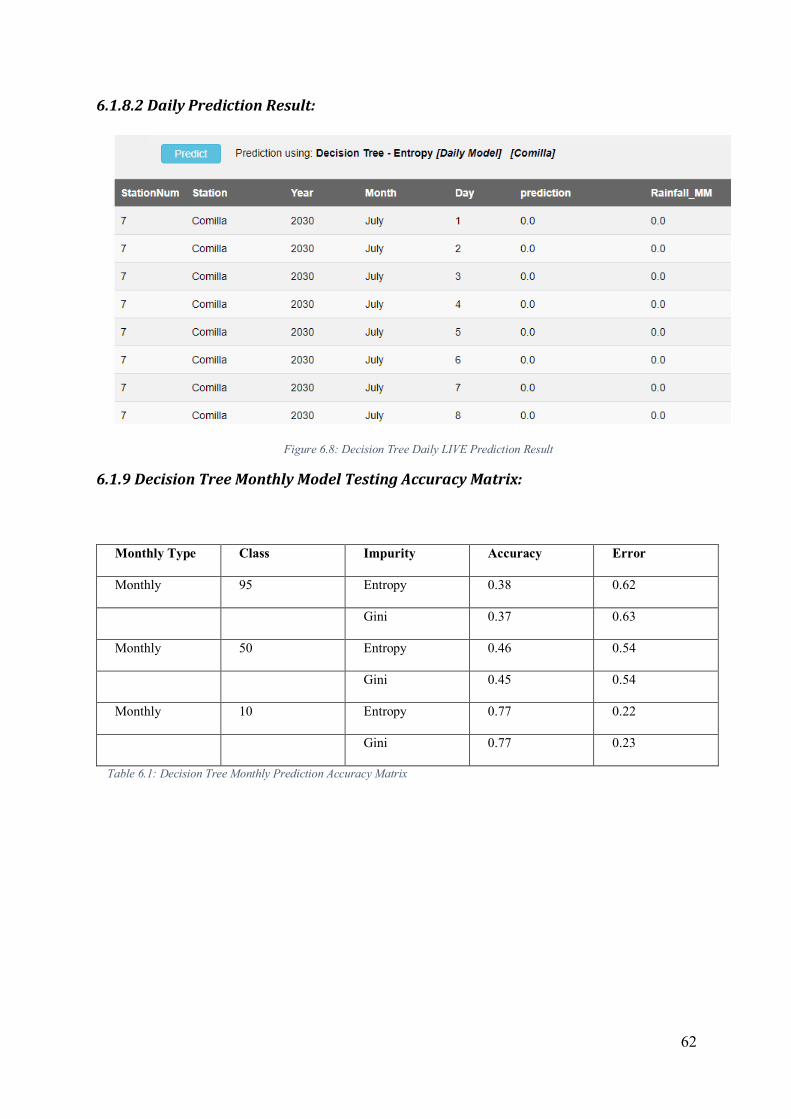
62
6.1.8.2DailyPredictionResult:
Figure 6.8: Decision Tree Daily LIVE Prediction Result
6.1.9DecisionTreeMonthlyModelTestingAccuracyMatrix:
Monthly Type Class Impurity Accuracy Error
Monthly 95 Entropy 0.38 0.62
Gini 0.37 0.63
Monthly 50 Entropy 0.46 0.54
Gini 0.45 0.54
Monthly 10 Entropy 0.77 0.22
Gini 0.77 0.23
Table 6.1: Decision Tree Monthly Prediction Accuracy Matrix

63
6.2 Naïve Bayes Classification:
Naïve Bayes classifiers are a family of simple probabilistic classifiers based on applying Bayes
theorem with strong (Naive) independence assumptions between the features. We can say that; a
Naïve Bayes classifier assume that the presence of a particular feature or independent variable in
a class is unrelated to the presence of any other independent or feature variable.
Naïve Bayes model is easy to build and it is useful for large data sets.
Bayes theorem having a way of calculating posterior probability P(c|x) from P(c), P(x) and P(x|c).
Look at the equation below:
Where:
- P(c|x) is the posterior probability of class (c, target) given predictor (x, attributes).
- P(c) is the prior probability of class.
- P(x|c) is the likelihood which is the probability of predictor given class.
- P(x) is the prior probability of predictor.
Given example will give the execution flow or calculation flow of the Naïve Bayes Theorem:
Sample Example Data Set:
Given bellow is the sample data set of playing gold based on weather condition.

64
Figure 6.9: Sample Naive Base Data Set
To find out the paly, if weather is Sunny, the equation will be:
P(Yes | Sunny) = P( Sunny | Yes) * P(Yes) / P (Sunny)
Here we have
P (Sunny |Yes) = 3/9 = 0.33
P(Sunny) = 5/14 = 0.36
P( Yes)= 9/14 = 0.64
Now, P (Yes | Sunny) = 0.33 * 0.64 / 0.36 = 0.60, which has higher probability. [27]
6.2.1Advantages:
- Naïve Bayes classification is easy and fast to predict class of test data set. Also, well in
multi class prediction.
- Perform well for categorical variable compared to numerical variables.
6.2.2 Disadvantages
- If categorical variable has a category in test data set, which was not observed in training data set, then the model will assign a zero probability and will be unable to make a prediction.
- It is almost impossible that we get a set of predictors which are completely independent. [27]

65
6.2.3DataBasedModelType
It has two types of model those are:
- Monthly Data Model
- Daily Data Model
For Monthly Data Model the columns are:
- Feature Column:
o Station
o Year
o Month
- Label Column:
o Rainfall
§ 95 output class
§ 50 output class
§ 10 output class
For Daily Data Model the columns are:
- Feature Column:
o Station
o Year
o Month
o Day
- Label Column:
o Rainfall
§ 95 output class
§ 50 output class
§ 10 output class

66
6.2.4ModelBuildingandTraining:
First of all, data has been recalculated according to the classification value and those data has been
used to train the model. After the model training, the trained model has been saved to disk.
Which will be used for testing in future.
Figure 6.10: Code - Naive Bayes Traing Model
After saving the model file into disk, the file will look like this:
Figure 6.11: Naive Bayes Model Saved to Disk

67
6.2.5TestingtheModel:
It can be testing programmatically using the same model which was saved to the disk and then
giving the test data in identical data format.
Figure 6.12: Code - Naive Bayes Model Testing
6.2.6PredictionusingWebApplication:
Web based application has been developed by which anybody from anywhere can test and do live
prediction according to user’s data choice.
Few screen shots have been added here of that web application.
6.2.7PredictionFiltering
User will have option to choose the Naïve Bayes classifier algorithm from the drop down.
6.2.7.1MonthlyPrediction:
Figure 6.13: Naive Bayes Monthly LIVE Prediction UI

68
It has three output class under the decision tree each algorithm:
6.2.7.2DailyPrediction
Figure 6.14: Naive Bayes Daily Live Prediction Filter
6.2.8PredictionResult:
Result shown in this picture taken from the Model UI application as mentioned in Chapter 2.

69
6.2.8.1MonthlyPredictionResult:
Figure 6.15: Naive Bayes Monthly LIVE Prediction Result
6.2.8.2DailyPredictionResult:
Figure 6.16: Naive Bayes Daily Live Prediction Result

70
6.2.9NaïveBayesModelAccuracyMatrix:
Monthly Type Class Accuracy
Monthly 10 0.74
Monthly 50 0.40
Monthly 95 0.34
Daily 10 0.96
Daily 50 0.82
Daily 95 0.76
Table 6.2: Naive Bayes Classification Model Accuracy Matrix

71
6.3 Random Forest Classifier
Random Forest is an ensemble technique which takes a subset of observation and a subset of
variables to build a decision trees. It builds multiple similar types of decision tree and put together
to get a more accurate and stable prediction. It kinds of democratic voting system where result will
come by maximum voting from a panel of independent voter. This is how the final prediction
better than the best judge.
Figure 6.17: Random Forest Classifier Diagram
Tree can be simplified by using the given image:
Figure 6.18: Random Forest Classifier Flows

72
Random forest algorithm is a supervised classification algorithm which create the forest with a
number of trees. The more tress in the forest, the more robust the forest will look like. In this same
why, the random forest classifier work. The higher the number of trees in the forest gives the better
accuracy result [29].
6.3.1HowRandomForestAlgorithmWorks
Random Forest creation pseudocode:
- Randomly select “K” features from the total of “m” features.
o Where K << m
- Among the “K” features, calculate the node “d” using the best split point.
- Split the node into child nodes using best split.
- Repeat the step 1 to 3 until “i” number of nodes has been reached.
- Build forest by repeating steps 1 to 4 for “n” number times to create “n” number of tress.
Initially random forest algorithm starts with randomly selecting “k” features out of total “m”
features. [22]
Figure 6.19: Random Forest Classifier Data Distribution Example

73
Uses of random Forest Algorithm:
- Banking
- Medicine
- Stock Market
- E-Commerce.
6.3.2AdvantagesofRandomForestClassifier:
- There is an overfitting problem in classification algorithm, and random forest algorithm
will avoid the overfitting problem.
- It can be used for both classification and regression task.
- It also can be used to determining the most important features from the training dataset.
Means, it will help on feature engineering. [yz-15]
6.3.3DataBasedModelType
It has two types of model those are:
- Monthly Data Model - Daily Data Model
For Monthly Data Model the columns are:
- Feature Column:
o Station
o Year
o Month
- Label Column:
o Rainfall
§ 95 output class
§ 50 output class
§ 10 output class

74
For Daily Data Model the columns are:
- Feature Column:
o Station
o Year
o Month
o Day
- Label Column:
o Rainfall
§ 95 output class
§ 50 output class
§ 10 output class
6.3.4ModelBuildingandTraining
First of all, data has been recalculated according to the classification value and those data has been
used to train the model. After the model training, the trained model has been saved to disk.
Which will be used for testing in future.
Figure 6.20: Random Forest Classifier Model Configuration

75
After saving the model file into disk, the file will look like this:
Figure 6.21: Random Forest Classifier Model Saved
6.3.5TestingtheModel
It can be testing programmatically using the same model which was saved to the disk and then
giving the test data in identical data format.
Figure 6.22: Code - Random Forest Classifier Model Testing

76
6.3.6PredictionusingWebApplication:
Web based application has been developed by which anybody from anywhere can test and do live
prediction according to user’s data choice.
Few screen shots have been added here of that web application.
6.3.7PredictionFiltering:
User will have option to choose the Random Forest classifier algorithm from the drop down.
6.3.7.1MonthlyPrediction
Figure 6.23: Random Forest Classifier Monthly Prediction Filter
It has three output class under the decision tree each algorithm:

77
6.3.7.2DailyPrediction
Figure 6.24: Random Forest Classifier Daily LIVE Filter
6.3.8PredictionResult:
6.3.8.1MonthlyPredictionResult:
Figure 6.25: Random Forest Classifier LIVE Monthly Predict Result
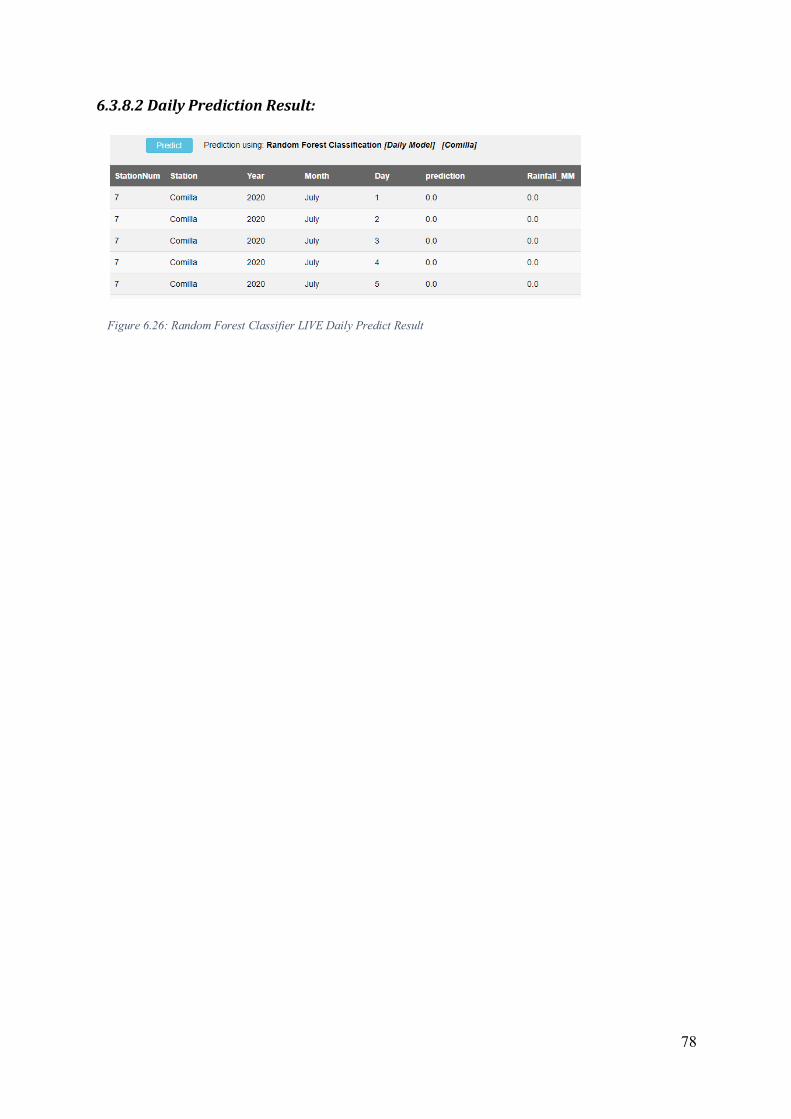
78
6.3.8.2DailyPredictionResult:
Figure 6.26: Random Forest Classifier LIVE Daily Predict Result

79
6.3.9RandomForestModelAccuracyMatrix:
Monthly Type Class Accuracy
Monthly 10 0.78
Monthly 50 0.46
Monthly 95 0.37
------------ -------------- ------------------
Daily 10 0.97
Daily 50 0.84
Daily 95 0.79
Table 6.3: Random Forest Classification Accuracy Matrix
6.4 Comparative Analysis of the Classification Algorithms Model
In this section, we tried to have a comparative analysis with all the classification model’s
prediction vs Actual value. We Tried to predict with 2015’s data that is also included in the training
set. Analysis have been done for “Dhaka” weather station.
Figure 6.27: Comparative Classification Analysis output 10
Different Class Variation predicts differently, now we tried with Call 50 for the “Dhaka” Station
for the 2015 data.
0100200300400500600700
January
February
March
AprilMay
JuneJuly
August
September
October
November
December
Comparative Classification Analysis - Output Class 10 For "Dhaka" Station Only
Actual Random Forest Class Decission Tree Entropy Decission Tree Gini

80
Figure 6.28: Comparative Classification Analysis output 50
This time we will try to compare the actual vs predicted values with another class for the 2015
data for Dhaka weather station only
Figure 6.29: Comparative Classification Analysis output 95
0
100
200
300
400
500
600
700
January
February
March
AprilMay
JuneJuly
August
September
October
November
December
Comparative Classification Analysis - Output Class 50 for 2015, Dhaka Station
Actual Random Forest Class Decission Tree Entropy Decission Tree Gini
0
100
200
300
400
500
600
700
January
February
March
AprilMay
JuneJuly
August
September
October
November
December
Comparative Classification Analysis - Output Class 95, 2015, Dhaka
Actual Random Forest Class Decission Tree Entropy Decission Tree Gini

81
Chapter – 7
Conclusion and Future Scope
7.1 Conclusion
The present research work is focused on the development of models for long term rainfall
prediction for different regions of Bangladesh. Three methodologies are employed-
a. Machine Learning rainfall prediction models are developed using Year, station, day and
month parameters as predictors and Rainfall column as the target or label column.
b. Three classification algorithms have been used to developed classification-based
rainfall prediction, where rainfall was the label or target parameter, two different
approach – monthly and daily.
c. Two regression machine algorithms have been developed using same feature and label
columns in two different approach – monthly and daily.
These models are validated based on meteorological data available from BMD. Present study
shows that random forest regression also classification model is giving better performance or
accuracy then linear regression. Among all algorithm (both classification and regression), the
random forest regression and random forest classification is giving better result compared to
others.
For classification model, we developed 3 different types of model based on target column value
classification. We classified the output column in 10, 50 and 95 different classification by
calculating Rainfall value using the Min-Max value of the column. In our observation, less
number of output class model giving better accuracy than the large number of output class. In
our analysis, all classification algorithm those are built by 10-output class are giving better
accuracy.

82
7.1.1.ClassificationAlgorithmAccuracy:
Classification Algorithm Accuracy
Classes
10 50 95 Daily Monthly Daily Monthly Daily Monthly
Naive Bayes Classification 0.95
0.73 0.81 0.40 0.76
0.33
Random Forest Classifier Accuracy 0.97
0.78 0.84 0.46 0.79 0.36
Decision Tree Algorithm -Entropy 0.9737 0.7752 0.8450 0.4616 0.7972 0.3824 Decision Tree Algorithm -Gini 0.9731 0.7712 0.8450 0.4570 0.7984 0.3713
Table 7.1 Classification Algorithms Accuracy Matrix
Figure 7.1: Classification Algorithm Accuracy for Monthly Model
Figure 7.2: Classification Algorithms Accuracy - Daily Model
0
20
40
60
80
100
120
Naïve BayesClassification
Random ForestClassification
Decision Tree -Entropy
Decision Tree - gini
Classification Algorithm Accuracy - Monthly
Class-10 Class-50 Class-95
0
20
40
60
80
100
Naïve BayesClassification
Random ForestClassification
Decision Tree -Entropy
Decision Tree - gini
Classification Algorithms Accuracy - Daily Model
Class-10 Class-50 Class-95

83
7.1.2.RegressionAlgorithmEvaluationMatrixComparison:
Regression Algorithm Evaluation
R^2 Co-eff MSE RMSE Daily Monthly Daily Monthly Daily Monthly
Linear Regression
0.003
0.02 369.97 65331.53 19.23 255.60
Random Forest Regression
0.12
0.56 327.21 28965.64 18.09 170.19
Table 7.2: Regression Algorithms Evaluation Matrix
Figure 7.3: Regression Algorithms Co efficient
Figure 7.4: Regression Analysis RMSE Values
As displayed in the matrix, we have achieved acceptable label of accuracy in term of rainfall
prediction for random forest algorithm.
0
0.1
0.2
0.3
0.4
0.5
0.6
Daily Monthly
Regression Analysis - R^2 Co-efficient
Linear Regression Random Forest Regression
0
50
100
150
200
250
300
Daily Monthly
Regression Analysis - RMSE Value
Linear Regression Random Forest Regression

84
7.2 Future Scope
Rainfall prediction is extremely complex and challenging. It has very large opportunities and
social implications. The developed system the Rainfall data has been predicted using feature
column those can be given like Year, Month and Station. Though the rainfall also depends on
Temperature, Humidity and Wind Speed. But for future prediction those data will be unknown.
This is a big problem for future data prediction.
To avoid the unknown value prediction problem, in future a system can be developed, in two
steps. Where there will be three different types of trained model to predict all three unknown
parameters (Humidity, Temperature and Wind Speed) by using given input parameter. After
those unknown value prediction, these values will be used as input along with other input
parameter to predict the rainfall. In this way it will predict final Rainfall value but in between
system will have to have all trained and built model for each of those unknown column
(Humidity, Temperature, Wind Speed).
Advances in machine learning techniques are occurring all the time.
One of the most promising, which is finding greater and greater commercial use is Deep
Learning. Deep Learning differs from Machine learning in that neural network architectures
and algorithms used are of a more complex nature. Deep Learning could be applied to this
rainfall prediction problem, one possible future directions could involve the use of Recurrent
Neural Networks. Recurrent Neural Networks have the ability to be able to model changes
across time. Coupled with the fact that Recurrent Neural Networks have the ability to include
a regression output layer which would give a hard number as an output predication [52].
The work carried out in this thesis paves the way to train a future Recurrent Neural Network
as the initial tasks feature engineering has already been undertaken.

85
References
[1] M. S. Islam, S. E. Siddika and S. M. I. Haque Masum, "Rainfall Prediction in South-
Eastern Part of Bangladesh by Linear Regression Method," International Journal of, vol. 6, no. 6, p. 119, 2017
[2] M. A. M. M. A. M. Chowdhury and S. Karmakar, "Long-range and short-range prediction of Rainfall and Rainy days over northwestern part of Bangladesh during Monsoon Season," International Conference on Physics Sustainable Development & Technology, vol. 31, p. 47, 2015
[3] M. M. Rahman, M. Rafiuddin and M. M. Alam, "Seasonal forecasting of Bangladesh summer monsoon rainfall using simple multiple regression model," Earth Syst. Sci., vol. 122, no. 2, pp. 551-558, 2013
[4] S. Roy Das, "Monsoon Rainfall Forecasting for Different Hydrological Regions of Bangladesh Using Climate Predictability Tool (CPT)," in BANGLADESH UNIVERSITY OF ENGINEERING AND TECHNOLOGY, Dhaka, Bangladesh, 2015.
[5] M. A. Hasan, "Improvement of forecasting heavy rainfall events using Weather Research and Forecasting (WRF) model," in BANGLADESH UNIVERSITY OF ENGINEERING AND TECHNOLOGY, Dhaka, 2014
[6] B. A. S. R. Institute, "Statistical Borou," Bangladeshi’s Agricultural Statistics Research Institute, 01 01 2014. [Online]. Available: http://bbs.portal.gov.bd/. [Accessed 01 01 2018]
[7] "INDIAN INSTITUTE OF TROPICAL METEOROLOGY," Govt. of India, 05 2012. [Online]. Available: http://www.tropmet.res.in/. [Accessed 12 01 2018].
[8] Pritpal Singh and Bhogeswar Borah “All Bangladesh summer monsoon rainfall prediction using an artificial neural network”, International conference on "Opportunities and Challenges in Monsoon Prediction in a Changing Climate" (OCHAMP-2012), Pune, Bangladesh, 21-25 February 2012
[9] G. Incerti, E. Foeli., L.Salvati, A. Brunett and A. giovacchini, "Analysis of bioclimatic time series and their neural network-based classification to characterize drought risk patterns in South Italy", International Journal of Biometeorology (2007).
[10] R. R. Kelkar, Director General, IMD- Delhi, The challenge of monsoon forecasting, 2nd Prof. satish Dhawan Lecture, Bangladeshi's Meteorology Society, Ahmedabad chapter
[11] IMD Forecast Manual Part IV (Comprehensive Article on Selected Topics) by P. Jagannathan Issued By The Deputy Director General of Observatories (Forecasting).
[12] Walker, G. T., "Correlation in seasonal variations of weather. VIII.A preliminary study of world weather". IMD Mem., 1923, XXIII, Pat IV, pp. 75-131.,1923

86
[13] D. A.Mooley and B. Parathasarathy, "Bangladeshi's summer monsoon and east equatorial sea surface temperature", Atmosphere-Ocean 22(1) 1984, 23-35, Canadian Meteorolocal and Oceanographic Society.
[14] Muhammad Muslehuddin, Hazrat Mir and Nadeem Faisal, "Sindh Summer(June- September) Monsoon Rainfall Prediction", Pakistan Journal of Meteorology, Vol 2 Issue 4 ,Nov-2005
[15] Liu, J.N.K.,"Rainfall forecasting from multiple point sources using neural networks", Systems, Man, and Cybernetics, 1999. IEEE SMC '99 Conference Proceedings. 1999 IEEE International Conference (Volume,3 ), Tokyo, 1999
[16] turi.com, "Random Forest Regression," turi.com, 2015. [Online]. Available: https://turi.com/learn/userguide/supervised-learning/random_forest_regression.html. [Accessed 20 01 2018]
[17] A. Sharma, "How does random forest work for regression?," quora.com, 20 08 2014. [Online]. Available: https://www.quora.com/How-does-random-forest-work-for-regression-1. [Accessed 20 01 2018].
[18] turi.com, "Linear Regression," turi.com, 2015. [Online]. Available: https://turi.com/learn/userguide/supervised-learning/linear-regression.html. [Accessed 21 01 2018].
[19] J. Brownlee, "Linear Regression for Machine Learning," 25 03 2016. [Online]. Available: https://machinelearningmastery.com/linear-regression-for-machine-learning/. [Accessed 22 01 2018].
[20] D. Fumo, "Linear Regression — Intro To Machine Learning," 5 03 2017. [Online]. Available: https://medium.com/simple-ai/linear-regression-intro-to-machine-learning-6-6e320dbdaf06. [Accessed 23 1 2018].
[21] dezyre.com, "Linear Regression," [Online]. Available: https://www.dezyre.com/data-science-in-r-programming-tutorial/linear-regression-tutorial. [Accessed 23 01 2018]
[22] Synced, "How Random Forest Algorithm Works in Machine Learning," 25 10 2017. [Online]. Available: https://medium.com/@Synced/how-random-forest-algorithm-works-in-machine-learning-3c0fe15b6674. [Accessed 24 01 2018].
[23] M. Kulkarni, "Decision Trees for Classification: A Machine Learning Algorithm," 7 09 2017. [Online]. Available: https://www.xoriant.com/blog/product-engineering/decision-trees-machine-learning-algorithm.html. [Accessed 25 01 2018].
[24] S. Patel, "Chapter 3 : Decision Tree Classifier — Theory," 11 05 2017. [Online]. Available: https://medium.com/machine-learning-101/chapter-3-decision-trees-theory-e7398adac567. [Accessed 22 01 2018].
[25] "A Complete Tutorial on Tree Based Modeling from Scratch (in R & Python)," 12 04 2016. [Online]. Available: https://www.analyticsvidhya.com/blog/2016/04/complete-tutorial-tree-based-modeling-scratch-in-python/. [Accessed 21 01 2018].
[26] Will, "Decision Tree Flavors: Gini Index and Information Gain," 27 02 2016. [Online]. Available: http://www.learnbymarketing.com/481/decision-tree-flavors-gini-info-gain/. [Accessed 25 01 2018].

87
[27] S. RAY, "6 Easy Steps to Learn Naive Bayes Algorithm (with codes in Python and R)," 11 09 2017. [Online]. Available: https://www.analyticsvidhya.com/blog/2017/09/naive-bayes-explained/. [Accessed 26 01 2018].
[28] "Naive Bayes Classifier," [Online]. Available: http://www.statsoft.com/textbook/naive-bayes-classifier. [Accessed 26 01 2018].
[29] S. Polamuri, "HOW THE RANDOM FOREST ALGORITHM WORKS IN MACHINE LEARNING," 22 05 2017. [Online]. Available: http://dataaspirant.com/2017/05/22/random-forest-algorithm-machine-learing/. [Accessed 01 02 2018].
[30] Synced, "How Random Forest Algorithm Works in Machine Learning," 25 10 2017. [Online]. Available: https://medium.com/@Synced/how-random-forest-algorithm-works-in-machine-learning-3c0fe15b6674. [Accessed 05 02 2018].
[31] D. Fumo, "Classification Versus Regression — Intro To Machine Learning," 13 02 2017. [Online]. Available: https://medium.com/simple-ai/classification-versus-regression-intro-to-machine-learning-5-5566efd4cb83. [Accessed 05 02 2018].
[32] bdnews24.com, "Bangladesh agriculture’s contribution to GDP drops," 02 03 2015. [Online]. Available: https://bdnews24.com/economy/2015/03/02/bangladesh-agricultures-contribution-to-gdp-drops. [Accessed 10 02 2018].
[33] tradingeconomics.com, "Bangladesh - Agricultural land (% of land area)," [Online]. Available: https://tradingeconomics.com/bangladesh/agricultural-land-percent-of-land-area-wb-data.html. [Accessed 11 02 2018].
[34] "Bangladesh GDP From Agriculture," [Online]. Available: https://tradingeconomics.com/bangladesh/gdp-from-agriculture. [Accessed 16 02 2018].
[35] "Bangladesh - Agriculture, value added (% of GDP)," [Online]. Available: https://tradingeconomics.com/bangladesh/agriculture-value-added-percent-of-gdp-wb-data.html. [Accessed 17 02 2018].
[36] K. H and G. , "Rainfall Variability and Its Impact on Crop Agriculture in SouthwestRegion of Bangladesh," Climatol Weather Forecasting, vol. 5, no. 196, pp. 01-30, 2017.
[37] "Bangladesh - Agriculture, value added (% of GDP)," [Online]. Available: https://tradingeconomics.com/bangladesh/agriculture-value-added-percent-of-gdp-wb-data.html. [Accessed 20 2 2018].
[38] M. A. Rahman, S. Kang, N. Nagabhatla and R. Macnee, "Impacts of temperature and rainfall variation on rice productivity in major ecosystems of Bangladesh," Agriculture & Food Security2017, vol. 6, no. 10, pp. 01-20, 2017.
[39] "Bangladesh Meteorological Department," [Online]. Available: http://www.bmd.gov.bd/?/home/. [Accessed 01 12 2017].
[40] R. R. Kelkar, Director General, IMD- Delhi, The challenge of monsoon forecasting, 2nd Prof. satish Dhawan Lecture, Bangladeshi's Meteorology Society, Ahmedabad chapter.

88
[41] A.El-shafie, M.Mukhlisin, Ali A. Najah and M.R. taha, " Performance of artificial neural network and regression techniques for rainfall-runoff prediction", International Journal of the Physical Science vol 6(8), 18 April 2011
[42] M. Rajeevan, "Prediction of Bangladeshi's Summer Monsoon: Status, Problems and Prospects", Current Science, Vol 81, No.11, Dec-2001
[43] S. K. Garg, Irrigation Englineering and Hydraulic Structures: Water Resources Engineering, DELHI, India: Khanna Publishers Pvt. Ltd, 2016.
[44] "Machine Learning Library (MLlib) Guide," [Online]. Available: https://spark.apache.org/docs/latest/ml-guide.html. [Accessed 20 11 2017].
[45] "Scala Language," [Online]. Available: http://docs.scala-lang.org/?_ga=2.173103651.1871423845.1519807282-392337548.1515664364. [Accessed 20 10 2017].
[46] "Play 2.6.x documentation," [Online]. Available: https://www.playframework.com/documentation/2.6.x/Home. [Accessed 25 10 2017].
[47] "Highcharts Demos Basic column," [Online]. Available: https://www.highcharts.com/demo/column-basic. [Accessed 25 12 2017].
[48] G. Vasconcelos, "How Random Forests improve simple Regression Trees," 22 09 2017. [Online]. Available: https://www.r-bloggers.com/how-random-forests-improve-simple-regression-trees/. [Accessed 10 01 2018].
[49] M. R. Karim, "Random Forest as a Regressor: A Spark-based Solution," 16 12 2016. [Online]. Available: https://dzone.com/articles/random-forest-as-a-regressor-a-spark-based-solutio. [Accessed 05 01 2018].
[50] M. S. (. M. ), "Chapter 4: Decision Trees Algorithms," 6 10 2017. [Online]. Available: https://medium.com/deep-math-machine-learning-ai/chapter-4-decision-trees-algorithms-b93975f7a1f1. [Accessed 25 01 2018].
[51] C.-A. RICHARD, "ARTIFICIAL INTELLIGENCE: MACHINE LEARNING & PREDICTIVE ANALYTICS," [Online]. Available: https://dzone.com/storage/assets/7391099-dzone-guide-artificialintelligence-2017.pdf. [Accessed 26 12 2017].
[52] J. Patterson and A. Gibson, Deep Learning - a practitioner's approach, O'Reilly Media, Inc., 2017, pp. 143-147.
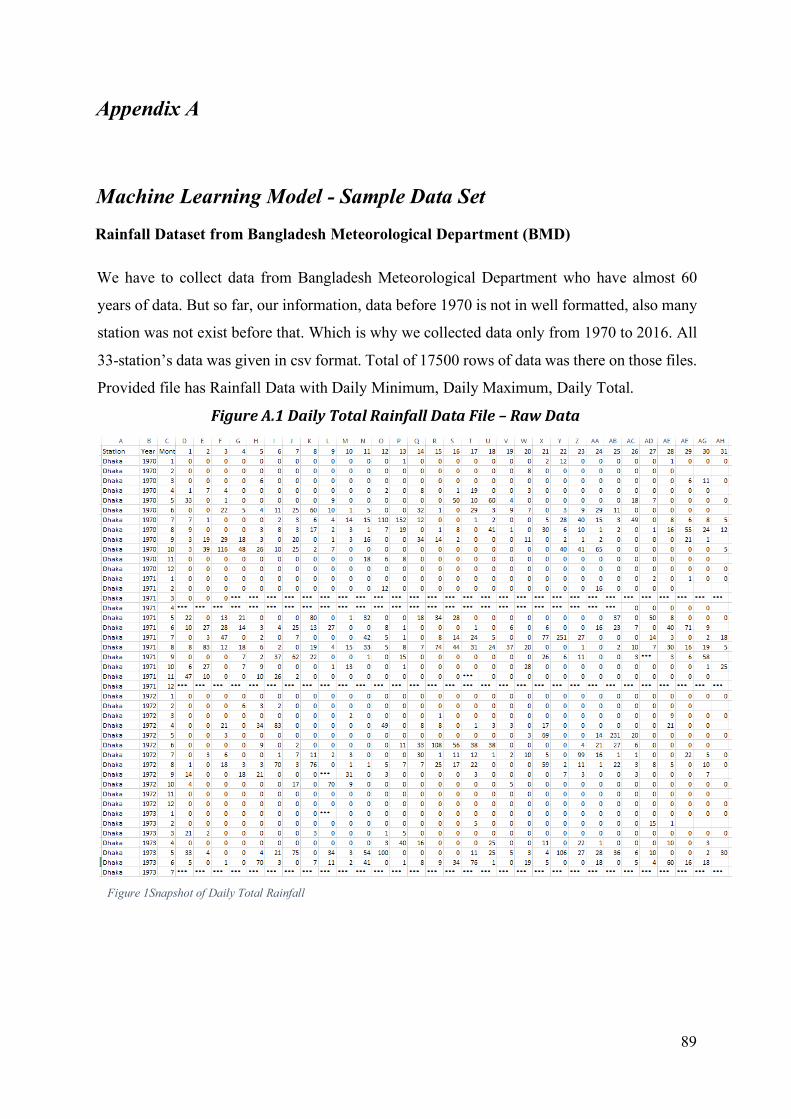
89
Appendix A
Machine Learning Model - Sample Data Set
Rainfall Dataset from Bangladesh Meteorological Department (BMD)
We have to collect data from Bangladesh Meteorological Department who have almost 60
years of data. But so far, our information, data before 1970 is not in well formatted, also many
station was not exist before that. Which is why we collected data only from 1970 to 2016. All
33-station’s data was given in csv format. Total of 17500 rows of data was there on those files.
Provided file has Rainfall Data with Daily Minimum, Daily Maximum, Daily Total.
FigureA.1DailyTotalRainfallDataFile–RawData
Figure 1Snapshot of Daily Total Rainfall

90
FigureA.2DailyAverageTemperatureDataFile–RawData
AlongwithrainfalldatawealsocollectedTemperature,Humidity,andWindSpeed
Data.EachofthosefileshasDailyAverage,DailyMinimumandDailyMaximum.
Figure 2Daily Average Temperature
FigureA.3DailyAverageHumidityDataFile–RawData

91
Figure 3Daily Average Humidity Data File
FigureA.4DailyAverageWindSpeedDataFile–RawData

92
Figure 4Daily Wind Speed Average Data
FigureA.5afterCleaningDailyTotalRainfallDataFile
After Cleaning Up the Rainfall Data:

93
Figure 5Daily Rainfall Data after Cleaning
FigureA.6CalculatedMonthlyTotalRainfallData
Two types of model has been developed for each algorithm. Daily and Monthly Rainfall
prediction. For monthly rainfall prediction, it needed to merge all daily data column to one
single column. After merging all day wise column to one monthly column, the sheet looks like
this:

94
Figure 6Monthly Rainfall Data in Total
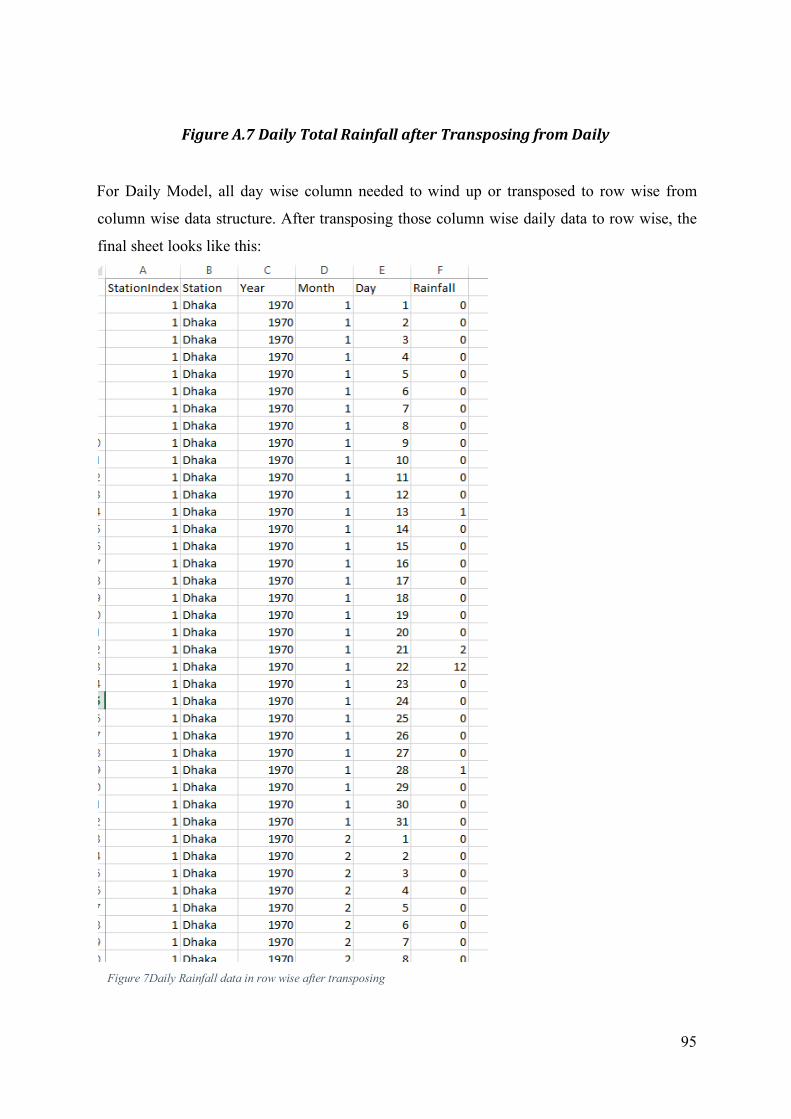
95
FigureA.7DailyTotalRainfallafterTransposingfromDaily
For Daily Model, all day wise column needed to wind up or transposed to row wise from
column wise data structure. After transposing those column wise daily data to row wise, the
final sheet looks like this:
Figure 7Daily Rainfall data in row wise after transposing

96
FigureA.8AfterMergingallmonthlyrainfallrelatedparametersinonefile.
Temperature, Wind Speed, Rainfall and Humidity all file was given in different file. Those
files needed to cleaned and merged to one file.
After merging all data in one file. The document is looking like this:
Figure 8Monthly Rainfall, Temp, Humidity, Wind Speed data in total and average

97
FigureA.9AfterMergingalldailyrainfallrelatedparametersinonefile.
For daily modeling, it needed to merge all rainfall related data to row wise daily data by
transposing from column wise daily data. After transposing daily columnar data to row wise, the
data file looks like this:
Figure 9Dayly rainfall related data in row wise

98
FigureA.10LibSVMformatteddatafortraining
Lib SVM formatted data was not used at the very end. Because, it needed to select and calculated
different data on the fly. For different classification, the label column value needed to recalculate
which is why libsvm formatted data using has been omitted.

99
FigureA.11Co-RelationbetweenRainfallcolumnwithother
Figure 10 Correlation between Rainfall and other column
FigureA.12NaïveBayesClassificationAccuracy
Figure 11Naive Bayes Classification Accuracy matrix
FigureA.13RandomForestRegressionEvaluation

100
Figure 12Random Forest Regression Evaluation Matrix
FigureA.14DecisionTreeClassificationAccuracyforBothGiniandEntropy
Figure 13Decision Tree Classification Accuracy
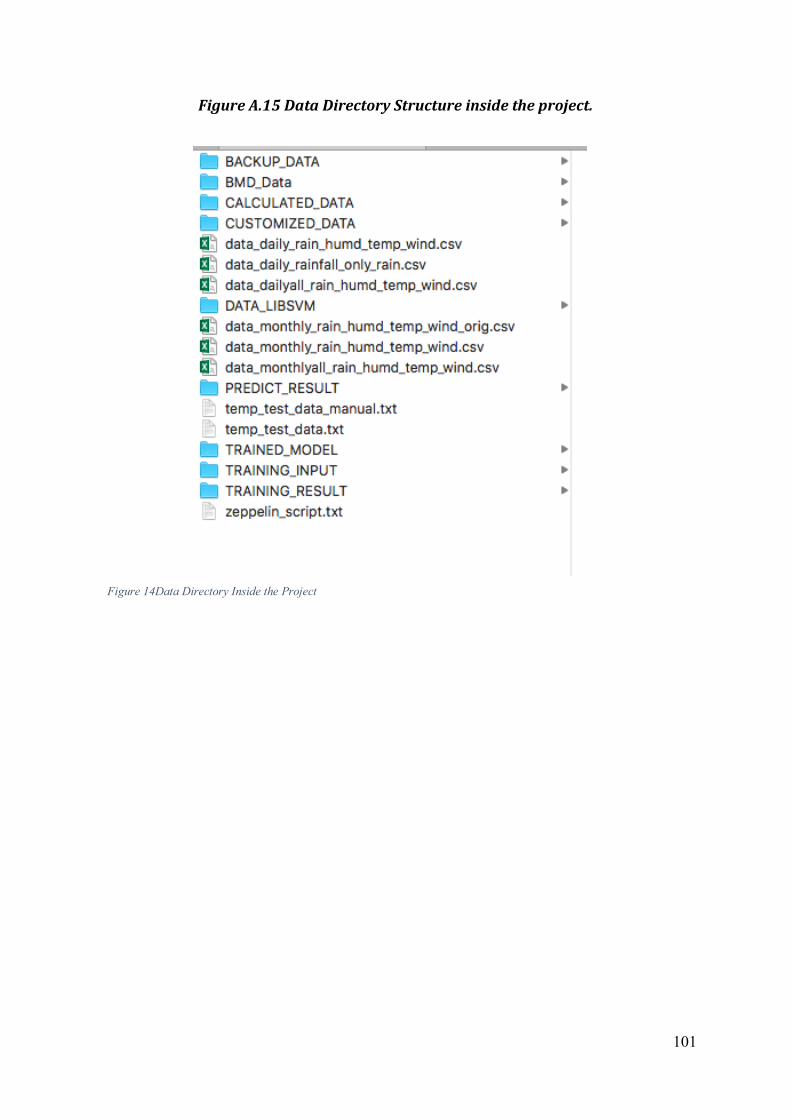
101
FigureA.15DataDirectoryStructureinsidetheproject.
Figure 14Data Directory Inside the Project

102
FigureA.16GeneratedModelFileintheDisk
Figure 15Generated Model Files for each algorithm and class
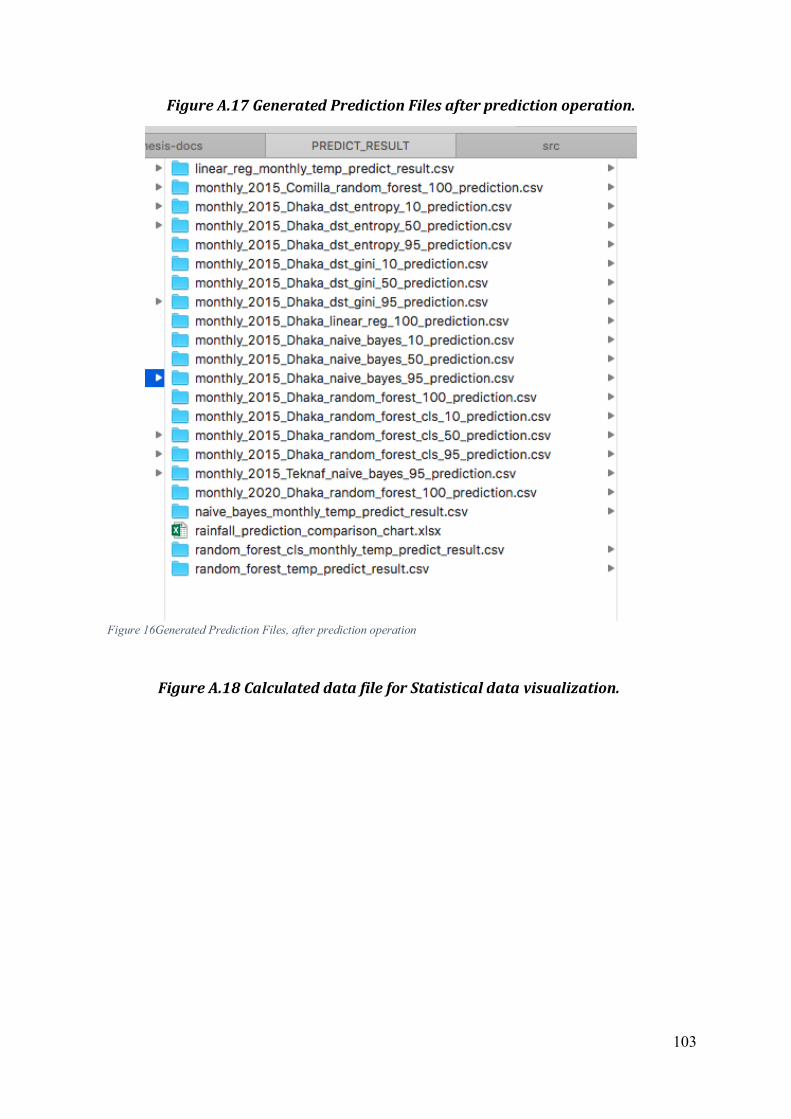
103
FigureA.17GeneratedPredictionFilesafterpredictionoperation.
Figure 16Generated Prediction Files, after prediction operation
FigureA.18CalculateddatafileforStatisticaldatavisualization.

104
Figure 17Calculated data file for Statistical data visualization
FigureA.19DataFilesafterapplyingdifferentdatatransformation

105
Figure 18Data Files after applying different data transformation