machine learning risk adjustment of the c-section rate: impact by provider cynthia j. sims md,...
Post on 21-Dec-2015
216 views
TRANSCRIPT

Machine Learning Risk Adjustment of the C-section Rate: Impact by Provider
Cynthia J. Sims MD, Obstetrics, Gynecology & Reproductive Sciences, Magee Womens Hospital, Pittsburgh, PA 15213
Rich Caruana, Peng Jia, Radu Stefan Niculescu, Matt Troup, Carnegie Mellon University, Pittsburgh, PA 15213
R. Bharat Rao, Data Mining Group, Siemens Corporate Research, Inc. Princeton, NJ 08540

Objective:
We observed a significant variation in C-section rates for 17 physician groups, 13% to 23%. The objective of this study was to determine how much of the observed variation was due to differences in the patient sub-population and how much was due to differences inherent to the group practices.
Method:
We studied a population of 22,176 patients (1995-1997) stratified by provider group. We trained a machine-learning decision-tree model on all 22,176 patients. The model had an accuracy of 90%, and an ROC area of 0.92. Care was taken to prevent over-fitting. The decision-tree model was applied to the patients in each group to determine the aggregate risk for C-section for the sub-population predicted by average physician practice as represented by the 17 physician groups.

Results:
1. Little of the observed variation in C-section rate was attributable to variation in the patient sub-populations (the correlation between the observed C-section rates and the rates predicted by the machine learning model was only 0.21).
2. After adjusting for patient sub-population risk, we found that several groups had differences between actual and predicted rates that were highly significant.
3. Raw C-section rates are misleading. Some groups with a high rate had a high risk patient population that justified the high rate. Other groups with a high rate did not have high risk patient populations.
Conclusions:
There was significant variation in the C-section rate of the different sub-populations. (See table to right.) Only a fraction of the observed variation was explained by differences in predicted risk for C-section of the population. When determining which groups have high c-section rates, it is important to adjust for the relative risk of the different sub-populations. The raw, unadjusted cesarean section rate of different sub-populations can be misleading. We conclude that the substantial differences among the groups were not predicted by patient risk.

MACHINE LEARNINGDECISION TREE MODEL
TRAINED ON 22,176 CASES
RESUBSTITUTIONROC AREA
Physician Group #
Physician Group
Number of Patients in Physician
Group
Observed C-Section Rate in this Group
Predicted C-Section Rate in this Group
Percent Difference
Observed to Predicted
Estimated C-Section Rate if this Physician
Group Treated all 22,176 Patients in the
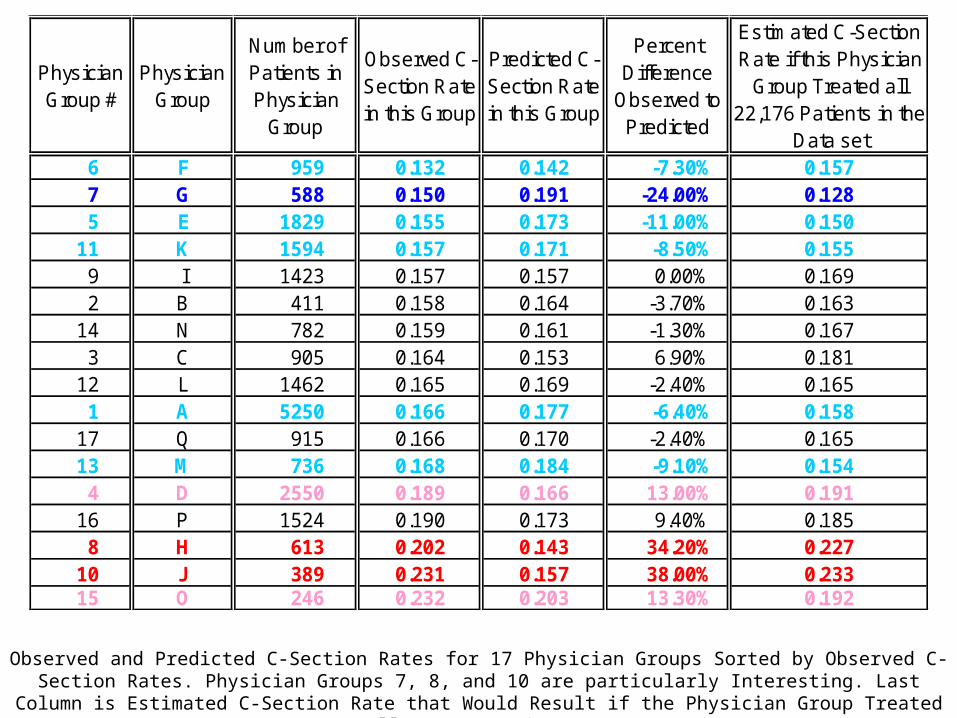
Data set6 F 959 0.132 0.142 -7.30% 0.1577 G 588 0.150 0.191 -24.00% 0.1285 E 1829 0.155 0.173 -11.00% 0.150
11 K 1594 0.157 0.171 -8.50% 0.1559 I 1423 0.157 0.157 0.00% 0.1692 B 411 0.158 0.164 -3.70% 0.163
14 N 782 0.159 0.161 -1.30% 0.1673 C 905 0.164 0.153 6.90% 0.181
12 L 1462 0.165 0.169 -2.40% 0.1651 A 5250 0.166 0.177 -6.40% 0.158
17 Q 915 0.166 0.170 -2.40% 0.16513 M 736 0.168 0.184 -9.10% 0.1544 D 2550 0.189 0.166 13.00% 0.191
16 P 1524 0.190 0.173 9.40% 0.1858 H 613 0.202 0.143 34.20% 0.227
10 J 389 0.231 0.157 38.00% 0.23315 O 246 0.232 0.203 13.30% 0.192
Observed and Predicted C-Section Rates for 17 Physician Groups Sorted by Observed C-Section Rates. Physician Groups 7, 8, and 10 are particularly Interesting. Last Column is Estimated C-Section Rate that Would Result if the Physician Group
Treated all 22,176 Patients.

G
M
AEK
J
H
O
D
F
Scatter Plot Comparing the Observed C-Section Rate in the 17 Physician GroupsWith the C-Section Rates Predicted for Those Groups by the Decision Tree

Hypothesis:
The observed variation in C-section rates for physician groups is inherent to the group practice and not due to differences in the patient sub-population.
The Population:
• 22,176 patients (1995-1997).• Stratified by provider groups.• 17 provider groups.
Conclusions:
• The substantial differences among groups were not predicted by patient risk. • Significant variation in the C-section rate of the different provider group sub-populations.
Future Work:
• Evaluate methods for machine learning group comparison.
• Compare decision tree model with a Neural Network model.
• Best evidence that c-section rate can be lowered without adversely affecting the results comes from countries with lower c-section rates but comparable outcomes. We intend to apply the same techniques to a medical database of one of these countries.