macro and micro determinants of seasoned equity offerings
TRANSCRIPT

Macro and micro determinants ofseasoned equity offerings andissuer stock market performance
Finance
Master's thesis
Matti Virolainen
2009
Department of Accounting and Finance
HELSINGIN KAUPPAKORKEAKOULUHELSINKI SCHOOL OF ECONOMICS

HELSINKI SCHOOL OF ECONOMICS (HSE) Department of Accounting and Finance
MACRO AND MICRO DETERMINANTS OF SEASONED EQUITY OFFERINGS AND ISSUER STOCK MARKET PERFORMANCE
Finance Master’s thesis Matti Virolainen Fall 2009
Approved by the Council of the Department ____ / ____ 20____ and awarded
the grade_______________________________________________________
______________________________________________________________


I
Helsinki School of Economics Master’s thesis Matti Virolainen MACRO AND MICRO DETERMINANTS OF SEASONED EQUITY OFFERINGS AND ISSUER STOCK MARKET PERFORMANCE PURPOSE OF THE STUDY
The purpose of the thesis is to provide new evidence on seasoned equity offerings (SEO) in general, and to address the partially lacking understanding of the SEOs in the UK. This thesis contributes to the ongoing discussion on causes of SEOs by being one of the first studies to investigate the macro level determinants. The thesis also addresses the question at the micro level by comparing SEO firms to firms who choose to issue debt instead. Finally, the thesis examines the firm-specific pre-issue factors that contribute to the abnormal stock market performance of the issuers around the announcement of an SEO and in the long-term following an offering.
DATA
The data on seasoned equity offerings employed in the thesis is sourced from Dealogic and consists of UK seasoned equity offerings during period 1994-2008, while the total number of SEOs amounts to 2,670. At the firm-specific level, the availability of various data items shortens the sample period to range from 1999 to 2007, while the total number of events amounts to 543. Data on various firm characteristics and accounting items is retrieved from Thomson Financial Worldscope, and data on analyst recommendations from Thomson Financial I/B/E/S history. Finally, data on stock prices, market indexes, interest rates and various economic fundamentals are from Datastream.
RESULTS
Results indicate that at the macro level, firms choose to conduct an SEO following periods of high stock market returns, and at times of rapid future sales growth among the listed firms, suggesting that market timing and demand for capital hypotheses of equity issuance hold. At the micro level, firms choose to issue seasoned equity for much of the same reasons, while in addition, information asymmetry seems contribute to the decision.
Market timing, and to a lesser extent, demand for capital proxies have a positive linkage with SEO announcement effect. The findings also indicate that firms exploit window of opportunity to issue equity, since high volume period issuers undergo higher abnormal returns than low volume period issuers. In the long-term, the UK SEOs underperform in general, while the abnormal returns using market-to-book and firm size matched firms as the benchmark are less negative than suggested in the previous literature on the UK SEOs. Finally, the findings indicate that firms with ex ante demand for capital do not suffer from long-term underperformance, while market timers and firms with large issue sizes appear to be poor long-term investments.
KEYWORDS
Seasoned equity offerings, determinants of equity issue, event study, announcement effect, long-term underperformance
ABSTRACT 9.12.2009


II
Helsingin kauppakorkeakoulu Rahoituksen Pro Gradu-tutkielma Matti Virolainen MACRO AND MICRO DETERMINANTS OF SEASONED EQUITY OFFERINGS AND ISSUER STOCK MARKET PERFORMANCE TAVOITTEET
Tutkielman tavoitteena on tuottaa uutta tutkimustietoa osakeantien determinanteista ja tarkastella osakeannin toteuttavien yhtiöiden suoriutumista osakemarkkinoilla yrityksen tuntomerkkien näkökulmasta. Tutkielma on ensimmäisiä osakeantipäätöksiin vaikuttavia makrotekijöitä kartoittavia akateemisia tutkimuksia. Lisäksi tutkielman tarkoituksena on määrittämää yrityskohtaisia, mikrotason tekijöitä, jotka selittävät miksi jotkut yhtiöt päätyvät tekemään osakeannin, ja toiset puolestaan nostamaan lisää vierasta pääomaa. Tutkimuksen tavoitteena on niin ikään määrittää osakeannin toteuttavien yhtiöiden epänormaaleihin tuottoihin vaikuttavia yrityskohtaisia tekijöitä osakeannin julkistus hetkellä, ja pitkällä aikavälillä annin toteuttamisen jälkeen.
AINEISTO
Tutkimuksen aineisto koostuu Lontoon pörssissä listattujen yhtiöiden vuosien 1994 ja 2008 välillä tekemistä osakeanneista, jotka on haettu Dealogic tietokannasta osakeantien kokonaislukumäärän ollessa 2,670. Yrityskohtaisella tasolla datan saatavuus rajoittaa tarkastelun kohteena olevan ajanjakson määrittyvän välille 1999–2007 osakeantien kokonaismäärän ollessa 543. Yrityskohtaiset taloudellisia muuttujia ja tunnuslukuja kuvaava tieto on peräisin Thomson Financial Worldscope tietokannasta ja analyytikkojen suositukset I/B/E/S history tietokannasta. Lisäksi käytössä ollut osakekurssidata, korkodata ja eri kansantalouden muuttujia kuvaava tieto on peräisin Datastream tietokannasta.
TULOKSET
Tulokset osoittavat, että makrotasolla tärkeimmät osakeanteihin vaikuttavat tekijät ovat osakemarkkinoiden tuotto ja listatuttujen yhtiöiden tulevaisuuden liikevaihdon kasvu. Näin ollen markkinoiden ajoittaminen ja rahoitustarve vaikuttavat positiivisesti osakeantien lukumäärään. Mikrotasolla osakeannin toteuttavat yritykset ajoittavat markkinaa ja tarvitsevat pääomaa, aivan kuten makrotasolla, mutta lisäksi tiedon epäsymmetria vaikuttaa negatiivisesti osakeannin toteuttamispäätökseen. Osakeannin julkistamisen aiheuttamaan epänormaaliin tuottoon vaikuttavat sekä markkinan ajoittaminen että rahoitustarve. Lisäksi yhtiöt hyödyntävät korkean osakeantivolyymin periodeita, jolloin yritysten epänormaalit tuotot julkistushetkellä ovat verrattain korkealla tasolla. Osakeannin jälkeen yritykset alisuoriutuvat pitkällä aikavälillä, mutta negatiiviset epänormaalit tuotot eivät ole niin suuria, kuin aikaisemmassa kirjallisuudessa on raportoitu. Pitkän aikaväliin osakemarkkinoilla suoriutumiseen vaikuttavat sekä osaketuotot ennen osakeantia että yrityksen rahoitustarve. Yhtiöt, joilla on kova pääomantarve, eivät alisuoriudu pitkällä aikavälillä, ja ovat näin ollen parempia osakesijoituksia, kuin markkinoita ajoittavat opportunistit.
AVAINSANAT
Osakeannit, markkinan ajoittaminen, rahoitustarve, pitkän aikavälin alisuoriutuminen
TIIVISTELMÄ 9.12.2009


III
TABLE OF CONTENTS 1 INTRODUCTION ......................................................................................................... 1
1.1 Background and motivation ...................................................................................... 1 1.2 Research questions ................................................................................................... 3 1.3 Contribution to the literature ..................................................................................... 4 1.4 Results ..................................................................................................................... 4 1.5 Limitations of the study ............................................................................................ 6 1.6 Structure of the study................................................................................................ 6
2 LITERATURE REVIEW ............................................................................................. 6 2.1 Theories of capital structure...................................................................................... 7 2.2 Empirical evidence on determinants of SEOs ......................................................... 10
2.2.1 Market timing .................................................................................................. 10 2.1.2 Investment related demand for capital ............................................................. 12 2.1.3 Asymmetry of information................................................................................ 13 2.1.4 Investor sentiment ........................................................................................... 15 2.1.5 Firm specific issuer characteristics ................................................................. 16
2.3 Empirical evidence on the stock market performance of the SEO firms .................. 17 2.3.1 Announcement effect........................................................................................ 18 2.3.2 Long-term underperformance .......................................................................... 21
3 HYPOTHESES ............................................................................................................ 25 3.1 Macro level determinants of SEOs .......................................................................... 25 3.2 Micro level determinants of SEOs .......................................................................... 27 3.3 Issuer stock market performance ............................................................................ 28
4 DATA ........................................................................................................................... 30 4.1 The sample collection process ................................................................................ 31
4.1.1 Macro level determinants of seasoned equity offerings .................................... 31 4.1.2 Micro level determinants of seasoned equity offerings ..................................... 31 4.1.3 Abnormal returns of SEO firms ....................................................................... 32
4.2 Sample characteristics ............................................................................................ 32 5 METHODOLOGY ...................................................................................................... 38
5.1 Determinants of seasoned equity offerings .............................................................. 38 5.1.1 OLS regression ................................................................................................ 38 5.1.2 Logit regression .............................................................................................. 39
5.2 Abnormal returns of seasoned equity issuers........................................................... 39 5.2.1 Short-term abnormal returns ........................................................................... 40 5.2.2 Long-term abnormal returns ........................................................................... 41
6 RESULTS .................................................................................................................... 42 6.1 Macro and micro level determinants of seasoned equity offerings ........................... 43
6.1.1 Macro level determinants of SEOs ................................................................... 43 6.1.2 Micro level determinants of SEOs.................................................................... 47
6.2 Issuer stock market performance ............................................................................ 52 6.2.1 Announcement effect........................................................................................ 54 6.2.2 Post-issue performance ................................................................................... 65
7 CONCLUSION ............................................................................................................ 77 REFERENCES ................................................................................................................ 81 APPENDICES ................................................................................................................. 87

IV
LIST OF TABLES Table I: Literature on SEO announcement effect................................................................... 20
Table II: Literature on SEO post-issue underperformance using BHAR methodology ........... 23
Table III: Summary of hypotheses ........................................................................................ 30
Table IV: Sample characteristics: macro & micro determinants and issuer stock market performance ......................................................................................................................... 34
Table V: Descriptive statistics of macro determinants sample ............................................... 36
Table VI: Firm characteristics of micro determinants sample ................................................ 37
Table VII: Macro determinants of SEOs ............................................................................... 43
Table VIII: Micro determinants of SEOs .............................................................................. 48
Table IX: Summary of findings on SEO determinants........................................................... 52
Table X: SEO announcement effect: total sample ................................................................. 54
Table XI: SEO announcement effect: CARs and issuer characteristics .................................. 55
Table XII: SEO announcement effect: regression analysis of abnormal returns ..................... 59
Table XIII: Regression analysis of announcement effect after removal of years 1999 and 2001 ............................................................................................................................................. 64
Table XIV: SEO post-issue preformance: total sample.......................................................... 66
Table XV: SEO post-issue performance: BHARs and issuer characteristics .......................... 69
Table XVI: SEO post-issue performance: regression analysis of abnormal returns ................ 72
Table XVII: Summary of findings on issuer stock market performance ................................ 76
Table XVIII: Summary of findings………………………………………………………………...78 LIST OF FIGURES Figure 1: SEO volume and value in the UK 1994 – 2008 ...................................................... 33 Figure 2: Macro determinants of SEOs ................................................................................. 46 Figure 3: Buy-and-hold abnormal returns of SEO firms: total observation period ................. 53 Figure 4: CARs of SEO firms around the announcement: the impact of issuer characteristics ............................................................................................................................................. 62 Figure 5: The impact of past 12-month stock return on announcement effect annually during the sample period.................................................................................................................. 63 Figure 6: Buy-and-hold abnormal returns of SEO firms: post-issue period ............................ 67 Figure 7: BHARs of SEO firms post-issue: the impact of issuer characteristics ..................... 75

1
1 INTRODUCTION
1.1 Background and motivation
Seasoned equity offerings (SEO) have an important role in the world of finance regardless of
the perspective of the observer. The equity offerings by seasoned firms have continuously
been one of the most researched topics among academics, firms’ key financing decisions or
alternatively, great source of income for investment bankers. SEOs have been one of the key
areas of research in the field of corporate finance due to their significance as the firms’
financing event and somewhat anomalous stock market performance of equity issuers.
Numerous authors document stock price run-up before equity issuance, negative response
from the investors to the public announcement of the issue and finally, and also probably most
strikingly, issuers continue to underperform their non-issuing peers for up to five years after
the issue. Consequently, SEO announcements clearly represent a signal to investors similarly
to other corporate events, but at the same time, not all the investors adjust their valuations to
correct level as issuers continue to underperform various benchmarks. Traditional financial
theories on capital structure, such as pecking order and tradeoff theory, cannot fully explain
the empirically observed stock market performance of the issuers. The inability of the
traditional theories has given rise to a series of new attempts to explain the SEO mechanisms.
Equity issues have been found to occur in cycles as great majority of the SEOs and initial
public offerings (IPO) tend to take place during hot periods, followed by times of low
issuance volumes. Baker and Wurgler (2000) find that aggregate equity share in total capital
issuance is a strong predictor of future market returns as high equity share in all new issues is
often followed by exceptionally low returns. Similarly, Bayless and Chaplinsky (1996) find
hot market issues and cold market issues to differ in quantity and issuer characteristics.
Existing literature suggest various motives for firms to issue equity and thus, the equity cycles
to exist. Firstly, Baker and Wurgler (2002) find that managers’ superior information gives
them edge to make an attempt to time the equity market. Managers choose to issue equity
when company is trading above its intrinsic value and repurchase shares at other times.
Second, Dierkens (1991) on the contrary states that when information asymmetry between
managers and shareholders is large, the adverse selection costs of issuing equity are at their
highest. High information asymmetry sways firms to look alternative ways to finance the
projects as they are in afraid of a negative response from the investors. Third, according to

2
Choe, Masulis and Nanda (1993) firms’ investment opportunities, the demand for capital, can
also have a large impact on the equity issuance decision. When the economy is booming,
firms are likely to see a variety of promising positive NPV projects and consequently,
shareholders have higher probability to gain adequate return on their investment, if they
choose to invest more in the firms’ stock. Lastly, Lowry (2003) finds that investor sentiment
is an important determinant for firms to go public, and therefore, it is reasonable to assume
that the mechanism for follow-on offerings could be similar.
Investigation of issuer stock market performance has motivated numerous papers. Asquith
and Mullins (1986) first report the negative market reaction to SEO announcement, while
Loughran and Ritter (1995) throw light on the long-term underperformance of SEO firms.
Thereafter a number of authors have replicated their findings, but the topic of interest has
partly shifted from quantifying the performance to explaining the observed returns. Loughran
and Ritter (1997) show deterioration in issuers’ operative performance to cause the
underperformance, while Baker and Wurgler (2002) assume market timing of managers to
account for the phenomenon. Fama (1998) questions the findings on post-issue
underperformance and explains the stock price patterns to result from using inadequate
models to measure abnormal returns.
However, the recent findings in the area of SEOs by Dittmar and Thakor (2007), DeAngelo,
DeAngelo and Stulz (2007) and Alti and Sulaeman (2008) suggest that the SEO mechanism,
both in terms of determinants of SEOs and the performance of issuers, has not fully been
understood. The market timing theory continues to be among the leading theories in the
literature on capital structure and motivation for SEO decision, but a debate goes on about the
correct specification of the theory, and the characteristics of the firms that are likely to
opportunistically time the market. Dittmar and Thakor (2007) state that the questions of why
and when companies issue equity are still partly unanswered, as the recent attempts to address
the questions have exposed gaps between stylized facts and traditional theories of capital
structure and security issuance.
A great majority of the studies on SEOs employ US data and Andrikopoulos (2009) concludes
that the understanding of SEOs in context of the UK market is still fairly limited. Employing
UK data, Slovin, Sushka and Lai (2000) and Barnes and Walker (2006) study the impact of
the floatation method choice on stock market reaction to SEO announcement and report

3
negative announcement effect for rights issues and positive market reaction for private
placements. Ngatuni, Capstaff and Marshall (2007) investigate the long-term post-issue stock
market performance with a sample of UK rights issues, and report significant
underperformance for up to five years following an issue. Therefore, the US phenomenon
seems to hold also in the UK. Furthermore, Andrikopoulos (2009) studies the weakening of
the operative performance as a cause for post-issue long-term underperformance. He reports
that firms time equity issues for periods when their operative outlook seems most favorable.
As it appears, the UK evidence on stock market performance of equity issuers has broadened
during the past few years. Yet, the determinants of equity issues have not been studied neither
from the macro nor micro perspective, and the issuer stock market performance have not been
fully explored.
1.2 Research questions
This thesis provides evidence on the determinants of equity issues from two perspectives:
first, I investigate the factors driving the changes in SEO volume as an economy-wide
phenomenon and second, by comparing the attributes of firms that decide to issue equity with
those who choose to use alternative ways of financing.1 In addition, I analyze the performance
of equity issuers around the public announcement of the SEO and in the long-horizon by
making an effort to quantify the impact of pre-announcement issuer characteristics to the
stock market performance of the issuers. The most central research questions can be
summarized in the following way:
i) Which theories of those suggested in the corporate finance literature explain the
economy-wide fluctuation in the UK SEO volume?
ii) What are the firm characteristics that relate to the decision to issue equity?
iii) How does the UK sample of equity issuers perform in the stock market around the
announcement and in the long-horizon?
iv) What is the link between firm-specific issuer characteristics and the stock market
performance of the issuers?
I perform time-series regression to study SEO macro determinants by following Lowry (2003)
and Pastor and Veronesi (2005), who pool various theories on IPO issuance together and
1 I use terms economy-wide and macro interchangeably when referring to the whole UK equity offering market. I also use terms firm-specific, micro and cross-sectional interchangeably when discussing the SEOs from a perspective of a single firm.

4
analyze the macro determinants of IPOs. In addition, I study the micro level determinants of
SEOs by means of logit regression. Finally, I employ traditional event study methodologies to
measure the impact of pre-issue firm characteristics on the stock market performance of SEO
firms around the announcement and in the long-term.
1.3 Contribution to the literature
This thesis contributes to the prior literature in several ways. The thesis addresses the impact
of different macro level determinants on the SEO volume following the unpublished working
paper by Howe and Zhang (2009), which is the first attempt to study the fluctuation in SEO
cycles from multiple theories’ perspectives. The thesis also pools together the macro and
micro level factors to study the determinants of SEOs from both perspectives, while the prior
literature focuses on either one of the perspectives, and mainly US evidence on topic exist
(see, e.g., Bayless and Chaplinsky (1996), Jung, Kim and Stulz (1996), Dittmar and Thakor
(2007)). In addition, the thesis shows that the ex ante firm characteristics have explanatory
power in explaining post-issue underperformance of SEO firms, while the existing literature
concentrates on overvaluation and post-issue deterioration of operative performance as the
primary causes of the phenomenon (see, e.g., Loughran and Ritter (1997), Andrikopoulos
(2009)).
By being a thorough investigation on various SEO phenomena, the thesis adds to the literature
on UK SEOs in multiple ways. To my best knowledge, none of the earlier studies addresses
the determinants of seasoned equity offerings in the UK. In addition, the thesis contributes to
the existing UK studies on SEO firms’ stock market announcement effect, such as Slovin et
al. (2000) and Barnes and Walker (2006), by employing ex ante firm characteristics that
support various hypotheses on equity issuance as determinants of issuer stock market
performance. Finally, the thesis provides new evidence on SEO firms’ post-issue
underperformance. The earlier thorough investigations by Ngatuni et al. (2007) and Ho (2005)
analyze the role of floatation method choice on the stock market performance of the issuers,
but neither of the studies analyzes the role of issuer characteristics on the stock market
performance.
1.4 Results
I find evidence that support market timing and demand for capital hypotheses as the macro
level determinants of equity issues. When public firms’ future sales growth is rapid, firms

5
seek for external financing and SEO volume increases impressively. On the other hand, when
the risk-free rate is low, firms have positive NPV projects available and the need for external
financing increases through the discount rate channel. Also, firms issue equity after periods of
high stock market returns. Specifically, my findings indicate that the past 12-month stock
returns positively contribute to the macro SEO volume. At the micro level, market timing,
information asymmetry and demand for capital all seem to have strong impact on the
likelihood of using SEO as a means of financing. Besides, an analysis of the issuer
announcement effect reflects that market timers are likely to face more optimistic market
reaction than poor market timers. The role of past stock returns persists after various
robustness checks. Interestingly, issuers during high periods of issuance volume undergo
more optimistic market reaction than cold period issuers, but the results are driven by top
quintile of issues taking place during the highest volume periods. I also find some evidence
that SEOs by firms with high demand for capital are interpreted as positive news, while the
reversal is true for low demand for capital firms. Finally, an analysis of the post-issue
performance reveals that market timers are good investments during periods of 12 months or
less while they begin to underperform at longer horizons. Firms with high demand for capital
do not underperform their non-issuing peers, which suggests that some firms have a
fundamental need for the issue and can put the proceeds into an efficient use. I additionally
find that the underperformance seems to increase with the issue size and investors have some
ability to pick the winning SEOs at the time of announcement.
Earlier literature on IPO determinants conducted using US data reports similar factors to drive
macro volume changes as I find to be the case with the UK SEOs (see, e.g., Lowry (2003),
Pastor and Veronesi (2005)). At the micro level, US studies, such as Jung, Kim and Stulz
(1996), report high leverage, past stock returns and market-to-book to be the strongest
determinants of a firm choosing to issue equity over debt. I report similar findings and add a
number of interesting results: analyst coverage, financial slack, sales growth and volatility
seem all to be positively related to the likelihood of an equity issue decision. The existing
literature is not unanimous on the firm characteristics affecting announcement effect of SEOs
(see, e.g., Bayless and Chaplinsky (1996), Dittmar and Thakor (2007), Alti and Sulaeman
(2008)). I confirm that the hot period issues seem to face more positive market reaction at the
announcement and strong market timers with anticipated SEOs face positive interpretation by
the stock market. In addition, the sales growth appears to have a positive but non-monotonic
impact on the market reaction in the UK similarly to the US. Namely, Denis (1994) reports

6
subsamples of extreme performers to drive the phenomenon. Lastly, while existing literature
mainly concentrates on the deterioration of operating performance following an issue (see,
e.g., Loughran and Ritter (1997), Andrikopoulos (2009)), I report pre-issue characteristics to
have explanatory power in post-issue performance of SEO firms.
1.5 Limitations of the study
This thesis is subject to two sources of limitations typically present in event studies to a
certain degree. First, extensive requirements on data availability force to exclude significant
proportion of SEOs out of the final sample due to missing key data items. Second, the long-
term event studies have been criticized for the model misspecification and inadequate
benchmarks to measure the normal returns, both of which can bias the results in the long-
term. As it comes to the data availability, there’s not much that can be done to avoid the
problem. Overall, I consider the sample of SEOs of adequate size and reasonably well
representative of the UK equity market activity. To overcome the second limitation, I employ
and report results using two different models both in short-term and long-term event study.
Moreover, short-term abnormal returns are based on often used market model and plain
market adjusted returns, while I calculate long-term abnormal returns using both 1) FTSE All-
Share stock index and 2) size and market-to-book matched firms as the benchmark for normal
returns.
1.6 Structure of the study
The rest of the thesis is organized as follows. Chapter 2 highlights the relevant literature on
equity issue determinants and the reported empirical evidence on issuer stock market
performance. Chapter 3 motivates and presents the hypotheses tested in the thesis. Chapter 4
presents the data collection process and the final data sample used in the study. Chapter 5
reviews the methodologies employed. Chapter 6 shows and discusses the empirical results.
And finally, chapter 7 concludes the thesis.
2 LITERATURE REVIEW
This chapter highlights the most relevant literature from the area of seasoned equity offerings.
The first section concentrates on traditional theories of capital structure, while the second
section summarizes the literature on the drivers of the SEO cycles and the determinants of

7
SEO decision. Finally, the third section summarizes the evidence on the stock market
performance of the issuers around the announcement of the issue and in the long-term
following an issue.
2.1 Theories of capital structure
In this section, I demonstrate the evolution of capital structure theories presented to explain
the firm financial policy. Moreover, capital structure theories have relevance from capital
issuance’s point of view, as the same theories have laid the foundation on explaining how a
firm facing a need of external capital chooses between alternative ways of financing and
additionally, how the stock market reacts to the public announcement of the issue.
The extensive literature on modern capital structure theory started from Modigliani and
Miller’s (1958) arguments of irrelevancy of capital structure. Moreover, firm value was stated
to be unaffected by the chosen capital structure. Provided that a certain set of circumstances
is met, their argument is that one capital structure in no better than the other. Modigliani and
Miller framework, however, is based on demanding assumptions, such as no asymmetric
information and efficient markets.
In response to the neutrality of capital structure, Myers and Majluf (1984) present the pecking
order theory of capital structure according to which a firm chooses to use internal capital to
finance a project whenever possible and also, when external capital issue is required, the firm
prefers riskless debt to risky debt and finally, risky debt to equity. Myers and Majluf (1984)
show that if the managers have superior information and the company does not have financial
slack or unused debt capacity, the managers may choose to reject a positive NPV project,
given that the company would be forced to issue equity to finance the project. The theory
implies that some companies having a positive NPV project choose to forgo it as company
equity is undervalued and dilution costs of the SEO outweigh the NPV of the project. On the
contrary, others choose to forgo the project only if debt can be issued. The reluctance to issue
equity whenever the firm’s common stock is underpriced, the authors state, is a result of
asymmetric information. Consequently the market reaction to equity issue decision is likely to
be negative as it reveals management seeing company equity being overvalued. Pecking order
theory has been criticized by Fama and French (2005) due to its inability to explain why in
reality a large proportion of companies issue equity. Fama and French conclude that in their

8
sample, between 1993 and 2003, 86 % of companies decided to issue equity and more than 50
% of the observations in their sample violate the pecking order theory.
An alternative theory, the tradeoff theory of capital structure, began to develop gradually
when a correction to the neutrality of capital structure was presented by Modigliani and Miller
(1963). They consider the earlier models on capital structure to be inadequate, since corporate
taxation was ignored. Also, Kraus and Litzenberger (1973) and Myers (1977) emphasize the
importance of taking market imperfections, such as bankruptcy penalties and taxation on
firms’ profits, better into consideration. Contrary to earlier theories of capital structure, the
basic principle of the tradeoff theory assumes that a firm’s capital structure will be gradually
guided toward optimum because its capital issue decisions are balanced between marginal
costs of debt (increased bankruptcy risk) and marginal benefits (tax shields) of debt. The
strength of tradeoff theory lies in its ability to explain cross-sectional differences in borrowing
– safe and tangible generally borrow more, while risky growth firms face high risk of
bankruptcy and choose to borrow less. Adding taxes to the analysis, Modigliani and Miller
(1963) argue, implies more levered capital structures. The authors also point out that
unexamined real-life patterns reflect the fact that it is in the companies’ interest to maintain
financial flexibility in form of borrowing capacity.
Tradeoff theory has taken leaps towards its current format over time as various authors test
the implications of the theory on real life patterns. Myers (1977) considers a situation where a
firm facing a positive NPV project has an excessive amount of debt. He states that the
company may have to forgo the opportunity as issuing more debt would imply high risk of
default and new equity may not be available as the equityholders would have to bear the costs
if the project failed. Myers (1977) therefore introduces the debt overhang problem. On the
other hand, Hovakimian, Opler and Titman (2001) find empirical results suggesting that debt
overhang works as an impediment to adjust leverage towards firm’s target capital ratio.
Finally, Jensen (1986) considers a situation with a firm having too much equity and suggests
that large free cash flow in existence of interest payments worseness the possible agency
conflicts between managers and different claim holders of the firm.
Despite its ability to explain some real world patterns, the tradeoff theory has been criticized
extensively. Myers (1984) claim that if the tradeoff theory was true, firms would not have as
low leverage ratios as they in reality appear to have. Shyam-Sunder and Myers (1999) are of

9
the opinion that traditional pecking order model provides a better illustration of firms’ capital
structure policies than tradeoff theory. Further, the practical evidence on a number of firms
giving up valuable debt tax shields contradicts with the theory’s building blocks. On the
contrary, one of the implications of the tradeoff theory is that an increasing stock price leads
to lower leverage and consequently, should guide the company into debt issuance. However,
numerous authors, for instance Baker and Wurgler (2002) and Jung et al. (1996), point out
that the increase in stock prices actually improves the likelihood of issuing equity. The
pecking order and tradeoff theories continue to be an area of interest in finance literature and
have continuously been debated (see, e.g., Fama and French (2002), Frank and Goyal (2008)).
The consensus of authors is that the pecking order and tradeoff theories have been the
dominant theories in capital structure and only the improved understanding of the dynamic
aspects of capital structure have made the theories less compelling.
The tradeoff theory’s weaknesses have stimulated a number of authors to aim to better
account for firms’ actual capital structure policies in their theoretical capital structure
frameworks. In response to the traditional static tradeoff theory, Fischer, Heinkel and Zechner
(1989) and Lucas and McDonald (1990) discuss an alternative version of capital structure
theory, dynamic tradeoff theory. According to the dynamic tradeoff theory, firms can deviate
from their optimal capital structure to the extent that the transaction costs of capital structure
adjustment outweigh the costs of deviating from optimal structure. Fama and French (2002),
however, point out that firms are fairly slowly adjusting their capital structures, which suggest
that suboptimal capital structures can exist for long periods of time. On the contrary, Leary
and Roberts (2005) claim that firms actively adjust their leverage towards target.
Market timing theory of the capital structure is a novel alternative for the predominant
theories. To clarify, the empirical evidence on security issuance has documented firms to
issue equity when their market prices are high and repurchase shares when low. Hovakimian
et al. (2001) While market timing of equity issuers is fairly old and approved phenomenon,
Baker and Wurgler (2002) show that the impact of firms’ security issuance market timing on
observed capital structures is persistent. Consequently firms’ capital structures are cumulative
outcomes of their past market values. Baker and Wurgler (2002) use market-to-book as the
measure of firm valuation level and conclude that if no single optimal capital structure exist,
then managers do not need to reverse the market timing decisions when firm’s market-to-

10
book shifts back to a lower level. Therefore, historical market timing can be a determinant of
the current capital structure.
Hovakimian (2006) questions the findings of Baker and Wurgler as he finds no significance
evidence of market timing pattern for debt issues and debt reductions. In addition, the equity
market timing does not seem to have a long-lasting impact on firms’ capital structures. Or to
be more precise, the relation between market-to-book and capital structure does not imply
such an impact to exist, contrary to Baker and Wurgler’s (2002) findings. Hovakimian (2006)
also finds that the market-to-book ratios of equity issuers are significantly higher than debt
issuers during all the years in his sample. The finding suggests that the negative effect of
market-to-book on leverage seems to be cross-sectional rather than time-series phenomenon
and more likely to reflect changes in growth opportunities than market timing. Kayhan and
Titman (2007) and Leary and Roberts (2005), on the other hand, argue that firms actually
rebalance their capital structures towards a target, while Fama and French (2002) and Huang
and Ritter (2009) show that rebalancing occurs fairly slowly and therefore, the shocks in the
market values have long-lived influence on observed capital structures. Nevertheless, the role
of market timing on firms’ observed capital structures remains somewhat unsettled issue in
corporate finance literature.
2.2 Empirical evidence on determinants of SEOs
In this section, I present the various theories proposed to motivate firms to issue seasoned
equity. The aggregate volume of equity issues, or the equity issue cycles, has been examined
by numerous authors. Majority of the existing literature positions itself with a single
explanation for the fluctuation in volumes. The literature on most often argued explanations
for the fluctuation in equity issuance activity (market timing, demand for capital, information
asymmetry and to a lesser extent investor sentiment) is summarized in the following
subsections. IPO cycles tend to fluctuate together with SEO cycles, yet in the case of IPOs
more dramatic shifts between hot and cold cycles occur. Due to the obvious conformity in
IPO and SEO determinants, I summarize also some of the main theories on IPO cycles that
have relevance for SEOs.
2.2.1 Market timing
Several perspectives have been taken to justify the market timing hypothesis in equity
issuance. Marsh (1982) studies a sample of UK firms facing equity vs. debt decision. He finds

11
that firms’ decisions are heavily influenced by past securities prices and current market
conditions as well as target leverage levels. Lucas and McDonald (1990) state that equity
issues seldom take place when management sees firm’s equity being undervalued. Jung et al.
(1996) show equity issuing firms experiencing positive abnormal 11-month returns before the
issue. Moreover, higher equity issue volumes occur at times of high recent stock market
performance, and are often aligned with rising economic activity. Finally, Hovakimian et al.
(2001) find that firms with high past stock returns are likely to issue equity and retire debt,
while firms with low past stock market performance are reluctant to issue equity.
Baker and Wurgler (2000) investigate the time series variation of equity issues’ share in total
new capital issues and find that the peaks in equity issue volume occur at times of high past
aggregate market values, just before periods of low market returns. They claim that the strong
presence of market timing by managers violates the efficient market hypothesis. The authors
additionally argue that the equity share in new issues is an efficient predictor of one-year-
ahead market returns. Baker and Wurgler (2002) elaborate four sources of distinct evidence
for market timing of equity issues: Firstly, actual financing decisions by firms tend to be
dominated by equity issues at times of high market values and debt issues when market values
are low. Secondly, analyses of post-issue performance (see, e.g., Loughran and Ritter (1995)
and Spiess, Afflec-Graves (1995)) reveals successful market timing due to low post-issue
returns. Third, analyses of earnings forecasts and realizations show that equity issues tend to
occur when investors in general are over-optimistic about firms’ prospects. Finally, survey by
Graham and Harvey (2001) reveals CFOs to exploit high market values by issuing equity.
Despite the obvious presence of market timing as a factor affecting the SEO decision, the
market timing hypothesis has continued to be a widely examined phenomenon. A new area of
studies aims to better understand the role of market timing in equity issuance. Dittmar and
Thakor (2007) state that the managers are likely to issue equity at times of high past stock
returns provided that shareholders’ views on the project payoff are aligned with the
management. Moreover, managers want the likelihood of agreement with investors to be as
large as possible, otherwise firms prefer issuing debt. Alti and Sulaeman (2008) investigate
the link between institutional demand and market timing. Moreover, their findings indicate
that high past stock returns lead to an increased likelihood of equity issue only when the firm
contemporaneously faces high institutional demand.

12
Hot issue markets in IPOs have been studied extensively. Ibbotson and Jaffe (1975) define hot
issue markets as periods where new issues constantly earn remarkable abnormal returns
during the first month after listing, and conclude that such returns could be predictable and
provide investors with high returns. Lowry and Schwert (2002) find that there is a strong
relation between IPO initial returns and the following number of IPOs. The authors claim that
similar firms tend to conduct an IPO at about the same time. Furthermore, the deal specific
information on the IPO during registration period becomes gradually public, and has an
impact on other firms’ pricing and decisions to go public, which implies that market timing
and benchmarking of peers jointly lead into a high IPO volume and a reduction in the
probability of a deal failure. Ritter and Welch (2002), on the other hand, claim that IPOs tend
to occur at times of higher aggregate market values. Lowry (2003) studies fluctuation in
economy-wide IPO volume and finds that stock market variables are strongly related to
number of IPOs. Namely, various combinations of market-to-book and stock returns have
significant impact on the number of IPOs. Finally, Pastor and Veronesi (2005) conclude that
IPO waves tend to occur after periods of high market returns and to be followed by fairly low
returns.
2.1.2 Investment related demand for capital
Traditional pecking order theory implies that adverse selection problem is likely to be large
when firms do not have promising investment opportunities. Further, cost of issuing equity
picks up when the lemons problem, making a distinction between good and bad investment
project, grows in importance. In general, the adverse selection problem is material when the
economy is in downturn, and according to pecking order theory, firms should prefer using
internal capital or issuing risk-free debt. Therefore, the general level of demand for capital can
be seen as a possible determinant on the equity issue decision. (Myers and Majluf (1984) and
Choe et al. (1993))
Choe et al. (1993) examine time series predictions on the determinants of equity issues and
the impact of issuer characteristics on the announcement returns. Accordingly, equity issues
occur at times when adverse selection costs are at their lowest. The low adverse selection cost
periods are likely to occur when economy is booming and firms have promising investment
opportunities. Choe et al. (1993) report evidence supporting the adverse selection hypothesis
and conclude that the equity share in all new issues increases in expansionary business cycles.
In addition, when the impact of business cycle variables are correctly controlled, neither past

13
stock returns nor interest rates is found to be significantly related to equity issuance. In other
words, they argue that the impact of business cycle variables actually causes the linkage
between the proven strong impact of stock market variables on equity issuance.
Bayless and Chaplinsky (1996) find that hot SEO market issuers have high demand for capital
and therefore, issuing equity seems well motivated from the investors’ perspective. Similarly,
Lowry (2003) studies the fluctuation in the IPO volume by means of aggregate and industry
level time-series regressions. Her findings indicate that both demand for capital and investor
sentiment are important factors contributing to the number of IPOs. Furthermore, when
demand for capital increases, a rise in IPO volume is likely to occur and similarly, ceteris
paribus, firms tend to go public when investor sentiment is high. Finally, Brau, Ryan, and
DeGraw (2006) investigate the link between the financial theories and CFO perceptions of
IPO firms’. The survey reveals that demand for capital and future access to seasoned equity
motivates firms to go public.
2.1.3 Asymmetry of information
In response to the static tradeoff theory, Myers and Majluf (1984) and Myers (1984) argue
that asymmetric information plays a key role in firms’ capital issuance decisions. Moreover,
asymmetric information pushes firms to follow the financing pecking order, according to
which internally generated capital is always preferred to external capital and debt preferred to
equity. Namely, the information asymmetry of debt capital is less detrimental as opposed to
the equity. However, empirical evidence to support the time-varying asymmetric information
costs as the explanation for the existence of equity cycles is quite limited, yet some authors
point to its direction as the primary SEO determinant.
According to Bayless and Chaplinsky (1996), firms could see periods of low asymmetric
information as a window of opportunity to issue equity. They define window of opportunity
to exist when the information asymmetry is at historically low level in the whole economy. In
such periods firms are able to signal their value and intent to investors more precisely. One
such signal could be an intensive capital expenditure program, in which case the investors
could easily verify firm’s need for capital, and make a distinction from a situation where the
main motivation to issue equity is purely opportunistic stock overvaluation. In these
circumstances, demand for capital and information asymmetry hypotheses partly overlap and
it can be impossible to completely distinguish between the consequences of each of them. The

14
authors further report that investors respond differently to the firm characteristics of equity
issuers in hot and cold markets and conclude it as an indirect evidence of information
asymmetry playing a role in equity issuance. Namely, investors pay more attention to
variables of firm quality and future prospects, such as market-to-book ratio, during the cold
periods.
Dierkens (1991) studies the information asymmetry between managers and investors and its
implications on equity issuance. She builds on the assumption that managers have superior
information on firm specific events which in turn creates information asymmetry. Moreover,
the problem of asymmetric information rises in importance every time the firm seeks external
funding from the capital markets. The hypothesized proxies of information asymmetry are the
stock market reaction to earnings announcements, residual variance of the stock returns,
intensity of public announcements and intensity of trading. Dierkens (1991) concludes that
the proxies of information asymmetry are significantly related to the announcement effect and
timing of SEOs. Choe et al. (1996), on the other hand, find that stock price run-up and low
stock return volatility are both determinants of high equity issue activity and conclude that
those variables reflect decreased information asymmetry.
The first studies on the role of information asymmetry in equity issuance concentrate on the
economy-wide relations. To better understand the impact of information asymmetry on
security issue decision at the cross section, a new arm of studies investigates the impacts of
temporal variation in firm-specific information asymmetry. D’mello and Ferris (2000) report
negative relation between analysts’ forecast dispersion and the SEO announcement return.
Their findings imply that firms with less uncertainty for future prospects are better off when
issuing equity as opposed to the firms with larger uncertainty. Autore and Kovacs (2009)
hypothesize that the firms having severe information discrepancy between management and
investors in general are likely to time the equity issues for periods of lower discrepancy. They
find cross-sectional measures of information asymmetry to be strongly linked to the equity
issuance, lower information asymmetry implying an increased likelihood of equity issue
decision. Moreover, further tests reveal that the results are not monotonic by nature, but
instead driven by a subsample of firms having high information asymmetry in general. Those
firms exploit periods of low asymmetry to conduct an SEO. Finally, Lee and Masulis (2009)
use the quality of accounting information as a proxy for information asymmetry. Low
accounting information quality theoretically could increase the discrepancy between company

15
insiders and investors. Namely, insiders know the quality of the firm despite the quality of
reporting, while investors’ perceptions on the firm are guided by the accounting information.
They conclude that the firms with poor accounting information content face larger issue costs
and more negative SEO announcement effects than firms of good information quality.
Walker and Yost (2008) study the determinants of SEO decision and the use of proceeds.
They find that regardless of what firms say, they are likely to increase capital expenditures,
research and development expenditure and long-term borrowing after the issue. Interestingly,
the authors find that if the firm provides specific plans for the uses of proceeds, investors are
more optimistic (less negative) around the SEO announcement. Moreover, investors value
marginal dollar in a firm more if managers do not have excess cash and large discretion over
the uses of funds. Their findings indicate that asymmetric information between management
and shareholders, the principal-agent problem, is an essential component of the SEO decision
and a determinant of the stock performance around the announcement of the issue.
Dittmar and Thakor (2007) suggest a model of equity issuance building on both market timing
and information asymmetry arguments. The empirical investigation of the hypothesized
model yields the following results: First, firms issue equity after increases in stock prices.
Second, firms also issue equity when proxies on managers’ and equityholders’ perceptions on
the firm prospects are aligned regardless of the stock performance. Finally, they conclude that
the agreement between shareholders and management has explanatory power in SEO decision
even after controlling for the level of stock returns. Dittmar and Thakor (2007) therefore
combine two among the most influential theories of equity issuance and show that the
determinants of SEOs have not yet been fully explored.
2.1.4 Investor sentiment
A more recent area of interest in behavioral corporate finance addresses the impacts of
investor sentiment in the stock market. To date, investor sentiment has been found to be
present in the contemporaneous stock returns, and also to some degree, have predictive power
in the future aggregate stock returns (see, e.g., Baker and Wurgler, (2006) and (2007), Fisher
and Statman, (2000)). Growing body of research takes either “irrational investors approach”
or “irrational managers approach” and explain some aspects of the behavioral corporate
finance from either one of the two perspectives (Baker, Ruback and Wurgler, 2005). The
evolution of studies about the role of investor sentiment has evolved over time and according

16
to Baker et al. (2005), the question no longer is whether investor sentiment is present, but
merely, how to measure it and to quantify its influences.
Lowry (2003) studies macro level determinants of IPOs and suggests that over-optimism
among small investors implies a greater likelihood to participate in an equity offering.
Knowing the general level of investor sentiment in the economy, firms could exploit
fluctuations in sentiment to time the equity offerings for periods of high sentiment. Lowry
(2003), using data on closed-end-fund discounts, finds investor sentiment to be an important
determinant of IPO volume. Ljungqvist, Nanda and Singh (2006) propose an alternative
theory on IPO issuance in which sentiment investors’ demand play a crucial role. Further,
sentiment investors’ demand provides regular investors with exit opportunities and guarantees
that regular investors are interested in getting an allocation in new issues, if those are
underpriced on average. Underpricing compensates the regular investors for bearing the risk
of a rapid decline in investor sentiment, which can lead to sentiment investors vanishing from
the market. The theory of Ljungqvist et al. (2006) is consistent with both underpricing of
IPOs and the role of investor sentiment as an equity issue determinant.
2.1.5 Firm specific issuer characteristics
This subsection pools together the key firm characteristics that relate to the likelihood of
equity issue decision. Along with the four distinct hypotheses on the determinants of SEOs
presented in the previous subsections, an SEO decision strongly relates to certain firm-
specific factors. According to Bayless and Chaplinsky (1996) a typical equity issue type firm
experiences less negative abnormal returns around the announcement as opposed to a firm
with typical debt issuer characteristics when issuing seasoned equity. Moreover, the authors
claim that the characteristics closely related to the increased likelihood of an equity issue, or
being an equity issue type firm, are low financial flexibility (cash flow over all positive NPV
investments), high recent stock price performance, low tax benefit of debt, high costs of
financial distress and small firm size. Similarly Rajan and Zingales (1995) identify a set of
variables that are closely related to the firm leverage: market-to-book ratio, asset tangibility,
firm size and profitability. DeAngelo et al. (2007) and Leary and Roberts (2005) point out
that equity issuing firms are often financially constrained. They use Altman’s Z-score to
capture the effect of missing financial flexibility.2 Finally, Jenter (2005) finds that seasoned
2 Leary and Roberts (2005) specify Altman’s Z-score as the sum of 3.3 times earnings before interest and taxes plus sales plus 1.4 retained earnings plus 1.2 times working capital, all divided by total assets.

17
equity offerings coincide with insider selling. His findings are consistent with market timing
based theories on equity issuance according to which the management holds information that
investors do not have.
Dittmar and Thakor (2007) discuss the control variables to be used in the tests of firm
financial policy. They state that in order to distinct between consequences of pecking order
and tradeoff theory, a certain set of control variables should be included in the analysis of the
financial policy. Moreover, larger firms have lower costs of debt and therefore, natural
logarithm of sales should be included as a control variable. Dittmar and Thakor (2007) and
Rajan and Zingales (1995) argue that profitable firms often have higher agency costs
associated with debt, and thus return on assets should be used as a control variable. Also,
financial slack, defined as cash and cash equivalents divided by total assets, implies lower
need for external financing. Firms with research and development expenditures have higher
agency costs of debt and should prefer equity over debt. Rajan and Zingales (1995) also point
out that firms with high tangibility of assets, measured as property, plant and equipment
divided by total assets, are more likely to issue debt. Finally, based on the tradeoff theory of
capital structure, firms with high leverage prefer issuing equity due to the increased level of
marginal costs of debt.
2.3 Empirical evidence on the stock market performance of the SEO firms
Equity issuers’ stock market performance has been studied extensively in the recent literature.
Various authors have reported stock price run-ups before offering, negative returns during a
short window around the announcement and finally, weak performance in the long-term
following an offering. In this chapter, I will highlight the most influential literature on
announcement effect, long-term performance and the theories explaining the observed market
reactions.
UK equity market has several distinct characteristics from an equity issuer’s perspective,
which should be noted when analyzing the empirical results. First, the predominant issue
method in the US is cash offerings, whereas in the UK, rights offerings remained the usual
floatation method choice in SEOs for a long time. Moreover, the rights offerings protect
shareholders from diluting their ownership in the firm and thus, enable maintaining the voting
rights in the firm regardless of the equity issue. Slovin et al. (2000) concludes that the use of

18
insured rights offerings exposes the firm for larger adverse selection costs, as the underwriting
provided by the third party reveals management concerns regarding a negative stock price
performance preceding the decided issue date. Recent studies by Andrikopoulos (2009) and
Barnes and Walker (2006) show that the use of rights issues has lessened since the mid-1990s
to the detriment of other floatation methods’ increasing popularity. Furthermore, the event
data sample covering period 1999-2007 that I employ in the thesis contains only 6.1 % of
rights offerings. Second, while both US and UK corporate governance systems are considered
as Anglo-American type, some differences exist that can have implications for the equity
issues. Namely, the UK institutional investors own some 84.7 % (2004) of the total market
capitalization, while the similar figure for US amounts to 58.0 % (2002) and additionally, the
US CEOs have much higher discretion concerning the firm’s decision making. UK
institutional ownership is concentrated to the hands of insurance companies and pension
funds, both of which are characterized as long-term oriented patient capital as opposed to the
mutual funds and investment advisors controlling for the majority of US institutional
ownership. (Aquilera, Williams, Conley and Rupp, 2006)
2.3.1 Announcement effect
This subsection pools together the main literature from the area of seasoned equity issuers’
abnormal announcement returns.3 According to the efficient market hypothesis, an
announcement that does not reveal information on changes in the firm’s cash flow should not
stimulate stock price changes. Yet, various theories exist to explain why negative
announcement effect of SEOs takes place. On one hand, a new equity issue can decrease
firm’s leverage and weaken the tax advantages of debt, and on the other hand, an
unanticipated equity issue makes firm’s debt safer implying a wealth transfer from
equityholders to debtholders. As already stated in the previous section, the managements’
decision to issue equity reflects information on the firm’s intrinsic value. Changes in capital
structure of a firm reveal also information regarding the management’s perception on the
firm’s future. Specifically, high leverage is a binding constraint on the firm and signals
management’s optimism on the firm outlook. Finally, negative announcement effect can
reflect the considerably large transaction costs of the new issues. (Modigliani and Miller
(1963), Asquith and Mullins (1986), Ross (1977))
3 Traditionally, the announcement return has been measured during a two-day event window [-1,0] or during a three-day event window [-1,+1]. In the empirical analysis I use the latter, but in the literature review I treat them equivalently.

19
The literature quantifying the announcement effect of SEO firms has been evolving since
mid-1980s as Asquith and Mullins (1986) and Masulis and Korwar (1986) reported
significantly negative announcement effects in the magnitude of -3 % respectively. Asquith
and Mullins (1986) further state that the observation of negative announcement return can be
explained by the decrease in tax advantages, if the issue has a lowering impact on firm’s
leverage ratio. While the tax advantages of debt is an often noted reason for the negative
announcement effect of SEOs, the predominant explanation for the phenomenon is Myers and
Majluf’s (1984) pecking order theory and its adverse selection implications. Accordingly the
announcement of SEO reveals information on management’s perception on the firm’s
intrinsic value, and investors find the information concerning filing an SEO negative.
Moreover, the management is likely to see firm’s market value to be at a high level relative to
its intrinsic value. Both Asquith and Mullins (1986) and Masulis and Korwar (1986) report
more negative announcement returns for industrial firms than for public utility firms. They
conclude that public utilities firms’ lower negative returns may reflect the lower discretion
that the management has on timing an SEO. Mikkelson and Partch (1986) find a negative
announcement effect well in line with earlier research. They hypothesize that management’s
decision to conduct an SEO reveals information for the investors as management would
cancel the issue if stock turned out to be undervalued at the pre-defined announcement date.
After the first studies to document the negative announcement return on SEOs in the US in
the mid-1980s, a number of studies have confirmed that the phenomenon still holds. Slovin et
al. (1994) study a sample of firms issuing seasoned equity after becoming listed in the US.
They find that the SEO firms have highly concentrated ownership, are reluctant to go to the
debt market and earn a significantly negative announcement return. Also Dierkens (1991)
reports an average abnormal return of the similar size, yet highlighting that at times of lower
asymmetric information the announcement returns are likely to be less negative. According to
Eckbo, Masulis and Norli’s (2007) thorough survey on SEOs, the average negative abnormal
return on SEOs in the US is some 2.2 % and clearly statistically significant.
A number studies aim to provide a more profound explanation for the negative announcement
effect of the SEOs. Bayless and Chaplinsky (1996) study periods of high and low equity
issuance volume. They find that the SEOs in hot cycles yield negative announcement return
on average, but issues during cold cycles yield some 130 basis points more negative

20
announcement effects. They suggest that the lower negative returns at times of high issuance
volume imply lower information asymmetry between managers and investors. Choe et al.
(1993), on the other hand, state that the negative announcement returns on equity issues are
smaller when economy is booming and information asymmetry is lower compared to times of
slow economic activity when more uncertainty in asset prices exist. Walker and Yost (2008)
divide firms into subsamples based on their intended use of proceeds. While the total sample
experiences a significantly negative announcement return, the firms that are expected to invest
the proceeds immediately face on average 50 basis points less negative announcement return.
Table I
Literature on SEO announcement returns
The table summarizes some of the main findings in the area of SEO announcement effect. All the studies employ either [-1,0] or [-1,+1] as the event window. First studies to report the negative announcement effect of SEOs were published in 1986 and the body of literature on topic is continuously increasing.
Table I above pools together the research on SEO announcement returns conducted using US,
UK and international data respectively. The international evidence on SEOs remained fairly
narrow for a long time, but has broadened recently. Eckbo et al. (2007) state that there are
significant country-specific institutional differences, and as opposed to the common practice
in the US, the rights issues have remained the most often used transaction type in the smaller
economies. In many of the smaller countries, the reported announcement returns have been
Asquith and Mullins (1986) 392 1963–81 US -3.00%Masulis and Korwar (1986) 972 1963–80 US -3.30%Mikkelson and Partch (1986) 80 1972–82 US -3.56%Dierkens (1991) 197 1980-83 US -2.40%Eckbo and Masulis (1992) 1,057 1963–80 US -2.00%Choe, Masulis and Nanda (1993) 1,456 1963-83 US -3.15%a
Denis (1994) 435 1977–90 US -2.49%Bayless and Chaplinsky (1996) 1,884 1968–90 US -2.65%b
Bethel and Krigman (2004) 2,592 1992-01 US -2.01%Heron and Lie (2004) 3,658 1980–98 US -2.50%
Burton, Lonie and Power (2000) 37 1989-91 UK -7.76%c
Slovin, Sushka and Lai (2000) 296 1986-94 UK -1.44%d
Barnes and Walker (2006) 868 1989-98 UK -0.33%d
Bøhren, Eckbo, and Michalsen (1997) 114 1980-93 Norway -0.23%Gajewski and Ginglinger (2002) 215 1986-96 France -0.80%Cronqvist and Nilsson (2005) 199 1986-99 Sweden 5.43%d
Wu, Wang, and Yao (2005) 405 1989-97 Hong Kong 1.94%d
Quynh-Nhu (2009) 82 1996-03 Finland -3.60 %a abnormal return for industrial firms only, b equally weighted average between hot and cold markets, c sample containing only standby rights offerings, d equally weighted average between all issue types
Abnormal return Author(s) Sample size Sample period Market
21
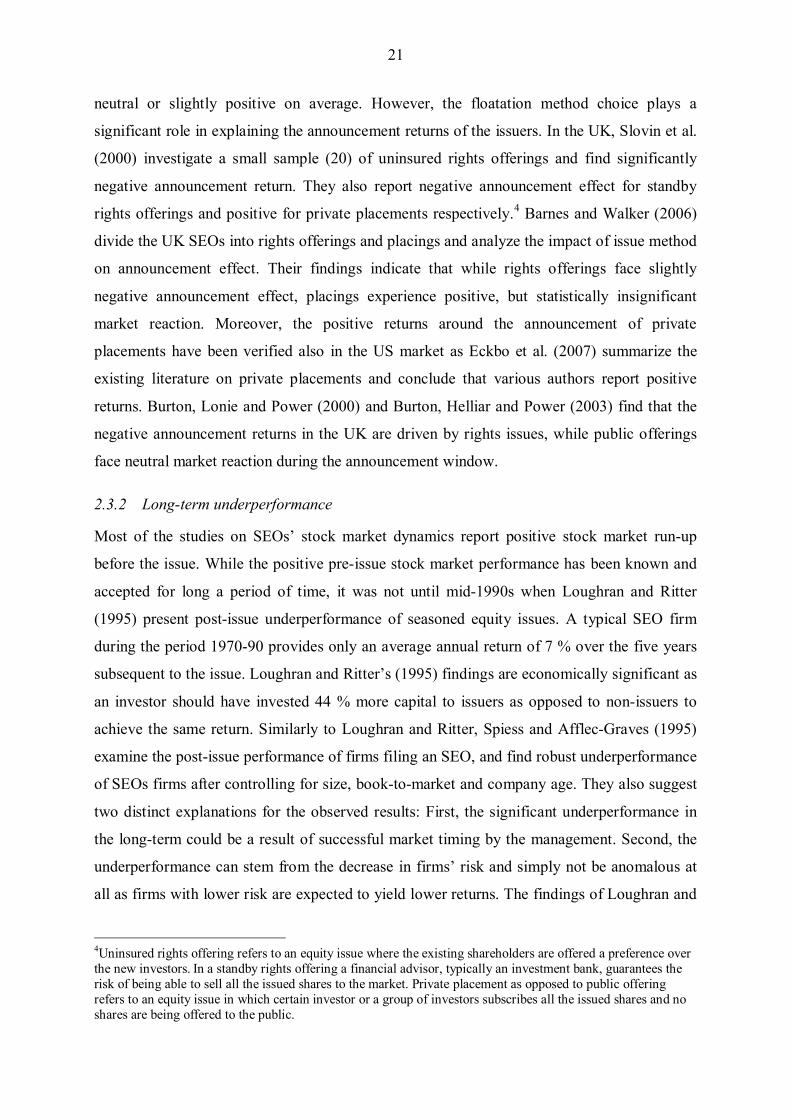
neutral or slightly positive on average. However, the floatation method choice plays a
significant role in explaining the announcement returns of the issuers. In the UK, Slovin et al.
(2000) investigate a small sample (20) of uninsured rights offerings and find significantly
negative announcement return. They also report negative announcement effect for standby
rights offerings and positive for private placements respectively.4 Barnes and Walker (2006)
divide the UK SEOs into rights offerings and placings and analyze the impact of issue method
on announcement effect. Their findings indicate that while rights offerings face slightly
negative announcement effect, placings experience positive, but statistically insignificant
market reaction. Moreover, the positive returns around the announcement of private
placements have been verified also in the US market as Eckbo et al. (2007) summarize the
existing literature on private placements and conclude that various authors report positive
returns. Burton, Lonie and Power (2000) and Burton, Helliar and Power (2003) find that the
negative announcement returns in the UK are driven by rights issues, while public offerings
face neutral market reaction during the announcement window.
2.3.2 Long-term underperformance
Most of the studies on SEOs’ stock market dynamics report positive stock market run-up
before the issue. While the positive pre-issue stock market performance has been known and
accepted for long a period of time, it was not until mid-1990s when Loughran and Ritter
(1995) present post-issue underperformance of seasoned equity issues. A typical SEO firm
during the period 1970-90 provides only an average annual return of 7 % over the five years
subsequent to the issue. Loughran and Ritter’s (1995) findings are economically significant as
an investor should have invested 44 % more capital to issuers as opposed to non-issuers to
achieve the same return. Similarly to Loughran and Ritter, Spiess and Afflec-Graves (1995)
examine the post-issue performance of firms filing an SEO, and find robust underperformance
of SEOs firms after controlling for size, book-to-market and company age. They also suggest
two distinct explanations for the observed results: First, the significant underperformance in
the long-term could be a result of successful market timing by the management. Second, the
underperformance can stem from the decrease in firms’ risk and simply not be anomalous at
all as firms with lower risk are expected to yield lower returns. The findings of Loughran and
4Uninsured rights offering refers to an equity issue where the existing shareholders are offered a preference over the new investors. In a standby rights offering a financial advisor, typically an investment bank, guarantees the risk of being able to sell all the issued shares to the market. Private placement as opposed to public offering refers to an equity issue in which certain investor or a group of investors subscribes all the issued shares and no shares are being offered to the public.

22
Ritter (1995) and Spiess and Afflec-Graves (1995) are striking in the sense that they challenge
efficient market hypothesis and motivates the development of behavioral asset pricing
models. Finally, the existing literature on the UK post-issue stock market performance reports
an average annual underperformance of approximately 5 %, which is well in line with the
evidence from the US.
Numerous researches have criticized the findings and questioned their robustness. After the
“new issues puzzle”, the underperformance of equity issuers following an issue, was
presented, a number of authors have questioned the robustness of the phenomenon. Mitchell
and Stafford (2000) and Brav, Greczy, and Gombers (2000) state that the underperformance
of new issues stems from model misspecification, and is attributable to the wrong benchmarks
used. Eckbo, Masulis and Norli (2000) are of the same opinion and explain that when firms
issue equity, they lower the company specific default risk and therefore, should provide a
lower return on equity. In addition, they suggest that as an SEO significantly increases the
liquidity of the stock, it further lowers the issuer’s expected return and consequnetly, the
matching firm or portfolio becomes less suitable for comparing the post-issue returns. Eckbo
et al. (2000) conclude that the new issues puzzle is a result of matching firm technique’s
inability to adjust for company specific risk. Fama (1998) questions the long-term post-issue
underperformance and suggests that long-term anomalies are extremely sensitive to the
selected methodology. Moreover, the assumptions on normal returns and statistical
approaches on measuring them can be responsible for the anomaly. Fama (1998) assumes the
high returns prior to the issue to reflect high earnings and he explains that if investors do not
fully understand that earnings will mean-revert in the long-run, the investors only gradually
react in the long-run, and consequently the firm underperforms following an SEO. Finally,
Fama (1998) concludes that if an anomaly disappears when different methodology is used to
detect it, and all studies replicate the robustness tests employed by the first studies in the
subject, the anomaly as such can be an illusion.
23
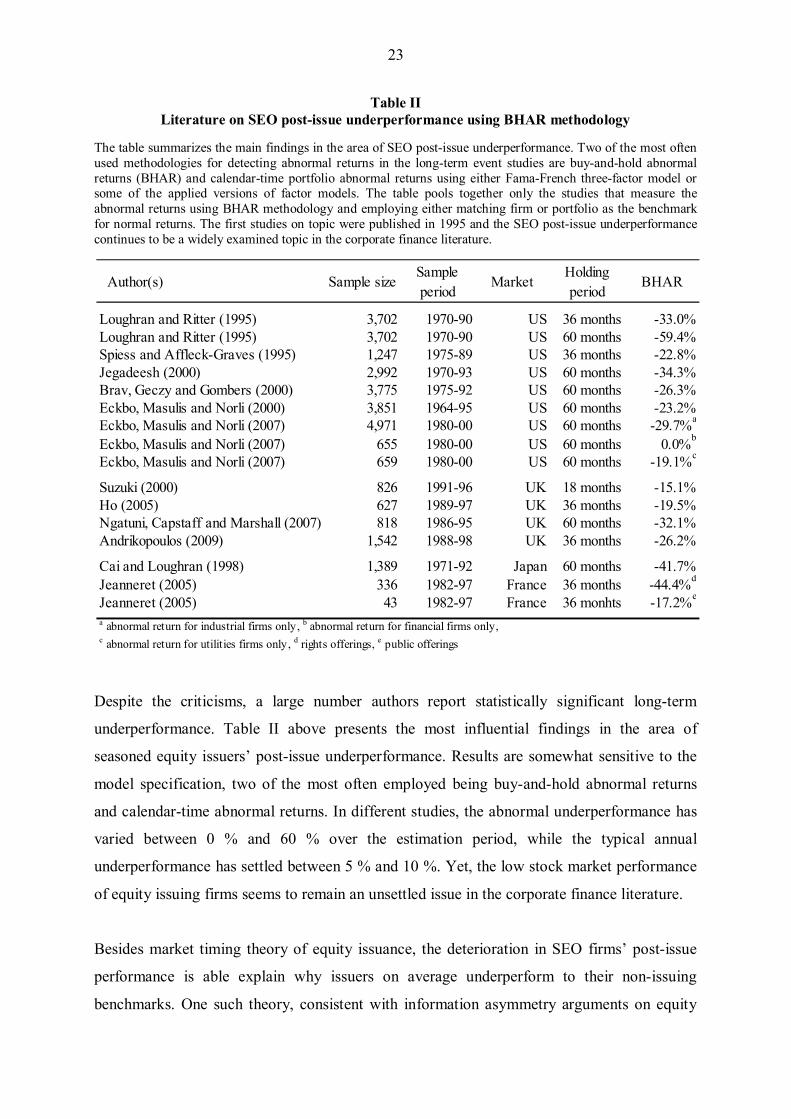
Table II Literature on SEO post-issue underperformance using BHAR methodology
The table summarizes the main findings in the area of SEO post-issue underperformance. Two of the most often used methodologies for detecting abnormal returns in the long-term event studies are buy-and-hold abnormal returns (BHAR) and calendar-time portfolio abnormal returns using either Fama-French three-factor model or some of the applied versions of factor models. The table pools together only the studies that measure the abnormal returns using BHAR methodology and employing either matching firm or portfolio as the benchmark for normal returns. The first studies on topic were published in 1995 and the SEO post-issue underperformance continues to be a widely examined topic in the corporate finance literature.
Despite the criticisms, a large number authors report statistically significant long-term
underperformance. Table II above presents the most influential findings in the area of
seasoned equity issuers’ post-issue underperformance. Results are somewhat sensitive to the
model specification, two of the most often employed being buy-and-hold abnormal returns
and calendar-time abnormal returns. In different studies, the abnormal underperformance has
varied between 0 % and 60 % over the estimation period, while the typical annual
underperformance has settled between 5 % and 10 %. Yet, the low stock market performance
of equity issuing firms seems to remain an unsettled issue in the corporate finance literature.
Besides market timing theory of equity issuance, the deterioration in SEO firms’ post-issue
performance is able explain why issuers on average underperform to their non-issuing
benchmarks. One such theory, consistent with information asymmetry arguments on equity
Loughran and Ritter (1995) 3,702 1970-90 US 36 months -33.0%Loughran and Ritter (1995) 3,702 1970-90 US 60 months -59.4%Spiess and Affleck-Graves (1995) 1,247 1975-89 US 36 months -22.8%Jegadeesh (2000) 2,992 1970-93 US 60 months -34.3%Brav, Geczy and Gombers (2000) 3,775 1975-92 US 60 months -26.3%Eckbo, Masulis and Norli (2000) 3,851 1964-95 US 60 months -23.2%Eckbo, Masulis and Norli (2007) 4,971 1980-00 US 60 months -29.7%a
Eckbo, Masulis and Norli (2007) 655 1980-00 US 60 months 0.0%b
Eckbo, Masulis and Norli (2007) 659 1980-00 US 60 months -19.1%c
Suzuki (2000) 826 1991-96 UK 18 months -15.1%Ho (2005) 627 1989-97 UK 36 months -19.5%Ngatuni, Capstaff and Marshall (2007) 818 1986-95 UK 60 months -32.1%Andrikopoulos (2009) 1,542 1988-98 UK 36 months -26.2%
Cai and Loughran (1998) 1,389 1971-92 Japan 60 months -41.7%Jeanneret (2005) 336 1982-97 France 36 months -44.4%d
Jeanneret (2005) 43 1982-97 France 36 monhts -17.2%e
a abnormal return for industrial firms only, b abnormal return for financial firms only, c abnormal return for utilities firms only, d rights offerings, e public offerings
BHAR Author(s) Sample sizeSample period
MarketHolding period

24
issuance, is the deterioration of operative performance following an issue. Accordingly,
managers can manipulate firm accounting information leading into a bias in investors’
expectations on the firm prospects. The weakening of operating performance over long-
horizon after the SEOs gradually narrows information asymmetry between managers and
investors resulting into a revision of valuations and post-issue underperformance. Loughran
and Ritter (1997) find that firms’ operative performance improves sharply before an SEO and
causes a run-up in the stock price. However, the operative performance of the issuers starts to
deteriorate soon after the issue and results in poor long-term stock returns. Andrikopoulos
(2009) studies the determinants of long-term underperformance using a sample of UK equity
issuers. He uses various indicators of operating performance, for instance return on assets
(ROA) and net profit margin, and concludes that firms’ performance sharply declines
immediately after the SEO and continues to deteriorate for up to three years following an
SEO.
Due to the partial inability of some of the existing theories to explain the stock price
mechanism around the SEOs, Carlson, Fischer, and Giammarino (2006) present a theory
utilizing real-option framework. According to Carlson et al. (2005, 2006), firms issue equity
when they grow in size and end up using the proceeds to convert real-options into assets in
place. Even if the assets are risky in general, they are less risky than the real options held by
the firms, and the reduced risk explains long-term underperformance documented by
Loughran and Ritter (1995) and others. The real-option framework by Carlson et al. (2006)
actually comes close to the arguments of Eckbo et al. (2000), according to which equity issues
generally decrease firm default risk. Namely, the common factor explaining the poor long-
term performance in both cases is the reduction in risk due to capital flow in fixed assets. The
theory of Carlson et al. (2005, 2006) can explain also pre-issue stock price run-up, as firms
only convert options into assets when the options move significantly in the money. The stock
price run-up thus is a result of firm’s real-options moving from out of the money to in the
money. The theory assumes that the projects become as real-options, since they are flexible in
time and additionally, managers can delay and time the projects for the periods when they
yield the highest possible return. Interestingly, while market timing theory assumes managers’
ability to time the market to lead into low post-issue returns, the real-option theory presented
by Carlsson et al. (2006) assumes that lower future returns stem from lower risk after SEO
proceeds are converted from real-options into assets.

25
Besides the real-option framework, by Carlson et al. (2006), a few other studies point out the
importance of investment opportunities in explaining the post-issue performance. Autore,
Bray and Peterson (2009) analyze the role of use of proceeds in SEO returns and report results
that indicate investment purposes to be the only category with insignificant abnormal
underperformance. Moreover, emplying BHAR and factor-models, they conclude that all the
other use of proceed classes significantly underperform in the long-term. Lyandres, Sun and
Zhang (2008) study post-issue returns and agree that the presence of investment opportunities
actually explains the majority of the abnormal stock price performance.
Schulz (2003) presents an alternative theory, pseudo market timing, to explain poor long-term
stock performance following an SEO. He argues that most of the SEOs occur after stock
market has been bullish in general, since issues often take place during the hot cycles, which
occur when the stock market is at a high level. After the stock price run-ups, the future returns
are likely to be lower. Therefore, majority of the seasoned equity offerings are likely to
perform poorly and the managements’ market timing does not account for the phenomenon.
Schulz (2003) suggests that calendar-time portfolio approach to eliminate the impact of time
and fluctuating stock market, which however, is not problem-free according to Jegadeesh
(2000).
3 HYPOTHESES
This section will present the hypotheses that are tested in the study. The hypotheses are
mainly based on the existing literature presented in Chapter 2. I will first motivate and posit
the hypotheses on the macro determinants of equity issues. Secondly, I will posit the
hypotheses on the micro level determinants of SEOs, put differently the factors that can
explain why some firms choose to issue equity and others debt. Finally, I pose hypotheses on
the abnormal returns during the announcement period and in the post-issue period. All the
hypotheses are pooled into a table III at the end of the chapter.
3.1 Macro level determinants of SEOs
The various hypotheses for equity issue determinants presented in the literature are partly
overlapping. Namely, firms tend to issue equity when stock prices are high, which is also
likely to occur simultaneously with rising economic activity and profitable invest

26
opportunities. Furthermore, at those time periods, information asymmetry can be fairly low as
investors know that the management faces promising investment opportunities. Investor
sentiment can also be inflated by the recent stock market run-up. Despite the partial overlap in
different equity issue determinant theories, I test the following hypotheses separately making
an effort to pick well specified proxies.
Vast majority of the studies on SEOs document that equity issues are likely to occur at times
of high market valuation levels. In addition, Graham and Harvey (2001) survey CEOs
motivations for SEOs and find that market timing is one of the key reasons for firms to
conduct an SEO. Baker and Wurgler (2002) hypothesize that firms issue equity to time the
market and utilize irrational investors’ inability to adjust their valuations following a stock
market run-up. Following prior literature, I choose aggregate median market-to-book of all
listed UK firms and 12-month past raw stock market return on FTSE All-Share index as the
macro level market timing proxies. On the contrary, as Baker and Wurgler (2000) state that
high SEO volume periods tend to occur just before stock market crashes, I include future 12-
month raw return on stock market index as an additional market timing proxy.
H1. Macro volume of SEOs increases with market timing.
Following Lowry (2003), I hypothesize that adverse selection cost of issuing equity fluctuates
over time. Moreover, information asymmetry between managers and the equityholders of the
firm forces managers to issue equity when the adverse selection costs are minimized and
management’s and investors’ opinions aligned. Myers (1977) and Myers and Majluf (1984)
show that adverse selection forces firms to reject positive NPV projects, if financing cannot
be arranged at favorable terms. Bayless and Chaplinsky (1996) and Dierkens (1991) find that
equity issues tend to cluster in periods with smaller average announcement effects.
Furthermore, those periods are negatively correlated with the measures of information
asymmetry. According to Dittmar and Thakor (2007), management wishes to issue equity if
investors’ perceptions on the upcoming investment projects are aligned with the management.
In other words, management wants the information asymmetry to be minimized before
committing an SEO. I choose the aggregated standard deviation of analysts’ recommendations
on the FTSE 100 constituents and daily market volatility within a quarter as the macro level
information asymmetry proxies. Furthermore, when analysts’ opinions on the firm value are

27
aligned and stock market index is behaving steadily, I hypothesize more firms to conduct an
SEO.
H2. Macro volume of SEOs decreases with asymmetric information.
Firms face higher demand for capital, when they have promising investment projects
available. In general, upward business cycles tend to provide firms with better investment
opportunities. Choe et al. (1993) investigate the impact of the business cycles on firms’
decision to issue equity. They find firms’ demand for capital to be highest at times of
favorable economic conditions – firms are likely to have promising positive NPV investment
projects when the economy is booming and investors are willing to invest new equity in the
firms. Following Lowry (2003), I choose GDP growth, average sales growth among all the
public firms and average interest rate within a quarter as the macro level demand for capital
proxies. GDP growth measures the aggregate state of the economy, while firms’ sales growth
should theoretically be followed by higher need for investment to support the growth. Finally,
investment projects’ NPVs are likely to be positive when discount rates are low.
H3. Macro volume of SEOs increases with demand for capital.
Lowry (2003) finds investor sentiment to be a strong determinant of the IPO volume. In
addition, she states that during some periods, investors are overly optimistic and willing to
pay more for firms than they are actually worth. As SEOs are clustered for high volume
cycles, I hypothesize that investor sentiment is also a determinant of the SEO volume. Qiu
and Welch (2005) discuss the strengths of various investor sentiment proxies and conclude
that consumer confidence correlates strongly with actual investor sentiment and has additional
theoretically sound characters, such as the ability to explain small-firm return spread and
closed-end-fund IPO activity. Therefore, I choose consumer sentiment index as the investor
sentiment proxy at the macro level.
H4. Macro volume of SEOs increases with investor sentiment.
3.2 Micro level determinants of SEOs
In the micro level determinant hypotheses, I refer solely to the firm specific characteristics to
distinct between equity issue type firms and debt issue type firms. Similarly to macro
determinant level, I hypothesize that equity issuers at micro level, are motivated by market
timing to issue equity. I test whether the equity issuers have experienced higher 12-month raw

28
stock returns, have higher market-to-book ratios and have lower future 12-month raw stock
returns in comparison to debt issuers.
H5. The likelihood of an SEO relative to a debt issue increases with market timing.
As already pointed out, pecking order considerations and time-varying adverse selection costs
suggest that the equity issuing firms are not suffering severely from information asymmetry. I
assume that the firms who are followed by analysts can communicate their intrinsic value to
investors more accurately. Therefore I hypothesize that firms followed by the analysts are
more likely to choose equity financing over debt than companies not followed by analysts. In
addition, Dittmar and Thakor (2007) point out that low leverage firms are likely to have
strong growth opportunities and suffer from asymmetric information. Therefore, I hypothesize
that firm’s leverage is negatively associated with information asymmetry and positively
associated with the likelihood of an equity issue.
H6. The likelihood of an SEO relative to a debt issue decreases with asymmetric information.
Building on the framework discussed by Myers (1977) and Rajan and Zingales (1995) in their
recent paper, Dittmar and Thakor (2007) note that firms of higher growth opportunities have
higher agency costs of debt. Therefore, the firms with high demand for capital resulting from
growth opportunities can prefer issuing equity over debt. I choose sales growth during the
year of the issue and the level of capital expenditures during the year of the issue divided by
total assets at the end of previous year as the proxies of firm-specific demand for capital.
Finally, the third micro level demand for capital proxy is the reporting of research and
development expenditures during the previous year.
H7. The likelihood of an SEO relative to a debt issue increases with demand for capital.
3.3 Issuer stock market performance
The empirical evidence on SEO announcement effect typically reports a negative stock
market reaction, but further evidence exists to explain the determinants of announcement
effect. Bayles and Chaplinsky (1996) find that equity issues at times of high SEO volume
experience less negative announcement returns than issues during low SEO volume periods.
However, the less negative market reaction during periods of high SEO volume could be a
consequence of market timing, information asymmetry, demand for capital or investor
sentiment. To test the impact of SEO volume, I choose the macro level SEO volume in the

29
issue quarter as the volume proxy to detect whether firms issuing during hot periods undergo
less negative announcement effect than firms issuing during cold periods.
H8. SEO announcement return increases with SEO volume.
Choe et al. (1993) discuss the possibility that the stock market reacts less negatively to SEOs
during periods of better investment opportunities due to higher demand for capital and lower
information asymmetry. At the cross-sectional level, Denis (1994) and Burton et al. (2000)
find some evidence of positive impact of sales growth and other capital demand proxies on
SEO announcement return. To test the impact of demand for capital on announcement effect,
I choose firm’s sales growth during the year of the issue as the proxy.
H9. SEO announcement return increases with demand for capital.
If firms issue equity to time the market and purely exploit stock price rising above its intrinsic
value, investors should react to the issue announcement more negatively and adjust their
valuations toward lower levels. However, agency models predict that companies having high
past stock returns are likely to face promising future outlook and positive NPV investment
opportunities. In the described circumstances, equity issues are anticipated and the stock price
reactions should not reflect negative adverse selection costs, whereas in the case of
unanticipated equity issues both pecking order and agency models predict that the
equityholders would be better off if the firm did nothing or issued debt. I test the impact of
market timing on announcement return using both firm’s past 12-month stock return and the
level of market-to-book ratio to distinct between firms of high and low market timing.
H10. SEO announcement return increases with market timing.
Earlier literature reports statistically and economically significant long-term
underperformance following an equity issue (see, e.g., Loughran and Ritter (1995), Jegadeesh
(2000)). Numerous authors explain that long-term underperformance stems from the
opportunistic activity of managers to time the equity market or alternatively, from
deterioration of firm’s operative performance. Should the company issue equity due to
attractive market timing, the post-issue long-term return should be lower than in the case of an
investment driven SEO. Namely, an investment project as the use of proceeds could alleviate
the problem of market timing and ensure the funds are put into effective use. Therefore I posit
the following two mutually non-exclusive hypotheses:

30
H11. SEO long-term underperformance increases with market timing.
H12. SEO long-term underperformance decreases with demand for capital.
The presence of market timing attempt suggests that SEOs underperform in general. In the
case of a larger issue, the underperformance should be higher. More specifically, the firms
who seek to issue a larger amount of cash than they are able to efficiently spend exploit
themselves for post-issue underperformance and show signs of managerial hubris. Therefore,
I hypothesize that larger issues are worse investments than smaller issues in the longer term.
H13. SEO long-term underperformance increases with deal size.
Table III Summary of hypotheses
4 DATA
This section introduces the data collection process and outlines the final samples. In this
thesis I investigate the determinants of SEOs from both macro and micro perspectives and the
Macro determinants of SEOs
H1 Macro volume of SEOs increases with market timing.H2 Macro volume of SEOs decreases with asymmetric information.H3 Macro volume of SEOs increases with demand for capital.H4 Macro volume of SEOs increases with investor sentiment.
Micro determinants of equity issue vs. debt issue choice
H5 The likelihood of an SEO relative to a debt issue increases with market timing.H6 The likelihood of an SEO relative to a debt issue decreases with asymmetric information.H7 The likelihood of an SEO relative to a debt issue increases with demand for capital.
Issuer stock market performance
Announcement returnH8
H9
H10
Long-term underperformanceH11
H12
H13
SEO long-term underperformance decreases with demand for capital.SEO long-term underperformance increases with deal size.
SEO announcement return increases with SEO volume.SEO announcement return increases with demand for capital.SEO announcement return increases with market timing.
SEO long-term underperformance increases with market timing.

31
performance of SEO firms. As the tests pose distinct requirements for the data, I retrieve data
for all the three purposes separately and present the sample collection processes and final
samples accordingly.
4.1 The sample collection process
4.1.1 Macro level determinants of seasoned equity offerings
The sample employed in the tests of aggregate issue volume is gathered in the following
manner. First, I search for seasoned equity offerings by UK firms listed in the London Stock
Exchange (LSE) that took place between Q1 1994 and Q3 2008 from Dealogic database5. I
further require the deal value to be greater or equal to €5 million to get rid of economically
insignificant issues and additionally, I require the issue to be a follow-on issue to exclude
IPOs and convertible issues which are not part of the study. In addition, following Lowry
(2003), I exclude issues by closed-end-funds, ADRs and REITs. The approach yields total of
2,670 SEOs taking place during 59 quarters. Secondly, I collect quarterly accounting data
from Thomson’s Worldscope and data on analyst recommendations from Thomson’s I/B/E/S
history database. Finally, I retrieve data on the relevant economic fundamentals and stock
market variables from Datastream. All the stock data employed in the tests of the thesis are
dividend and stock split adjusted total return index data, and the stock returns are calculated
as logarithm returns.
4.1.2 Micro level determinants of seasoned equity offerings
To examine the likelihood of certain firm characteristics leading into an increased probability
of an SEO, I collect cross-sectional data on equity issuers and debt issuers. I begin the data
collection process by retrieving a list of seasoned equity offerings by UK firms listed in the
LSE between Q1 1999 and Q3 2007 from Dealogic again requiring that the issue is of a size
greater than €5 million, the issue to be a follow-on offering, and exclude issues by closed-
end-funds, ADRs and REITs.6 The search yields 1,740 SEOs out of which 1,725 contain an
ISIN-code. I further exclude issues with only secondary shares sold (494) and firms with no
stock data available (357). Finally, I restrict firms with no sufficient accounting data available
(451). I collect data on the control group, the debt issuers, following the procedure used by 5 The main advantage of using Dealogic instead of Thomson SDC database or Thomson Deals database is that Dealogic reports the announcement dates for equity issues, while the two other sources report only issue dates and filing dates. 6 The beginning of the sample period is limited until 1999, as in prior years the required identification criterion, the ISIN-code, is not provided. Correspondingly, I examine the companies’ performance in the long-term and require that a minimum of 24-months of stock data exists after the issue.

32
Hovakimian et al. (2001). Further, a company year is classified as debt issuing year if the
increase in total debt between the beginning and end of the year is at least 10 % of the total
assets in the beginning of year. I search accounting data and stock data for all the sample
observations, and additionally for all the firms listed in the LSE during the corresponding
sample period, to also compare equity issuers to non-issuers.7 I collect annual historical
accounting data from Thomson’s Worldscope and the total return index stock data from
Datastream. After excluding observations with no sufficient data available I’m left with a
final sample of 423 firm years with an SEO and 1,096 firm years with a debt issue.
4.1.3 Abnormal returns of SEO firms
To measure the stock market performance of SEO firms around the announcement and in the
long-term following an issue, I use the same sample of issues as gathered in the previous
subsection with the exception that the requirements on the data availability are slightly
loosened and as a result, the event sample consists of 543 SEOs. The sample consists of 289
SEOs by firms listed in the main-list and 254 SEOs by firms listed in the AIM-list of the
London Stock Exchange. The required stock data for benchmarking the returns of issuers
against the value weighted FTSE All-Share market index and matching firms are retrieved
from Datastream. I assign the matching firms for event firms using the following three-step
procedure: First, I define all the UK listed firms at the beginning of a given event year that did
not conduct an SEO during the year. Second, among the chosen firms, I choose all the firms
having market capitalization between 70 % and 130 % of the event firm’s market
capitalization as the potential matches. Third, out of the potential matches, I define the firm
having the most similar market-to-book in comparison to the event firm as the matching firm.
Finally, I do not require the issuers to remain listed throughout the sample period to avoid
survival bias.
4.2 Sample characteristics
In this subsection, I present some of the most relevant properties of the data sample retrieved
as the outcome of the data collection process explained in the previous subsection. Moreover,
I plot the time series fluctuation of SEO volume and show the number and value of deals
qualified in the final sample.
7 The sample collection process of non-issuer sample is presented in Appendix 1.

33
Panel A. Quarterly number of SEOs and annual total deal value
Panel B. Quarterly number of SEOs and scaled volume (SEO%)
Figure 1: SEO volume and value in the UK 1994 – 2008 Panel A) The figure shows the quarterly distribution of UK SEOs during 1994-2008. The bars plot the number of SEOs in the quarter, while the dotted line shows the annual aggregate deal value in €, billion. The data are sourced from Dealogic database and includes all the SEOs by UK companies with total deal value exceeding €5 million. Panel B) The grey bars plot the quarterly number of SEOs and the black line shows the number of SEOs divided by the number of UK listed firms in the LSE at the end of the previous year (SEO%). The dotted line shows the average SEO% during the 1994-2008 period.
The properties of the sample employed in the analysis of the economy-wide determinants of
SEO volume is presented in Figure 1, which shows that equity issuance volume fluctuates
both annually and quarterly. The Panel A shows that both volume and value of SEOs possibly
have upward trend during the 15-year time period and suggests that equity issue market
activity has increased over time. Furthermore, to mitigate the problem of non-stationarity, I
5224 46 42 30 26
9639 32 19
61 73 72 7544
46
28
47 33 41 31
41
45 4933
5060 65
92
70
24
33
3919 25
29
55
26 2437
4150 58
59
3529
41
52
29 17 51
51
4118 65
48
75 53
63
21
0
10
20
30
40
50
60
0
50
100
150
200
250
300
350
1994 1995 1996 1997 1998 1999 2000 2001 2002 2003 2004 2005 2006 2007 2008
Tota
l dea
l val
ue (€
, bill
ion)
Num
ber o
f SEO
s
Q4Q3Q2Q1Total deal value
0
40
80
120
160
200
240
280
0 %
1 %
2 %
3 %
4 %
5 %
6 %
7 %
Q1 1994
Q3 1995
Q1 1997
Q3 1998
Q1 2000
Q3 2001
Q1 2003
Q3 2004
Q1 2006
Q3 2007
Num
ber o
f SEO
s
SEO
%
Number of SEOs SEO% Average SEO% during 1994-2008

34
follow similar procedure to Lowry (2003) and divide the volume of SEOs in a quarter by the
number of listed firms at the end of the previous year to gain market activity adjusted SEO%
figure. The Panel B shows that Q1 2000 is an outlier observation – I run regressions also
excluding it to account for the possible impact that an outlier could have in estimation of the
hypothesized relations.
Table IV
Sample characteristics: macro & micro determinants and issuer stock market performance
Panel A) The table shows the annual deal volume and value (mean) during the period under review 1994-2008 of the macro determinants sample sourced from Dealogic. The sample consists a total of 2,670 UK SEOs with deal value exceeding €5 million. Panel B) The table shows the annual deal volume, value (median) and deal size (as a percentage of the previous year end market cap) of equity issues and debt issues of the micro level determinants sample. The equity issues are sourced from Dealogic and consist of all UK SEOs with deal value exceeding €5 million during period 1999-2007. After retrieving financial data from Thomson’s Worldscope and stock data from Datastream, I exclude all the SEOs with missing key data items and come up with a final sample of 423 firm years with an equity issue. The debt issues are sourced from Thomson and consist of all UK issues during period 1999-2007, in which a firm issues more than 10 % of debt relative to total assets at the end of the previous year. After retrieving financial data from Thomson’s Worldscope and stock data from Datastream, I exclude all the debt issues with missing key data items and come up with a sample of 1,096 firm years with a debt issue. Panel C) The table shows mean and median deal values and relative deal sizes of the issuer stock market performance sample. The equity issues are sourced from Dealogic in a similar manner to the data in Panel B) with the exception that more equity issues (543) are qualified to the final sample due to looser requirements on the data availability.
Panel A: Macro-level determinants sample
Year Deal value Cont'd Year N Deal value(Mean) (Mean)
1994 59.8 2002 123 193.11995 114.0 2003 154 72.71996 55.4 2004 200 108.91997 76.4 2005 258 82.01998 111.4 2006 248 85.71999 138.4 2007 289 77.22000 151.5 2008 170 281.62001 230.2
Total 2,670 118.1151
Sample characteristics
N
151126184123113137243

35
The three separate samples collected for the purposes of the thesis are presented in the Table
IV. The number of issues in macro determinant sample (2,670) is clearly larger than in micro
determinant (423) and issuer stock market performance sample (543), since for the purposes
of macro level analysis, I do not need to collect issuer specific data. Moreover, the issuer
specific data requirements in cross-sectional samples force to exclude a number of
observations, and to truncate the period by five years due to missing identification criteria.
Panel A in Table IV shows that the year 2007 is the peak year in equity issuance with 289
SEOs in total, but the mean deal value is only € 77.2 million. Similarly in most of the years of
high deal volume, the mean deal value appears to be lower than in years of lower deal value.
Sample characteristics (continued)
Panel B: Micro-level determinants sample
Year Deal value Deal size N Deal value Deal size(Median) (Median) (Median) (Median)
1999 64.2 18 % 125 40.0 16 %2000 48.1 12 % 150 39.1 19 %2001 33.6 20 % 117 21.7 25 %2002 60.2 25 % 64 16.7 20 %2003 20.7 20 % 50 28.4 25 %2004 15.3 17 % 75 24.1 17 %2005 29.1 10 % 136 36.9 20 %2006 18.9 9 % 162 26.0 19 %2007 20.7 12 % 217 28.3 16 %
Total 24.0 13 % 1,096 30.8 19 %
Panel C: Issuer stock market performance sample
Year Mean Median Mean Median
1999 66.9 22.0 58 % 32 %2000 231.8 47.1 19 % 11 %2001 158.6 30.3 44 % 23 %2002 208.0 31.5 44 % 28 %2003 77.7 19.3 56 % 33 %2004 132.6 14.3 51 % 24 %2005 74.6 25.8 37 % 18 %2006 94.1 26.0 48 % 24 %2007 59.5 17.1 38 % 24 %
Total 107.3 22.0 43 % 24 %
3734
6474
1834
N
26
88
423
NEquity issues Debt issues
29253259
543
3748727993
117
Deal size (% of Mcap)Deal value (€ million)

36
A possible explanation is that the hot seasoned equity market enables also smaller firms to
issue equity, while larger firms are less sensitive to the equity market conditions. Panel B in
Table IV shows that the sample of equity issues and debt issues are fairly similar to each
others in deal values and relative deal sizes. Panel C in Table IV shows that mean deal value
clearly exceeds the median deal value in each of the sample years. The relationship holds also
when comparing the relative deal sizes. Moreover, mean values are lifted by a small number
of extremely large issues, while majority of the SEOs tend to be smaller in size.
Table V Descriptive statistics of macro determinants sample
The table presents the descriptive statistics of macro determinants sample. SEO%, the dependent variable, is the total number of UK SEOs in a given quarter divided by the number of listed firms at the end of the previous year. Stdev Mret[0] is the daily standard deviation of FTSE All-Share index within a quarter. Analyst dispersion[-
1] is the weighted average standard deviation of analyst recommendations on FTSE 100 index firms at the end of the preceding quarter, where the weights are number of analysts following a firm. GDP growth[-1,+2] is the UK GDP growth from 1 quarter before to 2 quarters after the given quarter. Sales growth[+1,+4] is the average sales growth of all UK listed firms from 1 quarter to 4 quarters following the given quarter. Interest rate[-4,-1] is the average LIBOR rate from 4 quarters prior to 1 quarter prior to the given quarter. SENT index[0] is the level of UK consumer sentiment in the quarter. M/B[0] is the median market-to-book of all UK listed firms. Mret[-4,-1] is the return on FTSE All-Share index from four quarters to one quarter prior to the given quarter. Mret[+1,+4] is the return on FTSE All-Share index from one quarter to four quarters following the given quarter. The sample consists of 59 quarterly observations from Q1 1994 to Q3 2008. Number of SEOs is sourced from Dealogic, financial data from Thomson’s Worldscope, data on analyst recommendations from Thomson’s I/B/E/S history and stock data and economic variables from Datastream. Skewness measures the shape of variable’s distribution and Kurtosis indicates whether larger than normal proportion of variable’s variance stems from extreme observations. Jarque-Bera addresses whether the variable is from a normal distribution based on the values of Skewness and Kurtosis.
Mean Median Max Min Stdev Skew- ness
Kurtosis Jarque-Bera
Prob. n
SEO% 0.026 0.026 0.060 0.010 0.009 0.709 4.411 9.838 0.007 59a
Information asymmetryStdev Mret[0] 0.009 0.008 0.024 0.004 0.004 1.302 4.572 22.739 0.000 59Analyst dispersion[-1] 0.769 0.803 0.954 0.523 0.100 -0.553 2.753 3.211 0.201 59
Investment opportunitiesGDP growth[-1,+2] 0.027 0.028 0.048 -0.049 0.014 -3.143 17.099 585.80 0.000 59Sales growth[+1,+4] 0.076 0.107 0.272 -0.143 0.093 -0.338 2.466 1.821 0.402 59Interest rate[-4,-1] 0.055 0.057 0.075 0.037 0.010 -0.088 2.196 1.667 0.435 59
Investor sentimentSENT index[0] -5.220 -4.230 4.700 -24.900 5.685 -1.096 4.925 20.930 0.000 59
Market timingM/B[0] 1.816 1.942 2.812 0.890 0.461 -0.184 2.236 1.768 0.413 59Mret[-4,-1] 0.101 0.152 0.401 -0.286 0.156 -0.658 2.616 4.624 0.099 59Mret[+1,+4] 0.078 0.138 0.401 -0.305 0.177 -0.634 2.342 5.018 0.081 59a The removal of the single outlier observation at Q1 2000 eliminates the problem of increased Kurtosis and guarantees that OLS requirements will be fulfilled

37
Table V above presents the descriptive statistics of the macro level determinant sample. The
proxy variables are classified into four different categories. Further, the power of each
category in explaining the SEO volume fluctuation at the macro level is tested in the thesis.
The distribution of the dependent variable, SEO%, does not seem to suffer from Skewness,
yet Kurtosis suggests the sample may not be normally distributed. As a further measure of
robustness, I investigate the time series properties of SEO% without the outlier observation at
Q1 2000 and conclude that OLS requirements are fulfilled, due to the decrease in Kurtosis
back to acceptable levels.
Table VI
Firm characteristic of micro determinants sample
The table presents the sample firm characteristics of equity issuers and debt issuers employed in the tests of micro determinants. Equity issues are sourced from Dealogic and debt issues from Thomson. The firm financials are sourced from Thomson’s Worldscope and stock data from Datastream. The sample period ranges from 1999 to 2007 and contains 423 firm years with an equity issue and 1 097 firm years with a debt issue. ANA is analyst following dummy variable that gets value of 1 if the firm is followed by one or more analysts and value of 0 if the firm is not followed by analysts. Slack is the cash and cash equivalents divided by total assets at the previous year end. LEV is a measure of firm leverage and is calculated as total interest-bearing debt divided by total assets at the previous year end. GRO is the sales growth during the issue year. INV is a measure investment calculated as capital expenditures during previous year divided by total assets at the previous year end. M / B is market cap divided by total common equity at the previous year end. Stock PRE is the 12-month raw stock return before the issue. Stock POST is the 12-month stock return following an issue. VOL is the daily volatility of the firm’s stock returns from 250 trading days before the issue to 50 trading days before the issue. ROA is earnings before interest, taxes and depreciation divided by previous year end total assets. DIV is a dividend dummy variable that gets value of 1 if firm’s dividend payout ratio is 20 % or higher and value of 0 otherwise. R&D is a research and development dummy variable that gets value of 1 if the firm reports R&D expenditures and 0 otherwise. SIZE is the natural logarithm of previous year total sales. TNG denotes to tangibility of assets and is calculated as property, plant and equipment divided by total assets at the previous year end. The last column reports t-statistics of equal means between equity issuers and debt issuers, where * and ** denote to statistical significance of difference in means at 5 % and 1 % levels respectively.
Mean Median Mean Median Difference t -stat
ANA 0.745 1.000 0.718 1.000 0.026 1.05Slack 0.134 0.064 0.100 0.054 0.034 3.98**LEV 0.222 0.199 0.220 0.182 0.002 0.16GRO 0.527 0.189 0.297 0.137 0.231 3.81**INV 0.064 0.034 0.067 0.038 -0.004 -0.72M / B 2.153 1.183 1.459 0.985 0.694 4.49**Stock PRE 0.288 0.327 0.087 0.138 0.201 5.95**Stock POST -0.201 0.019 -0.140 -0.012 -0.061 -1.43VOL 0.024 0.020 0.021 0.017 0.003 4.02**ROA 0.075 0.085 0.110 0.114 -0.035 -4.59**DIV 0.362 0.000 0.536 1.000 -0.175 -6.28**R&D 0.312 0.000 0.198 0.000 0.114 4.46**SIZE 11.538 11.278 11.665 11.502 -0.127 -1.10TNG 0.275 0.166 0.318 0.224 -0.043 -2.64**
Debt issuers (n=1,097)Equity issuers (n=423)

38
The sample characteristics of equity issuers and the control group, the debt issuers, employed
in the analysis of SEO micro determinants are presented in Table VI. The equity and debt
issuers appear to have several distinct characteristics. Moreover, equity issuers have higher
stock return volatility, more financial slack, higher market-to-book and experience higher
stock returns before the issue. On the other hand, equity issuers have lower tangibility of
assets, lower dividend payout ratio and suffer from lower return on assets. The issuer stock
market performance sample characteristics are strongly similar to equity issuers’ sample
shown in Table VI, because both samples are derived in the same manner from the same
sources. Therefore, the sample characteristics of issuer stock market performance tests are not
reported separately. The correlation coefficients between variables used in macro determinant
analyses and micro determinant analyses are shown in the Appendices 2 and 3 respectively.
Macro determinant sample and issuer stock market performance samples by industries are
shown in the Appendix 4. Finally, a list of specific data items used in the tests are shown in
the Appendix 5.
5 METHODOLOGY
5.1 Determinants of seasoned equity offerings
5.1.1 OLS regression
The macro level determinants of the SEO volume and the determinants of the abnormal
returns, both around the announcement and in the long-term, are estimated by means of cross-
sectional ordinary least squares (OLS) regression. According to Dougherty (2002, p.114-118)
OLS regression with variable Y depending on number of independent variables X2, X3, … , Xn
with an unknown true relationship can be specified in the following manner
ikikii uXXY ...221 . (1)
In a sample of n observations on variables Y, X2, X3, … , Xk the OLS regression is used to fit
the equation
kiki XbXbbY ...221 , (2)
where values for coefficients b1, b2, … , bn are fitted so that the residuals’ sum of squares are
minimized. OLS, therefore, provides estimates of the independent, explanatory variables’ X2,
X3, … , Xn impact on the dependent variable Y.

39
The use of time series data with frequent intervals exposes the test results to certain
difficulties, such as multicollinearity and autocorrelation. As autocorrelation is likely to be
present in the quarterly time series regressions used to measure the economy-wide SEO
volume, I use procedure suggested by Dougherty (2002, p. 342-344) by fitting a term with
first lag of the regressors specified as part of the error term, which eliminates the problem of
first-order autocorrelation in the regression models. As it comes to multicollinearity, time
series data always suffers from it to a certain degree.
5.1.2 Logit regression
To address the micro level determinants of the SEOs, I perform cross-sectional logit
regression analysis. I utilize the properties of logit regression in comparing firms that issue
equity and firms that issue debt to distinct between firm characteristic that lead into SEO
decision. I also report a single model with non-issuers as the control sample. Similar models
have been performed by a number of authors (see, e.g., Marsh (1982), Hovakimian et al.
(2001), Jung et al. (1996)). Hosmer and Lemeshow (2000) elaborate that logit regression is a
well specified model to study the impact of independent variables to the binary dependent
variable. Following Menard (2002) a logit regression overcomes the problems in linear
models by estimating the log of the odds of falling into category 1, in this case SEO. Logit
estimation with more than one explanatory variable hypothesizes that the probability of a
given occurrence is determined by the function
Ziii eZFp
11)( , (3)
where Zi kiki XX ...221 . (4)
In this setting, parameters 2, …, k refer to firm-specific ex ante attributes. By means of
maximum likelihood estimation, the logit model assesses the impact of firm attributes to the
likelihood of issuing seasoned equity. I use Huber-White robust covariances to alleviate the
potential problem of heteroscedasticity. To estimate the strength of the relationship between a
firm characteristic and the decision to issue equity, I use z-statistic and pseudo-R2 similarly to
t-statistics and adjusted R2 in OLS-regression.
5.2 Abnormal returns of seasoned equity issuers
I measure sample firms’ cumulative abnormal returns around the event to assess the possible
wealth effects caused by the event. Furthermore, Brown and Warner (1980) discuss the
properties of the event studies and claim that the magnitude of the abnormal return around the

40
announcement of an unanticipated event represents the impact of the event to firm
claimholders. Moreover, in this thesis I employ event study methodologies suggested by
Brown and Warner (1980) and (1985).
5.2.1 Short-term abnormal returns
I employ simple market model using OLS regression to estimate the abnormal performance of
a security given the normal return predicted by its historical relationship with a benchmark
index. Brown and Warner (1980) state that the strength of the market model lies in its ability
to take into account the market wide movements in the stock prices that occur around the
events of individual firms. The market index used to measure Rmt is the value-weighted FTSE
All-Share index.8,9 In order to estimate parameter values of i and i for each event firm, I use
an estimation period of -290 to -40 trading days before the event. To be more precise, I
employ the following market model
itmtiiit RR , (5)
where Rit is the return for particular security i during day t and Rmt is the return for the
benchmark index for the same day. i measures the sensitivity of security i to changes in the
market index, i is an average measure of return not captured by the estimated i and finally, i
is the disturbance term assumed to be independent of market return and have a zero mean. The
abnormal return ARit caused by the event is measured using the i and i estimated in equation
(5) in the following manner
)( mtiiitit RaRAR . (6)
After calculating the abnormal returns for individual firms, I combine the sample to measure
the average cumulative abnormal returns (CAR) for all the event firms. CARs are calculated
as follows
n
itttti AR
nCAR
1,],[, 2121
1 , (7)
where t1 and t2 are the beginning and the end of the event window period respectively. I
calculate and report CARs for different time windows around the event, but mainly refer to
commonly used [-1,+1] window, that is one trading day before the event to one trading day
8 FTSE All-Share is the headline stock index in the United Kingdom aggregating the stocks of FTSE100, FTSE250 and FTSE Small-Cap corporations listed in the London Stock Exchange. FTSE All-Share contains 619 constituents and with a market capitalization of £1.28 trillion accounts for over 8 % of world’s total equity market capitalization. (www.ftse.com) 9 Asset pricing models generally refer to the use of value-weighted model. See more discussion in Brown and Warner (1980) p. 35-39

41
after the event, when discussing the empirical findings. In addition to the market model
estimates, I address the robustness of the results by calculating also market adjusted returns
measured simply as the event firm return less market return.
5.2.2 Long-term abnormal returns
As pointed out by numerous authors, see for example Kothari and Warner (1996, 2007) and
Barber and Lyon (1997), short-term event studies are usually well specified, but in the long-
term, numerous biases may occur. Barber and Lyon (1997) highlight three sources of biases
present in often used event study methodologies. Namely, new listing bias, rebalancing bias
and skeweness bias may all have an impact on the results if the model for detecting long-term
event returns is not correctly specified. Moreover, according to Kothari and Warner (1996),
both sample selection process and model specification may lead into flawed results. For the
mitigation of the possible biases, Lyon et al. (1999) suggest careful sample design and using
well specified matches to benchmark for normal returns.
Barber and Lyon (1997), Lyon et al. (1999) and Kothari and Warner (1996) discuss the merits
of various approaches and state that the strength of buy-and-hold abnormal return approach
(BHAR) is in its ability to better track actual investors’ portfolio decisions, and moreover, the
use of carefully specified matching firms yields unbiased results. In a similar manner,
Jegadeesh (2000) investigates the ability of various specifications to measure abnormal long-
term returns and concludes that the matching firm technique is superior to factor-models. I
calculate BHARs using both, FTSE All-Share benchmark index and firms matched based on
size and market-to-book to measure abnormal returns for event firms. Buy-and-hold returns
for a period of T months are calculated as follows
T
tit
T
titiT ERBHAR
11
)1()1( , (8)
where Eit is the return on the benchmark firm or portfolio and Rit is the return on event firm i.
I calculate and report conventional cross-sectional t-statistics as suggested by Lyon et al.
(1999).
nARARt
t
t
)(, (9)
where tAR is the sample mean, )( tAR is the cross-sectional sample standard deviation and n
represents the number of observations in a given sample. I calculate the BHARs for various

42
time-periods, but mainly refer to 24-month and 36-month horizons in the analysis of the
findings.10
To investigate the impact of firm-specific characteristics on the issuer abnormal returns I
follow similar procedure to Andrikopoulos (2009) and Loughran and Ritter (1997) and use
non-parametric Wilcoxon Signed-Rank Test. Specifically, I measure the difference in
medians between subsamples of firms sorted by the hypothesized firm-specific ex ante
characteristics. Wilcoxon Signed-Rank assumes and tests whether the two samples are of the
same distribution. The absolute values of deviations from median are assigned a rank and the
sum of the positive values is denoted as D. Wilcoxon signed-rank test z-statistics is computed
as follows:
D
EDDz )( (10)
where 4
)1()( nnDE (11)
and 24
)12)(1(2 nnnD , (12)
while E(D) and refer to sample expected value of ranked deviations’ sum and variance of
ranked deviations respectively. Under the assumption that the subsamples are drawn from the
same distribution, z-statistics follows a normal distribution.
6 RESULTS
This chapter presents and discusses the results from empirical analyses that I perform to
address the key research questions of the thesis. The first section elaborates the findings on
economy-wide fluctuations in SEO volume and cross-sectional attributes of firms that decide
to use SEO as a means of financing. The second section concentrates on the stock market
performance of the SEO firms and the factors driving the performance.
10 Traditional long horizon event studies employ time periods from 12 to 60 months subsequent to the event. In my thesis, I limit the period to 36 months as the offering data from the United Kingdom mainly is available from the recent 10-year period and therefore, following stock performance 60 months after the event would considerably decrease the sample size.

43
6.1 Macro and micro level determinants of seasoned equity offerings
The focus of this section is the determinants of the SEOs. The first subsection concentrates on
the economy-wide determinants of SEO volume, while the second subsection addresses the
determinants of micro level determinants of choice between equity and debt. Finally, Table
IX at the end of the section pools together the hypotheses tested in the section and the
empirical evidence found on the determinants of SEOs.
6.1.1 Macro level determinants of SEOs
The results shown in the subsection contribute to the ongoing debate on the factors that cause
fluctuation in equity issue volumes. The subsection tests hypotheses H1-H4 on macro level
determinants of SEOs. Howe and Zhang (2009) investigate the drivers of the SEO cycles and
find that market timing and demand for capital seem to motivate equity issues the most. IPO
volume, according to Lowry (2003) and Pastor and Veronesi (2005), fluctuates much of the
same reasons. Moreover, they conclude that demand for capital, investor sentiment and
market variables are important determinants of the IPO cycles.
Table VII
Macro determinants of SEOs
The table shows the impact of four different categories of proxies on the macro level SEO% defined as the number of UK SEOs in a quarter divided by the number listed firms at the end of the previous year. Stdev of daily mkt return[t=0] is the daily standard deviation of FTSE All-Share index returns within a quarter. Analyst dispersion[-1] is the weighted average standard deviation of analyst recommendations on FTSE 100 index companies at the end of the preceding quarter, where the number of analysts following a firm are the weights. Sales growth[+1,+4] is the sales growth of all UK listed companies from 1 quarter to 4 quarters following the given quarter. GDP growth[-1,+2] is the UK GDP growth from 1 quarter prior to 2 quarters following the given quarter. Interest rate avg.[-4,-1] is the average LIBOR rate from four quarters prior to one quarter prior to the given quarter. SENT index[0] is the UK consumer sentiment in the quarter. Market-to-book median[0] is the market-to-book of all UK listed companies. Mkt return[-4,-1] is the return on FTSE All-Share index from four quarters to one quarter prior to given quarter. Mkt return[+1,+4] is the return on FTSE All-Share index from one quarter to four quarters following a given quarter. AR(1) specification eliminates first order autocorrelation by importing the first lag of independent variables to the model. The sample consists of 59 quarterly observations from Q1 1994 to Q3 2008. Number of SEOs is sourced from Dealogic, financial data from Thomson’s Worldscope, data on analyst recommendations from I/B/E/S history, while stock data and economic variables are retrieved from Datastream. Adjusted R-squared and F-statistics are reported as measures of model precision. T-statistics, using heteroscedasticity consistent standard errors as suggested by White, of no relationship between dependent and independent variables are reported under coefficients, where * and ** denote to statistical significance of the relationship between variables at 5 % and 1 % levels respectively.

44
With a sample of 59 quarterly observations including 2,670 UK SEOs, I find strong evidence
supporting market timing and demand for capital hypotheses. Table VII presents the results
from various time-series regression models. In the UK market, the most significant drivers of
macro fluctuation in SEOs are sales growth, interest rates and stock market returns prior to
and following an issue.
i) Demand for capital
When aggregate future sales growth in the UK is high, firms’ demand for capital is at its
highest, and a fraction of the demand is satisfied by means of seasoned equity offerings.
(1) (2) (3) (4) (5) (6)Information asymmetry
Capital demand
Market timing
Investor sentiment All proxiesa All proxiesb
Intercept 0.04 0.04 0.03 0.03 0.06 0.0514.10** 5.25** 2.61* 10.68** 4.14** 4.10**
Information asymmetry proxies Stdev of daily mkt return[0] -0.95 -0.78 -0.86
-6.21** -2.62* -2.79** Analyst dispersion[-1] -0.01 -0.01 0.00
0.56 -0.95 -0.24
Capital demand proxies Sales growth[+1,+4] 0.05 0.05 0.04
3.16** 3.83** 3.94** GDP growth [-1,+2] -0.09 -0.07 -0.12
-0.67 -0.99 -1.71 Interest rate avg.[-4,-1] -0.31 -0.40 -0.33
-2.44* -4.51** -4.40**
Market timing proxies Market to Book median[0] 0.00 0.00 0.00
-0.20 -0.92 -0.22 Mkt return[-4,-1] 0.03 0.03 0.02
2.34* 2.73** 2.89** Mkt return[+1,+4] -0.01 -0.02 -0.02
-1.50 -3.81** -3.33**
Investor sentiment proxies SENT index[0] 0.00 0.00 0.00
1.18 -3.13** -2.16*
AR (1) specification 0.40 0.34 0.33 0.46 -0.04 0.112.97** 2.23* 2.61* 3.66** -0.34 0.98
Adjusted R-squared 0.28 0.27 0.31 0.19 0.50 0.57F-statistic 8.47 6.27 7.42 7.81 6.76 8.52P-value, F-statistic <0.01** <0.01** <0.01** <0.01** <0.01** <0.01**Number of observations 58 58 58 58 58 57a M odel using all quarterly observations, b model excluding single outlier observation at Q1 2000
OLS-regression Dependent varaible: SEO%

45
Interestingly, Lowry (2003) finds that sales growth of public firms is related to the number of
IPOs, yet the findings presented in Table VII indicate that the mechanism for SEOs is
somewhat stronger. Namely the t-statistics of sales growth at 3.94 persists after inclusion of
various control variables and is clearly statistically significant at all conventional levels. The
strength of the demand for capital hypothesis is further supported by the negative and
statistically significant sign of interest rates with a t-statistics of 4.40. Using a large sample of
US SEOs, Howe and Zhang (2009) report similar findings on interest rate, but their findings
on the role of future sales growth contradicts with mine. In their models, GDP growth is a
significant determinant of SEOs. A possible interpretation of the difference is that GDP
growth and sales growth actually measure the changes in same underlying fundamentals, but
only at slightly different perspectives.
ii) Market timing
Market timing variables are significant macro determinants of SEOs. Namely, high volume
periods occur after 12-month stock market run-ups and are followed by periods of low returns
even after controlling for market-to-book. The coefficients of both variables, pre and post-
issue 12-month stock market returns, are statistically significant at the 1 % level. Pastor and
Veronesi (2005) develop a model of optimal IPO timing and report similar findings on stock
market mechanics around the IPO volume fluctuations.
iii) Information asymmetry
After controlling for multiple classes of hypotheses, the impact of information asymmetry
proxies deteriorate. Yet, stock market volatility still seems to be an important determinant
with more companies filing an SEO when market volatility is at a low level. Moreover, the t-
stat of market volatility is -2.62 after controlling for various factors. Howe and Zhang (2009)
find market volatility to affect in a similar way, but being only marginally statistically
significant. The analyst dispersion as an information asymmetry proxy enters the regression
models with a weak negative sign, but does not seem to be an important determinant of macro
level SEO volume.
iv) Investor sentiment
Finally, the hypothesized link between investor sentiment and macro SEO volume is weak at
most, or alternatively, the consumer sentiment index does not indicate such relationship to
exist. The hypothesized positive linkage is not supported by the regression estimates, while

46
Howe and Zhang (2009) report similar weak association between consumer sentiment index
and SEO volume.
Panel A. The joint effect of daily market volatility and sales growth on median SEO%.
Panel B. The joint effect of pre and post-issue market returns on median SEO%.
Figure 2: Macro determinants of SEOs The figure presents the impact of selected macro level variables on SEO%. SEO% is the number of SEOs in the UK within a quarter divided by the number public companies at the end of the previous year. Panel A) shows the joint effect of sales growth and daily market volatility on SEO% while Panel B) shows the joint effect of preceding and subsequent market stock returns on SEO%. Daily market volatility is the daily standard deviation of FTSE All-Share index returns within a quarter. Sales growth is the sales growth of all UK listed companies from 1 quarter to 4 quarters following the given quarter. Mkt return[-4,-1] is the return on FTSE All-Share index from four quarters to one quarter prior to the given quarter. Mkt return[+1,+4] is the return on FTSE All-Share index from one quarter to four quarters following a given quarter. The sample consists of 59 quarterly observations from Q1 1994 to Q3 2008. Number of SEOs is sourced from Dealogic, financial data from Thomson’s Worldscope while stock data and economic variables are retrieved from Datastream.
LOW
MID
HIGH
1,0%
1,5%
2,0%
2,5%
3,0%
3,5%
LOW
MID
HIGH
Sales growth
SEO
%
Daily market volatility
3,0%-3,5%
2,5%-3,0%
2,0%-2,5%
1,5%-2,0%
1,0%-1,5%
HIGH
MID
LOW
1,0%
1,5%
2,0%
2,5%
3,0%
3,5%
HIGH
MID
LOW
Mkt return [+1,+4]
SEO
%
Mkt return [-4,-1]
3,0%-3,5%
2,5%-3,0%
2,0%-2,5%
1,5%-2,0%
1,0%-1,5%

47
Figure 2 graphically illustrates the joint effect of market volatility and sales growth, as well as
the impact of stock market returns prior to and following a quarter on the UK SEO volume.
Furthermore, as shown in Panel A, a decrease in market volatility leads into a notable increase
in number of SEOs. Similarly, higher sales growth is accompanied by an increase in the
number of SEOs. The joint explanatory power of the two variables seems strong. On the other
hand, the impact of market timing variables seems two-fold. While the higher level of stock
returns before the quarter clearly leads into an ascended SEO volume, the stock returns
following an issue has a less clear relationship with the SEO volume. Panel B in Figure 2
indicates that high volume SEO quarters occur following a stock market run-up, but low
future stock returns lead into an increased number of issues, only when the stock market
returns have been poor ex ante. Lowry (2003) discusses several potential reasons for the
observed patterns of stock market performance around the changes in equity issue volume.
First, investors realize that firms’ demand for capital is increasing and market returns increase
in response to the investment opportunities. Second, market returns can be lifted by the
increase in investor optimism. Third, market returns may reflect changes in the stock market
premium.
To conclude the analysis on macro determinants, it seems that the most consistent
determinants of SEOs at the macro level are demand for capital (sales growth) and market
timing (past stock market returns). The evidence to support the two additional hypotheses on
investor sentiment and information asymmetry seems fragile. The presented findings on
market timing and demand for capital provide an interesting platform to study the micro level
determinants of seasoned equity offerings, which will be the topic of interest in the
subsequent subsection.
6.1.2 Micro level determinants of SEOs
This subsection extends the macro level analysis of SEOs to a single-firm decision making
analysis. I aim to distinct between firm characteristics that explain why some firms choose an
SEO while others issue debt and thus, test hypotheses H5-H7 on micro level determinants of
SEOs. Jung et al. (1996) and Marsh (1982) perform similar analysis on the debt-equity
choice, while Hovakimian et al. (2001) analyze changes in capital structure using similar
models. When deciding on the set of independent variables to the regression models, I partly
follow prior literature, add new variables when necessary to test the posed hypotheses and
avoid pairs of variables with high correlation to maintain robustness of results. A great

48
majority of the literature on company financial policy employ a fixed set of control variables
in regressions: company size, capital structure, profitability, research and development
intensiveness, tangibility of assets and the level of financial slack. I see no reason to deviate
from the norm, even when the coefficients indicate that the variable does not belong to the
model. Finally, as the UK evidence on determinants of equity issuance is largely lacking, I
analyze my results in light of the existing US literature
Table VIII Micro determinants of SEOs
The table shows determinants of cross-sectional SEO vs. debt issue choice. In models (1) – (4), the likelihood of company specific factors on SEO vs. debt issue choice is estimated by logit regression where SEOs get value of 1 and debt issues value of 0. Equity issues are sourced from Dealogic and debt issues from Thomson. The company financials are sourced from Thomson’s Worldscope, data on analyst following from I/B/E/S history and stock data from Datastream. The sample period ranges from 1999 to 2007 and contains 423 firm years with an equity issue and 1 097 firm years with a debt issue. In model (5), the likelihood of the firm-specific factors on SEO vs. non-SEO choice is estimated, where SEOs get value of 1 and non-SEOs get value of 0. The sample includes the similar 423 firm years with an SEO and 9 130 firm years with no SEO. Analyst coverage dummy variable gets value of 1 if the firm is followed by one or more analysts, and value of 0 otherwise. Stdev of firms’ daily stock return is measured from 250 trading days before the issue to 50 trading days before the issue. PRE and POST stock returns are calculated as the firm’s raw returns for the 12-month period prior to and following an issue. Dividend is a dummy variable that gets value of 1 if firm’s dividend payout ratio is 20 % or higher and value of 0 otherwise. R&D is a research and development dummy variable that gets value of 1 if the firm reports R&D expenditures and 0 otherwise. Financial slack (cash and cash equivalents / total assets), Debt / Total assets, Capex / Total assets, EBITDA / Total assets, Market-to-Book, LNsales and PPE / Total assets are measured at the previous year end. Sales growth is measured in the issue year. Z-statistics, with heteroscedasticity consistent robust standard errors as suggested by Huber and White, of no impact on equity vs. debt choice likelihood are reported, where * and ** denote to statistical significance of the relationship at 5 % and 1 % levels respectively. Pseudo-R2 and LR statistic are reported as measures of model explanatory power.

49
The results from the logit regression performed to analyze micro level determinants of SEOs
are presented in Table VIII. As shown, the multivariate analysis reveals that several distinct
characteristics between equity and debt issuers exist.
(1) (2) (3) (4) (5)Information asymmetry
Capital demand
Market timing
All proxiesAll
proxiesa
Information asymmetry proxies Analyst coverage 0.539 0.539 0.831
3.26** 2.62** 5.49**
Debt / Total assets 0.797 1.388 4.4512.30* 3.59** 10.08**
Capital demand proxies Sales growth 0.002 0.002 1.297
2.63** 2.51* 8.32**
R&D 0.563 0.629 0.6323.79** 3.97** 3.72**
Capex / Total assets 1.034 0.374 -0.0871.04 0.34 -0.18
Market timing proxies Market-to-book 0.110 0.105 -0.008
1.96* 1.70 -0.75
PRE 12m stock return 0.696 0.684 0.8483.92** 3.68** 4.51**
POST 12m stock return -0.192 -0.206 -0.478-1.81 -1.81 -2.98**
Control variables
Stdev of daily return 11.060 7.414 15.065 14.997 57.2052.41* 1.50 2.70** 2.42* 9.45**
EBITDA / Total assets -0.985 -0.974 -2.105 -1.817 -1.754-1.82 -1.75 -3.13** -2.61** -2.10*
Dividend -0.464 -0.342 -0.309 -0.218 -0.675-3.30** -2.33* -2.08* -1.41 -5.20**
Financial slack 1.491 1.088 0.668 1.091 -0.2393.18** 2.29* 1.24 1.86 -0.40
LNsales -0.006 0.018 0.083 -0.029 -0.378-0.15 0.52 2.61** -0.70 -9.31**
PPE / Total assets -0.466 -0.304 -0.136 -0.287 0.004-2.06* -1.06 -0.59 -0.92 1.19
Year dummies Yes Yes Yes Yes YesPseudo-R 2 0.07 0.08 0.09 0.13 0.24LR statistic 117.38 125.63 156.03 195.25 723.74Prob. LR statistic ( 2) <0.01** <0.01** <0.01** <0.01** <0.01**Number of observations 1,464 1,371 1,402 1,321 9,328a Regression model (5) employs a sample of non-SEO firm years as the control sample
Logit regression
SEO = 1, Debt issue = 0 a

50
i) Information asymmetry
I observe and report analyst coverage and leverage to be positively associated with the
likelihood of equity issue. After controlling for other hypotheses, both proxies on information
asymmetry maintain statistical significance at the 1 % level. Jung et al. (1996) report high
leverage to affect in a similar manner – they argue that it possibly reflects the impact of
deviation from the firm’s target leverage. Similarly, several authors are of the opinion that
high leverage is a characteristic of low growth opportunity and low information asymmetry
firms and therefore, it should be positively related to the likelihood of SEO issuance. (Dittmar
and Thakor (2007), Rajan and Zingales (1995).
ii) Demand for capital
In model (2) of Table VIII the capital demand proxies enter the regression with positive sign,
yet only sales growth and research and development expenditures show statistical
significance. Theoretically according Myers (1977) framework, high investment opportunity
firms should be of low leverage as equityholders get all the benefit from the upside potential,
while debtholders bear the increased costs of financial distress. All in all, my findings indicate
that proxies of capital demand are among the main characteristics to lead into an increased
probability of an equity issue.
iii) Market timing
Market timing proxies, as numerous authors report, are clear distinct factor between equity
and debt issuers. Jung et al. (1996) report that both market-to-book and past stock returns are
significantly related to the likelihood of an equity issue. Moreover, they argue that the strong
association between past stock returns and equity issue likelihood stems from the managers’
activity to time the market. The authors in addition state that the presence of market-to-book
is highly significant in the regression given that the omission of the variable leads pseudo-R2
to fall by almost one-third. My findings on market timing proxies coincide with theirs’ given
that the impact of market-to-book in models (3) and (4) is far lower than stated by Jung et al.
(1996).
I also run logit regressions with the same sample of 432 firm years with equity issue using a
sample of 9,130 firm years with non-issuers as the control sample.11 As can be hypothesized,
the demand for capital proxies and market timing proxies show more statistical significance
11 The sample collection process of the control sample of no SEO firm years is presented in the Appendix 1.

51
than in the reported models with debt issuers as the control sample. Earlier literature shows
that debt issuers are also likely to undergo a period of high stock return preceding an issue
(see, e.g., Marsh (1982), Jung et al. (1996)), but as the control sample becomes non-issuers,
the strengthening sign of pre-issue stock returns is expected. Moreover, in the reported
models (1) - (4) it is given that firm increases the level of external capital for one way or
another, whereas in the model (5) with non-issuers as the control sample, large fraction of the
firms choose to do nothing. In these circumstances, the strength of demand for capital proxies
is natural, as growth firms with solid investment opportunities are more likely to raise
external capital. The sales growth variable is highly significant at all conventional levels and
the strong positive sign of R&D variable persist after changing the control group. In addition,
the positive linkage of both analyst following and leverage further strengthens in model (5),
which implies that firms who seek equity financing can communicate their intentions to the
market through the independent analysts and are high leverage firms with low information
asymmetry by nature. The strong negative sign of logarithm sales and positive sign of
volatility indicates that the use of non-issuers as the control sample leads into poor match
between the two samples. The coefficient of determination in model (5), pseudo-R2, is clearly
higher than in models (1) – (4) with debt issuers as the control sample. Therefore, many
distinct firm characteristics exist between SEO firms and non-issuers. However, I choose to
only report a single regression with non-issuers as the control group since the earlier literature
mainly refers to equity vs. debt choice (see, e.g., Marsh (1982), Hovakimian et al. (2001)).
Finally, similarly to the macro level analysis, market timing hypothesis appears to be a strong
determinant of SEO issuance. In addition, I find strong evidence that low information
asymmetry firms with analyst coverage and high leverage are likely to conduct an SEO. The
impact of both market timing and information asymmetry proxies persists in different model
specifications. The association between demand for capital and SEO likelihood seems slightly
weaker, yet statistical significance of sales growth and R&D expenditures suggest that
demand for capital is a micro level determinant of equity issues.

52
Table IX Summary of findings on SEO determinants
The table pools together the hypotheses on macro and micro level determinants of SEOs, the proxy variables employed in the tests and the empirical findings on the hypotheses. The “+” (positive linkage) and “ –“ (negative linkage) signs after the hypotheses address the theoretical prediction of the relationship between each class of hypotheses and the SEO volume or decision. The column on the right indicates whether the hypothesis ought to be accepted based on the empirical findings.
Table IX summarizes the findings on the macro and micro determinants of SEOs presented in
the preceding subsections. Market timing theory of equity issuance documented in several
academic papers appears to drive the SEOs both at the macro and micro level. Moreover, past
market returns drive changes in aggregate SEO volume, while firms’ past stock returns
increase the likelihood of choosing to raise seasoned equity instead of debt. In addition, macro
level demand for capital proxies, aggregate future sales growth and average interest rates,
imply strong positive linkage to SEO volume. In addition, I find some evidence to support the
capital demand hypothesis as the micro level determinant of SEOs. Namely, firms to issue
equity have analyst coverage and more levered capital structures as opposed to the debt
issuers, while also they are more likely to heavily investing growth firms. After the analyses
on both macro and micro level determinants the following sections present the findings on
equity issuers’ stock market performance.
6.2 Issuer stock market performance
This section presents the findings on SEO firms’ stock market performance around the issue.
The first subsection presents and discusses the findings on announcement returns and the
factors determining the observed returns, while the second subsection concentrates on the
Macro level: the impact of economy-wide variables on SEO volume
Hypotheses & prediction Proxies Accepted/Rejected
H1: Market timing (+)H2: Asymmetric information (-)H3: Demand for capital (+)H4: Investor sentiment (+)
Micro level: the impact of issuer characteristic on choice between equity and debt financing
H5: Market timing (+) Market-to-book, stock return (pre and post)H6: Asymmetric information (-) Analyst coverage, leverageH7: Demand for capital (+) Sales growth, capex growth, R&D expenditures
Summary of findings: macro and micro level determinants of SEOs
Market-to-book, market return (pre and post)Analyst dispersion, market volatilityAggregate sales growth, GDP growth, Interest rateConsumer sentiment index
AcceptedAcceptedAccepted
AcceptedWeak support
AcceptedRejected

53
issuer long-term underperformance following the issue using a set of pre-issue firm
characteristics in explaining the stock market performance. Finally, Table XVII at the end of
the chapter summarizes the findings on the hypothesized relations between issuer
characteristics and stock market performance.
Figure 3: Buy-and-hold abnormal returns of SEO firms: total observation period The figure presents buy-and-hold abnormal returns (BHAR) from 12 months prior to an issue to 36 months following the issue for total sample of 543 SEOs during period 1999-2007. All UK SEOs with deal value in excess of €5 million are sourced from Dealogic. The financial data for event firms and matching firms are sourced from Thomson’s Worldscope, while the stock data are sourced from Datastream. The dim line measures BHARs calculated using FTSE All-Share stock index as the benchmark, while the dark line measures BHARs calculated using size and market-to-book matched firms as the benchmark. The BHARs represent equally weighted sample averages.
In general, my findings on the stock return mechanisms around the SEOs are parallel to the
predominant understanding in the area of issuer stock market performance. Figure 3 presents
the 48-month buy-and-hold abnormal returns with the observation period starting from 12
months before the issue. Moreover, despite the chosen benchmark for normal returns, I find
the issuers to experience statistically significant and economically notable positive abnormal
-10 %
0 %
10 %
20 %
30 %
40 %
50 %
-12 -10 -8 -6 -4 -2 0 2 4 6 8 10 12 14 16 18 20 22 24 26 28 30 32 34 36
BH
AR
Months around the SEO
Model: BHAR FTSEModel: BHAR Match

54
returns during the 12 months preceding the issue. The market adjusted 12-month equally
weighted average stock returns prior to the issue announcement amount to 34.2 %, while the
issuers outperform their non-issuing matching firms by 28.0 %. In addition, the issuers begin
to underperform relative to the benchmarks within six months following the issue and
continue to be poor long-term investments throughout the 36-month post-issue period. From
the Figure 3 it can be seen that the use of FTSE All-Share as the benchmark (dim line) leads
into clearly higher pre-issue abnormal returns than size and market-to-book matched firms
(black line). On the other hand, the post-issue period dynamics between the two different
benchmarks are also somewhat different as will be shown in the following subsections.
6.2.1 Announcement effect
In this subsection, I focus on the announcement effect of SEOs. I pay attention to the analysis
of the factors contributing to the abnormal returns. Earlier literature on topic has been mainly
conducted employing US data (see, e.g., Masulis and Korwar (1986), Asquith and Mullins
(1986)) and the announcement effect is typically calculated during two or three-day event
window. Predominant practice in the short-term event studies is to calculate abnormal returns
using market model estimates for and . I follow earlier literature and also report market
adjusted returns.
Table X SEO announcement effect: total sample
The table presents the announcement effect of seasoned equity offerings at the total sample level. The results are estimated and reported using both market model and market adjusted returns and presented separately for [-1,+1] and [-5,+5] event windows. The sample of equity issues is sourced from Dealogic, while the stock data is sourced from Datastream. The sample period ranges from 1999 to 2007 and contains 543 SEOs in total. 1 % with largest and smallest announcement CARs are sorted out from the sample. Equally weighted sample averages, t-statistics and proportion of positive CARs are reported.
Table X shows that at the total sample level, the equally weighted average announcement
effect of UK SEO firms is slightly positive, employing various event windows and both
Event windowAverage t-stat % positive Average t-stat % positive
Market model 0.08 % 0.22 50.70 % 0.22 % 0.43 49.30 %
Market adjusted 0.14 % 0.32 51.39 % 0.02 % 0.04 50.28 %
[-1,+1] [-5,+5]
Announcement CARsTotal sample of SEOs (n=543)

55
market model and market adjusted abnormal returns. The announcement effect is far from
being statistically significantly different from zero, which is not surprising in the light of the
previous literature on the UK SEOs. The study with most similar data sample to the one
employed in the thesis, Barnes and Walker (2006), report total sample weighted average
announcement effect of -0.33 %. Similarly, Slovin et al. (2000) report announcement effect
strongly dependent on the floatation method, with the total sample weighted average of -1.44
%. Their results are parallel to mine given that in their studies, the proportion of rights issues
is clearly larger than in my sample, while the negative announcement effect in the previous
studies is driven by rights issues. While considerably large differences in announcement
effect exist in the cross-section, the abnormal returns are evenly distributed around zero in all
cases as close to 50 % of the SEOs undergo positive announcement returns. All in all, my
findings support the notion that SEOs in Europe differ somewhat from the US SEOs. A
possible explanation for the observed differences in the announcement effect is the high
institutional ownership among the UK pension funds and insurance companies that tend to
operate as passive long-term investors as opposed to the US mutual funds and investment
firms.
Table XI
SEO announcement effect: CARs and issuer characteristics
The table shows the impact of issuer/issue specific factors on the announcement effect of SEOs. Firms are sorted into quintiles based on market-to-book (Panel A), 12-month pre-issue stock returns (Panel B), sales growth during the issue year (Panel C) and SEO%, the number of UK SEOs within the issue quarter divided by the number of UK listed companies at the previous year end (Panel D). 1 % of observations with largest and smallest CARs are removed from the sample. The t-test of equal means and Wilcoxon signed-rank test of equal medians between HIGH quintile and LOW quintile address the impact of the given factor to the announcement effect. The sample of equity issues is sourced from Dealogic, while the company financials are sourced from Thomson’s Worldscope and stock data from Datastream. The sample period ranges from 1999 to 2007 and contains 543 SEOs in total. The results are reported separately for market model and market adjusted CARs during [-1,+1] event window. T-statistics and z-statistics for no difference between HIGH and LOW quintiles are reported next to coefficients, where * and ** denote to statistical significance of the difference at 5 % and 1 % levels respectively.

56
Panel A: Market to Book
LOW HIGHModel (1) (2) (3) (4) (5)
Average -1.1 % -0.5 % 0.7 % -0.5 % 1.1 % Difference 2.2 %t-stat -1.10 -0.78 0.73 -0.44 0.94 t-stat 1.43
Wilcoxon z-stat 1.63
Average -1.0 % -0.2 % 0.6 % 0.3 % 0.9 % Difference 1.9 %t-stat -1.09 -0.39 0.65 0.31 0.85 t-stat 1.35
Wilcoxon z-stat 1.76
Panel B: 12-month pre-issue stock return
LOW HIGHModel (1) (2) (3) (4) (5)
Average -3.7 % 1.7 % -0.6 % 0.5 % 1.8 % Difference 5.5 %t-stat -3.04** 2.31* -0.99 0.72 2.20* t-stat 3.75**
Wilcoxon z-stat 3.11**
Average -3.4 % 1.7 % -0.5 % 0.9 % 2.9 % Difference 6.2 %t-stat -2.95** 2.68** -0.86 1.44 3.44** t-stat 4.41**
Wilcoxon z-stat 3.07**
Panel C: Sales growth
LOW HIGHModel (1) (2) (3) (4) (5)
Average -1.0 % -1.0 % 0.6 % 1.0 % 2.2 % Difference 3.2 %t-stat -0.66 -0.87 0.55 0.96 2.42* t-stat 1.85
Wilcoxon z-stat 2.96**
Average -1.0 % -1.5 % 0.2 % 1.5 % 2.7 % Difference 3.6 %t-stat -0.68 -1.31 0.18 1.71 2.85** t-stat 2.14*
Wilcoxon z-stat 2.76**
Panel D: SEO%
LOW HIGHModel (1) (2) (3) (4) (5)
Average -0.6 % -0.8 % -0.4 % -0.6 % 2.2 % Difference 2.8 %t-stat -0.58 -0.75 -0.35 -0.71 2.25* t-stat 1.93
Wilcoxon z-stat 1.43
Average -1.2 % -0.6 % 0.4 % -0.1 % 2.1 % Difference 3.3 %t-stat -1.13 -0.61 0.52 -0.06 2.41* t-stat 2.42*
Wilcoxon z-stat 1.86
HIGH - LOW difference(5) - (1)
HIGH - LOW difference
Market model
Market model
Market adjusted
Market model
Market adjusted
Performance of event firm quintiles SEO announcement effect CAR [-1,+1]
Market adjusted
HIGH - LOW difference(5) - (1)
Market model
HIGH - LOW difference
Market adjusted
(5) - (1)
(5) - (1)

57
Univariate analysis on announcement effect determinants
Table XI presents the relationship between the announcement effect and the firm-specific
characteristics. Firms are sorted into quintiles based on the hypothesized characteristics of
impact, which relate to the hypotheses H8-H10.
i) Market timing
Testing the impact of market timing on stock market announcement effect, I employ both
market-to-book and past stock returns as the market timing proxies. I find past 12-month raw
stock return to be significantly positively related to the announcement effect – the results
persist regardless of the model specification and both calculating from averages and medians.
However, I find that market-to-book only slightly indicates positive linkage to the
announcement effect. My findings are partly parallel to the findings in earlier literature. Jung
et al. (1996) report market-to-book to be positively related to the announcement effect and
past stock returns to have positive but insignificant effect. Choe et al. (1993), on the other
hand, show that stock market run-up is positively related to the announcement effect of SEOs,
but they do not control for the market-to-book. Interestingly, the findings of Bayless and
Chaplinsky (1996) contradicts with other prominent research as they find past stock returns to
positively contribute to the SEO announcement effect only during cold periods of equity
issuance, while the impact during hot periods is negative. In addition, the sign of q-ratio
measured as the market value of assets divided by the book value of assets remains positive in
all circumstances, but is significant only in cold periods. The authors hypothesize that the
documented relationships may stem from investors’ tendency to place more weight on
measures of firm quality during cold markets when information asymmetry could be more
hazardous at worst. All in all, the impact of past stock returns seem to be a determinant of the
UK SEO announcement effect, while the earlier literature from the US reports lower linkage
between market timing and announcement returns (see, e.g., Choe et al. (1993), Bayless and
Chaplinsky (1996)).
ii) Demand for capital
Myers and Majluf’s (1984) pecking order theory implies that firms with profitable investment
opportunities can operate free of information asymmetry problem, due to the well motivated
demand for capital. The vast literature on topic is of two distinct opinions: while some papers
report positive correlation between growth opportunities and announcement return, the others
show high growth firms experiencing more negative returns due to severe information

58
asymmetry. I investigate the impact of capital demand on the SEO announcement effect using
sales growth- % at the issue year as the demand for capital proxy. Panel C in Table XI shows
that the impact of sales growth on the announcement effect is positive. Wilcoxon z-statistics
for difference in medians show statistical significance at 1 % level. Denis (1994) investigates
the impact of investment opportunities on SEO announcement effect and report similar
findings. Moreover, he finds that various proxies of growth opportunities have positive
relationship with equity offering announcement return. A careful analysis suggests that his
results are driven by a group of extremely fast growing firms and that the findings do not
apply at the total sample level. On the other hand, Burton et al. (2000) investigate a sample of
116 UK SEO announcements taking place during the period 1989-1991. They use accounting
information to proxy for growth opportunities and report that while income growth is the only
variable with a positive impact on the announcement effect, the relationship is not monotonic,
and instead driven by a group of highly unprofitable firms. In response to the findings of
Denis (1994) and Burton et al. (2000), I sort out young firms and firms in extreme fast growth
phase and despite get similar results than reported in Table XI. Furthermore, the finding
indicates that the demand for capital hypothesis seems to contribute to the announcement
effect, but the results have to be analyzed further. The implication of the observed finding
could be that high capital demand firms can invest the cash raised by an SEO more profitably
than firms with low demand for capital. Finally, Walker and Yost (2008) conclude that market
interprets SEO announcement positively, if the firm has solid investment opportunities.
iii) SEO volume
Panel D in Table XI reports the relationship between macro level SEO volume and the
announcement effect. I find the highest market volume quintile to undergo significantly
positive announcement return, while the remaining four quintiles do not show remarkable
differences from each others. The findings are consistent with the information asymmetry
hypothesis, namely during extremely active periods of equity issuance investors know the
lemons problem is at its smallest. Bayless and Chaplinsky (1996) report similar findings as
they find hot period SEOs to have significantly higher announcement returns than cold period
SEOs. Bayless and Chaplinsky (1996) and Choe et al. (1993) explain the phenomenon to stem
from investors’ estimates on probability of overvaluation, which fluctuate along with stock
market variables and macroeconomic conditions.

59
Table XII
SEO announcement effect: regression analysis of CARs
The table shows OLS regression estimates for determinants of cumulative abnormal returns around the announcement of SEOs. The regressions are estimated for event windows of [-1,+1] and [-5,+5] days using both market model and market adjusted returns in estimation of CARs. The sample of equity issues is sourced from Dealogic, while the company financials are sourced from Thomson’s Worldscope and stock data from Datastream. The sample period ranges from 1999 to 2007 and contains 543 SEOs in total. 1 % of observations both with highest and lowest CARs and past stock returns are removed from the sample. Financial slack (cash and cash equivalents / total assets), Debt / Total assets, Capex / Total assets, EBITDA / Total assets, Market-to-Book, LNsales and PPE / Total assets are measured at the previous year end. Sales growth is measured in the issue year. Dividend is a dummy variable that gets value of 1 if firm’s dividend payout ratio is 20 % or higher and value of 0 otherwise. R&D is a research and development dummy variable that gets value of 1 if the firm reports R&D expenditures and 0 otherwise. Past 12m stock return is the firm’s 12-month raw stock return prior to the issue announcement. SENT is the level of UK consumer sentiment index in the issue month. Issue size is the total deal value divided by the previous year end market cap. SEO% is the number of SEOs in the UK within the event quarter divided by the number public companies at the end of the previous year. T-statistics, with heteroscedasticity consistent standard errors as suggested by White, for no relationship between dependent and independent variables are reported next to coefficients, where * and ** denote to statistical significance of the relationship at 5 % and 1 % levels respectively. F-statistics and R-squared are reported as measures of model explanatory power.
Independent variables Estimate t-stat Estimate t-stat Estimate t-stat Estimate t-stat
Market-to-Book 0.001 0.78 -0.001 -0.63 0.001 0.63 -0.001 -0.52Past 12m stock return 0.017 2.93** 0.019 2.04* 0.021 3.48** 0.022 2.68**
Sales growth 0.012 0.91 0.016 0.68 0.011 0.80 0.007 0.38
SEO% 0.750 1.02 0.327 0.30 0.944 1.20 0.391 0.37
Dividend 0.016 1.50 0.025 1.64 0.019 1.73 0.031 2.17*
SENT 0.002 0.64 0.003 0.72 0.002 0.77 -0.001 -0.38
Issue size 0.009 0.87 0.017 1.16 0.011 1.27 0.002 0.22
LNsales -0.001 -0.26 -0.001 -0.13 -0.002 -0.79 -0.003 -0.86Debt / Total assets 0.034 1.55 0.019 0.56 0.038 1.72 0.014 0.46
PPE / Total assets -0.012 -0.87 -0.048 -2.12* -0.012 -0.84 -0.037 -1.97*
EBITDA / Total assets -0.006 -0.41 -0.030 -1.04 0.007 0.43 0.010 0.62Financial slack 0.019 0.67 -0.001 -0.01 0.019 0.62 -0.007 -0.16
R&D 0.010 0.94 -0.005 -0.40 0.014 1.35 0.006 0.46
Intercept -0.034 -0.78 -0.003 -0.06 -0.022 -0.45 0.019 0.32
Year dummies Yes Yes Yes YesF-statistic 1.732 1.629 2.527 1.778P-value, F-statistic 0.02* 0.04* <0.01** 0.02*R-squared 0.090 0.085 0.126 0.092Number of observations 519 519 519 519
Cross-sectional OLS regression
Market model Market adjusted
[-1,+1] [-5,+5] [-1,+1] [-5,+5]
Dependent variable: SEO announcement CAR [-1,+1] and [-5,+5]

60
Multivariate analysis on announcement effect determinants
I also perform cross-sectional regression analysis to investigate the robustness of the impact
of the hypothesized variables on the SEO announcement effect. I control for various firm-
specific characteristics that the literature on SEOs suggests to have an influence on the
abnormal returns. If the results presented in Table XI are not monotonic, but instead driven by
subsamples of firms with extreme performance, one would expect regression analysis to
embody the fragility of the relationship. Table XII presents the results from the regression
models.
Convincingly, I find past 12-month stock return to have significantly positive sign after the
inclusion of various control variables in all regression models. The lack of statistical
significance of market-to-book is not surprising: in earlier research (see, e.g., Dierkens
(1991), Denis (1994)) the linkage has been positive, but statistically insignificant. The impact
of sales growth seems two-fold: the statistical significance based on the subsample analysis
contradicts with the insignificant positive sign in all the regression models. The results on
sales growth therefore should be interpreted as a further evidence of non-monotonic linkage
between demand for capital and SEO announcement effect reported earlier by Denis (1994) in
the US and Burton et al. (2003) in the UK. The SEO% (SEO volume) has expected positive
sign, but controlling for firm-specific factors makes it statistically insignificant, which is not
surprising as the analysis in Table XII reveals that only the highest volume subsample
undergoes significantly positive returns, while the others are leveled-off. Furthermore,
Appendix A reveals that at least at the macro level, SEO% is strongly positively correlated
with sales growth, past stock returns and market-to-book, all of which can lower the sign of
the regression estimate for SEO%. Finally, the control variables are mainly statistically
insignificant, yet some of them suggest interesting relations between firm characteristics and
announcement effect to exist. Moreover, investors react more optimistically to SEO
announcement by dividend paying stocks than non-dividend paying stocks, and the sign of
leverage remains also modestly positive. Quynh-Nhu (2009), reports similar findings with a
small sample of Finnish seasoned equity offerings.

61
-6 %
-4 %
-2 %
0 %
2 %
4 %
6 %
-5 -4 -3 -2 -1 0 1 2 3 4 5
-6 %
-4 %
-2 %
0 %
2 %
4 %
6 %
-5 -4 -3 -2 -1 0 1 2 3 4 5
-3 %
-2 %
-1 %
0 %
1 %
2 %
3 %
-5 -4 -3 -2 -1 0 1 2 3 4 5-3 %
-2 %
-1 %
0 %
1 %
2 %
3 %
-5 -4 -3 -2 -1 0 1 2 3 4 5
-3 %
-2 %
-1 %
0 %
1 %
2 %
3 %
-5 -4 -3 -2 -1 0 1 2 3 4 5-3 %
-2 %
-1 %
0 %
1 %
2 %
3 %
-5 -4 -3 -2 -1 0 1 2 3 4 5
HIGH (HIGHEST 20%) MIDDLE (60%) LOW (LOWEST 20%)
Panel E: SEO% (MM) Panel F: SEO% (MA)
Panel A: 12-month pre-issue return (MM) Panel B: 12-month pre-issue return (MA)
Panel C: Sales growth- % (MM) Panel D: Sales growth- % (MA)
Days
CAR
CAR
CAR CAR
CAR
CAR
Days Days
Days
Days Days

62
Figure 4: CARs of SEO firms around the announcement: the impact of issuer characteristics The figure shows the impact of 12-month pre-issue market adjusted stock return, issuer 12-month sales growth and equity offering volume (SEO%, calculated as all UK SEOs with value over €5 million within a quarter divided by the number of listed companies at the end of previous year) on SEO firms’ announcement effect. The abnormal returns are calculated using market model on the left hand side (MM) and market adjusted returns on the right (MA). All the panels show returns of the highest 20 % (black line), lowest 20 % (dim grey line) and the remaining 60 % in between (dark grey line) calculated as equally weighted sample averages. Panels A and B present the impact of issuer pre-issue 12-month stock return on announcement effect during [-5,+5] window, while Panels C and D show the impact of 12-month sales growth at the issue year during similar [-5,+5] window. Panels E and F show the impact of equity offering volume (SEO%) during [-5,+5] window. The sample totals 543 SEOs during a period ranging from 1999 to 2007. The grey area highlights [-1,+1] event window and the dashed line is positioned in the midpoint of the announcement date.
Figure 4 graphically presents the impact of three of the most consistent determinants of SEO
announcement effect: past stock returns, sales growth and SEO volume. For robustness, the
results are shown both using market model and plain market adjusted abnormal returns.
Figure 4 shows that as a result of sub sampling, the only group of firms with significantly
negative announcement effect is the quintile of firms with lowest stock market performance
during 12-month prior to the announcement – the relationship holds using both market model
and market adjusted returns (Panels A and B). On the other hand, based on the regression
analysis I conclude that the impact of SEO% and sales growth is not robust and instead
affected by large differences between firms in the cross-section.
Robustness check: market timing as a determinant of SEO announcement effect
The sample period of the thesis ranging from 1999 to 2007 contains IT bubble around the year
2000, and therefore reflects its consequences. The stock market underwent extreme optimism
before IT bubble burst in the early 2000, when a number of technology firms sought external
financing from the market by means of IPOs and SEOs. The bullish period was followed by
market-wide waves of pessimism with a number of bankruptcies occurring and a large
fraction of the aggregate stock market wealth vanishing. Theoretically, dramatic shifts in the
market conditions can bias the results of the event study at the total sample level. So far, past
stock returns seem to be an important determinant of SEO announcement effect, yet the time
period employed in the thesis exposes the results to time-varying market conditions. To
address the robustness of the results, I remove the outlier years from the sample and perform
regression analysis.

63
Figure 5: The impact of past 12-month stock return on announcement effect annually during the sample period The figure shows the median market adjusted cumulative abnormal returns of high (20 %) and low (20 %) portfolios of SEO firms sorted by raw past 12-month stock return. Firms are sorted separately each year to analyze the impact of time on the announcement effect. 1 % of observations with highest and lowest past stock returns and CARs are excluded from the total sample respectively. The black bars represent the median CARs of 20 % of firms with highest past 12-month stock returns each year, while the grey bars represent 20 % with the lowest past stock returns. The sample totals 543 SEOs by UK firms during period 1999-2007 sourced from Dealogic. The stock data are sourced from Datastream.
Figure 5 shows the time-varying role of past 12-month stock returns as a determinant of the
SEO announcement effect. In year 1999, the high stock market performers face extreme
optimism around the announcement. On the contrary, in year 2001 subsequent to the IT
bubble burst, low stock market performers undergo extremely low announcement returns.
During the remaining sample years, the market reaction on SEO announcement is more
optimistic for high performers than for low performers, while the differences between
subsamples are much smaller than in years 1999 and 2001.
-10 %
-5 %
0 %
5 %
10 %
1999 2000 2001 2002 2003 2004 2005 2006 2007
Anno
unce
men
t CA
R
LOW 20%, past stock return
HIGH 20%, past stock return

64
Table XIII Regression analysis of announcement effect after removal of years 1999 and 2001
The table shows OLS regression estimates for determinants of cumulative abnormal returns around the announcement of SEOs. The regressions are estimated for event window of [-1,+1] days using both market model and market adjusted returns in estimation of CARs. Years 1999 and 2001 show differing announcement effect patterns and they are removed from the sample. 1 % of observations both with highest and lowest CARs and past stock returns are removed from the sample. The sample of equity issues is sourced from Dealogic, while the company financials are sourced from Thomson’s Worldscope and stock data from Datastream. The sample period ranges from 1999 to 2007 and contains 543 SEOs in total. Financial slack (cash and cash equivalents / total assets), Debt / Total assets, Capex / Total assets, EBITDA / Total assets, Market-to-Book, LNsales and PPE / Total assets are measured at the previous year end. Sales growth is measured in the issue year. Dividend is a dummy variable that gets value of 1 if firm’s dividend payout ratio is 20 % or higher and value of 0 otherwise. R&D is a research and development dummy variable that gets value of 1 if the firm reports R&D expenditures and 0 otherwise. Past 12m stock return is the firm’s 12-month raw stock return prior to the issue announcement. SENT is the level of UK consumer sentiment index in the issue month. Issue size is the total deal value divided by the previous year end market cap. SEO% is the number of SEOs in the UK within the event quarter divided by the number public companies at the end of the previous year. T-statistics, with heteroscedasticity consistent standard errors as suggested by White, for no relationship between dependent and independent variables are reported next to coefficients, where * and ** denote to statistical significance of the relationship at 5 % and 1 % levels respectively. F-statistics and R-squared are reported as measures of model explanatory power.
Independent variables Estimate t-stat Estimate t-stat
Past 12m stock return 0.015 2.57* 0.017 2.79**
Market-to-book 0.001 0.50 0.001 0.57Sales growth 0.017 1.26 0.013 0.87SEO% 0.870 1.18 1.131 1.40
Dividend 0.015 1.32 0.011 1.00SENT 0.001 0.50 0.002 0.62Issue size 0.003 0.22 0.007 0.68LNsales -0.004 -1.27 -0.003 -1.01Debt / Total assets 0.030 1.24 0.028 1.15PPE / Total assets -0.015 -0.94 -0.013 -0.81EBITDA / Total assets 0.007 0.45 0.015 0.74Financial slack 0.026 0.90 0.019 0.60R&D 0.009 0.91 0.015 1.39
Intercept 0.001 0.02 -0.011 -0.22
Year dummies Yes YesF-statistic 1.558 1.849P-value, F-statistic 0.06 0.02*R-squared 0.065 0.098Number of observations 418 418
Dependent variable: SEO announcement CAR [-1,+1] after removal of years 1999 and 2001
[-1,+1] [-1,+1]Market model Market adjusted
Cross-sectional OLS regression

65
Table XIII shows regression estimates for the total sample less years 1999 and 2001. The
estimated coefficients are well in line with the total period regression estimated in Table XII.
In addition, the t-statistics of past stock returns in models employing both market model
(2.57) and market adjusted returns (2.79) remain highly statistically significant. Similarly, all
the other hypothesized variables of interest maintain their insignificant positive signs.
Therefore, the robustness checks show that the findings on SEO announcement effect
determinants are not driven by sub periods of extreme market conditions.
The analysis on announcement effect of SEOs documented in this subsection yield several
conclusions. Moreover, market timing is the strongest determinant of abnormal returns as the
positive impact of past stock returns persist after controlling for market-to-book ratio and
various other issuer characteristics. In addition, the impact of demand for capital, proxied by
sales growth during the year of the issue, appears to be positive and statistically insignificant
during a three-day event period at the total sample. Nevertheless, the univariate analysis
suggests that a weak association exists. Finally, the analysis on equity offering volume as a
determinant of announcement return suggests that a modest linkage exists, but the relationship
is driven by subsample of firms issuing during the high volume issue periods.
6.2.2 Post-issue performance In this subsection, I present the findings on issuer long-term post-issue stock market
performance. To mitigate the bad model or specification problem argued by Barber and Lyon
(1997) and Lyon et al. (1999), I use both 1) FTSE All-Share index and 2) size and market-to-
book matched firms as the benchmark to calculate the abnormal returns. I also test the
hypotheses H11-H13 on determinants of post-issue performance. Specifically, I employ pre-
issue firm characteristics as the proxies to test the strength of market timing, demand for
capital and deal size as determinants of post-issue performance.

66
Table XIV SEO post-issue performance: total sample
The table shows the post-issue underperformance of seasoned equity offerings at the total sample level. The results are estimated and reported using both size and market-to-book matched firms and FTSE All-share index as the benchmarks and presented separately for [0,+24] and [0,+36] event windows. The sample of equity issues is sourced from Dealogic, while the stock data is sourced from Datastream. The sample period ranges from 1999 to 2007 and contains 543 SEOs in total. 1 % with largest and smallest BHARs is sorted out from the sample. Equally weighted sample averages and proportion of positive BHARs are reported. The beginning of the event period, t=0, is set to the closing of the next trading following the issue date reported by Dealogic. T-statistics of no difference from zero are reported next to averages, where * and ** denote to statistical significance of the difference at 5 % and 1 % levels respectively.
Table XIV above shows that SEO firms underperform in comparison to both benchmarks
during 24-month and 36-month periods of interest. The findings on post-issue performance
are consistent with the earlier research on UK SEOs by Ngatuni et al. (2007) and
Andrikopoulos (2009). However, my empirical results indicate that using benchmark firms
matched on both market-to-book and firm size yields less negative estimates for abnormal
returns (24-month BHAR: -8.2 %) as the benchmarks matched on a single criterion in the
mentioned studies (24-month BHAR varies from -13.9 % to -18.0 % depending on the
benchmark in Andrikopoulos (2009)). The differences between the FTSE All-Share and
matching firm benchmarked abnormal returns in the cross-section are large, since 44.6 % of
the firms do not underperform using matching firms, while the same figure is 34.3 % using
FTSE All-Share as the benchmark. The results imply that SEO underperformance as a
phenomenon partly vanishes when using well specified matching firms, but still the
underperformance remains marginally statistically significant. Nevertheless, the topic has
been debated extensively in the recent literature (see, e.g., Barber and Lyon (1997), Jegadeesh
(2000)).
Event windowAverage t-stat % positive Average t-stat % positive
BHAR, Match -8.2 % -2.24* 47.1 % -13.5 % -2.48* 44.6 %
BHAR, FTSE -14.6 % -5.17** 34.7 % -17.4 % -4.35** 34.3 %
[0,+24] [0,+36]
Total sample of SEOs (n=543) Post-issue BHARs

67
Figure 6: Buy-and-hold abnormal returns of SEO firms: post-issue period The figure shows buy-and-hold abnormal returns for equity issuers during 36-month event period [0,+36] subsequent to an SEO. The dark line shows equally-weighted sample average BHAR using size and market-to-book matched firms as the benchmark, while the dim line employs FTSE All-Share index as the benchmark. 1 % with the lowest and highest BHARs are removed from the series. All UK SEOs with a deal value in excess of €5 million during period 1999-2007 are sourced from Dealogic making a total sample consisting of 543 SEOs. Accounting data for matching firms are retrieved from Thomson’s Worldscope, while stock data are sourced from Datastream. The beginning of the event period, t=0, is set to the closing of the next trading following the issue date reported by Dealogic.
Figure 6 shows the buy-and-hold abnormal returns for the total sample of SEOs. Moreover, as
can be seen from the figure, the model choice is critical to the results observed. As the equally
weighted BHAR using FTSE All-Share as the benchmark yield an average 24-month return of
-14.6 % the BHAR using matching firms yield an average return of -8.2 %. Both figures are
statistically significantly different from zero at the conventional 5 % significance level.
Loughran and Ritter (1995) throw light on the new issues’ poor performance subsequent to an
issue. Since their arguments, numerous papers address the anomalous performance of the
-20 %
-15 %
-10 %
-5 %
0 %
5 %
0 2 4 6 8 10 12 14 16 18 20 22 24 26 28 30 32 34 36
BH
AR
Months subsequent to SEO
Model: BHAR FTSEModel: BHAR Match
68
issuers. Furthermore, two of the often noted arguments for the underperformance are
successful market timing by the managers and deterioration of the operating performance
following an issue. In other words, equity issues imply overvaluation or alternatively, they are
actually non-events – firm specific factors explain the underperformance in the long horizon.
Jegadeesh (2000) argues that investors are overoptimistic about the prospects of the new
issues and realize it only in the longer term. In response to the studies on shifts in long-term
operative performance, I test the impact of pre-issue characteristics on the long-term post-
issue performance. I hypothesize that firms who signal overvaluation at the announcement
should be poor long-term investments, while the firms who demand capital for investments or
growth could theoretically use the proceeds efficiently and show less signs of
underperformance. In addition, I find that at the total sample level, SEO firms underperform
subsequent to the issue, and hypothesize that SEO underperformance increases with deal size.
Finally, I further test whether investors can distinct between good and bad SEOs at the time of
announcement.
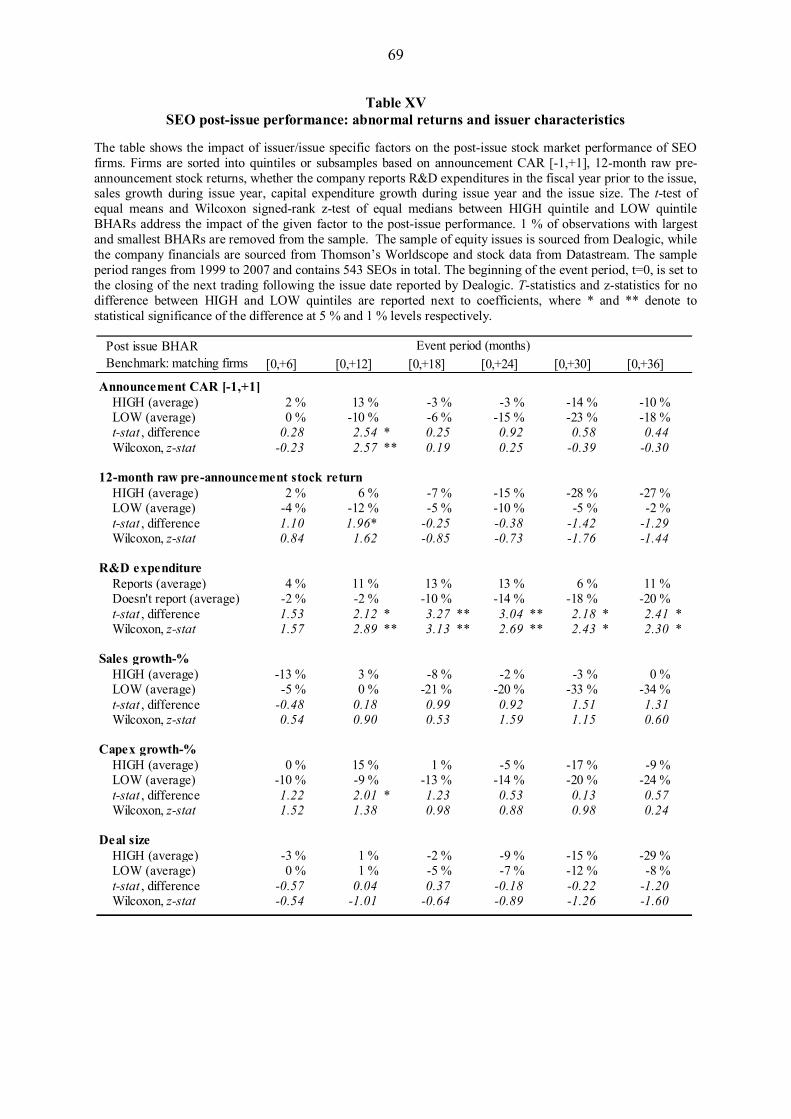
69
Table XV SEO post-issue performance: abnormal returns and issuer characteristics
The table shows the impact of issuer/issue specific factors on the post-issue stock market performance of SEO firms. Firms are sorted into quintiles or subsamples based on announcement CAR [-1,+1], 12-month raw pre-announcement stock returns, whether the company reports R&D expenditures in the fiscal year prior to the issue, sales growth during issue year, capital expenditure growth during issue year and the issue size. The t-test of equal means and Wilcoxon signed-rank z-test of equal medians between HIGH quintile and LOW quintile BHARs address the impact of the given factor to the post-issue performance. 1 % of observations with largest and smallest BHARs are removed from the sample. The sample of equity issues is sourced from Dealogic, while the company financials are sourced from Thomson’s Worldscope and stock data from Datastream. The sample period ranges from 1999 to 2007 and contains 543 SEOs in total. The beginning of the event period, t=0, is set to the closing of the next trading following the issue date reported by Dealogic. T-statistics and z-statistics for no difference between HIGH and LOW quintiles are reported next to coefficients, where * and ** denote to statistical significance of the difference at 5 % and 1 % levels respectively.
[0,+6] [0,+12] [0,+18] [0,+24] [0,+30] [0,+36]
Announcement CAR [-1,+1]HIGH (average) 2 % 13 % -3 % -3 % -14 % -10 %LOW (average) 0 % -10 % -6 % -15 % -23 % -18 %t-stat , difference 0.28 2.54 * 0.25 0.92 0.58 0.44Wilcoxon, z-stat -0.23 2.57 ** 0.19 0.25 -0.39 -0.30
12-month raw pre-announcement stock returnHIGH (average) 2 % 6 % -7 % -15 % -28 % -27 %LOW (average) -4 % -12 % -5 % -10 % -5 % -2 %t-stat , difference 1.10 1.96* -0.25 -0.38 -1.42 -1.29Wilcoxon, z-stat 0.84 1.62 -0.85 -0.73 -1.76 -1.44
R&D expenditureReports (average) 4 % 11 % 13 % 13 % 6 % 11 %Doesn't report (average) -2 % -2 % -10 % -14 % -18 % -20 %t-stat , difference 1.53 2.12 * 3.27 ** 3.04 ** 2.18 * 2.41 *Wilcoxon, z-stat 1.57 2.89 ** 3.13 ** 2.69 ** 2.43 * 2.30 *
Sales growth-%HIGH (average) -13 % 3 % -8 % -2 % -3 % 0 %LOW (average) -5 % 0 % -21 % -20 % -33 % -34 %t-stat , difference -0.48 0.18 0.99 0.92 1.51 1.31Wilcoxon, z-stat 0.54 0.90 0.53 1.59 1.15 0.60
Capex growth-%HIGH (average) 0 % 15 % 1 % -5 % -17 % -9 %LOW (average) -10 % -9 % -13 % -14 % -20 % -24 %t-stat , difference 1.22 2.01 * 1.23 0.53 0.13 0.57Wilcoxon, z-stat 1.52 1.38 0.98 0.88 0.98 0.24
Deal sizeHIGH (average) -3 % 1 % -2 % -9 % -15 % -29 %LOW (average) 0 % 1 % -5 % -7 % -12 % -8 %t-stat , difference -0.57 0.04 0.37 -0.18 -0.22 -1.20Wilcoxon, z-stat -0.54 -1.01 -0.64 -0.89 -1.26 -1.60
Event period (months) Post issue BHAR Benchmark: matching firms

70
Univariate analysis on determinants of post-issue underperformance
Table XV above presents the equally weighted abnormal stock market performance of
subsamples of size and market-to-book matched SEOs sorted by the variables of interest. The
observation period ranges from six to 36 months.
i) Announcement returns
I find that the firms with the most optimistic market reaction at the announcement of the SEO
are superior investments during 12-month horizon as opposed to the poorest quintile of firms
at the announcement. However, the difference in BHARs between subsamples of firms
converges after one year from the announcement. All in all, investors seem to have some
ability to pick the best issues at the announcement.
ii) Market timing
The role of past stock returns in explaining post-issue stock market performance is two-
parted: first, high pre-issue stock return firms are good investments during short horizons of
six and twelve months, but they start underperforming in the longer term. Moreover, the worst
performers prior to the issue seem not to underperform significantly during periods of 24 to
36 months. These findings indicate that the market timing is a strong determinant of post-
issue underperformance in the UK. The found stock return pattern around SEOs is fully
consistent with the literature on momentum, which explains that the strong performing
portfolio of firms during the previous six months face higher abnormal returns on firm
announcements and are superior short-term investments during periods of 12 months or less
(Jegadeesh and Titman, 1993).
iii) Demand for capital
I employ three different proxies of demand for capital as the issuer characteristics that could
explain long-term underperformance: whether firm reports research & development
expenditures, issue year sales growth and issue year capital expenditures. I find strong
evidence that firms who commit and report R&D expenditures are superior investments as
opposed to the firms who do not report R&D expenditures. In addition, both sales growth and
capital expenditure growth have hypothesized sign, yet only capital expenditure growth at 12-
month period after issue has statistically significantly positive sign at 5 % level. The existing
literature partly contradicts with the findings presented in Table XV. Lyandres et al. (2008)
argue that SEO firms invest significantly more than their non-issuing peers and additionally,
adjusting for the difference in investment explains large part of the observed

71
underperformance of SEOs. Lyandres et al. (2008) and Carlson et al. (2006) hypothesize that
the increase in investment ultimately reduces firm risk and decreases expected return. One
possible explanation for the positive linkage between capital demand proxies and BHARs is
the use of matching firm technique. Using a sample of French firms, Jeanneret (2005) finds
investment related SEOs to yield significantly negative abnormal returns, while using a large
US sample, Autore et al. (2009) report findings that question the true form of the
phenomenon. Moreover, issuers who state that the purpose of the issue is to raise cash for
investment purposes perform significantly better than the other use of proceeds classes.
Should the use of appropriate matches control for the differences in investment opportunities
across firms, then sales growth, capex growth and R&D expenditures could be interpreted as
measures of firm quality rather than investment opportunities.
iv) Issue size
I test the impact of relative issue size (measured as total deal value divided by the last year
end market cap) on the post-issue stock market performance. I do not find significant
relationship between issue size and issuer performance to exist. During most of the estimation
windows, issuers with large deal size seem to be worse off than the small issuers, but the
relation seems weak. However, the decrease in the performance of firms with large issue sizes
after 12 months following an issue indicates that the large deal sizes are associated with
elements of market timing attempt by the managers.

72
Table XVI SEO post-issue performance: regression analysis of abnormal returns
The table shows OLS regression estimates for determinants of buy-and-hold abnormal returns following an SEO announcement. The regressions are estimated for event periods of [0,+24] and [0,+36] months using both size & market-to-book matched firms and FTSE All-Share stock index as benchmarks in estimation of BHARs. The sample of equity issues is sourced from Dealogic, while the company financials are sourced from Thomson’s Worldscope and stock data from Datastream. The sample period ranges from 1999 to 2007 and contains 543 SEOs in total. 24 firms have missing data items which reduce the number of observations in regressions to 519. In addition, the regressions with 36-month event period contain 393 observations. Financial slack (cash and cash equivalents / total assets), Debt / Total assets, EBITDA / Total assets, Market-to-Book, LNsales and PPE / Total assets are measured at the previous year end. Sales growth and Capex growth are measured in the issue year. Dividend is a dummy variable that gets value of 1 if firm’s dividend payout ratio is 20 % or higher and value of 0 otherwise. R&D is a research and development dummy variable that gets value of 1 if the firm reports R&D expenditures and 0 otherwise. Past 12m stock return is the firm’s raw stock return prior to the issue announcement. Issue size is the total deal value divided by the previous year end market cap. SEO% is number of SEOs in the UK divided by the number public companies at the end of previous year. The beginning of the event period, t=0, is set to the closing of the next trading following the issue date reported by Dealogic. 1 % of observations both with highest and lowest CARs and past stock returns are removed from the sample. T-statistics, with heteroscedasticity consistent standard errors as suggested by White, for no relationship between dependent and independent variables are reported next to coefficients, where * and ** denote to statistical significance of relationship at 5 % and 1 % levels respectively. F-statistics and R-squared are reported as measures of model explanatory power.
Independent variables Estimate t-stat Estimate t-stat Estimate t-stat Estimate t-stat
CAR [-1,+1] 1.121 1.87 0.250 0.34 1.666 3.02** 0.826 1.48
Past 12m Stock return -0.268 -2.53* -0.141 -1.48 -0.129 -2.88** -0.089 -2.02*
R&D 0.108 0.73 0.219 1.12 0.052 0.47 0.111 0.75Sales growth 0.210 1.26 0.172 0.66 0.081 0.68 0.202 1.00
Capex growth 0.052 0.65 0.073 0.59 0.007 0.11 0.015 0.18
Issue size -0.280 -2.98** -0.468 -4.49** -0.105 -1.69 -0.213 -3.02**
Market to Book -0.017 -1.54 -0.018 -1.58 -0.029 -2.36* -0.031 -2.02*
LN sales -0.045 -1.61 -0.063 -1.71 -0.002 -0.07 -0.003 -0.07
Debt / Total assets -0.490 -1.76 -0.077 -0.20 -0.344 -1.66 0.114 0.43
EBITDA / Total assets -0.142 -0.55 -0.242 -1.06 0.002 0.01 0.092 0.43
PPE / Total assets -0.320 -1.52 -0.227 -0.86 -0.017 -0.10 0.018 0.10Financial slack -0.093 -0.30 0.002 0.01 -0.392 -1.35 -0.276 -0.78
Dividend 0.066 0.55 0.199 1.09 -0.012 -0.12 0.019 0.14
SEO% -0.833 -0.12 -9.107 -0.99 -9.556 -1.55 -12.508 -1.53
Intercept 0.779 2.15* 1.158 1.83 0.743 1.60 0.639 1.00
Year dummies Yes Yes Yes YesF-statistic 2.171 1.160 2.422 1.677P-value, F-statistic <0.01** 0.29 <0.01** 0.03*R-squared 0.119 0.082 0.131 0.115Number of observations 519 393 519 393
[0,+24] [0,+36] [0,+24] [0,+36]
Cross-sectional OLS regression
BHAR: Matching firm BHAR: FTSE All-Share
Dependent variable: SEO post-announcement BHAR [0,+24] and [0,+36]

73
Multivariate analysis on determinants of post-issue underperformance
To test the robustness of the findings, I perform cross-sectional multivariate regression
analysis of BHARs controlling for various issuer specific characteristics. The regression
estimates are presented in Table XVI. The coefficients of both announcement CAR and past
stock returns have expected sign and show statistical significance in some of the regression
models. The strong negative impact of pre-issue 12-month stock return on 24-month BHAR
shows that market timing hypothesis seems to explain a fraction of the post-issue
underperformance after controlling for various firm specific variables suggested in the
literature. Loughran and Ritter (1995) argue that market-to-book and size factors explain part
of the observed abnormal returns, which suggest that the variables should be included as
control variables. Moreover, I find that the two variables, namely market-to-book and
LNsales, have negative and partly statistically significant relationship with the abnormal
returns following an SEO.
Based on the regression estimates, the demand for capital hypothesis seems weaker in
determining the abnormal returns of SEO firms than was expected based on the univariate
analysis. While all the three proxies of demand for capital hypothesis have persistent positive
sign, none of them has statistical significance at any of the conventional levels. A possible
explanation of the modest regression estimates is the positive correlation among the three
variables which weakens the regression estimates to a certain degree. The hypothesized
negative impact of issue size is persistent during long holding periods as both models with 36-
month estimation period yield test statistics highly significant at 1 % level. Finally, SEO
volume and leverage suggest small negative relation with post-issue performance. The
negative sign of the SEO volume supports the existing literature. Namely, Loughran and
Ritter (1995) state that SEOs cluster into opportunistic periods, which are particularly
vulnerable for long-term underperformance.

74
-25 %-20 %-15 %-10 %
-5 %0 %5 %
10 %15 %
HIGH CAR[-1,+1]LOW CAR [-1,+1]
-30 %-25 %-20 %-15 %-10 %
-5 %0 %5 %
10 %
HIGH 12-month pre issue stock returnLOW 12-month pre issue stock return
-25 %-20 %-15 %-10 %-5 %0 %5 %
10 %15 %
Reports R&D expensesDoesn't report R&D expenses
-35 %-30 %-25 %-20 %-15 %-10 %-5 %0 %5 %
HIGH sales growth-%LOW sales growth-%
-25 %-20 %-15 %-10 %
-5 %0 %5 %
10 %15 %
HIGH capex growth-%LOW capex growth-%
-30 %-25 %-20 %
-15 %
-10 %
-5 %
0 %
5 %
HIGH deal sizeLOW deal size
Panel A: Announcement CAR [-1,+1] Panel B: Pre-issue 12-month raw stock return
Panel C: R&D expenditures Panel D: Sales growth- %
Panel F: Issue size Panel E: Capex growth- %
BHAR BHAR
BHAR BHAR
BHAR BHAR
Months Months
Months Months
Months Months

75
Figure 7: BHARs of SEO firms post-issue: the impact of issuer characteristics The figure shows the impact of issuer/issue specific factors on the post-issue stock market performance of SEO firms measured as buy-and-hold abnormal returns using size and market-to-book matched firms as the benchmark. Firms are sorted into quintiles based on announcement CAR [-1,+1], 12-month raw pre-announcement raw stock returns, whether the company reports R&D expenditures in the fiscal year prior to the issue, sales growth- % during the issue year, capital expenditure growth- % during the issue year and the issue size in percentage of last year end market capitalization. 1 % with highest and lowest BHARs are removed from the series. The dark and dim bars show the equally weighted average BHAR of HIGH and LOW quintile respectively. The sample of equity issues is sourced from Dealogic, while the company financials are sourced from Thomson’s Worldscope and stock data from Datastream. The sample period ranges from 1999 to 2007 and contains 543 SEOs in total. The beginning of the event period, t=0, is set to the closing of the next trading following the issue date reported by Dealogic.
Figure 7 graphically illustrates the impact of pre-issue characteristics of issuers on long-term
abnormal returns post-issue. Panel B plots the impact of pre-issue raw stock return on the
post-issue performance. Moreover, while strong past stock market performers seem superior
investments during short horizons, they clearly start to underperform after 12 months
following an issue. As described before and plotted in Panel C, the presence of research and
development expenditures gives strong indication on post-issue performance. Namely, the
firms reporting R&D expenditures outperform their non-issuing benchmarks, while the
reverse holds for non-reporting firms. Should the SEOs underperform on average, one would
expect larger deal sizes to imply more severe underperformance. Panel F plots the relationship
and indicates that larger issue sizes are among the worst investments in the long-term.
The analysis of post-issue underperformance reveals that using matching firms instead of
FTSE All-Share as the benchmark for normal returns considerably decreases the estimates of
aggregate underperformance. At the cross-sectional level, firms with high past stock returns
and large issue size seem to be poor investments at the longer term. Various proxies on
demand for capital indicate positive relation with post-issue performance. However, based on
the regression analysis, none of capital demand proxies has a robust statistically significant
relationship. All in all, the findings indicate that investors are worse off when participating in
market timing driven SEOs as opposed to the issues by high demand for capital firms, who
can put the proceeds into efficient use.

76
Table XVII Summary of findings on issuer stock market performance
The table pools together the hypotheses on stock market performance of the SEO firms around the announcement as well as in the post-issue period, the proxy variables employed in the tests and the empirical findings on the hypotheses. The “+” (positive linkage) and “–“ (negative linkage) signs after the hypotheses address the theoretical prediction of the relationship between each class of hypotheses and the abnormal stock market performance. The column on the right indicates whether the hypothesis ought to be accepted based on the empirical findings.
To pool together the various tests and hypotheses on issuer stock market performance, Table
XVII summarizes the major findings and documents the proxies used to test hypothesized
relations. The role of market timing hypothesis seems strong in explaining announcement
effect, while the momentum firms continue to perform strongly during periods of less than 12
months following the issue. Yet, as hypothesized, the market timers turn out to be poor
investments during periods over 24 months. Larger issue sizes also perform poorly at the long
horizon, which can possibly reflect the fact that some firms exploit market timing by issuing
more capital than they can actually put into efficient use. The hypothesized positive linkage
between SEO volume and announcement effect is driven by subsample of firms that time their
issues for high SEO volume periods, while the evidence on demand for capital as a
determinant of announcement return seems much the same. Finally, various proxies on
demand for capital indicate that firms who can invest the issue proceeds in positive NPV
projects can avoid post-issue underperformance.
SEO announcement effect: ex ante firm/issue characteristics determining the announcement effect
Hypotheses & prediction Proxies Accepted/Rejected
H8: SEO volume (+) Quarterly number of SEOs / number of listed firms Weak supportH9: Demand for capital (+) Sales growth-% Weak supportH10: Market timing (+) Market-to-book, past 12m stock return Accepted
Long-term performance: ex ante firm/issue characteristics determining the post-issue performance
H11: Market timing (-) Pre-issue 12m stock return AcceptedH12: Demand for capital (+) R&D expenditure, Capex growth-%, Sales growth-% Weak supportH13: Issue size (-) Total proceeds / previous year end market cap Accepted
Summary of findings: issuer stock market performance

77
7 CONCLUSION
The thesis was motivated by lacking understanding of various SEO mechanisms in the UK as
concluded by Andrikopoulos (2009), who show that SEO firms post-issue operating
performance deteriorates following the issue. The limited empirical evidence on UK SEOs
motivates an investigation of various SEO phenomena from the perspective of the traditional
theories on firm financial policy. In addition, inspired by the recent unpublished working
paper on macro determinants of SEOs by Howe and Zhang (2009), which to my best
knowledge is the first attempt to study the phenomenon from multiple theories’ perspective, I
provide new evidence and deepen the understanding on drivers of SEO cycles.
This thesis studies various financial theories’ impacts on the equity offering decision and their
consequences on SEO firms’ stock market performance. In the first empirical section 6.1, I
employed UK data sample to 1) analyze the macro determinants of SEOs and 2) to distinct
between different micro level determinants of SEOs. In section 6.2, I additionally 3) analyze
the determinants of issuer announcement effect and 4) investigate the impact of firm-specific
ex ante characteristics on the issuer post-issue performance. At the macro level, I investigated
the drivers of fluctuation in seasoned equity offering volume using data for period 1994 to
2008 including 2,670 SEOs by UK firms listed in the London Stock Exchange. At the cross-
sectional level, I analyzed the determinants of equity vs. debt issue choice by using 423 firm
years with an SEO and 1,096 firm years with a debt issue during period from 1999 to 2007.
Finally, I studied the impact of firm-specific pre-issue accounting and stock market variables
on the abnormal returns of issuers around the announcement and in the long-term using data
on 543 SEOs during period from 1999 to 2007.
At the macro level, I report both demand for capital and market timing conditions to have a
strong impact on the SEO volume. Equity offering volume increases along with aggregate
sales growth prospects of public firms and decreases with rising risk-free rate. Similarly, past
stock market returns positively affect SEO volume, while the future stock returns have
negative, but less clear linkage. At the cross-sectional level, much of the same patterns exist,
while I also find firms with high leverage and research and development expenditures to
choose issuing equity over debt. SEO announcement effect is positively affected by past stock
returns, and to some extent by sales growth and SEO volume, all the findings being in line

78
with the predictions of the adverse selection models. Finally, firms with high past stock
returns perform strongly during short periods following an issue, but turn out to be poor
investment during periods of 24 or 36 months. On the contrary, firms with demand for capital
and research and development expenditures appear to be good investments post-issue. Firms
with large issue sizes underperform considerably more than firms with small issues, who
actually experience only modest underperformance. Table XVIII below summarizes the
empirical evidence to support the hypotheses tested in the thesis.
Table XVIII Summary of findings
Macro determinants (multivariate OLS regressions in section 6.1)H1 Macro volume of SEOs increases with market
timing.Strong evidence. Past (t = 2.73) and future returns (t = -3.81) on FTSE All-Share index are statistically significant at 1 % level.
H2 Macro volume of SEOs decreases with asymmetric information.
Weak support. Market volatility is negatively associated with SEO volume (t = -2.62), while analyst dispersion does not have explanatory power.
H3 Macro volume of SEOs increases with demand for capital.
Strong evidence. Both future aggregate sales growth (t = 3.83) and interest rates (t = -4.51) are highly significant at all convent ional levels.
H4 Macro volume of SEOs increases with investor sentiment.
No support for H4 found.
Micro determinants (multivariate logit regressions in section 6.1)H5 The likelihood of an SEO relative to a debt
issue increases with market tim ing.Strong evidence. Past 12-month stock returns are persistent ly significant at 1 % level, while also the estimates for M / B and post-issue stock returns support the hypothesized relationship.
H6 The likelihood of an SEO relative to a debt issue decreases with asymmetric information.
Strong evidence. Both analyst coverage (t = 2.62) and leverage (t = 3.59) are persistent ly statist ically significant in various mult ivariate models.
H7 The likelihood of an SEO relative to a debt issue increases with demand for capital.
Strong evidence. Sales growth (t = 2.51) and R&D dummy variable (t = 3.97) are positively associated with the equity issue likelihood.
Announcement effect (univariate subsample analysis and multivariate OLS regressions in section 6.2)H8 SEO announcement return increases with
SEO volume.Weak support. Univariate analysis reveals that the highest subsample of hot period issuers undergo posit ive announcement returns (2.2 %, t = 2.42), yet mult ivariate analysis shows that results are non-monotonic.
H9 SEO announcement return increases with demand for capital.
Weak support. The role of sales growth seems persistent based on the univariate analysis, but weakens after controlling for issuer specific factors.
H10 SEO announcement return increases with market timing.
Strong evidence. The role of past 12-month stock return is persistent in univariate analysis (HIGH - LOW difference 5.5%, t = 3.75), mult ivariate regressions (t = 2.93) and persists in robustness checks (t = 2.57).
Post-issue performance (univariate subsample analysis and multivariate OLS regressions in section 6.2)H11 SEO long-term underperformance increases
with market timing.Strong evidence. High past stock return firms are good investments during short periods, but underperform during longer periods (24m: t = -2.53)
H12 SEO long-term underperformance decreases with demand for capital.
Weak support. Sales growth, R&D and capex growth all seem to be posit ively related to the post-issue performance, yet none of them is significant in multivariate regressions.
H13 SEO long-term underperformance increases with deal size.
Strong evidence. All analyses indicate that large issues perform poorly the longer the holding period (36m: t = -4.49).
Hypothesis Empirical evidence

79
The purpose of the study was to investigate the timing of equity issues, which firm types are
likely to issue equity and finally, which issues can be value adding to investors. A better
understanding of SEO determinants can proceed into valuable insights – both from academics
and practitioners perspectives. Furthermore, the post-issue underperformance reported by
Loughran and Ritter (1995), and reaffirmed in this thesis, does not imply that all SEOs are
bad investments as such, but in fact accentuates the importance of understanding why
sometimes an SEO could be interpreted as a sale signal, and at other times a positive
indication of the firm’s future. A possible implication of the findings is that an investor, who
can distinct between market timing driven and demand for capital driven SEOs, is able avoid
post-issue underperformance’s adverse wealth effects by only holding on to stocks of firms
who can signal their rationale for the use of issue proceeds. On the contrary, the findings on
issuer stock market performance suggest that investing in SEOs of firms with high past stock
returns who issue relatively large amount of equity can be hazardous for shareholders’ wealth.
The relatively large transaction costs of external capital issues suggest that ex ante
shareholders benefit from the SEOs only when 1) firm is trading above its intrinsic value or 2)
positive NPV projects (in excess of cost of capital and transaction costs) exist and internally
generated capital is not available. Therefore, following shareholders’ interest guides the firm
directly to issue equity due to one of the two mutually non-exclusive motives: market timing
or demand for capital. The empirical findings indicate that both market timing theory of
equity issuance and demand for capital theory are present at all levels of SEOs: macro, micro
and as determinants of stock market performance around the issue. All in all, while the
theoretical arguments for the existence of various motives for seasoned equity offerings are
clear, investors’ wealth considerations necessitate a better understanding of market timing,
demand for capital and the other prominent theories of security issuance. Clearly, potential
investors need to understand why the firms in the first place issue equity, to be able adjust
valuations to the level of firms’ intrinsic value.
Despite SEOs being among the most researched topics in the corporate finance literature, gaps
to fill still exist. Behavioral aspects of corporate finance are clearly one such area. Moreover,
Baker et al. (2005) discuss the various aspects of behavioral corporate finance. They conclude
that while it is clear investor sentiment is present in the stock market and in firm financial
policy, the correct specifications to measure and quantify its consequences are under a debate.
Moreover, measuring investor sentiment at cross-sectional level would open up room for

80
further investigation of SEO determinants and perhaps more interestingly, enable quantifying
its consequences on the stock price mechanics around seasoned equity offerings.
Countries are different in terms of the role of financial institutions as stock market investors.
Similarly, some firms are mainly held by financial institutions, while others are dispersely
held by households and other investor groups. Quantifying the micro level impact of
ownership structure or the macro level institutional setting of the country on the stock market
performance of equity issuers would be of high interest. Jenter (2005) points out that SEOs
coincide with insider selling. Moreover, the stock price implication of insiders’ transactions
around SEO announcements provides an interesting topic for future research.

81
REFERENCES Aguilera, R., Williams, C., Conley, J., Rupp, D., (2006). Corporate Governance and Social
Responsibility: a comparative analysis of the UK and the US. Corporate Governance: An International Review 14, 147-158.
Alti, A., Sulaeman, J., 2008. When do high stock returns trigger equity issues? Unpublished
working paper, University of Texas at Austin. Asquith, P., Mullins D., 1986. Equity issues and offering dilution. Journal of Financial
Economics 15, 61-89. Autore, D., Bray, D., Peterson, D., 2009. Intended use of proceeds and the long-run
performance of seasoned equity offerings. Journal of Corporate Finance 15, 358-367. Autore, D., Kovacs, T., 2009. Equity issues and temporal variation in information asymmetry.
Journal of Banking & Finance 34, 12-23. Baker, M., Wurgler, J., 2000. The equity share in new issues and aggregate stock
returns. Journal of Finance 55, 2219-2257. Baker, M., Wurgler, J., 2002. Market timing and capital structure. The Journal of Finance 57,
1-32. Baker, M., Wurgler, J., 2006. Investor sentiment and the cross section of stock returns. The
Journal of Finance 61, 1645-1680. Baker, M., Wurgler, J., 2007. Investor sentiment in the stock market. Journal of Economic
Perspectives 21, 129-151. Baker, M., Ruback, R., Wurgler, J., 2005. Behavioral corporate finance: a survey.
Unpublished working paper. Barber, B., Lyon, J., 1997. Detecting long-run abnormal stock returns: The empirical power
and specification of test statistics. Journal of Financial Economics 43, 341-372. Barnes, E., Walker, M., 2006. The Seasoned-Equity Issues of UK Firms: Market Reaction and
Issuance Method Choice. Journal of Business Finance & Accounting 33, 45-78. Bayless, S., Chaplinsky, M., 1996. Is there a window of opportunity for seasoned equity
issuance? The Journal of Finance 51, 253-278. Bethel, J., Krigman, L., 2009. Managing the Costs of Issuing Common Equity: The Role of
Registration Choice. Quarterly Journal of Finance and Accounting 47, 57-85. Brau, J., Ryan, P., DeGraw, I., 2006. Initial public offerings: CFO perceptions, The Financial
Review 41, 483-511.

82
Brav, A., Greczy, C., Gombers, P., 2000. Is the abnormal return following equity issuances anomalous? Journal of Financial Economics 56, 209-249.
Brav, A., Gombers, P., 1997. Myth or reality? The long-run underperformance of initial
public offerings: Evidence from venture and nonventure capital-backed companies. The Journal of Finance 52, 1791-1821.
Brown, S., Warner, J., 1980. Measuring security price performance. Journal of Financial
Economics 8, 205-258. Brown, S., Warner, J., 1985. Using daily stock returns: The case of event study. Journal of
Financial Economics 14, 3-31. Burton, B., Lonie, A., Power, D., 2000. The impact of corporate growth opportunities on the
market response to new equity announcements. Applied Financial Economics 10, 27-36. Burton, B., Helliar, C., Power, D., 2003. A Behavioral Finance Perspective on Initial Public
Offerings and Seasoned Equity. ACCA Research Report No. 82. Cai, J., Loughran T., 1998. The performance of Japanese seasoned equity offerings, 1971–
1992. Pacific-Basin Finance Journal 6, 395–425. Carlson, M., Fischer, A., Giammarino, R., 2005. Corporate investment and asset price
dynamics: Implications for the cross-section of returns. The Journal of Finance 59, 2577-2603.
Carlson, M., Fischer, A., Giammarino, R., 2006. Corporate investment and asset price
dynamics: Implications for SEO event studies and long-run performance. The Journal of Finance 61, 1009-1034.
Choe, H., Masulis, R., Nanda, V., 1993. Common stock offerings across the business cycle:
theory and evidence. Journal of Empirical Finance 1, 3-31. Cornelli, F., Goldreich, D., Ljungqvist, A., 2006. Investor sentiment and Pre-IPO markets.
Journal of Finance 61, 1187-1216. DeAngelo, H., DeAngelo, L., Stulz, R., 2007. Seasoned equity offerings, market timing, and
the corporate lifecycle. Unpublished working paper. Denis, D., 1994. Investment opportunities and the market reaction for seasoned equity
offerings. The Journal of Finance and Quantitative Analysis 29, 159-177. Dierkens, N., 1991. Information asymmetry and equity issues. The Journal of Finance and
Quantitative Analysis 26, 181-198. Dittmar, A., Thakor, A., 2007. Why do firms issue equity? The Journal of Finance 62, 1-54. D’Mello, R., Ferris, S., 2000. The Information Effects of Analysts Activity at the
Announcement of New Equity Issues. Financial Management 29, 78-95.

83
Dougherty, C., 2002. Introduction to econometrics, 2nd edition. Oxford University Press, New York.
Eckbo, B., Masulis, R., 1992. Adverse selection and rights offer paradox. Journal of
Financial Economics 31, 293-322. Eckbo, B., Masulis, R., Norli, O., 2000. Seasoned public offerings: Resolution of the ‘new
issues puzzle’. Journal of Financial Economics 56, 251-291. Eckbo, B., Masulis, R., Norli, O., 2007. Security offerings. In: Eckbo, B. (Ed.), Handbook of
corporate finance: Empirical corporate finance, Vol. 1. In: Handbooks in Finance Series. Elseveir/North Holland Co., Amsterdam.
Fama, E., 1998. Market efficiency, long-term returns, and behavioral finance. Journal of
Financial Economics 49, 283–306. Fama, E., French, K., 2002. Testing pecking order predictions about dividends and debt.
Review of financial studies 15, 1-33. Fama, E., French, K., 2005. Financing decisions: who issues stock? Journal of Financial
Economics 76, 549-582. Fischer, E., Heinkel, R., Zechner, J., 1989. Dynamic capital structure choice: theory and tests.
The Journal of Finance 44, 19-40. Fisher, K., Statman, M., 2000. Investor sentiment and stock returns. Financial Analysts
Journal 56, 16-23. Frank, M., Goyal, V., 2008. Tradeoff and Pecking Order Theories of Debt. In: Eckbo, B.
(Ed.), Handbook of corporate finance: Empirical corporate finance, Vol. 1. In: Handbooks in Finance Series. Elseveir/North Holland Co., Amsterdam.
Graham, J., Harvey, C., 2001. The theory and practice of corporate finance: Evidence from
the field. Journal of Financial Economics 60, 187-243. Heron, R., Lie, E., 2004. A Comparison of the Motivations for and the Information Content of
Different Types of Equity Offerings. Journal of Business 77, 605-632. Ho, K., 2005. Long-horizon abnormal performance following rights issues and placings:
Additional evidence from the UK market. Review of Financial Economics 14, 25-45. Hosmer, D., Lemeshow, S., 2000. Applied logistic regression, 2nd edition. Wiley Series in
Probability and Statistics. John Wiley and Sons Inc., Canada. Hovakimian, A., Opler, T., Titman, S., 2001. The debt-equity choice. The Journal of
Financial and Quantitative Analysis 36, 1-24. Hovakimian, A., 2006. Are observed capital structures determined by equity market timing?
The Journal of Financial and Quantitative Analysis 41, 221-243.

84
Howe, J., Zhang, S., 2009. The Financial Review. Forthcoming. Huang, R., Ritter, J., 2009. Testing theories of capital structure and estimating the speed of
adjustment. Journal of Financial and Quantitative Analysis 44, 237-271. Ibbotson, R., Jaffe, J., 1975. “Hot issue” markets, The Journal of Finance 30, 1027-1042. Jeanneret, P., 2005. Use of the Proceeds and Long-term Performance of French SEO Firms.
European Financial Management 11, 99-122. Jegadeesh, N., 2000. Long-Term Performance of Seasoned Equity Offerings: Benchmark
Errors and Biases in Expectations. Financial Management 29, 5-30. Jegadeesh, N., Titman, S., 1993. Returns to Buying Winners and Selling Losers: Implications
for Stock Market Efficiency. The Journal of Finance 48, 65-91. Jensen, M., 1986. Agency costs of free cash flow, corporate finance, and takeovers. American
Economic Review 76, 323-329. Jenter, D., 2005. Market Timing and Managerial Portfolio Decisions. The Journal of Finance
60, 1903-1949. Jung, K., Kim, Y., Stulz, R., 1996. Timing, investment opportunities, managerial discretion,
and the security issue decision. Journal of Financial Economics 42. 159–185. Kayhan, A., Titman, S., 2007. Firms' histories and their capital structures. Journal of
Financial Economics 83, 1-32. Kohtari, S., Warner, J., 1996. Measuring long-horizon security price performance. Journal of
Financial Economics 43, 301-339. Kohtari, S., Warner, J., 2007. Econometrics of event studies. Presented in: Eckbo, B.,
Handbook of corporate finance: Empirical corporate finance, Vol. 1. In: Handbooks in Finance Series. Elsevier/North Holland Co., Amsterdam.
Korajczyk, R., Deborah L., McDonald, R., 1991. The effect of information releases on the
pricing and timing of equity issues. Review of Financial Studies 4, 685-708. Kraus, A., Litzenberger H., (1973), A state-preference model of optimal financial leverage.
The Journal of Finance 28, 911-922. Loughran, T., Ritter, J., 1995. The new issues puzzle. The Journal of Finance, 50, 23–51. Loughran, T., Ritter, J., 1997. The operating performance of firms conducting seasoned
equity offerings. The Journal of Finance 52, 1823-1850. Leary, M., Roberts, M., 2005. Do firms rebalance their capital structures? The Journal of
Finance 60, 2575-2619. Ljungqvist, A., Nanda, V., Singh, R., 2006. Hot Markets, Investor Sentiment and
IPO Pricing. Journal of Business 79, 1667–1702.

85
Lowry, M., Schwert, W., 2002. IPO market cycle: Bubbles or sequential learning? Journal of
Finance 57, 1171-1200. Lowry, M., 2003. Why does IPO volume fluctuate so much? Journal of Financial Economics
67, 3-40. Lucas, D., McDonald, R., 1990. Equity issues and stock price dynamics. The Journal of
Finance 45, 1019-1043. Lyandres, E., Sun, L., Zhang, L., 2008. The New Issues Puzzle: Testing the Investment-Based
Explanation. Review of financial studies 21, 2825-2855 Lyon, J., Barber, B., Tsai, C., 1999. Improved methods of test of long-horizon abnormal stock
returns. The Journal of Finance 54, 165-201 Marsh, P., 1982. The choice between equity and debt: an empirical study. The Journal of
Finance 37, 121-144. Masulis, R., Korwar, A., 1986. Seasoned equity offerings, Journal of Financial Economics
15, 91-118. Masulis, R., Lee, G., 2009. Seasoned Equity Offerings: Quality of Accounting Information
and Expected Flotation Costs. Journal of Financial Economics 92, 443-469. Menard, S., 2002. Applied logistic regression analysis, 2nd edition. Sage Publications Inc.,
California. Mikkelson, W., Partch, M., 1986. Valuation effects of security offerings and the issuance
process, Journal of Financial Economics 15, 31-60. Mitchell, M., Stafford, E., 2000. Managerial decisions and long term stock price performance.
Journal of Business 73, 287–329. Modigliani, F., Miller, M., 1958. The cost of capital, corporate finance, and theory of
investment. American Economic Review 48, 655-669. Modigliani, F., Miller, M., 1963. Corporate income taxes and the cost of capital: A correction.
American Economic Review 53, 433-443. Myers, S., Majluf, N., 1984. Corporate financing and investment decisions when firms have
information the investors do not have, Journal of Financial Economics 13, 187-221. Myers, S., 1977, Determinants of corporate borrowing. Journal of Financial Economics 5,
147-175. Ngatuni, P., Capstaff, J., Marshall, A. 2007. Long-term performance following rights issues
and open offers in the UK. Journal of Business Finance and Accounting 34, 33–64. Pastor, L., Veronesi, P., 2005. Rational IPO waves. The Journal of Finance 60, 1713-1757.

86
Qiu, L., Welch, I., 2005. Investor Sentiment Measures. Unpublished working paper. Quyhn-Nhu, D., 2009. Leverage, Growth Opportunities and Stock Price Response to New
Financing. International Journal of Business and Management 4, 35-49. Rajan, R., Zingales, L., 1995. What do we know about capital structure: some evidence from
international data. The Journal of Finance 50, 1421-1260. Ritter, J., Welch, I., 2002. A Review of IPO Activity, Pricing, and Allocations. The Journal of
Finance 57, 1795-1828. Ross, S., 1977. The Determination of Financial Structure: The Incentive-Signalling Approach.
The Bell Journal of Economics 8, 23-40. Schulz, P., 2003. Pseudo Market Timing and the long-run underperformance of IPOs. The
Journal of Finance 58, 483-517. Shyam-Sunder, L., Myers, S., 1999. Testing static tradeoff against pecking order models of
capital structure. Journal of Financial Economics 51, 219–244. Slovin, M., Sushka, M., Bendeck, Y., 1994. Seasoned common stock issuance following and
IPO. Journal of Banking and Finance 18, 207-226. Slovin, M., Sushka, M., Lai, K., 2000. Alternative Floatation Methods, Adverse Selection and
Ownership Structure: Evidence from Seasoned Equity Issue in the UK. Journal of Financial Economics 57, 157-190.
Spiess, D., Affleck-Graves, J., 1995. Underperformance in long-run stock returns following
seasoned equity offerings. Journal of Financial Economics, 38, 243–267. Walker, M., Yost, K., 2008. Seasoned equity offerings: What firms say, do, and how the
market reacts. Journal of Corporate Finance 14, 376-386. White, H., 1980. A heteroskedasticity-consistent covariance matrix estimator and a direct test
for heteroskedasticity. Econometrica 48, 817-838.

87
APPENDICES Appendix 1: Sample collection process of non-SEO control sample for logit regression
Appendix 2: Correlation coefficients: macro level determinants SEO% is the total number of UK SEOs in a given quarter divided by the number of listed companies at the end of the previous year. Stdev is the daily standard deviation of FTSE All-Share index within a quarter. Analyst dispersion is the weighted average standard deviation of analyst recommendations on FTSE 100 index companies at the end of the preceding quarter. GDP is the UK GDP growth from 1 quarter before to 2 quarters after the given quarter. Sales is the average sales growth of all UK listed companies from 1 quarter to 4 quarters following the given quarter. Int. is the average LIBOR rate from 4 quarters prior to 1 quarter prior to the given quarter. SENT is the level of UK consumer sentiment in the quarter. M/B is the median market-to-book of all UK listed companies. Mret, pre is the return on FTSE All-Share index from four quarters to one quarter prior to the given quarter. Mret, post is the return on FTSE All-Share index from one quarter to four quarters following the given quarter.
Step N Source(1) Total number of listed firm years, 1999-2007 15,546 Worldscope(2) Less firm years with an SEO, 1999-2007 1,693 Dealogic(3) Total number of listed firm years with no SEO 13,853
(4) Less firm years with data items missing 4,723 Worldscope
(5) Final control sample 9,130
Note: Number of firm years with an SEO is smaller than the initial sample of SEOs sourced from Dealogic, since
multiple issues by a single issuer during a calendar year is treated as a single firm year with an SEO
Collection of the non-SEO control sample employed in the model (5) in micro determinant logit regression
SEO% Stdev Analyst GDP Sales Int. SENT M/B Mret, pre Mret, post
SEO% 1.00Stdev -0.42 1.00Analyst 0.08 -0.43 1.00GDP 0.06 -0.38 0.10 1.00Sales 0.36 -0.40 0.11 0.46 1.00Int. -0.16 0.05 -0.24 0.07 0.29 1.00SENT 0.05 -0.18 0.13 0.41 0.55 -0.03 1.00M/B 0.27 -0.61 0.25 0.43 0.55 0.29 0.29 1.00Mret, pre 0.47 -0.49 0.19 0.36 0.65 0.24 0.36 0.72 1.00Mret, post -0.17 -0.30 0.25 0.24 0.23 -0.09 -0.01 0.20 0.19 1.00
Correlation coefficients between macro-level variables

88
Appendix 3: Correlation coefficients: micro level determinants VOL is stdev of firms’ daily stock return measured from 250 trading days before the issue to 50 trading days before the issue. ANA is analyst coverage dummy variable gets value of 1 if the firm is followed by one or more analysts, and value of 0 otherwise. PRE and POST stock returns are calculated as the firm’s raw returns for the 12-month period prior to and following an issue. DIV is a dividend dummy variable that gets value of 1 if firm’s dividend payout ratio is 20 % or higher and value of 0 otherwise. R&D is a research and development dummy variable that gets value of 1 if the firm reports R&D expenditures and 0 otherwise. Slack (cash and cash equivalents / total assets), LEV (Debt / Total assets), INV (Capex / Total assets), ROA (EBITDA / Total assets), M / B, SIZE (LNsales) and TNG (PPE / Total assets) are measured at the previous year end. GRO (Sales growth) is measured in the issue year.
Correlation coefficients between issuer characteristics, equity and debt issuers
VOL ANA Slack LEV M / B INV GROStock PRE
Stock POST TNG DIV R&D ROA SIZE
VOL 1.00
ANA -0.09 1.00
Slack 0.08 -0.38 1.00
LEV 0.11 -0.08 0.14 1.00
M / B -0.12 0.09 -0.07 0.06 1.00
INV 0.06 0.26 -0.25 0.02 0.11 1.00
GRO 0.00 0.02 0.03 -0.07 0.03 0.31 1.00
Stock PRE 0.05 -0.05 0.03 -0.02 -0.10 -0.15 0.02 1.00
Stock POST 0.08 -0.28 0.34 0.60 -0.04 -0.16 -0.03 0.10 1.00
TNG 0.24 -0.19 0.06 -0.04 -0.21 -0.10 0.00 0.09 0.04 1.00
DIV 0.09 0.14 -0.14 -0.08 -0.02 0.13 -0.01 -0.03 -0.12 -0.05 1.00
R&D 0.21 -0.07 -0.03 0.09 -0.11 0.11 0.12 0.02 0.04 0.32 0.00 1.00
ROA 0.49 -0.15 0.18 -0.03 -0.23 -0.10 0.01 0.08 0.04 0.36 0.14 0.32 1.00
SIZE -0.14 0.20 -0.17 -0.04 0.08 0.11 -0.17 -0.15 -0.16 -0.33 0.14 -0.27 -0.18 1.00
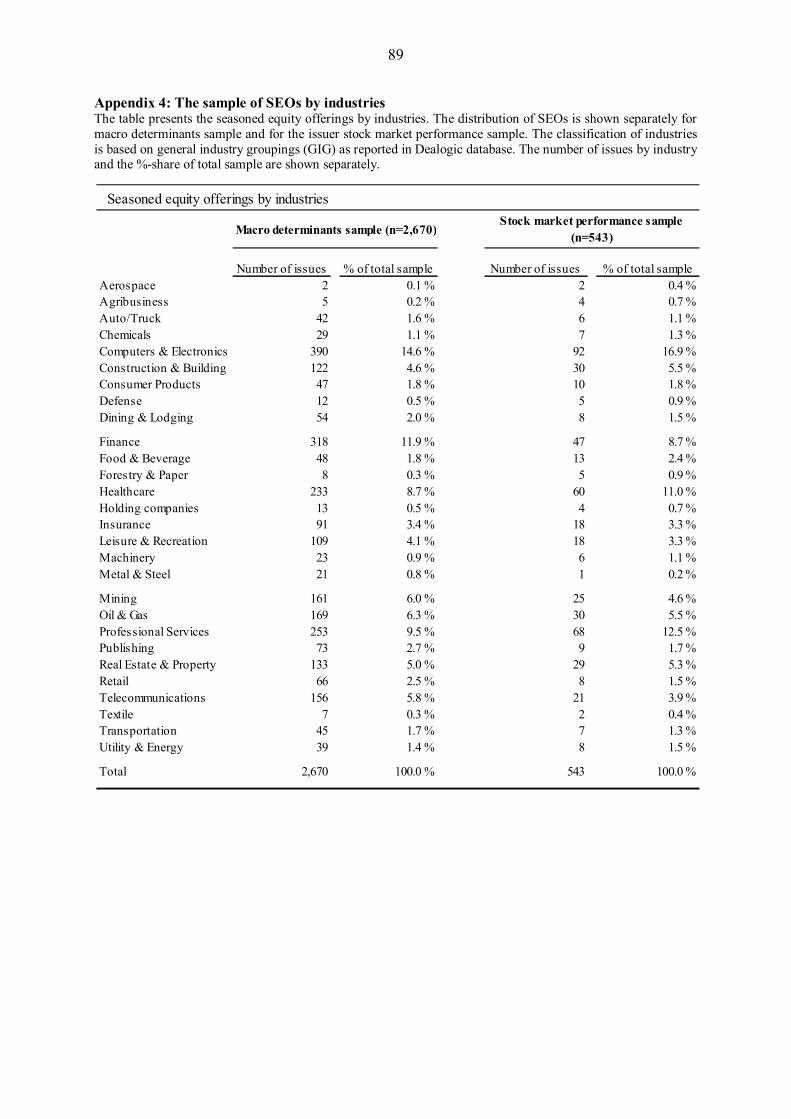
89
Appendix 4: The sample of SEOs by industries The table presents the seasoned equity offerings by industries. The distribution of SEOs is shown separately for macro determinants sample and for the issuer stock market performance sample. The classification of industries is based on general industry groupings (GIG) as reported in Dealogic database. The number of issues by industry and the %-share of total sample are shown separately.
Seasoned equity offerings by industries
Macro determinants sample (n=2,670)
Number of issues % of total sample Number of issues % of total sampleAerospace 2 0.1 % 2 0.4 %Agribusiness 5 0.2 % 4 0.7 %Auto/Truck 42 1.6 % 6 1.1 %Chemicals 29 1.1 % 7 1.3 %Computers & Electronics 390 14.6 % 92 16.9 %Construction & Building 122 4.6 % 30 5.5 %Consumer Products 47 1.8 % 10 1.8 %Defense 12 0.5 % 5 0.9 %Dining & Lodging 54 2.0 % 8 1.5 %
Finance 318 11.9 % 47 8.7 %Food & Beverage 48 1.8 % 13 2.4 %Forestry & Paper 8 0.3 % 5 0.9 %Healthcare 233 8.7 % 60 11.0 %Holding companies 13 0.5 % 4 0.7 %Insurance 91 3.4 % 18 3.3 %Leisure & Recreation 109 4.1 % 18 3.3 %Machinery 23 0.9 % 6 1.1 %Metal & Steel 21 0.8 % 1 0.2 %
Mining 161 6.0 % 25 4.6 %Oil & Gas 169 6.3 % 30 5.5 %Professional Services 253 9.5 % 68 12.5 %Publishing 73 2.7 % 9 1.7 %Real Estate & Property 133 5.0 % 29 5.3 %Retail 66 2.5 % 8 1.5 %Telecommunications 156 5.8 % 21 3.9 %Textile 7 0.3 % 2 0.4 %Transportation 45 1.7 % 7 1.3 %Utility & Energy 39 1.4 % 8 1.5 %
Total 2,670 100.0 % 543 100.0 %
Stock market performance sample (n=543)

90
Appendix 5: Definition of data items employed
Macro variablesInterest rate (3-month avg.) DS: UKESEFI3RGDP DS: UKOEXP03DConsumer sentiment index DS: UKCNFCONQSales growth-% All UK listed firms in the LSE, calculation same as belowMarket-to-book All UK listed firms in the LSE, calculation same as below
Micro variablesAnalyst coverage (dummy) IBH.NbrRecommendationsSell/Underperform/Hold/Buy/StrongbuyDebt / Total assets WS.TotalDebt / WS.TotalAssetsSales growth-% WS.Sales1YrGrowthR&D (dummy) WS.ResearchAndDevelomentExpenseCapex / Total assets WS.CapitalExpendituresCFStmt / WS.TotalAssetsMarket-to-book DS.CommonSharesOutstanding * DS.PriceClose / WS.TotalCommonEquityEBITDA / Total assets WS.EarningsBeforeIntTaxesAndDepr / WS.TotalAssetsDividend (dummy) WS.DividendPayoutFinancial Slack WS.CashAndCashequivalents / WS.TotalAssetsLnSales LN(WS.Sales)PPE / Total assets WS.PropertyPlantAndEquipment / WS.TotalAssetsIssue size Deal Value Euro (Dealogic) / DS.CommonSharesOutstanding * DS.PriceClose
DS = Datastream, WS=Worldscope, IBH=IBES History
Financial data items employed