macro tendenze a lungo terminemacro tendenze a …doc.assofond.it/congr2012/5-bottone.pdfmacro...
TRANSCRIPT

Page 1
Macro Tendenze a lungo termineMacro Tendenze a lungo termineGiacomo Bottone: Amministratore Delegato, Caterpillar Mec-Track

Page 2
Total Shareholder Return2003 - 2011
Rank Industry TSR(%)1 Metals/Minerals 45.92 Oil & Gas Production 25.33 Steel 24.94 Coal 22.75 Railroads 17.8
6 Chemicals: Agricultural 17.77 Internet Retail 16.68 Oilfield Services/Equipment 15.6
Right Industries at the Right Time…

Page 3
World GDP
‘10‘00‘90‘80 ‘20
World Trade
3.7%
6.4%
1.6% 4.4%
Electric Power Copper
Right Industries at the Right Time……and for a Long Time…
CAGR 2009 - 2015

Page 4
Da Mercati sviluppati a quelli in fase di sviluppo
Da Diesel a Gas & Carburanti provenienti da energie rinnovabili
Da Meccanico ad Elettronico
Da Hardware a Software
Da Prodotti a Soluzioni
Il Mondo cambia: Macro Tendenze

Page 5
One Stop Shopping – Industria Mineraria

Page 6
Competizione Industria Mineraria

Page 7
Opportunità di Crescita Macchine Miniera
Page 7
Page 8

Page 9
Modello di BusinessSemina – Crescita – Mietitura

Page 10
Panoramica - Power Systems
Turbine$4.4B
Industrial Power Systems$3.6B
Electric Power$4.3 B
Marine & Petroleum$3.4B
Large Power Systems$8.6B
Progress Rail$4.1B
• $29B di vendite nel 2011• 40% del giro d’affari Caterpillar

Page 11
Prodotti per Costruzione Edilizia
Skid Steer/Multi Terrain LoadersNA (Sanford, NC)
Mini Hydraulic ExcavatorUK (Leicester), Japan, China
Compact Wheel LoaderUK (Leicester)
TelehandlerAlliance with JLG
Backhoe LoaderUK (Leicester), Brazil, India
Small Wheel LoaderNA (Clayton, Aurora) Brazil, India,Gosselies, Japan
Small Track Type TractorJapan
• $3.9B di vendite nel 2011• 7 famiglie di prodotto• 70 modelli

Page 12
-10,00%
-5,00%
0,00%
5,00%
10,00%
15,00%
2012 2013 2014 2015 2016 2017
Previsione Tassi di Cambio a lungo termineLuglio 2012
(accumulated change vs.. USD in base year 2012)
KRW
GBP
JPY
EUR
INR
CNY
Nel lungo termineMonete Asiatichein rafforzamento

Page 13
Mercato Italiano Macchine Movimento Terra
6550
5204
34303175
2239
0
1000
2000
3000
4000
5000
6000
7000
2007 2008 2009 2010 2011
CGT CORE PRODUCTSEarthmoving-Escavation-Lwl-Q&CT-Tttlg-Wl+914–Tt
Total Industry
La riduzione del mercato ha un effetto doppiamente negativo sulbusiness support del domani

Page 14
Situazione mercato/economica 2012/2013/2014Situazione mercato/economica 2012/2013/2014

Page 15
Previsione Cina – Machine Movimento Terra

Page 16 16
Commodity Prices and Costs
Copper ($/lb) 2.00 3.74 87%
Gold ($/oz) 750 1,772 136%
Iron Ore ($/ton) 60 108 80%
Thermal Coal ($/ton) 85 87 2%
* Cash costs for 90% of production.
Source: Brook Hunt, Anglo American, AME and Haver Analytics.
Cash Cost * Current Price % Differential
Commodity Prices vs. Cash Costs of Production

Page 17 17
Tendenze Macroeconomiche 2012/2013
L’economia di molti paesi rallenta, ma l’unica area in recessioneè l’Europa
Politiche monetarie espansionistiche iniziano ad accellerare inmolti paesi; necessario monitoraggio degli effetti sull’economia.
Settore Macchine Movimento Terra debole, con portafoglioordini in riduzione
Investimenti nelle miniere posticipati

Page 18
Mercato Mondiale 2011Macchine Movimento Terra
IndustriaMondiale
Europe AME CIS NordAmerica
SudAmerica
China Resto Asia
Totale 1.022.240 136.207 55.990 43.845 145.133 55.842 454.940 130.283
Building Constr. 398.443 96.876 19.496 14.039 104.326 25.979 44.000 93.727
EARTHMOVING 306.081 8.017 14.594 14.571 13.120 12.943 230.210 12.626
EXCAVATION 245.606 22.514 13.782 8.997 17.751 11.163 159.300 12.099
PAVING 51.991 6.927 5.135 3.188 5.600 3.745 20.770 6.626
MINING 19.684 1.772 2.956 3.028 4.115 1.948 660 5.205
% of Total 13% 5% 4% 14% 5% 45% 13%

Page 19
50,000
100,000
150,000
200,000
250,000
300,000
2003 2004 2005 2006 2007 2008 2009 2010 2011 2012 2013 2014
Europe Machine Industry Forecast
2012 -6.1%2013 -6.0%2014 +10%
2012
12m Roll3m SAAR Forecasts
20132014

Page 20
10,000
20,000
30,000
40,000
50,000
60,000
70,000
80,000
2003 2004 2005 2006 2007 2008 2009 2010 2011 2012 2013 2014
AME Machine Industry Forecast
2012 +13.5%2013 +4.2%2014 +10%
2012
12m Roll3m SAAR Forecasts
2013
2014

Page 21
0
10,000
20,000
30,000
40,000
50,000
60,000
70,000
2003 2004 2005 2006 2007 2008 2009 2010 2011 2012 2013 2014
CIS Machine Industry Forecast
2012 +11.8%2013 +0.5%2014 +5.2%
2012
12m Roll3m SAAR Forecasts
20132014

Page 22
0
50,000
100,000
150,000
200,000
250,000
300,000
2003 2004 2005 2006 2007 2008 2009 2010 2011 2012 2013 2014
12m Roll 3m SAAR Forecast
2014
2012
2013
2012 26.6%2013 5.4%2014 16.6%
Americas North Industry Forecast

Page 23 23
0
10,000
20,000
30,000
40,000
50,000
60,000
70,000
80,000
90,000
2003 2004 2005 2006 2007 2008 2009 2010 2011 2012 2013 2014
2012
3m SAAR Forecasts
2013
2014
South America Machine Industry Forecast
2012 7%
2013 7%
2014 13%
Page 24 2424
0
100,000
200,000
300,000
400,000
500,000
600,000
2003 2004 2005 2006 2007 2008 2009 2010 2011 2012 2013 2014
24
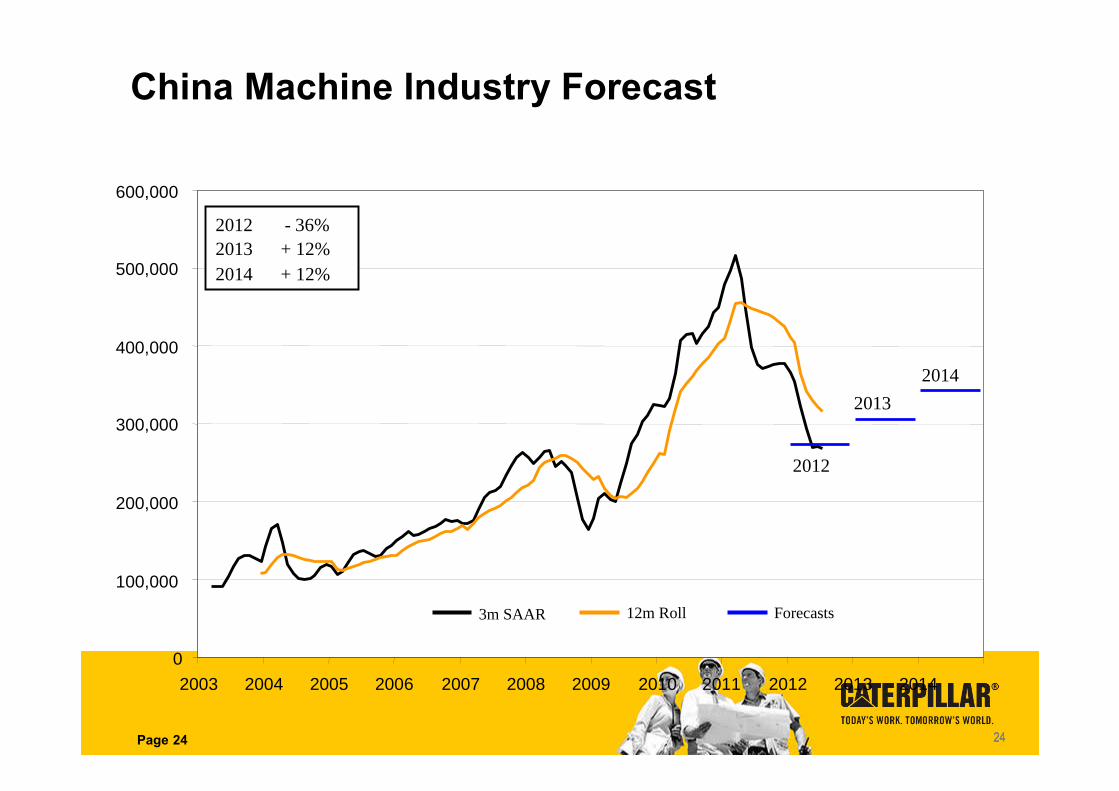
China Machine Industry Forecast
2012 - 36%2013 + 12%2014 + 12%
2012
12m Roll3m SAAR Forecasts
20132014
Page 25 25
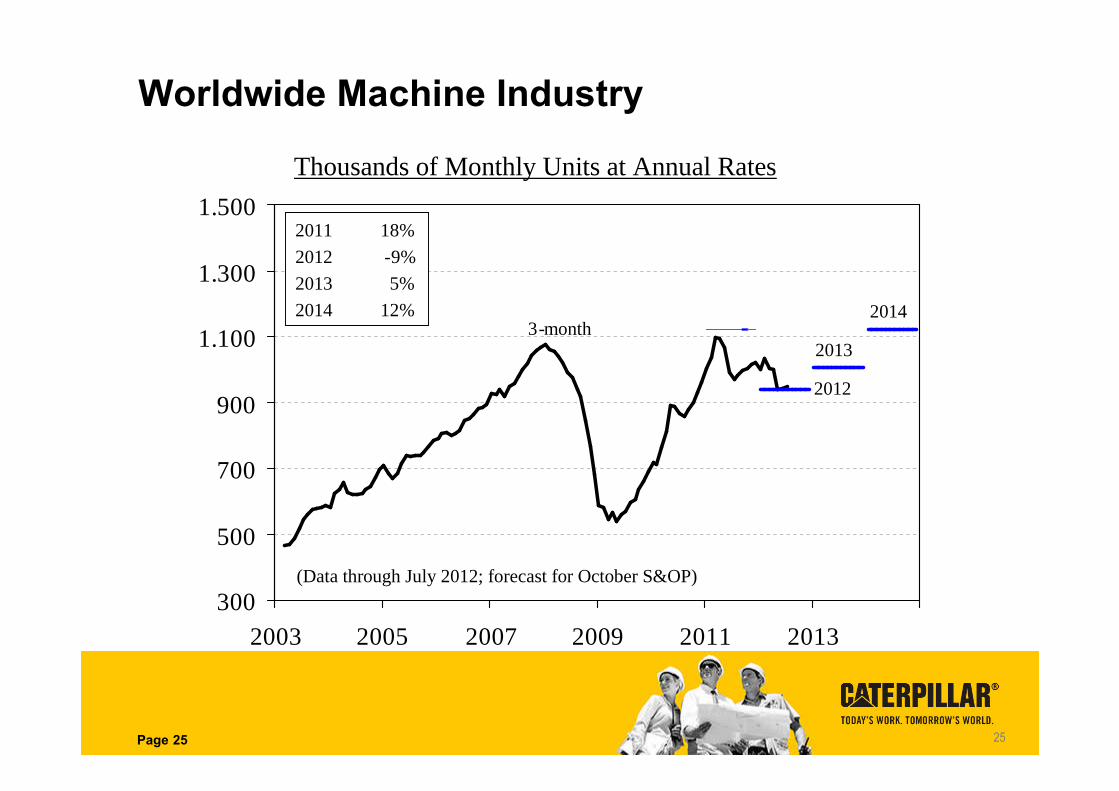
Worldwide Machine Industry
Thousands of Monthly Units at Annual Rates
300
500
700
900
1.100
1.300
1.500
2003 2005 2007 2009 2011 2013
3-month
2012
(Data through July 2012; forecast for October S&OP)
2011 18%2012 -9%2013 5%2014 12%
2013
2014

Page 26
http://www.youtube.com/watch?v=2g4Sq0rC5-s&feature=related
https://videoatwork.cat.com/viewerportal/cat/home.vp#programId=esc_program%3A13355
Mining equipment
Caterpillar