macrobenthos and anthropogenic stressors - the · pdf filemacrobenthos and anthropogenic...
TRANSCRIPT
Ind. J. Sci. Res. and Tech. 2015 3(5):62-71/Mumthas & Miranda ISSN:-2321-9262 (Online)
Online Available at: http://www.indjsrt.com
Research Article
62
MACROBENTHOS AND ANTHROPOGENIC STRESSORS - THE NEED FOR
BIOMONITORING ALONG THECOAST OF KERALA INDIA
*Y. Mumthas and M. T. P. Miranda
Post Graduate and Research Department of Zoology, Fatima Mata National College, Kollam 691001, Kerala, India
*Author for Correspondence
ABSTRACT
This paper explores the interaction between anthropogenic stressors (domestic sewage, oil spills, and industrial
effluents) onmacrobenthic assemblages of three impacted sites viz., Varkala, Neendakara and Chavara-Titanium
along the coast of Kerala. Total macro faunal abundance (No/m2) ranged from130 to175 in the impacted sites
representing 58 taxa. Biological indices are used for estimating species diversity (H’), richness (R’), dominance (λ’),
and evenness (J’).Pearson correlation revealed significant correlation between faunal abundance and environmental
variables. High load of organic pollutants at Varkala and Neendakara is revealed by the presence of Nereis capensis,
Scololepis squamata, and S. ruba. The study warrants the need for stringent biomonitoring of the coastal waters of
Kerala.
Key Words: Macrobenthos, Kerala Coast, Anthropogenic Stressor, Sediment and Bottom Water
INTRODUCTION
Marine and coastal environments are among the most ecologically and socio economically important habitats on
earth. However, a variety of anthropogenic stressors may interact to produce combined impacts on biodiversity and
ecosystem functioning which in turn will have profound implications for marine ecosystems and the economic and
social systems that depend upon them. India has a coastline of about 7,500km and nearly 250 million people live
within a distance of 50 km from the coast. With increasing realisation of the economic value and the ecosystem
services that are derived from the coastal areas, and owing to increasing human population, urbanization and
accelerated developmental activities, coastal areas are receiving more attention and importance in recent years.
Many of these anthropogenic activities have put tremendous pressure on the fragile coastal environment. Structural
changes in marine benthic communities caused by different disturbances seem to be rather predictable and may be
used to assess the overall health of oceans and estuaries (Frouin, 2000). Hence, changes in benthic community
structure are widely used in pollution assessment studies (Warwick and Clarke, 1993).
The present paper explores the relationship between benthic dynamics and anthropogenic stressors of three
environmentally disturbed sites along the coast of Kerala. A parallel study as control was also undertaken at a site
which was presumed to be near pristine as it is post – tsunamic. An attempt has also been made to correlate the
temporal and spatial distribution of macrobenthic invertebrate communities with environmental variables.
MATERIALS AND METHODS
Study Areas
Site1 – Varkala (8º 43’ N latitude & 76 º 43’ E longitude): characterized by tourist influx and a religious pilgrimage
centre resulting in domestic and organic pollution and massive foot traffic.
Site 2 – Neendakara (8º 56’ N latitude & 76 º 32’ E longitude): characterized by oil pollution since it is a fishing
harbour and port with large scale motor boat / trawler traffic.
Site 3 – Chavara- Titanium (9º 07’ N latitude & 76 º 31’ 55 E longitude): characterized by inorganic pollution of
heavy metals, trace metals, polycyclic aromatic hydrocarbons and organochlorins due to discharge of effluents from
KMML Titanium dioxide industrial factory.
Site 4 – Alappad (9º 05’ N latitude & 76 º 29’ E longitude): control site since it is presumed to be near pristine being
post tsunami and lacking any industrial / agricultural enterprise in the vicinity.
Sampling Protocol
Sampling was carried out during pre-monsoon, and post-monsoon of the year 2013-14. Samples were collected
using a Van Veen grab having a mouth area of 0.1 m2
along 5 transects from the near shore region. The triplicate
samples were passed through a 0.5 mm mesh sieve and the benthic fauna retained on the sieve were fixed in neutral
Formalin Rose Bengal mixture and stored in 70% ethanol for laboratory analysis and identification. Sediment and
bottom- water samples were also collected for analysis using the grab and Nessler’s bottom water sampler.

Ind. J. Sci. Res. and Tech. 2015 3(5):62-71/Mumthas & Miranda ISSN:-2321-9262 (Online)
Online Available at: http://www.indjsrt.com
Research Article
63
Laboratory Analysis
Analysis of Fauna: The preserved fauna were identified to major taxonomic groups using appropriate keys
(Olomukoro, 1996). The taxonomic composition and relative abundance was determined.
Hydrological Parameters
Temperature: recorded with a thermometer.
PH and Salinity: Measured in the field it using a hand held refractometer and digital P
H pen.
Dissolved Oxygen (DO) and Total Dissolved Solids (TDS) by water-analyser (Systronics – model 371).
Sedimentological Parameters
Sediment Texture: Determined by Pipette Analysis (Krumbein and John, 1938).
Organic Carbon: Estimated by wet oxidation method (Wakeel and Riley, 1957).
Statistical Analysis
Biological indices such as Shannon diversity index (H’), Simpson index (Lambda’), Pie Lou’s evenness index (J’)
and Margalef’s richness(R) were calculated following http://www.alyoung.com/labs/biodiversity_calculator.html
online sites. Pearson’s rank correlation was used to analyse the relation between environmental variables and
benthos. The statistical analyses were conducted by SPSS (Ver.20).
RESULTS AND DISCUSSION
Macrobenthic diversity
Benthic macrofauna found at the study sites were represented by four groups viz., Gastropods, Bivalves, Nematodes
and Polychaetes which totaled 607 individuals representing 58 taxa (Table 1). Molluscs (352 No/m2) were the most
dominant group, followed by Polychaetes (138 No/m2), Bivalves (109 No/m
2) and Nematodes (8No/m
2). The pattern
of distribution of benthos at the four sites varied as per the ecological imbalances, due to various human
interferences. The temporal and spatial distribution of benthos at the four sites are in the order S1: G> P>B, S2:
G>B>P>N, S3:G≥P>B and S4: G>P>B>N.
Physico chemical parameters
The physico chemical parameters recorded in this study are PH, temperature, salinity, dissolved oxygen, TDS,
sediment organic carbon and sediment texture.
Temperature: Temperature is an important ecological factor, which influence the distribution of benthic organisms
and it regulates various abiotic and biotic activities of an ecosystem. The maximum mean temperature recorded at
site 3 (31.2 OC ±1.4) was during post monsoon and minimum was at site 4 (28.9
OC ±1.2). The results reveal that
temperature is more or less similar at the four sites (Fig. 1).
PH
: The seasonal mean variation in PH is depicted in (Fig. 2) The P
H ranged from 5.2 to 7.9. Maximum mean P
H
was recorded at site 1 (7.9 ±0.21) and minimum at site 2(5.2±0.42).The PH at site 2 was noticeably acidic throughout
the study period while at site 4, it was neutral.
Dissolved oxygen: Saltwater has limited capacity (saturation level) to hold O2. The amount of O2 which saltwater
can contain depends on temperature and salinity level of water. DO is a sensitive indicator of biological and
chemical process. The dissolved oxygen is found ranging from 3.3mg/L to 10.1 mg/L. The seasonal mean variation
of dissolved oxygen is found maximum at site 4 (10.1 ± 0.64) and minimum at site1 (3.3±2.4).
Salinity: Seawater is not uniformly saline throughout the world. Where mixing occurs with fresh water runoff from
river mouths or near melting glaciers, seawater can be substantially less saline, Maximum mean value of salinity
was recorded at site1 (33 ppt ±0.91) and minimum at site 4 (29ppt ±0.63).The seasonal mean variation of salinity is
shown in Fig 1.
Figure 1: Seasonal variation of Physico chemical parameters along the study sites

Ind. J. Sci. Res. and Tech. 2015 3(5):62-71/Mumthas & Miranda ISSN:-2321-9262 (Online)
Online Available at: http://www.indjsrt.com
Research Article
64

Ind. J. Sci. Res. and Tech. 2015 3(5):62-71/Mumthas & Miranda ISSN:-2321-9262 (Online)
Online Available at: http://www.indjsrt.com
Research Article
65
Total Dissolved Solids: TDS is often monitored in order to create a water quality environment favourable for
organism productivity. Highest productivity and economic returns are achieved by mimicking the TDS and pH
levels of each species' native environment. The seasonal variation of TDS at the study sites are shown in Fig 1,
which ranges from 10.5ppt to 16.2ppt. Maximum mean value of TDS is recorded at site 1 (16.2 ppt ±2.4) and
minimum at site 2 (10.5 ppt ±3.6).
Total Organic Carbon: An increase in organic carbon may result to an increase in levels of metals in marine
sediments. It influences the occurrence and distribution of benthic organisms (Ansari et al., 1996). Mean percent
value of organic carbon content is recorded at site 3 (60% ±0.10) during post monsoon and minimum at site 4,
(7%±0.64) during premonsoon.
Textural Analysis: Grain size analysis is one of the important and widely used sedimentological tools to unravel
hydrodynamic conditions of aquatic environments. The textural characteristics of sediments play a crucial role in
distribution and concentration of carbon, nitrogen, phosphorous, and bio-organisms (Gray, 1974).The seasonal mean
variations in sediment texture are shown in Fig 2.The maximum mean values of sand were recorded at site 3
(8.22±0.56) during post monsoon, silt at site1 (3.2±0.60) during premonsoon and clay at site 4,(0.92±1.23) during
post monsoon. The minimum mean values of sand was recorded at site 4, (6.08±1.11), silt at site 3 (1.73±0.52) and
clay at site 2 (0.27±0.32) during post-monsoon. The seasonal variation of sediment characteristics were shown in fig
2.
Figure 2: Seasonal variation of sedimentological parameters along the study sites
Among Gastropods, Architectonicaperdix was found exclusively at Varkala (site 1) and Chavara-Titanium (site 3),
during post monsoon, whereas Babylonia spirata, was found at Varkala during pre-monsoon. Among polychaetes,
Cirratulus africanus, Nephtys dibranchis, Phyllodoce castanea. Scololepis squamata, S.ruba, Nereis capensis and
Chaetopterus sp were found at site 3 during post monsoon while onlyCeratonereissp., was found at site 2
(Neendakara) during post and pre- monsoon and site 4 (Alappad) during post monsoon. S. squamata is the least
abundant polychaete species which may have been negatively affected by increasing industrial pollution at Site 3.
Studies carried out on this species reveal that it has been negatively affected by increased sewage and industrial
pollution(Devassyet al., 1987).Cirratulus africans was present at site 2 during post monsoon and site 3 during post
and pre-monsoon. Nereis capensis were present only at site 1 and Site 3 during pre and post monsoon.Among
bivalves Anadarasp., Anodontiasp., Papilionissp., Semele rdiata, and Cardiumsp were found site 1 and Site 2 during
Pre and post monsoon. These have an affinity for increasing salinity and this may be the reason for their presence at
Neendakara and Varkala.
The results of correlation analysis (Tables 2- 6), indicates significance at the 0.01 level (two-tailed) between
environmental parameters and benthos. At Site 1, gastropods showed positive correlation with TDS, OC and sand
(P<0.01), negative correlation with temperature, DO, salinity and PH
(P<0.01).Bivalves showed a negative
correlation with TDS, OC and sand (P<0.01) and positive correlation with DO, salinity, PH,
Silt and clay. TDS, OC
and sand showed positive correlation with Polychaete abundance (P<0.01) and DO, salinity.PH, Silt and clay
indicate negative correlation (P<0.01).
At site 2, gastropods showed positive correlation with temperature, pH, Dissolved oxygen and clay (P<0.01) and
negative correlation with salinity, TDS, OC and Clay. Bivalves exhibited positive correlation with salinity, TDS, OC
and Clay (P<0.01) and positive correlation with temperature, pH, Dissolved oxygen and clay (P<0.01). Temperature,

Ind. J. Sci. Res. and Tech. 2015 3(5):62-71/Mumthas & Miranda ISSN:-2321-9262 (Online)
Online Available at: http://www.indjsrt.com
Research Article
66
PH,
DO sand, Silt and Clay shows negative correlation with Polychaete abundance (P<0.01).TDS and OC indicate
positive correlation (P<0.01).

Ind. J. Sci. Res. and Tech. 2015 3(5):62-71/Mumthas & Miranda ISSN:-2321-9262 (Online)
Online Available at: http://www.indjsrt.com
Research Article
67
Ind. J. Sci. Res. and Tech. 2015 3(5):62-71/Mumthas & Miranda ISSN:-2321-9262 (Online)
Online Available at: http://www.indjsrt.com
Research Article
68

Ind. J. Sci. Res. and Tech. 2015 3(5):62-71/Mumthas & Miranda ISSN:-2321-9262 (Online)
Online Available at: http://www.indjsrt.com
Research Article
69

Ind. J. Sci. Res. and Tech. 2015 3(5):62-71/Mumthas & Miranda ISSN:-2321-9262 (Online)
Online Available at: http://www.indjsrt.com
Research Article
70
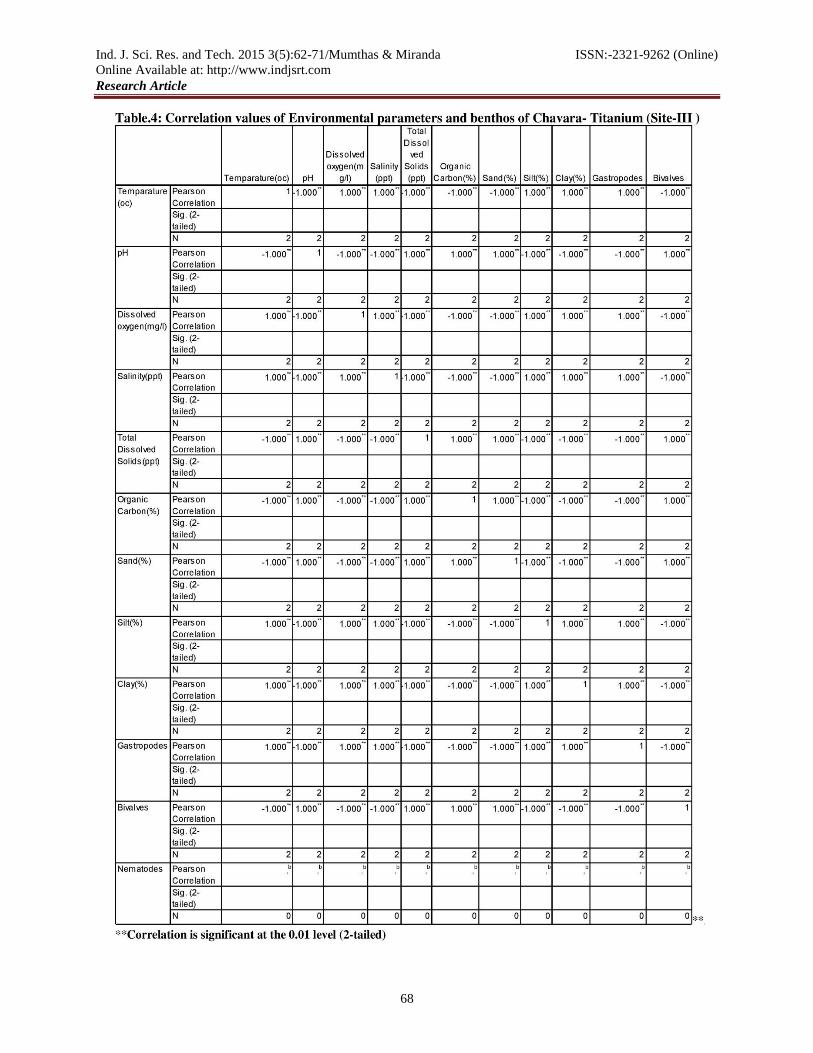
At site 3, gastropods showed positive correlation with temperature, DO, salinity (P<0.01) and negative correlation
with, PH, TDS, OC, Silt and clay (P<0.01).Bivalves showed a negative correlation with temperature, DO, salinity,
silt and Clay (P<0.01). Positive correlation with, PH,
TDS, OC and sand (P<0.01).Temperature, PH, TDS
and sand
shows negative correlation with Polychaete abundance (P<0.01).Salinity, DO, OC, Silt and clay indicate positive
correlation (P<0.01).
At site 4, gastropods showed positive correlation with temperature, DO, salinity ,PH
TDS, OC, sand and Silt
(P<0.01) and negative correlation with Clay (P<0.01). Bivalves showed a negative correlation with Clay (P<0.01)
positive correlation with temperature, DO, salinity, PH
TDS, OC, sand and Silt (P<0.01). Nematodes showed
negative correlation with temperature, DO, salinity, PH
,TDS, OC, sand and Silt (P<0.01) and positive correlation
with Clay (P<0.01). Temperature, PH, DO, and TDS shows positive correlation with Polychaete abundance (P<0.01)
and salinity, OC and clay indicate negative correlation (P<0.01).
Diversity Indices of Macro fauna
Diversity indices for macro benthic fauna are given in table 2. Shannon-Wiener index showed its higher value at
Site 2 (H= 3.148) and lower value at site 4 (H=2.495). Simpson Index is greater at site 4 (Lambda’=0.1224) and

Ind. J. Sci. Res. and Tech. 2015 3(5):62-71/Mumthas & Miranda ISSN:-2321-9262 (Online)
Online Available at: http://www.indjsrt.com
Research Article
71
lesser at site 3 (Lambda’=0.0483). Margalef’s index showed its higher value at site 2 (R= 4.9363) and lower value
at site 3 (R=4.066) and Pie Lou’s evenness values were greater at site 2 (J=0.9552) and low at site 4 (J=0.804).
CONCLUSION
Shannon –Wiener index is a sensitive indicator of pollution and its value do not fluctuate widely. Its variation range
in the present study is 2.495 to 3.148. Factors such as area, altitude, productivity, landscape heterogeneity,
succession status and disturbance have been reported to play roles in determining species richness (Pysek et al.,
2002a; Barnes, 2010).In the present study, Site 2 recorded maximum species diversity in spite of eutrophication. The
plankton richness found here may have created a conductive environment for the macrobenthos. Benthic
communities are dynamic and the presence or absence of species may change as the environment varies adding great
complexity to any attempts at recognition of species able to act robust indicators of low diversity. The study also
recommends biomonitoring of the coastal waters of Kerala.
ACKNOWLEDGEMENT
We express our sincere thanks to the management and Principal of Fatima Mata National College, Kollam, Kerala
for providing facilities to carry out this work. The first author is thankful to the University of Kerala for financial
assistance.
REFERENCES
Ansari ZA, Ingole BS &Parulekar AH (1996). Benthos of the EEZ of India. In: Qasim, S.Z and Roonwal (Eds.),
India's Exclusive Economic Zone G.S. Omega Scientific Publishers, New Delhi, 74-86.
Devassy VP, Bhatrarhiri PMA &Qasim SZ (1978). Trichodesmium Phenomenon. Indian Journal of Marine
Sciences, 73 168-186.
Frouin P(2000). Effects of anthropogenic disturbance of tropical soft bottom benthic communities. Marine Ecology
Progress Series, 194: 39-53.
Gray JS (1974). Animal-sediment relationships. Oceanography and Marine Biology - An Annual Review,12 223-
261.
Karl Pearson (1895). Notes on regression and inheritance in the case of two parents. Proceedings of the Royal
Society of London,58 240-242.
Krumbein WC&Pettijohn FJ (1938). Manual of sedimentary petrography. Appleton - Century Crafts, New York
549.
Margalef R (1958). Temporal succession and spatial heterogeneity in phytoplankton. In: Perspectives in Marine
biology, Buzzati-Traverso (ed.), Univ. Calif. Press, Berkeley, 323-347.
Olomukoro JO (1996). Macrobenthic fauna of Warri River in Delta State. Nigeria. Ph.D. Thesis, University of
Benin, Nigeria.
Olomukoro JO &Azubuike CN(2009).Heavy Metals and Macroinvertebrate Communities in Bottom Sediment of
Ekpan Creek, Warri, Nigeria. Jordan Journal of Biological Science, 2 1-8.
PennakRW(1978). Freshwater Invertebrates of the United States. Second edition New York.
Pielou EC (1969). An introduction to mathematical ecology. New York: Wiley.cited in Magurran, A. E., 2004,
measuring biological diversity, Blackwell Publishing: Oxford, UK256.
Pyšek P (2009).Fallopia japonica (Houtt.) RonseDecr., Japanese knotweed (Polygonaceae, Magnoliophyta). In:
DAISIE (Eds) Handbook of alien species in Europe. Springer, Berlin348.
Simpson EH(1949). Measurement of diversity. Nature,163 688.
Shannon CE &Weaver W (1948). A mathematical theory of communication. The Bell System Technical
Journal,27 379-423 &623-656.
Wakeel ESK & Riley JP (1956). The determination of organic carbon in marine muds. J. du
Conseilpermamentinti.Pourl. Exploration de demer, 22 180-183.
Warwick RM & Clarke KR(2009). Changes in Community Structure of the soft bottom benthic macrofauna in
relation to oil drilling activity at the Ekofisk platform.Journal of the Marine Biological Association of the UK,18 86-
91.
Wilber DH &Clarke DG(1998). Estimating secondary production and benthic consumption in monitoring studies:
A case study of the impacts of dredged material disposal in Galveston Bay, Texas. Estuaries, 21(2) 230-245.