macroeconomic and budgetary review
TRANSCRIPT

Main macroeconomic indicators
Gross domestic product (GDP)
current prices (mln euro and growth, %)
constant prices (mln euro and growth, %)
GDP deflator (y-o-y), %
Consumer price index (y-o-y), %
Employment (thsds and growth rate, %)
Jobseeker rate (annual average), %
Exports of goods and services
current prices (mln euro and growth, %)
constant prices (mln euro and growth, %)
Imports of goods and services, mln euro
current prices (mln euro and growth, %)
constant prices (mln euro and growth, %)
* GDP for 2019 according to CSB data published on 28/02/2020
** Projections developed in February 2020 for the preparation of Latvia's Stability Programme 2020-2023
19'I II III VI
Latvia 3.1 2.0 2.9 1.0
Lithuania 4.2 3.8 3.8 3.8
Estonia 4.8 3.9 4.8 3.9
Source: CSP, Eurostat, Ministry of Finance of the Republic of Latvia
In 2019, the fastest growing sectors in the economy of Latvia were agriculture as well as several service sectors. Value added of trade
increased by 4.1% determined by rising income and falling unemployment. Thus, private consumption expanded by 2.9% indicating that in
2019 Latvia's economic growth was stimulated by domestic demand. At the same time exports of goods and services increased slower - by
2.0%, determined by global growth slowdown and weakening of external demand. Thus, growth rates of export-oriented sectors last year
were lower - manufacturing growth constituted 2.1%, while contraction of transport sector was determined by significantly lower freight
volumes in Latvia's ports. Transit flows were negatively affected by Russia's policy to re-direct freight flows to its Baltic Sea ports and falling
global demand for coal from Russia. In 2019, shrinking of non-resident serving bank business and financial services exports determined fall
of financial and insurance services' value added (-8.8%). In 2019, imports of goods and services increased stronger than exports - by 2.3%.
1
18426 3.0 3.7 3.0
GDP breakdownGDP growth by sectoral breakdown and from expenditure side
in 2019 compared to 2018, %
2.1
2.5 2.63.4
4.4
17387
-0.1-0.1
18232 3.5 5.3 4.7 3.9
In the fourth quarter of 2019, Latvia's economic growth slowed down to 1% which was the lowest quarterly economic growth rate during the last
year and the weakest growth since Q3 2016. Thus, in 2019 overall Latvia's gross domestic product increased by 2.2%. Growth weakening at the end
of 2019 was determined by negative developments in several sectors, including, transport, financial services and manufacturing. Last year, weak
external environment and global economic slowdown determined worsening of foreign demand which affected Latvia's economic performance.
Moreover, higher economic growth was hampered by several domestic factors, for example, unfavourable weather conditions for electricity
production at the beginning of the year and decline of non-resident serving bank business.
GDP growth of the Baltic states, % y-o-y
910
6.3 6.4 5.8 5.7
Structure of value-added in 2018, %
January 2020
MACROECONOMIC AND BUDGETARY REVIEW
2.7 2.3 2.22.6
2.8 2.3 2.0 2.0
6.2
3.5
GDPGDP growth, constant prices, %
-0.1 -0.1
5.1 4.630476
27497 2.2 2.8
Forecasts**
Average monthly gross wage (euro and
growth at current prices, %)1076 6.0 5.5 5.0 5.0
18257 3.5 4.8 4.7 3.9
2019* 2020
5.0
2021
2.4
5.3
2.8
2.4
2022 2023
3.1
2.02.9
1.0
4.1
2.31.9
3.3
1.8
3.84.3
-4
-2
0
2
4
6
8
I II III IV I II III IV I II III IV I II III IV I II III IV I II III IV I II III VI I II III IV
2012 2013 2014 2015 2016 2017 2018 2019
y-o-y growth annual growth
* GDP flash estimate
Agriculture4% Industry
16%
Construction7%
Transport9%Trade
15%
Other private services31%
Public services18%
4.9
2.0
-1.0
4.6
-4.0
2.9
1.0
12.8
2.5
-5 0 5 10 15
Other services
IT and communication services
Financial services and real estate
Trade and accommodation
Transportation and storage
Construction
Industrial production
Agriculture
Value added
2.3
2.0
3.1
2.6
2.9
2.2
0 1 2 3 4
Imports
Exports
Investment
Government cons.
Private cons.
GDP
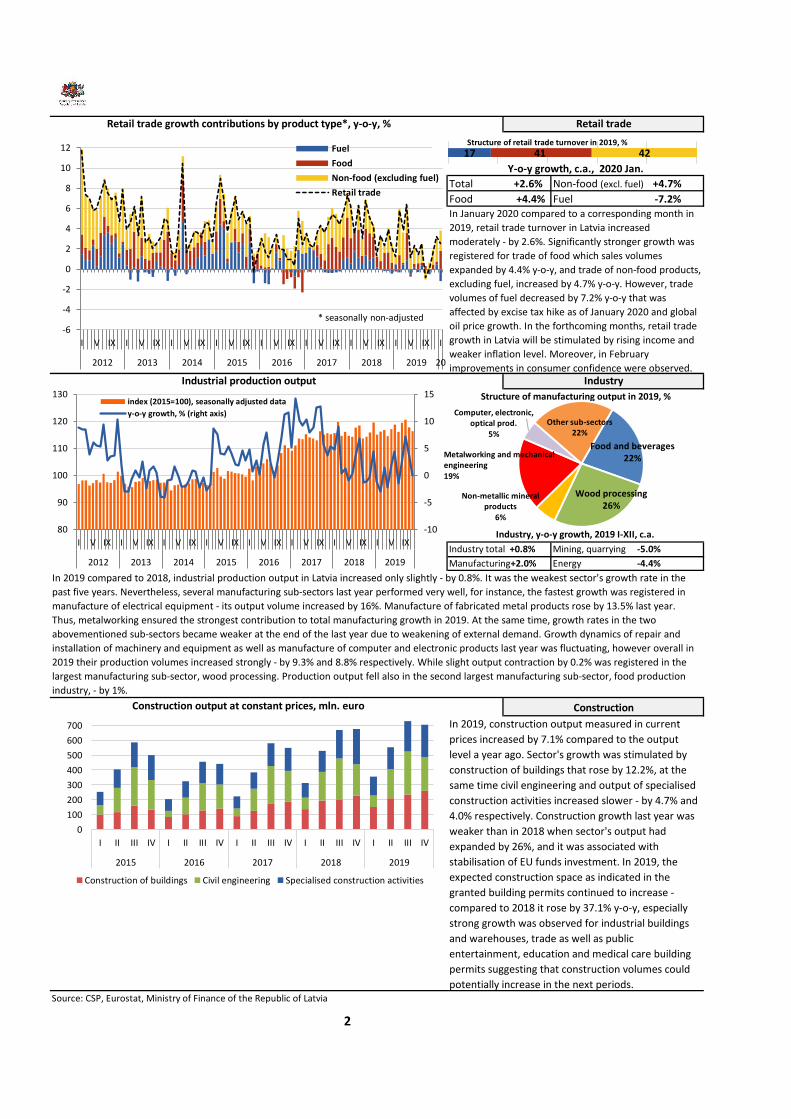
Total +2.6% Non-food (excl. fuel) +4.7%
Food +4.4% Fuel -7.2%
Source: CSP, Eurostat, Ministry of Finance of the Republic of Latvia
Construction output at constant prices, mln. euro Construction
In 2019, construction output measured in current
prices increased by 7.1% compared to the output
level a year ago. Sector's growth was stimulated by
construction of buildings that rose by 12.2%, at the
same time civil engineering and output of specialised
construction activities increased slower - by 4.7% and
4.0% respectively. Construction growth last year was
weaker than in 2018 when sector's output had
expanded by 26%, and it was associated with
stabilisation of EU funds investment. In 2019, the
expected construction space as indicated in the
granted building permits continued to increase -
compared to 2018 it rose by 37.1% y-o-y, especially
strong growth was observed for industrial buildings
and warehouses, trade as well as public
entertainment, education and medical care building
permits suggesting that construction volumes could
potentially increase in the next periods.
2
Retail trade growth contributions by product type*, y-o-y, %
Industrial production output
In 2019 compared to 2018, industrial production output in Latvia increased only slightly - by 0.8%. It was the weakest sector's growth rate in the
past five years. Nevertheless, several manufacturing sub-sectors last year performed very well, for instance, the fastest growth was registered in
manufacture of electrical equipment - its output volume increased by 16%. Manufacture of fabricated metal products rose by 13.5% last year.
Thus, metalworking ensured the strongest contribution to total manufacturing growth in 2019. At the same time, growth rates in the two
abovementioned sub-sectors became weaker at the end of the last year due to weakening of external demand. Growth dynamics of repair and
installation of machinery and equipment as well as manufacture of computer and electronic products last year was fluctuating, however overall in
2019 their production volumes increased strongly - by 9.3% and 8.8% respectively. While slight output contraction by 0.2% was registered in the
largest manufacturing sub-sector, wood processing. Production output fell also in the second largest manufacturing sub-sector, food production
industry, - by 1%.
Manufacturing+2.0%
Y-o-y growth, c.a., 2020 Jan.
Industry, y-o-y growth, 2019 I-XII, c.a.
Industry total +0.8% Mining, quarrying -5.0%
Structure of manufacturing output in 2019, %
Retail trade
Industry
Energy -4.4%
In January 2020 compared to a corresponding month in
2019, retail trade turnover in Latvia increased
moderately - by 2.6%. Significantly stronger growth was
registered for trade of food which sales volumes
expanded by 4.4% y-o-y, and trade of non-food products,
excluding fuel, increased by 4.7% y-o-y. However, trade
volumes of fuel decreased by 7.2% y-o-y that was
affected by excise tax hike as of January 2020 and global
oil price growth. In the forthcoming months, retail trade
growth in Latvia will be stimulated by rising income and
weaker inflation level. Moreover, in February
improvements in consumer confidence were observed.
-6
-4
-2
0
2
4
6
8
10
12
I V IX I V IX I V IX I V IX I V IX I V IX I V IX I V IX I
2012 2013 2014 2015 2016 2017 2018 2019 20
Fuel
Food
Non-food (excluding fuel)
Retail trade
* seasonally non-adjusted
-10
-5
0
5
10
15
80
90
100
110
120
130
I V IX I V IX I V IX I V IX I V IX I V IX I V IX I V IX
2012 2013 2014 2015 2016 2017 2018 2019
index (2015=100), seasonally adjusted data
y-o-y growth, % (right axis)
Food and beverages22%
Wood processing26%
Non-metallic mineral products
6%
Metalworking and mechanical engineering19%
Computer, electronic, optical prod.
5%
Other sub-sectors22%
17 41 42Structure of retail trade turnover in 2019, %
0
100
200
300
400
500
600
700
I II III IV I II III IV I II III IV I II III IV I II III IV
2015 2016 2017 2018 2019
Construction of buildings Civil engineering Specialised construction activities

Source: CSP, Eurostat, Ministry of Finance of the Republic of Latvia
Inflation breakdown by origin, y-o-y, %
In January 2020 compared to January of 2019, consumer
prices in Latvia increased by 2.2%, thus inflation
remained close to the level observed at the end of the
last year - slightly above 2%. The largest contribution to
consumer price growth in January was provided by price
growth for food by 3.4% y-o-y, especially strong price
increase was registered for pork, fresh fruits and sugar.
Compared to January of 2019, price for fuel was by 8.8%
higher this year which was affected by excise tax
increase for fuel as of January 2020 as well as higher oil
prices in the global markets. Prices for alcoholic
beverages increased by 2.4% y-o-y in January that was
determined by excise tax hike in March 2019. Price
growth for tobacco products by 2.7% y-o-y was also
affected by excise tax hike that took place in July 2019.
Inflation
In 2019, average gross wage increased by 7.2% to 1076 euro, showing a slightly lower growth than in the previous two years, when average gross
wage increased by 7.9% in 2017 and by 8.4% in 2018 respectively. In 2019, wage growth rates declined gradually - to 6.9% in the fourth quarter of
the year. Last year, wages grew faster in the private sector - by 7.6%, while in the public sector wage growth constituted 6.8%. Higher salary still
remained in the public sector, where the average wage was 1103 euro, while in the private sector it constituted 1067 euro. Real net wage
increased by 3.9% in 2019, showing weaker growth than in the previous year (+7.2%), when real net wage growth was stimulated by income tax
cuts that took place in January 1, 2018.
3
Employment
Wages, euro
Unemployment rate, % of economically active population (15-74)
Wage dynamics, changes year over year, %
The number of employed persons, according to the
labour force survey data, remained almost unchanged at
910 thsd in 2019, increasing only by 0.1%, compared to
the previous year. In comparison, in 2018 the number of
employed persons had increased by 1.6%. Statistics on
occupied posts at the end of 3Q showed that the
number of occupied posts increased the most in
administrative services sector - by 4.4%, human health
and social work activities - by 3.7% and agriculture and
forestry - by 3.3% y-o-y. The largest decrease in
employment was observed in public administration - by
3.6%, as well as in electricity and gas supply sector - by
1.1% y-o-y. Unemployment rate decreased by 1.1
percentage point to 6.3% of economically active
population in 2019. Registered unemployment rate was
6.4% at the end of January 2020 - by 0.3pp lower than a
year ago, and the number of registered unemployed in
the last 12 months fell by 5.0% to 58.8 thsd at the end of
January.
-2
-1
0
1
2
3
4
I V IX I V IX I V IX I V IX I V IX I V IX I V IX I V IX I
2012 2013 2014 2015 2016 2017 2018 2019 20
imported inflation
taxes
core inflation
CPI
0
2
4
6
8
10
12
14
16
18
20
600
650
700
750
800
850
900
950
1000
I II III IV I II III IV I II III IV I II III IV I II III IV I II III IV I II III IV I II III IV I II III IV
2011 2012 2013 2014 2015 2016 2017 2018 2019
employment, thsd.
jobseeker rate, %
registered unemployed, % (rhs)
0
2
4
6
8
10
I II III IV I II III IV I II III IV I II III IV I II III IV I II III IV I II III IV I II III IV
2012 2013 2014 2015 2016 2017 2018 2019
real gross wage, CPI deflated
gross wage
732 766813
855 886951
1 0321 103
658 689741
799 845915
9911 067
0
200
400
600
800
1000
2012 2013 2014 2015 2016 2017 2018 2019
public sector private sector
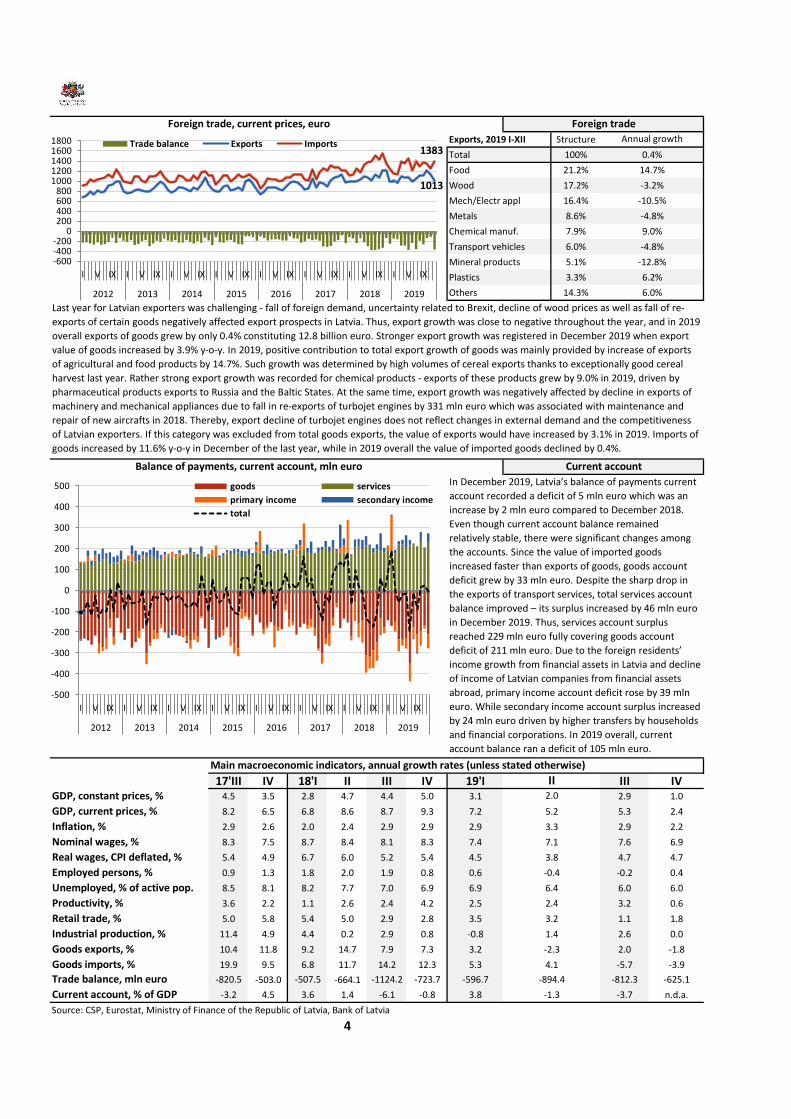
Exports, 2019 I-XII Structure
100%
21.2%
17.2%
16.4%
8.6%
7.9%
6.0%
Mineral products 5.1%
Plastics 3.3%
14.3%
17'III IV 18'I II III IV 19'I III IV4.5 3.5 2.8 4.7 4.4 5.0 3.1 2.9 1.0
8.2 6.5 6.8 8.6 8.7 9.3 7.2 5.3 2.4
2.9 2.6 2.0 2.4 2.9 2.9 2.9 2.9 2.2
8.3 7.5 8.7 8.4 8.1 8.3 7.4 7.6 6.9
5.4 4.9 6.7 6.0 5.2 5.4 4.5 4.7 4.7
0.9 1.3 1.8 2.0 1.9 0.8 0.6 -0.2 0.4
8.5 8.1 8.2 7.7 7.0 6.9 6.9 6.0 6.0
3.6 2.2 1.1 2.6 2.4 4.2 2.5 3.2 0.6
5.0 5.8 5.4 5.0 2.9 2.8 3.5 1.1 1.8
11.4 4.9 4.4 0.2 2.9 0.8 -0.8 2.6 0.0
10.4 11.8 9.2 14.7 7.9 7.3 3.2 2.0 -1.8
19.9 9.5 6.8 11.7 14.2 12.3 5.3 -5.7 -3.9
-820.5 -503.0 -507.5 -664.1 -1124.2 -723.7 -596.7 -812.3 -625.1
Current account, % of GDP -3.2 4.5 3.6 1.4 -6.1 -0.8 3.8 -3.7 n.d.a.
Source: CSP, Eurostat, Ministry of Finance of the Republic of Latvia, Bank of Latvia
4
2.4
3.2
1.4
-2.3
4.1
-894.4
-1.3
Annual growth
0.4%
14.7%
-3.2%
-10.5%
-4.8%
9.0%
-4.8%
Total
Mech/Electr appl
Transport vehicles
Food
Chemical manuf.
Metals
Foreign trade, current prices, euro Foreign trade
Wood
Real wages, CPI deflated, %
Employed persons, %
Unemployed, % of active pop.
Last year for Latvian exporters was challenging - fall of foreign demand, uncertainty related to Brexit, decline of wood prices as well as fall of re-
exports of certain goods negatively affected export prospects in Latvia. Thus, export growth was close to negative throughout the year, and in 2019
overall exports of goods grew by only 0.4% constituting 12.8 billion euro. Stronger export growth was registered in December 2019 when export
value of goods increased by 3.9% y-o-y. In 2019, positive contribution to total export growth of goods was mainly provided by increase of exports
of agricultural and food products by 14.7%. Such growth was determined by high volumes of cereal exports thanks to exceptionally good cereal
harvest last year. Rather strong export growth was recorded for chemical products - exports of these products grew by 9.0% in 2019, driven by
pharmaceutical products exports to Russia and the Baltic States. At the same time, export growth was negatively affected by decline in exports of
machinery and mechanical appliances due to fall in re-exports of turbojet engines by 331 mln euro which was associated with maintenance and
repair of new aircrafts in 2018. Thereby, export decline of turbojet engines does not reflect changes in external demand and the competitiveness
of Latvian exporters. If this category was excluded from total goods exports, the value of exports would have increased by 3.1% in 2019. Imports of
goods increased by 11.6% y-o-y in December of the last year, while in 2019 overall the value of imported goods declined by 0.4%.
GDP, constant prices, %
GDP, current prices, %
-12.8%
6.2%
6.0%
Inflation, %
II2.0
5.2
3.3
7.1
3.8
-0.4
6.4
Balance of payments, current account, mln euro
Main macroeconomic indicators, annual growth rates (unless stated otherwise)
Goods imports, %
Trade balance, mln euro
In December 2019, Latvia’s balance of payments current
account recorded a deficit of 5 mln euro which was an
increase by 2 mln euro compared to December 2018.
Even though current account balance remained
relatively stable, there were significant changes among
the accounts. Since the value of imported goods
increased faster than exports of goods, goods account
deficit grew by 33 mln euro. Despite the sharp drop in
the exports of transport services, total services account
balance improved – its surplus increased by 46 mln euro
in December 2019. Thus, services account surplus
reached 229 mln euro fully covering goods account
deficit of 211 mln euro. Due to the foreign residents’
income growth from financial assets in Latvia and decline
of income of Latvian companies from financial assets
abroad, primary income account deficit rose by 39 mln
euro. While secondary income account surplus increased
by 24 mln euro driven by higher transfers by households
and financial corporations. In 2019 overall, current
account balance ran a deficit of 105 mln euro.
Productivity, %
Retail trade, %
Current account
Industrial production, %
Goods exports, %
Others
Nominal wages, %
1013
1383
-600-400-200
0200400600800
10001200140016001800
I V IX I V IX I V IX I V IX I V IX I V IX I V IX I V IX
2012 2013 2014 2015 2016 2017 2018 2019
Trade balance Exports Imports
-500
-400
-300
-200
-100
0
100
200
300
400
500
I V IX I V IX I V IX I V IX I V IX I V IX I V IX I V IX
2012 2013 2014 2015 2016 2017 2018 2019
goods services
primary income secondary income
total
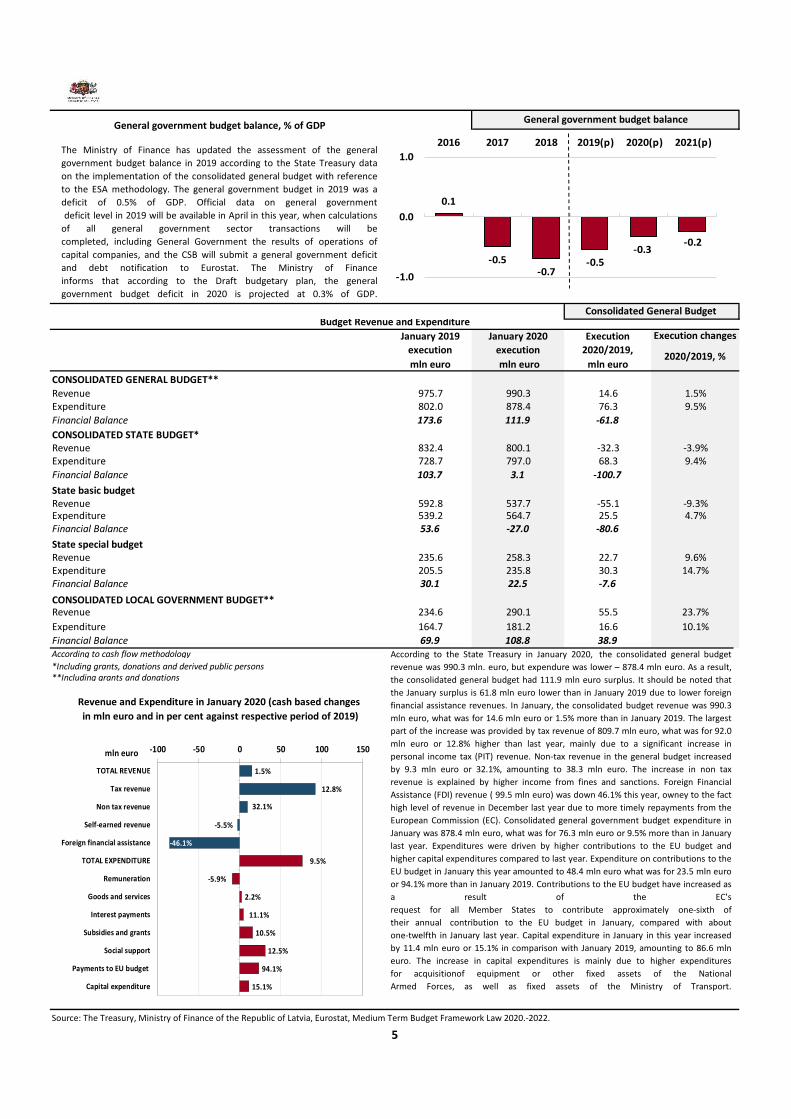
January 2019 January 2020 Execution
execution
mln euro
execution
mln euro
2020/2019,
mln euro
CONSOLIDATED GENERAL BUDGET**
975.7 990.3 14.6802.0 878.4 76.3
173.6 111.9 -61.8
832.4 800.1 -32.3728.7 797.0 68.3
103.7 3.1 -100.7
592.8 537.7 -55.1539.2 564.7 25.553.6 -27.0 -80.6
235.6 258.3 22.7205.5 235.8 30.330.1 22.5 -7.6
234.6 290.1 55.5
164.7 181.2 16.6
69.9 108.8 38.9According to cash flow methodology
*Including grants, donations and derived public persons**Including grants and donations
Source: The Treasury, Ministry of Finance of the Republic of Latvia, Eurostat, Medium Term Budget Framework Law 2020.-2022.
The Ministry of Finance has updated the assessment of the general
government budget balance in 2019 according to the State Treasury data
on the implementation of the consolidated general budget with reference
to the ESA methodology. The general government budget in 2019 was a
deficit of 0.5% of GDP. Official data on general government
deficit level in 2019 will be available in April in this year, when calculations
of all general government sector transactions will be
completed, including General Government the results of operations of
capital companies, and the CSB will submit a general government deficit
and debt notification to Eurostat. The Ministry of Finance
informs that according to the Draft budgetary plan, the general
government budget deficit in 2020 is projected at 0.3% of GDP.
CONSOLIDATED LOCAL GOVERNMENT BUDGET**Revenue 23.7%
Expenditure 10.1%
Financial BalanceAccording to the State Treasury in January 2020, the consolidated general budget
revenue was 990.3 mln. euro, but expendure was lower – 878.4 mln euro. As a result,
the consolidated general budget had 111.9 mln euro surplus. It should be noted that
the January surplus is 61.8 mln euro lower than in January 2019 due to lower foreign
financial assistance revenues. In January, the consolidated budget revenue was 990.3
mln euro, what was for 14.6 mln euro or 1.5% more than in January 2019. The largest
part of the increase was provided by tax revenue of 809.7 mln euro, what was for 92.0
mln euro or 12.8% higher than last year, mainly due to a significant increase in
personal income tax (PIT) revenue. Non-tax revenue in the general budget increased
by 9.3 mln euro or 32.1%, amounting to 38.3 mln euro. The increase in non tax
revenue is explained by higher income from fines and sanctions. Foreign Financial
Assistance (FDI) revenue ( 99.5 mln euro) was down 46.1% this year, owney to the fact
high level of revenue in December last year due to more timely repayments from the
European Commission (EC). Consolidated general government budget expenditure in
January was 878.4 mln euro, what was for 76.3 mln euro or 9.5% more than in January
last year. Expenditures were driven by higher contributions to the EU budget and
higher capital expenditures compared to last year. Expenditure on contributions to the
EU budget in January this year amounted to 48.4 mln euro what was for 23.5 mln euro
or 94.1% more than in January 2019. Contributions to the EU budget have increased as
a result of the EC's
request for all Member States to contribute approximately one-sixth of
their annual contribution to the EU budget in January, compared with about
one-twelfth in January last year. Capital expenditure in January in this year increased
by 11.4 mln euro or 15.1% in comparison with January 2019, amounting to 86.6 mln
euro. The increase in capital expenditures is mainly due to higher expenditures
for acquisitionof equipment or other fixed assets of the National
Armed Forces, as well as fixed assets of the Ministry of Transport.
5
Expenditure 9.4%
Financial Balance
State basic budgetRevenue -9.3%Expenditure 4.7%Financial Balance
State special budgetRevenue 9.6%Expenditure 14.7%
-3.9%
Consolidated General Budget
General government budget balance, % of GDP
Budget Revenue and Expenditure
Execution changes
General government budget balance
Revenue and Expenditure in January 2020 (cash based changes
in mln euro and in per cent against respective period of 2019)
Financial Balance
2020/2019, %
Expenditure 9.5%
Financial Balance
Revenue 1.5%
CONSOLIDATED STATE BUDGET*Revenue
1.5%
12.8%
32.1%
-5.5%
-46.1%
9.5%
-5.9%
2.2%
11.1%
10.5%
12.5%
94.1%
15.1%
-100 -50 0 50 100 150
TOTAL REVENUE
Tax revenue
Non tax revenue
Self-earned revenue
Foreign financial assistance
TOTAL EXPENDITURE
Remuneration
Goods and services
Interest payments
Subsidies and grants
Social support
Payments to EU budget
Capital expenditure
mln euro
0.1
-0.5-0.7
-0.5-0.3
-0.2
-1.0
0.0
1.0
2016 2017 2018 2019(p) 2020(p) 2021(p)
Source: The Treasury
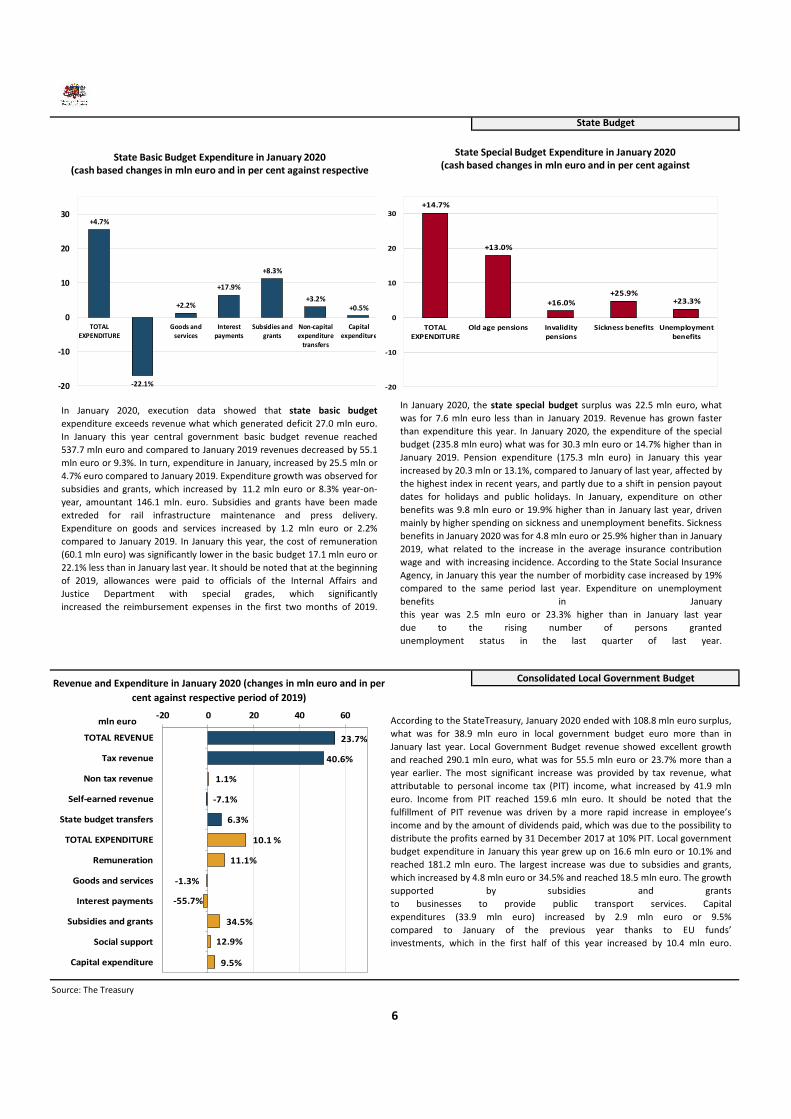
In January 2020, execution data showed that state basic budget
expenditure exceeds revenue what which generated deficit 27.0 mln euro.
In January this year central government basic budget revenue reached
537.7 mln euro and compared to January 2019 revenues decreased by 55.1
mln euro or 9.3%. In turn, expenditure in January, increased by 25.5 mln or
4.7% euro compared to January 2019. Expenditure growth was observed for
subsidies and grants, which increased by 11.2 mln euro or 8.3% year-on-
year, amountant 146.1 mln. euro. Subsidies and grants have been made
extreded for rail infrastructure maintenance and press delivery.
Expenditure on goods and services increased by 1.2 mln euro or 2.2%
compared to January 2019. In January this year, the cost of remuneration
(60.1 mln euro) was significantly lower in the basic budget 17.1 mln euro or
22.1% less than in January last year. It should be noted that at the beginning
of 2019, allowances were paid to officials of the Internal Affairs and
Justice Department with special grades, which significantly
increased the reimbursement expenses in the first two months of 2019.
Revenue and Expenditure in January 2020 (changes in mln euro and in per
cent against respective period of 2019)
According to the StateTreasury, January 2020 ended with 108.8 mln euro surplus,
what was for 38.9 mln euro in local government budget euro more than in
January last year. Local Government Budget revenue showed excellent growth
and reached 290.1 mln euro, what was for 55.5 mln euro or 23.7% more than a
year earlier. The most significant increase was provided by tax revenue, what
attributable to personal income tax (PIT) income, what increased by 41.9 mln
euro. Income from PIT reached 159.6 mln euro. It should be noted that the
fulfillment of PIT revenue was driven by a more rapid increase in employee’s
income and by the amount of dividends paid, which was due to the possibility to
distribute the profits earned by 31 December 2017 at 10% PIT. Local government
budget expenditure in January this year grew up on 16.6 mln euro or 10.1% and
reached 181.2 mln euro. The largest increase was due to subsidies and grants,
which increased by 4.8 mln euro or 34.5% and reached 18.5 mln euro. The growth
supported by subsidies and grants
to businesses to provide public transport services. Capital
expenditures (33.9 mln euro) increased by 2.9 mln euro or 9.5%
compared to January of the previous year thanks to EU funds’
investments, which in the first half of this year increased by 10.4 mln euro.
In January 2020, the state special budget surplus was 22.5 mln euro, what
was for 7.6 mln euro less than in January 2019. Revenue has grown faster
than expenditure this year. In January 2020, the expenditure of the special
budget (235.8 mln euro) what was for 30.3 mln euro or 14.7% higher than in
January 2019. Pension expenditure (175.3 mln euro) in January this year
increased by 20.3 mln or 13.1%, compared to January of last year, affected by
the highest index in recent years, and partly due to a shift in pension payout
dates for holidays and public holidays. In January, expenditure on other
benefits was 9.8 mln euro or 19.9% higher than in January last year, driven
mainly by higher spending on sickness and unemployment benefits. Sickness
benefits in January 2020 was for 4.8 mln euro or 25.9% higher than in January
2019, what related to the increase in the average insurance contribution
wage and with increasing incidence. According to the State Social Insurance
Agency, in January this year the number of morbidity case increased by 19%
compared to the same period last year. Expenditure on unemployment
benefits in January
this year was 2.5 mln euro or 23.3% higher than in January last year
due to the rising number of persons granted
unemployment status in the last quarter of last year.
6
Consolidated Local Government Budget
State Budget
State Basic Budget Expenditure in January 2020(cash based changes in mln euro and in per cent against respective
State Special Budget Expenditure in January 2020(cash based changes in mln euro and in per cent against
+4.7%
-22.1%
+2.2%
+17.9%
+8.3%
+3.2%+0.5%
-20
-10
0
10
20
30
TOTALEXPENDITURE
Goods andservices
Interestpayments
Subsidies andgrants
Non-capitalexpenditure
transfers
Capitalexpenditure
+14.7%
+13.0%
+16.0%+25.9%
+23.3%
-20
-10
0
10
20
30
TOTALEXPENDITURE
Old age pensions Invaliditypensions
Sickness benefits Unemploymentbenefits
23.7%
40.6%
1.1%
-7.1%
6.3%
10.1 %
11.1%
-1.3%
-55.7%
34.5%
12.9%
9.5%
-20 0 20 40 60
TOTAL REVENUE
Tax revenue
Non tax revenue
Self-earned revenue
State budget transfers
TOTAL EXPENDITURE
Remuneration
Goods and services
Interest payments
Subsidies and grants
Social support
Capital expenditure
mln euro

717.7 809.7 92.0 12.8% 107.9%
223.8 242.4 18.6 8.3% 103.0%
215.9 234.2 1.6 3.4% 102.8%
0.0 0.0 0.0 x x
7.9 8.2 0.3 3.9% 107.3%
214.1 219.2 5.1 2.4% 99.3%
147.9 196.2 48.3 32.6% 132.6%
30.2 36.7 6.4 21.3% 123.9%
117.7 159.6 41.9 35.6% 134.8%
90.0 91.2 1.3 1.4% 96.5%
4.2 14.2 9.9 234.2% 88.6%
5.9 14.6 8.7 146.4% 238.7%
47.5 49.1 1.6 3.4% 100.2%
0.9 0.0 -0.9 x x
Source: The Treasury, Ministry of Finance of the Republic of Latvia, Eurostat, Medium Term Budget Framework Law 2020.-2022.
According to the State Treasury, the general government debt stood at
36.6% of GDP in 2019 and is projected to increase to about 37% of GDP in
2020. On February 2020 an international credit rating agency
S&P Global Ratings (S&P) upgraded Latvia from ‘A’ to ‘A+’ level with a
stable outlook. S&P in it`s evaluation has highlighted two main driving
factors for the upgrade: (a) Latvia`s prudent fiscal policy, which,
despite softer medium term growth outlook, will allow to
reduce already modest debt also further and
(b) vulnerabilities of Latvia's financial system are contained.
Real estate tax
General Government Debt
According to cash flow methodology
7
General Government Debt, mln euro,% of GDP
In comparison with period of 2019, the tax revenue of the general budget
increased by 92.0 mln euro or 12.8%, amounting to 809.7 mln euro, which
was mainly driven by increases in personal income tax (PIT) and social
security contributions (SOC). Total SOC revenue in the budget (242.4 mln
euro) increased by 18.6 mln euro or 8.3%, compared to January 2019, this
increase is driven by the rise in the
number of employees and their earnings. Real estate tax (RIT) revenue
Total Tax Revenue January 2020 (mln euro and % change in
comparison with the previous year)
Informative:Social security contributions to the state funded pension scheme
Solidarity tax in private pension scheme
Personal income tax
in State budget
in Local government budget
Excise tax
Corporate income tax
in State special budget
Solidarity tax
1% for the health financing
Value added tax
Consolidated general budget tax revenue
Social security contributions
Tax Revenue
Consolidated General budget Tax Revenue
January 2019
execution, mln
euro
January 2020
execution, mln euro
Execution changes
2020/2019, mln euro
Execution changes
2020/2019, %
January execution of
the same period plan
in January was 14.6 mln euro, compared with January 2019, increased by 8.7
mln euro or 146.4%. Excise tax revenue in January 2020 was 91.2 mln euro
compared to January 2019, what increased by 1.3 mln euro or 1.4%. The
largest increase (1.7 mln euro or 4.0%) was observed in excise tax revenues
on oil products. This is due to the increase in the volume of petroleum
products released for consumption. On the other hand, excise tax revenue
on alcoholic beverages dropped by 0.6 mln euro in January due to the decline
in spirits released for consumption. In January this year, the value added tax
(VAT) revenue increased by 5.1 mln euro or 2.4. The increase in VAT revenue
is related to the increase in output and services rendered. The tax revenue
plan for the general budget in january 2020 was implemented at 107.9%,
providing the budget with an overhead revenue of 59.3 mln euro, mainly due
to higher PIT revenue. The overflow of the PIT revenue plan was largely
influenced by dividend income received at the end of 2019, as well as a more
rapid increase in employee income. Significant overhead revenue in the
general budget in January came from real estate tax and social security
contributions, respectively 8.5 mln euro and 6.9 mln euro. In
its turn, the value added tax revenue did not reach the
planned 1.5 mln euro or 0.7% and corporate income tax revenue
was 1.8 mln euro or 11.4% less than planned.
-2.3
% 0.5%
16.1
%
10.2
%
-2.9
%
6.0%
0.1%
-86.
6%
2.5%
14.0
%
4.8%
14.8
%
146.
4%
234.
2%
32.6
%
8.3%
2.4%
1.4%
0
20
40
60
80
100
120
140
160
180
200
220
240
260
RET CIT PIT SSC VAT Excise2018 2019 2020
37%
40%39%
36% 37%
37%34%
5
10
15
20
25
30
35
40
45
5,000
6,000
7,000
8,000
9,000
10,000
11,000
12,000
13,000
2015 2016 2017 2018 2019(p) 2020(p) 2021(p)
Mln euro % of GDP (right axis)