macroeconomic and industry analysis chapter 12 copyright © 2010 by the mcgraw-hill companies, inc....
TRANSCRIPT

Macroeconomic and Industry
Analysis
Chapter 12
Copyright © 2010 by The McGraw-Hill Companies, Inc. All rights reserved.McGraw-Hill/Irwin

12-2
Framework of Analysis
• Fundamental Analysis– Analysis of the determinants of firm value,
specifically attempting to forecast the earnings and dividends of a firm.
– Top down approach: Analyze economy
Analyze industryAnalyze firm

12-3
Framework of Analysis• Approach to Fundamental Analysis
– Industry analysis• Critical to understand the competitiveness of
the industry
– Company analysis• Detailed strategic and financial analysis of the
firm
• Why use the top-down approach?

12-4
The Business Cycle• Recurring patterns of recession and recovery
– Peak
– Trough
• Industry relationship to business cycles– Cyclical industries
• Industries with above average sensitivity to the state of the economy
– Defensive• Industries with below average sensitivity to the state
of the economy

12-5
Industry Analysis• Performance can vary widely across
industries– It is difficult to find a good stock in a poor
industry

12-6
Figure 12.8 Industry Stock Price Performance, 2008

12-7
Defining an Industry• It can be difficult to define an industry
– North American Industry Classification System (NAICS) attempts to define industry groups with a four or five digit code:
• The first two digits broadly define the industry group: NAIC code 23 = construction
• The last two or three digits define the industry more narrowly

12-8
Sensitivity to Business Cycle
• Factors affecting sensitivity of earnings to business cycles– Sensitivity of sales of the firm’s product to the
business cycles
– Fixed costs and leverage• Fixed costs are costs that do not vary with the level
of production.
• Fixed costs contribute to higher profitability when sales are high, but will result in lower profitability when sales are lower.
12-9
Sensitivity to Business Cycle
– Operating leverage• Proportion of fixed operating costs as a percent of
total costs• Greater operating leverage results in greater
swings in profits over the business cycle– Airlines, automobiles
– Financial leverage• Proportion of fixed financing costs as a percent of
total costs• Greater financial leverage results in greater swings
in profits over the business cycle– Airlines, banks, investment banks

12-10
Figure 12.11 A Stylized Depiction
of the Business Cycle
12-11
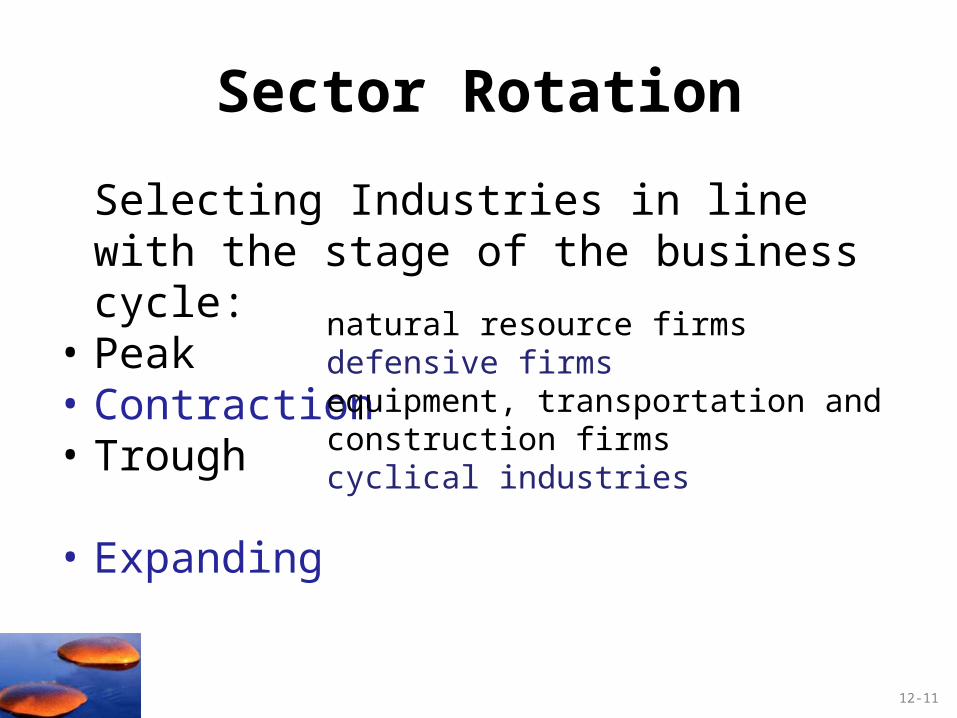
Sector Rotation
Selecting Industries in line with the stage of the business cycle:
• Peak • Contraction• Trough • Expanding
natural resource firmsdefensive firmsequipment, transportation and construction firmscyclical industries

12-12
Figure 12.12 Sector Rotation Illustrated

12-13
Industry Life CyclesStage Sales Growth
Start-up
Consolidation
Maturity
Relative Decline
Rapid & Increasing
Stable
Slowing
Minimal or Negative

12-14
Figure 12.13 The Industry Life Cycle
12-15
Industry Structure and Performance (Porter Model)
Determinants of Industry Competition and Profitability
• Threat of Entry– New entrants reduce profitability– Barriers to entry preserve profitability
• Large scale required to be profitable (autos)
• Secure distribution channels
• Brand loyalty, unique differentiated product
• Proprietary production technology
• Intellectual property protections
• Learning curve effects
12-16
Industry Structure and Performance (Porter Model)
Determinants of Industry Competition and Profitability
• Rivalry between existing competitors– Equal competitors reduce profitability– Slow industry growth,– High fixed costs, – Scale economies,
Pressure to cut prices

12-17
Industry Structure and Performance (Porter Model)
Determinants of Industry Competition and Profitability• Pressure from substitute products
– Substitutes limit profitability (propane, natural gas)• Bargaining power of buyers
– A buyer that purchases a large percent of an industry’s output can limit the selling industry’s profitability (auto parts suppliers)
• Bargaining power of suppliers– A supplier that controls a key input can limit the
buying industry’s profitability (labor unions)