macroeconomic implications of the fiscal imbalances ... · - 2 - to have resulted in major...
TRANSCRIPT

C:\Documents And Settings\Dbujosa\Desktop\Pdf\Kochhar.DOC March 23, 2004 (8:53 AM)
Kalpana Kochhar1 Assistant Director, Asia and Pacific Department, IMF
At the IMF/NIPFP Conference on Fiscal Policy in India
Taj Mahal Hotel, New Delhi, India January 16-17, 2004
Macroeconomic Implications of the Fiscal Imbalances
I. INTRODUCTION
1. Chances are that any conversation about India today will turn into a discussion of the rapid rise in income and reduction in poverty, or the phenomenal rise of the information technology (IT) and the ITES sector in the global market, or the spectacular growth in cellular telephony, or the imminent dawn of India’s golden age—the latter largely predicated on favorable demographic trends propelling India into the ranks of the world’s leading economies in the not-too-distant future. It is undeniable that India has made—in only the last 12 years—remarkable strides in raising living standards and reducing poverty as a result of wide-ranging reforms to liberalize and open up the economy. Furthermore, from facing a severe balance of payments crisis, which brought it to the verge of bankruptcy in 1990/91, India now has reserves of over $100 billion and vulnrerability to external shocks has been reduced significantly.
2. At the same time, India has amongst the most largest and most intractable fiscal imbalances in the world. However, as recently noted in the Economist in a discusssion of the “appalling state” of government finances, “To draw attention to it seems in poor taste”.2 In some ways, this tendency to set the fiscal imbalances aside as being irrelevant is understandable—India has largely avoided the most visible negative macroeconomic effects of fiscal imbalances to date—inflation is low, nominal interest rates have fallen, and the external position has strengthened considerably. Where then are all the dire textbook predictions that follow from general government deficits in excess of 10 percent of GDP in each of the past five years and debt exceeding 80 percent of GDP?
3. This paper will explore the macroeconomic impact of India’s large and persistent fiscal imbalances. It will outline the main reasons why the imbalances appear not
1 I would like to thank Shankar Acharya and Mihir Rakshit, the two discussants of this paper at the conference, for their insightful comments on an earlier draft. I would also like to thank, without implicating, my colleagues at the IMF for their direct and indirect inputs into this paper—especially David Cowen, Catriona Purfield and Fritz Pierre-Louis.
2 A Survey of India, Economist, February 21, 2004.

- 2 -
to have resulted in major macroeconomic difficulties. It will conclude that, despite the apparent ease with which the fiscal imbalances seem to have been tolerated, they are taking their toll on the economy in terms of foregone growth. The main channels through which the fiscal imbalances impact the growth performance of the economy are through the deterioration in the quality of public expenditure, limitations on the room for macroeconomic policy maneuver and on the scope for further structural reforms and liberalization. Together this prevents the economy from attaining a sustained high growth path, and could over time jeopardize the progress with poverty reduction.
4. The paper will also argue that the time to take concerted action is now because, paradoxically, some of the very reasons fueling the current positive sentiment—namely, a revival in private sector activity—could bring an end to the ability of the government to borrow without facing any competition for resources from the private sector. Such a turn of events could bring on serious macroeconomic difficulties—a rise in inflation and interest rates, a real appreciation of the exchange rate, and an erosion in the hard-won improvement in the financial health of the corporate sector. In light of the fact that India’s revenue collection falls far short of that in comparable countries and in light of the large development needs, the focus should be on reforms aimed at raising revenues through a simple, fair and equitable system of taxes and fees. On the expenditure side, the priority is to reorient spending away from inefficient subsidies toward physical and social infrastructure projects.
5. The paper is organized as follows: Section II provides a thumbnail sketch of the evolution of fiscal imbalances in India since the early 1990s, and places India’s fiscal imbalances in international perspective. Section III traces key developments in major macroeconomic variables—inflation, external balances, interest rates and growth with a view to examining the macroeconomic implications of the buildup in fiscal imbalances. Section IV concludes with the argument that the current confluence of positive economic developments affords a good opportunity to make a decisive and front-loaded start to correcting the large fiscal imbalances. Such adjustment could set off a virtuous cycle of growth, further narrowing the fiscal deficits and generating even more growth.
II. EVOLUTION OF FISCAL IMBALANCES

- 3 -
6. Government finances in India have deteriorated progressively since the mid-1990s and its fiscal imbalances now rank amongst the worst in the world (Table 1). Since the end of the 1990s, the general government deficit in India has exceeded 10 percent of GDP and the primary deficit has averaged 4 percent of GDP. India’s overall fiscal deficit is now the third largest in a sample of emerging market economies (many with federal structures), and is exceeded only by that of Turkey and Argentina. While India’s primary deficits traditionally exceeded those in Turkey and Argentina, this margin has increased substantially in recent years as the latter have embarked on sizeable fiscal adjustment programs in the aftermath of macroeconomic crises.
7. Persistent primary deficits and the narrowing gap between real growth and interest rates drove the accumulation of general government debt. Following a period of accelerating growth in the post-crisis period of the early 1990s, growth slowed sharply in the second half of the 1990s. Thus, the growth-interest differential first narrowed in the late 1990s before all but disappearing between 2000 and 2002 (Figure 1).3 Consequently, the overall debt burden in India, which had been on a declining trend prior to 1998, has since grown at an annual average rate of 5 percent and now exceeds 80 percent of GDP (Table 2).4
3 See Rangarajan and Srivastava (2003), who discuss the relative impact of growth, interest and growth rates on central government debt between 1950 and 2002.
4 Various observers have argued that, India has sizable assets, likely to be in the range of 25-30 percent of GDP, that reduces India’s net debt burden. However, the official debt statistics understate the true extent of the government’s debt obligations which has been compounded by a proliferation of off-budget claims, including guarantees, public enterprise arrears, and unfunded pension liabilities. Thus, even if public assets are taken into account, a proper accounting of contingent liabilities would likely yield an estimated net debt in a similar range of gross debt.
Rank2002 1995 2002 1995 2002 1995 2002
Turkey 1/ -19.2 -5.8 81.2 42.8 4.0 3.9 1Argentina 1/ -12.8 -3.2 174.0 38.3 0.3 -1.3 2India 2/ -10.2 -6.9 80.6 71.0 -4.0 -1.9 3Hungary -9.5 -6.2 49.9 84.3 -5.5 2.7 4Philippines 1/ -8.3 -4.2 99.4 80.5 2.3 80.5 5Brazil 1/ -4.7 -7.0 95.1 31.1 4.0 0.3 6Indonesia 3/ -1.8 0.8 80.6 29.0 3.8 2.6 7Chile 1/ -1.4 3.3 20.9 20.0 -1.1 4.2 8South Africa 3/ -1.2 -5.6 39.9 42.2 3.0 -1.0 9Russia 0.7 -6.5 34.7 37.9 2.8 -2.7 10Ecuador 1/ 0.8 -1.2 57.8 39.7 4.4 2.9 11
Source: WEO.
1/ Public sector.2/ For India gross debt.3/ Central government.
Table 1. India's General Government Finances in International Perspective
General Government
(In percent of GDP)
Debt-to-GDP 1/Deficit-to-GDP Primary Deficit-to-GDP

- 4 -
8. A comparison of general government revenues and expenditures with other similarly placed countries reveals that India falls far short in its revenue collections efforts (Tables 3 and 4). The ratio of tax revenues to GDP is less than the unweighted average for the chosen comparator countries for all categories of taxes with the exception of international trade taxes.5 Moreover, as discussed in IMF (2002a), the ratio of tax revenue to GDP declined in India during the 1990s, while the average tax revenue to GDP ratio has increased slightly on average for the comparator countries during the same period. In contrast to revenues, general government expenditure relative to GDP in India is slightly below that of the unweighted average for the comparator countries. Moreover, the composition of public expenditure has shifted toward consumption from investment, with potentially adverse effects on infrastructure and growth.
9. Both the central government and state governments contributed to the deterioration in the public finances in the second half of the 1990s. A sizeable proportion of the deterioration in fiscal performance during this period was attributable to the central
5 This is consistent with the fact that India has been much slower than most emerging market countries to liberalize trade.
Figure 1. India: Declining Growth-Interest Rate Differential(In percent)
-2
0
2
4
6
8
10
12
1991/92 1992/93 1993/94 1994/95 1995/96 1996/97 1997/98 1998/99 1999/00 2000/01 2001/02 2002/03-2
0
2
4
6
8
10
12

- 5 -
1995
1996
1997
1998
1999
2000
2001
2002
2002
-199
5Pe
rcen
t of
CY
CY
CY
CYC
YC
YCY
Est.
(cha
nge)
Con
trib.
Def
icits
Gen
eral
gov
ernm
ent
-6.9
-7.0
-7.2
-8.4
-9.7
-9.8
-10.
0-1
0.3
-3.4
100.
0C
entra
l gov
ernm
ent
-4.6
-4.2
-4.7
-5.3
-5.5
-5.7
-6.2
-6.1
-1.6
46.4
Stat
e go
vern
men
t-2
.3-2
.8-2
.5-3
.1-4
.1-4
.2-3
.8-4
.2-1
.853
.6
Prim
ary
defic
itG
ener
al g
over
nmen
t -1
.9-1
.9-2
.1-3
.2-4
.0-4
.0-4
.2-4
.0-2
.110
0.0
Cen
tral g
over
nmen
t -0
.20.
2-0
.3-0
.6-0
.7-0
.9-1
.3-1
.2-1
.149
.9St
ate
gove
rnm
ent
-1.7
-2.1
-1.8
-2.5
-3.3
-3.1
-2.9
-2.7
-1.1
50.1
Rev
enue
def
icit
Gen
eral
gov
ernm
ent
-3.3
-3.5
-4.0
-5.8
-6.3
-6.5
-6.9
-6.9
-3.6
99.6
Cen
tral g
over
nmen
t -2
.6-2
.4-2
.9-3
.6-3
.6-3
.9-4
.3-4
.3-1
.747
.8St
ate
gove
rnm
ent
-0.7
-1.1
-1.1
-2.1
-2.7
-2.6
-2.6
-2.5
-1.8
51.8
Deb
tG
ener
al g
over
nmen
t 71
.066
.466
.666
.969
.171
.475
.880
.69.
610
0.0
Cen
tral g
over
nmen
t 2/
64.3
59.7
59.2
59.3
59.0
59.2
61.0
57.0
-7.3
-76.
2N
et st
ate
gove
rnm
ent d
ebt 3
/6.
76.
77.
47.
610
.212
.114
.823
.616
.917
6.2
Gro
ss st
ate
gove
rnm
ent d
ebt 4
/17
.917
.718
.619
.221
.522
.925
.334
.116
.216
8.6
Con
tinge
nt li
abili
ties
Gua
rant
ees
10.2
9.8
9.7
9.8
10.8
11.9
11.6
...1.
410
0.0
Cen
tral g
over
nmen
t 5.
75.
24.
94.
44.
34.
24.
2...
-1.5
-109
.0St
ate
gove
rnm
ent
4.5
4.6
4.8
5.4
6.5
7.7
7.4
...2.
920
9.0
Stat
e El
ectri
city
Boa
rd a
rrea
rs...
......
0.5
0.7
1.0
1.1
......
...N
PV u
nfun
ded
pens
ion
liabi
litie
s...
......
......
......
6.7
......
Sour
ce: M
OF;
RB
I; Pl
anni
ng C
omm
issi
on; a
nd st
aff e
stim
ates
.
1/ If
pol
icie
s con
tinue
unc
hang
ed a
nd F
RB
M is
not
impl
emen
ted.
2/ F
rom
200
0, b
orro
win
gs b
y st
ates
from
the
Nat
iona
l Sm
all S
avin
gs F
unds
are
inlc
uded
as s
tate
gov
ernm
ent l
iabi
litie
s.3/
Exc
lude
s sta
tes o
blig
atio
ns to
the
cent
ral g
over
nmen
t.4/
Incl
udes
loan
s fro
m th
e ce
ntra
l gov
ernm
ent t
o st
ates
.
(In
perc
ent o
f GD
P)
Tabl
e 2.
Tre
nds i
n C
entra
l and
Sta
te G
over
nmen
t Fin
ance
s

- 6 -
Total Direct Sales and International OtherTaxes Excises Trade
Turkey 32.8 9.5 12.4 0.4 10.5Argentina 20.9 4.9 5.0 5.2 5.8India 14.2 3.0 3.2 3.0 5.0Hungary 37.6 9.9 12.0 0.8 14.9Philippines 13.5 6.1 3.2 2.7 1.5Brazil 21.8 5.0 3.8 0.7 12.3Indonesia 13.2 6.3 4.9 0.6 1.4Chile 1/ 20.6 4.7 11.4 1.9 2.6South Africa 26.7 14.2 8.7 0.8 3.0Russia 34.9 7.6 10.0 3.0 14.3Ecuador 11.8 2.6 7.3 1.9Unweighted average 22.5 6.7 7.4 1.9 6.7
Source: IMF (2002a) and Lorie (2003).
Table 3. India: General Government Revenue in International Perspective
Total Goods, Services Interest Capital Netand Transfers Expenditure Lending
Turkey 42.9 14.4 24.7 3.3 0.5Argentina 29.7 23.1 4.7 1.8 0.1India 28.4 15.7 7.0 3.8 1.9Hungary 49.3 36.7 1.1 4.0 7.5PhilippinesBrazil 48.3 32.2 4.6 3.0 8.5Indonesia 18.8 11.5 3.9 5.7 -2.3Chile 1/ 23.6 3.7South Africa 32.1 23.8 5.1 3.3 -0.1Russia 36.5 29.6 2.7 5.1 -0.9Ecuador 24.0 13.1 4.5 6.4 0.0
Unweighted average 33.4 22.2 6.2 4.0 1.7
Source: IMF (2002a) and Lorie (2003).
Table 4. India: General Government Expenditure in International Perspective

- 7 -
government. However—as was the case in the run-up to the 1990/91 balance of payments crisis—imbalances in the states’ finances also played a growing role. As in most federal systems, state governments in India are assigned an important role in implementing government policies. However, even though there has been little change in the responsibilities of states in the latter part of the 1990s, the growth in the state-level deficit has outpaced that of the central government. Moreover, although responsibility for rise in the primary deficit is roughly equally apportioned between each tier of government, over half of the increase in the overall deficit since 1999 is attributable to the states. Finally, while the debt of the central government fell since the mid–1990s, the states’ debt rose causing the general government debt burden to rise.
10. The deterioration in central and state government finances reflect a combination of an eroding revenue base and mounting spending pressures (Table 5). General government revenue collections have fallen from an average level of over 19 percent of GDP in the early 1990s to about 17¾ percent of GDP between 1998 and 2000. The trend decline in revenue mainly reflects poor tax performance, in particular the low buoyancy of tax system which is narrowly based on indirect taxes and manufacturing activity (with agriculture and the rapidly growing service sector largely outside the tax net), as well as the impact of trade liberalization on customs collections. In particular, reforms focused on reducing trade tax rates without compensating measures to reduce exemptions and close other loopholes. While most taxes are collected by the central government, India’s federal arrangements—which rely heavily on tax-sharing and transfers to finance state activities—meant that the trend decline in central tax collections translated into declining state-level revenues. Nevertheless, states failed to offset declining central government transfers by raising their own revenue.
11. Expenditure pressures arose at both levels of government but were most acute at the state level. In large part, this was due to the substantial increase in the wage and pension bill associated with the implementation of the pay increase recommended by Fifth Pay Commission but not the recommendations regarding downsizing,6 and the inability of states to withdraw populist schemes such as cheap power to farmers and households, subsidized water and food, and to reduce the size of government employment.7 Another factor-giving rise to expenditure pressures was the rise in the interest bill. In particular, the financial sector reforms of the early 1990s—which significantly reduced the extent of financial repression—resulted in deficit financing at much closer to market rates. In the presence of large primary
6 Pay scales for central government civil servants are determined by the Pay Commission, a constitutionally mandated body that is established about every ten years. The Fifth Pay Commission (1997) recommended a three-fold increase in basic pay scales and downsizing of employment by 30 percent. State governments have tended to follow central government pay revisions. See Shome (2000) for further details.
7 See Lahiri (2000).

- 8 -
1990
/91
1991
/92
1992
/93
1993
/94
1994
/95
1995
/96
1996
/97
1997
/98
1998
/999
99/2
000
2000
/01
2001
/02
Cen
tral g
over
nmen
t def
icit
6.6
5.2
5.1
6.4
5.3
4.3
4.1
4.9
5.5
5.5
5.7
6.3
Rev
enue
10.0
10.4
10.2
9.2
9.4
9.7
9.5
9.2
9.0
9.8
9.7
9.3
Tax
7.6
7.7
7.2
6.2
6.7
6.9
6.8
6.3
6.0
6.6
6.5
5.8
Non
-tax
2.5
2.8
3.0
2.9
2.7
2.8
2.7
2.9
3.0
3.2
3.2
3.4
Fore
ign
gran
ts0.
10.
10.
10.
10.
10.
10.
10.
10.
10.
10.
00.
1
Expe
nditu
re16
.715
.815
.415
.714
.814
.113
.814
.114
.515
.315
.415
.6C
urre
n t13
.413
.112
.813
.112
.612
.312
.012
.312
.913
.313
.813
.7C
apita
l 3.
32.
72.
62.
62.
21.
81.
71.
81.
62.
01.
71.
9
Stat
e go
vern
men
t def
ici t
3.3
2.9
2.8
2.4
2.7
2.6
2.7
2.9
4.3
4.7
4.3
4.6
Rev
enue
12.0
12.7
12.2
12.3
12.1
11.6
11.2
11.3
10.2
10.6
11.4
11.2
Tax
7.9
8.1
8.1
8.0
8.0
7.8
7.8
8.2
7.4
7.5
8.1
8.1
Non
-tax
1.6
1.9
1.7
1.8
2.1
1.9
1.7
1.6
1.4
1.5
1.5
1.4
Gra
nts f
rom
cen
tral g
over
nmen
t2.
52.
72.
42.
52.
01.
81.
71.
51.
51.
51.
81.
7
Expe
nditu
re15
.315
.615
.014
.714
.914
.314
.014
.214
.515
.315
.615
.9C
urre
n t12
.613
.312
.912
.712
.712
.212
.312
.312
.613
.513
.914
.4C
apita
l 2.
72.
32.
22.
02.
22.
11.
62.
01.
91.
91.
81.
4
Sou
rce:
For
stat
es d
ata,
Res
erve
Ban
k of
Indi
a an
d W
orld
Ban
k St
ates
Dat
abas
e. C
entra
l gov
ernm
ent d
ata
is fr
om th
e M
inis
try o
f Fin
ance
in In
dia.
Tabl
e 5.
Tre
nds i
n C
ompo
sitio
n of
Cen
tral a
nd S
tate
Bud
gets
(In
perc
ent o
f GD
P)

- 9 -
deficits, this increase in government borrowing rates resulted in a substantial increases in the interest bill.8 Both tiers of government sought to offset these pressures by compressing capital outlays—general government investment spending now stands at a little more than 3 percent of GDP.
III. MACROECONOMIC CONSEQUENCES OF INDIA’S FISCAL IMBALANCES
12. Judged by the sheer size and persistence of fiscal imbalances and indebtedness, arguably the fiscal situation is the single biggest threat to macroeconomic stability in India. By the start of the current decade, fiscal imbalances in India had grown to such an extent that they were as large as they were prior to the 1991 balance of payments crisis (Table 6). Yet the adverse developments that would be expected from such sizable imbalances have not materialized. There is little evidence of sustained inflation pressures to date, external balances are strengthening, and there is little conventional (i.e., price-based) evidence of “crowding out.” These observations have prompted some to argue that the concern about fiscal deficits in India is misplaced.
13. In what follows we undertake a detailed examination of trends in key macroeconomic variables in an attempt to shed light on what seems to be an anomaly—large fiscal imbalances but no evidence of macroeconomic instability.
Growth, Saving and Investment
14. The link between fiscal deficits and debt and economic growth is one of the most widely debated relationships in the macroeconomics literature. One widely espoused theory arises from the neoclassical tradition which stresses that an increase in the deficit increases aggregate demand, raises real interest rates, depresses investment and thus overall economic growth. If this were the case, one would expect to see a negative causal relationship between fiscal deficits and growth. The Keynesian approach emphasizes that, in conditions of less than full employment, fiscal expansion will increase aggregate demand, and thus increase output, implying a positive causal relationship between fiscal deficits and
8 See IMF (2002a).
Pre-Crisis Current1990 2002/03
Real GDP (at factor cost) 1/ 5.6 4.3Per-capita real GDP (at factor cost) 1/ 5.1 2.5WPI inflation 1/ 10.2 3.6
10-year government bond yields 2/ 11.5 6.1General government deficit -9.6 -9.9General government debt 75.2 85.2
Current account balance (percent of GDP) 1/ -3.1 0.8Foreign reserves (US$ billion) 3/ 4.0 75.4
(in months of imports of goods and services) 1.5 9.0
External debt (percent of GDP) 3/ 23.0 20.1Short-term external debt (percent of GDP) 3/ 4.0 3.6Short-term external debt (percent of reserves) 2/ 252.5 24.4
1/ For 1990 Crisis, 1990/91.2/ For 1991.3/ For March 1991.
Table 6. India: Selected Indicators--Then and Now
(Annual percent change, unless otherwise indicated)

- 10 -
growth.9 A robust empirical finding is that there is a negative association between growth and fiscal deficits.10 However—as argued in Easterly (2004)—the direction of causality is much more difficult to establish. On the one hand, the finding of a negative association could be (as predicted from the neoclassicial approach) because fiscal deficits result in lower savings and investment and thus reduce growth. Alternatively, it could be that a fall in growth leads to larger budget deficits either through the working of automatic stabilizers (i.e., revenue falls with the decline in GDP growth), or because of the discretionary implementation of counter-cyclical fiscal policies in the face of falling growth. Recent empirical studies that have attempted to perform causality tests provide some suggestive evidence that the causality runs from higher fiscal deficits to lower growth, rather than the other way around.
15. We turn next to the evolution of growth, saving and investment in India over the past decade or so. Following the policies implemented in response to the 1991 balance of payments crisis, economic growth accelerated sharply in the period of the 8th Five Year Plan (1991/92-1996/97). Annual GDP growth in the five years to 1996/97 was 6¾ percent, the highest five-year moving average recorded in India since 1950 (Figure 2). The benefits of the reforms were most evident in private fixed investment growth, which surged to an average of 15¼ percent in the period. Acharya (2001) notes that this was “manifestly a boom time for the Indian economy.” Beginning in 1997/98, the economy went into a prolonged growth and investment slowdown so that the five-year average growth in 1997/98 to 2001/02 fell to 5¼ percent. The slowdown was broad based across sectors, particularly in agriculture and industry and largely reflected lackluster private fixed investment growth—which plummeted to an average of only 3¾ percent.11
9 A third approach—the Ricardian approach—that argues that fiscal deficits do not change national savings because individuals increase private saving to exactly offset the rise in the budget deficit has received very little empirical support in practice.
10 See Easterly (2003).
11 See IMF (2002b).
5.1
5.9
7.3 7.3
7.8
4.8
6.56.1
4.4
5.6
4.3
3
4
5
6
7
8
9
1992/93 1994/95 1996/97 1998/99 2000/01 2002/033
4
5
6
7
8
9
Figure 2. GDP Growth(In percent; at factor costs)
Source: CSO.
Mid-1990s average
Late-1990s average

- 11 -
16. Domestic saving and investment rates stagnated during the 1990s. While household saving continued to rise during the 1990s, domestic saving remained stagnant largely because of widening fiscal deficits (Figure 3). From a cross-country perspective, the private saving rate in India still compares reasonably well with other low-income countries in the region, but the overall saving rate has not kept pace with those countries experiencing more rapid growth, because of low public saving (Table 7). As for investment, domestic investment peaked in 1995/96 at 27 percent of GDP before falling steadily to below 24 percent in 2001/02, with private investment falling from 19 percent of GDP to around 17 percent of GDP in the same period (Table 8). Within this aggregate, the fall in private corporate investment has been the most marked, falling from a peak of 9¾ percent of GDP in 1995/96 to around 5 percent in 2002/03.
17. The dominant view is that the growth slowdown of the late 1990s was due, in part, to cyclical and exogenous factors, but that economic activity was also held back by the large fiscal imbalances and the loss of momentum of structural reforms. There are insufficient data since the start of reforms in India to conduct a statistical evaluation of the impact of fiscal imbalances on growth to establish the direction of causality between deficits and the growth slowdown. However, a simple eyeballing of the data suggests little evidence that the slowdown in growth “caused” the deterioration in fiscal imbalances (Figure 4).
Figure 3. India: Domestic Saving by Sectors, 1971/72-2001/02(In percent of GDP)
-10
-5
0
5
10
15
20
25
30
1971/72 1974/75 1977/78 1980/81 1983/84 1986/87 1989/90 1992/93 1995/96 1998/99 2001/02
HouseholdPrivate corporatePublicTotalGovernment administration 1/
Sources: Central Statistical Organization and Reserve Bank of India; CEIC; and Fund staff estimates.
2002/032000/011998/991996/971994/951992/931990/91
12
10
8
6
4
2
0
40
35
30
25
20
15
10
5
0
Percent change Percent of GDP
Source: Data provided by the Indian authorities.
growth
Figure 4. India: Growth, Government Expenditure, and Taxes
GDP Growth (left scale)General government revenue (right scale)General government expenditure (right scale)
1997 1998 1999 2000 2001 2002
Turkey 18.6 21.9 24.7 21.8 21.9 22.4Argentina 15.7 15.5 16.4 15.2 17.3 36.7India 21.8 22.3 24.6 25.4 26.3 26.2Hungary 26.1 24.2 23.5 22.1 23.2 25.1Philippines 15.4 21.0 27.6 28.3 23.8 27.3Brazil 21.2 21.7 19.5 19.7 18.3 20.2Indonesia 19.4 10.8 17.3 21.0 24.3 24.5Chile 18.4 18.9 20.0 18.8 17.5 19.4South Africa 17.7 15.6 15.1 15.0 12.9 14.2Russia 16.7 13.7 11.2 17.0 17.1 18.9Ecuador 14.9 15.5 19.6 19.5 15.9 13.2
Source: IMF, World Economic Outlook.
Table 7. Gross Private Saving in International Perspective
(In percent of GDP)

- 12 -
Tabl
e 8.
Indi
a: T
rend
s in
Savi
ng a
nd In
vest
men
t 1/
(In
perc
ent o
f GD
P)
1991
/92
1992
/93
1993
/94
1994
/95
1995
/96
1996
/97
1997
/98
1998
/99
1999
/00
2000
/01
2001
/02
2002
/03
1971
/72-
1980
/81
1981
/82-
1990
/91
1991
/92-
1996
/97
1997
/98-
2002
/03
Ann
ual A
vera
ge
Gro
ss d
omes
tic sa
ving
22.0
21.8
22.5
24.8
25.1
23.2
23.1
21.5
24.1
23.4
23.5
24.2
17.9
19.8
23.3
23.3
Priv
ate
sect
or20
.120
.221
.923
.223
.121
.521
.822
.525
.125
.726
.226
.114
.217
.021
.724
.6H
ouse
hold
17.0
17.5
18.4
19.7
18.2
17.0
17.6
18.8
20.8
21.6
22.7
22.6
12.6
15.2
18.0
20.7
Of w
hich
: fin
anci
al sa
ving
9.5
8.7
11.0
11.9
8.9
10.4
9.6
10.5
10.7
10.9
11.1
10.3
4.9
7.1
10.1
10.5
Priv
ate
corp
orat
e3.
12.
73.
53.
54.
94.
54.
23.
74.
44.
13.
53.
41.
61.
93.
73.
9Pu
blic
sect
or2.
01.
60.
61.
72.
01.
71.
3-1
.0-1
.0-2
.3-2
.7-1
.93.
82.
81.
6-1
.3O
f whi
ch: g
over
nmen
t adm
inis
tratio
n-1
.8-1
.7-3
.0-2
.6-2
.0-2
.3-2
.8-5
.1-5
.0-5
.4-6
.1-5
.72.
1-0
.3-2
.2-5
.0
Gro
ss in
vest
men
t22
.623
.623
.126
.026
.924
.524
.622
.625
.224
.023
.123
.318
.121
.824
.423
.8Pr
ivat
e se
ctor
13.5
15.1
14.1
16.3
19.1
16.6
17.4
15.6
17.8
17.2
17.1
17.5
9.9
12.1
15.8
17.1
Hou
seho
ld7.
78.
78.
08.
69.
47.
58.
78.
910
.911
.912
.012
.67.
67.
98.
310
.8Pr
ivat
e co
rpor
ate
5.8
6.4
6.1
7.7
9.7
9.0
8.7
6.7
6.9
5.3
5.1
4.9
2.4
4.2
7.5
6.3
Publ
ic se
ctor
9.1
8.5
9.0
9.7
7.8
7.9
7.2
6.9
7.4
6.8
6.0
5.8
8.2
9.7
8.6
6.7
Fore
ign
savi
ng0.
31.
70.
41.
01.
71.
21.
41.
01.
00.
5-0
.2-0
.80.
12.
01.
10.
5
Sour
ces:
Cen
tral S
tatis
tical
Org
aniz
atio
n; a
nd F
und
staf
f est
imat
es.
1/ O
n a
fisca
l yea
r bas
is b
egin
ning
Apr
il 1.

- 13 -
Revenues fell as a share of GDP almost continuously through the period, even during the years of very strong growth, suggesting that there was little if any relationship between revenue growth and overall economic growth during this period. As for expenditures, as seen in Table 5, general government expenditures fell as a ratio to GDP through the period of strong growth through 1997. From 1997/98, the ratio of expenditure to GDP began to pick up and by 2001/02, had risen back to the level of the first year of the IMF-supported stabilization program 1991/92. Apart from the impact of the 5th Pay Commission on the wage bill, this rise in expenditure to GDP ratio reflects, at least in part, the government’s efforts to counter the growth slowdown through countercyclical policies. As noted above, the economy’s growth performance in the late 1990s does not suggest that these attempts at using fiscal policy to stimulate growth were successful. A statistical analysis of the behavior of investment suggests that almost 70 percent of the slowdown in private investment in the late 1990s was due to a deterioration in the composition of public expenditures, which shifted toward public consumption and noninfrastructure investment (Figure 5).12
Inflation
18. The relationship between fiscal deficits and inflation is complex and depends on how deficits are financed as well as on the economic conditions prevailing in the economy. If the economy is at full employment, an expansion in the fiscal deficit will result in a rise in inflation pressures, in particular, if the deficit is financed by high-powered money creation. In India, several factors have worked to weaken the link between fiscal
12 See IMF (2002a).
0
5
10
15
20
25
30
35
1990/91 1992/93 1994/95 1996/97 1998/99 2000/010.0
2.0
4.0
6.0
8.0
10.0
12.0Public sector investment (left scale)Private sector investment (left scale)Real GDP growth (right scale)General government deficit (right scale)
Figure 5. India: Fiscal Deficits, Investment, and Growth, 1990/91-2002/03(In percent of GDP, unless otherwise indicated)
Figure 6. Nominal Interest Rates and Inflation(Percent per annum)
WPI inflation
91-day Treasury bills
Ten-year govt. bonds
0
2
4
6
8
10
12
14
16
1990/91 1991/92 1992/93 1993/94 1994/95 1995/96 1996/97 1997/98 1998/99 1999/00 2000/01 2001/02 2002/030
2
4
6
8
10
12
14
16

- 14 -
deficits and inflation. First, an important part of the reforms of the early 1990s was to sharply reduce the degree of monetization of fiscal deficits, thus weakening the direct link between fiscal deficits, high-powered money, and inflation. Moreover, with the growth and investment slowdown of the late 1990s, there has been considerable slack in the economy. Finally, global disinflationary trends, trade liberalization both in India and elsewhere, and the large foodgrain stocks have helped lower inflation and dampen inflationary expectations. Consequently, there has been a near secular decline in inflation during the 1990s (Figure 6) even in the presence of fiscal imbalances.
Interest Rates
19. Economic theory predicts a negative relationship between fiscal deficits and interest rates. In particular, a rise in deficits leads to lower saving and thus to higher interest rates. However, empirical studies typically find only a negligible impact of deficits on interest rates. In part, this is due to the fact that deficits can widen when the economy slows down—an event that typically coincides with a decline in investment demand which could result in a fall in interest rates. Gale and Orszag (2002) argue that most of these studies have not adequately taken into account that in forward-looking markets, interest rates respond to expected future deficits and debt. Using data from the United States, they find that for a 1 percentage point of GDP increase in the fiscal deficit leads to a 50 basis point increase in bond yields. They also show a positive correlation between five-year cumulative deficits and spreads between long- and short-term bonds.
20. The link between fiscal deficits and interest rates in India is complicated by the slowdown in activity and the significant structural changes that have taken place in financial markets since the start of the reforms. Policy interest rates and interest rates on newly issued government debt have come down markedly since 1997/98. Moreover, the authorities have managed to engineer a lengthening of maturities of domestic debt without the usual side effects of a rise in long-term interest rates (Table 9). The trend of declining interest rates and spreads between long- and short-term paper is due both to cyclical and structural factors. As noted above, inflation has come down steadily, and with it, inflation expectations. In addition, global monetary easing together with the progress in deepening the government securities market has helped bring about a secular decline in interest rates on newly issued government debt. Other factors that have worked to keep interest rates on a declining trend despite rising fiscal deficits include (i) the slowdown in private investment and thus credit demand, (ii) the
Weighted AverageWeighted Average Range of Maturity Weighted Average Maturity of
Yield of New Issues Maturity Outstanding StocksYears (In percent) (Years) (Years) (Years)
1997-98 12.0 3-10 6.6 6.51998-99 11.9 2-20 7.7 6.31999-00 11.8 5-19 12.6 7.12000-01 11.0 2-20 10.6 7.52001-02 9.4 7-30 14.3 8.22002-03 7.3 8-29 13.8 8.9
Source: Table 11.4, Reserve Bank of India, Annual Report 2002-03, page 191.
Table 9. Maturity Structure of Central Government Securities

- 15 -
availability of ample liquidity as the RBI attempted to provide a supportive environment for investment, and (iii) the existence of a large number of publicly-owned financial institutions willing to absorb long-dated paper without demanding a premium. The absence of a tradition of medium-term budgeting suggests that the forward-looking channel discussed above—namely, the link between interest rates and expected future deficits and debt—is blunted.
External Balances
21. How are fiscal deficits and external balances linked? There are a number of complex links between these macroeconomic variables. First, the fall in domestic saving associated with fiscal deficits could lead to widening current account imbalances. However, this result depends on the cyclical conditions prevailing in the economy when the deficit rises, the degree of openness of the economy and the degree of flexibility in the management of the exchange rate. Not only has India suffered no ostensible negative effects of the large fiscal imbalances on its external balances, by a critical measure of external strength—namely, foreign exchange reserves—India is at an unprecedented high point (Figure 7).
22. Another link between deficits and external balances is through the financing of government debt. A critical reason that India has managed to avoid a disruptive crisis and serious macroeconomic difficulties even with an unsustainable debt position relates to the profile of public debt. Relative to the recent large emerging market crisis countries—Argentina, Brazil, and Turkey—and even relative to the 1990/91 crisis, the proportion of government debt financed externally is small and largely is on concessional terms (Table 10). This, together with the fact that India has an unimpeachable credit history with no defaults, has meant
IVIIIVIIIVIIIVIIIVII20032002200120001999
110100
9080706050403020
1101009080706050403020
US$ billion
Source: Reserve Bank of India.
Figure 7. India: International Reserves
reserves
Gross reservesNet of forward obligations
1995 1998 2002 1995 1998 2002
Turkey 29.5 55.8 59.9 70.5 44.2 40.1Argentina 32.3 26.8 35.6 67.7 73.2 64.4India 1/ 76.4 82.0 89.6 23.6 18.0 10.4Hungary 38.1 50.6 53.5 61.9 49.4 46.5Philippines 60.6 58.6 56.6 39.4 41.4 43.4Brazil 80.1 86.3 74.0 19.9 13.7 26.0Indonesia 0.0 21.8 44.2 100.0 78.2 55.8Chile 60.2 60.6 48.4 39.8 39.4 51.6South Africa 95.5 95.5 79.9 4.5 4.5 20.1Russia 0.0 29.6 18.1 100.0 70.4 81.9Ecuador 10.7 14.6 19.1 89.3 85.4 80.9
Source: IMF, Research Department.
1/ Gross where possible; if not use net debt and footnote accordingly. May need toapproach PDR for this (their debt templates). Use general government where possible; if not use what is available and footnote.
(In percent of total public debt)
Table 10. Evolution of the Composition of Public Debt
Ratio of Domestic Debt/Total General Government DebtTotal General Government Debt
Ratio of External Debt/

- 16 -
that India has essentially escaped the dangers associated with the “original sin.” Moreover, as already discussed, the authorities were able to reduce rollover risk by taking advantage of the ample liquidity in the system and the sluggishness in private credit demand to lengthen maturities of public debt, mostly held by banks and financial institutions.
23. Although overt signs of major economic problems have not yet manifested themselves, the effects on the economy of the persistently large fiscal imbalances nevertheless have been insidious. The discussion thus far suggests that the coincidence of major structural changes in the economy with global shocks makes it very difficult to discern clear effects from India’s fiscal imbalances on broad macroeconomic aggregates. In what follows, we will outline some of the most disturbing trends arising from the deterioration in the public finances. We will argue that, notwithstanding the success in preserving macroeconomic stability, lax fiscal policies have exacted a cost from the economy in terms of growth and poverty alleviation. With more than 400 million people living on less than $1 a day, the deterioration in growth performance has serious implications for India’s ability to make significant inroads into poverty. The deterioration of states’ finances is of particular concern in this regard. Srinivasan (2001) notes that “one cannot underestimate the deleterious consequences of the parlous state of the fiscal health of states for poverty alleviation....”
The quality of public expenditure has deteriorated
24. A key manifestation of the negative consequences of the large fiscal imbalances is deterioration in the composition of public spending. In particular, public capital expenditure has fallen sharply (Figure 8) and a growing proportion of revenues is used each year to service public debt. As pointed out above, public infrastructure spending bore the brunt of efforts to contain the extent of fiscal deterioration in large part because it was the least politically difficult to cut. In India, several empirical studies have found a strong positive effect of public sector investment in infrastructure on private investment (RBI 2000/01, IMF 2002a, and Ahluwalia 2002). Thus, although these cuts did help contain the deficit in the near term, they are having serious deleterious effects on private investment and on medium term growth. Moreover, even within current expenditures, there has been a deterioration in the composition with a progressively larger share of current spending being devoted to
Figure 8. India: Ratio of Capital to Current Spending(Index: 1990/91=100)
40
50
60
70
80
90
100
110
1990/91 1992/93 1994/95 1996/97 1998/99 2000/0140
50
60
70
80
90
100
110
Source: IMF staff calculations.
- 17 -
debt services. Despite the fall in interest rates on government debt issued since 1997/98, the nominal effective interest rate on government debt13 continued to rise through 1999/00, before starting to decline slightly since 2000/01. Even more striking is the fact that the real effective interest rates on government debt has actually risen—from 3¼ percent in 1997/98 to 6¾ percent in 2001/02. Consequently, as noted above, India now is dangerously close to an internal debt trap where new debt has to be incurred just to service the previously contracted debt. In addition, structural impediments in the banking system and administered interest rates on small savings have prevented the fall in policy rates from being translated into lower lending rates. Indeed, real bank lending rates have hardly declined from their 1996/97 peaks (this point is discussed further below).
Private savings are being pre-empted
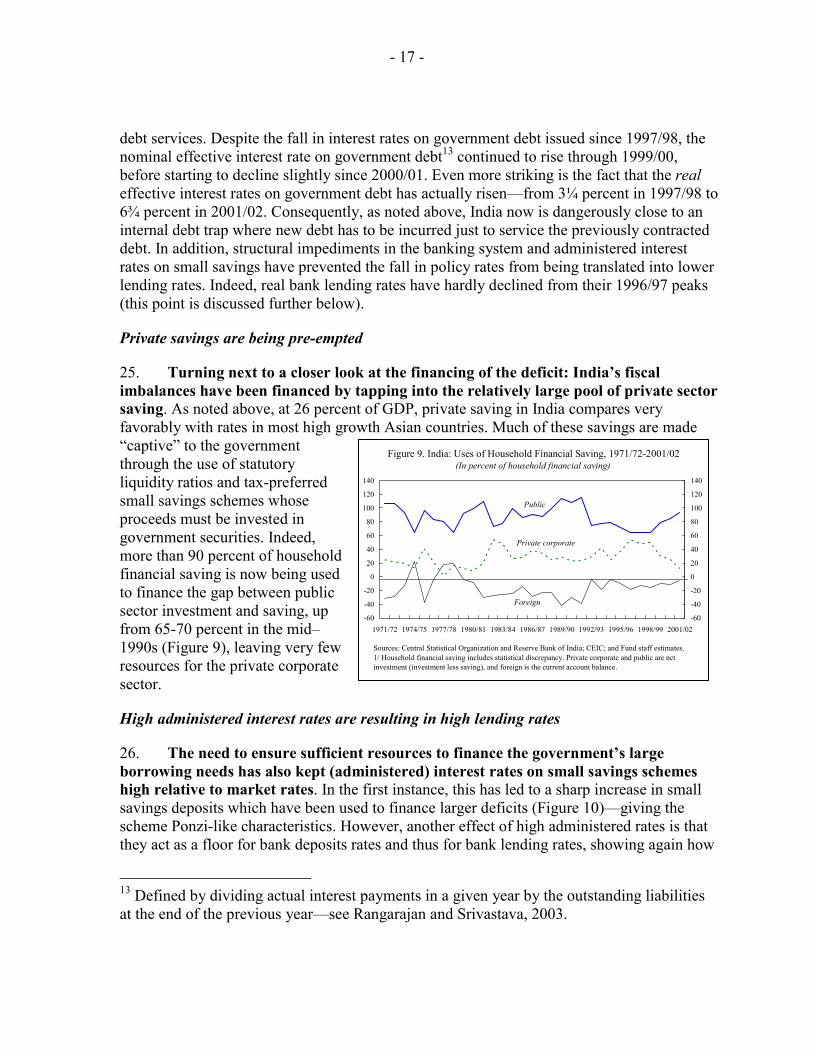
25. Turning next to a closer look at the financing of the deficit: India’s fiscal imbalances have been financed by tapping into the relatively large pool of private sector saving. As noted above, at 26 percent of GDP, private saving in India compares very favorably with rates in most high growth Asian countries. Much of these savings are made “captive” to the government through the use of statutory liquidity ratios and tax-preferred small savings schemes whose proceeds must be invested in government securities. Indeed, more than 90 percent of household financial saving is now being used to finance the gap between public sector investment and saving, up from 65-70 percent in the mid–1990s (Figure 9), leaving very few resources for the private corporate sector.
High administered interest rates are resulting in high lending rates
26. The need to ensure sufficient resources to finance the government’s large borrowing needs has also kept (administered) interest rates on small savings schemes high relative to market rates. In the first instance, this has led to a sharp increase in small savings deposits which have been used to finance larger deficits (Figure 10)—giving the scheme Ponzi-like characteristics. However, another effect of high administered rates is that they act as a floor for bank deposits rates and thus for bank lending rates, showing again how
13 Defined by dividing actual interest payments in a given year by the outstanding liabilities at the end of the previous year—see Rangarajan and Srivastava, 2003.
Public
Private corporate
Foreign
-60
-40
-20
0
20
40
60
80
100
120
140
1971/72 1974/75 1977/78 1980/81 1983/84 1986/87 1989/90 1992/93 1995/96 1998/99 2001/02-60
-40
-20
0
20
40
60
80
100
120
140
Sources: Central Statistical Organization and Reserve Bank of India; CEIC; and Fund staff estimates.1/ Household financial saving includes statistical discrepancy. Private corporate and public are net investment (investment less saving), and foreign is the current account balance.
Figure 9. India: Uses of Household Financial Saving, 1971/72-2001/02(In percent of household financial saving)

- 18 -
the fiscal exigency has resulted in higher real interest rates for borrowers—and is acting as a dampener on private investment.
Fiscal dominance of monetary policy leaves no room for maneuver in the face of shocks
27. The fiscal situation allows little room for maneuver in the face of shocks. Following the balance of payments crisis, monetary policy has remained singularly focused on keeping a lid on inflation and reducing external vulnerability. In the presence of continued fiscal profligacy, this has meant that monetary policy has had to be tighter than it would otherwise have been and this has, in turn, dampened private investment (Kapur and Patel, 2003, and Lal, Bery and Pant, 2003). Moreover, the RBI is constrained in its options for coping with the surge in capital inflows of the past 12-18 months. The preferred policy has been to allow only a modest appreciation of the rupee combined with significant sterilized intervention. However, the scope for continued sterilized intervention is narrowing as stock of government securities that the RBI can use for sterilized intervention dwindles. Nevertheless, the RBI has had to rule out the issuance of its own bills, as has been done in several emerging market economies to facilitate sterilization, because of the large deficits and borrowing needs of the government.
Risks are rising in the banking sector
28. The large and compliant public sector banking system also plays an important role in preventing the spillover of large deficits into visible macroeconomic difficulties in the short term. The government requires banks to hold 25 percent of their deposits in the form of government securities—the so-called statutory liquidity ratio (SLR). However, partly owing to low credit demand from the private sector, banks have currently invested nearly 42 percent of their deposits in government securities (Table 11). Indeed, latest data from the RBI indicates that banks invested 66 percent of the incremental deposits thus far in 2003–04 in government securities. Banks systematically hold more than the SLR, but the
Balance with InvestmentReserve Bank of Non-Food in Government
India Credit Securities
1980s 12.6 60.3 24.21990s 12.1 52.8 29.82003 5.8 53.1 41.6
Source: Reproduced from Bhattacharya and Patel (2003). Original data fromReserve Bank of India, Reports on Currency and Finance and Trends and Progress of Banking in India.
Table 11. Banks Allocation of Loanable Funds
(As a percent of deposits at end-March)
Figure 10. India: Trends in Small Savings, 1991/92-2002/03 1/
2
4
6
8
10
12
14
16
18
1991/92 1993/94 1995/96 1997/98 1999/00 2001/022
4
6
8
10
12
14
16
18
Sources: Data provided by Reserve Bank of India; and Fund staff estimates.1/ For fiscal year beginning April 1.
Change in small savings as share of annual household financial saving (through
2001/02) Small savings in percent of GDP (end of fiscal
)

- 19 -
gap between actual holdings of government securities and SLR is much larger for the public sector banks than for other banks (domestic private, and foreign banks) (Table 12). More importantly, investments with duration of over three years by public sector banks currently account for nearly 75 percent of these banks’ total investments in securities, while the bulk of their liabilities (nearly 80 percent) are of a one- to three-year maturity. Thus, these banks face significant interest rate risk—an increase in interest rates would result in a significant erosion of profitability, and could also weaken their capital positions and their ability to effectively intermediate credit.14
Progress with global integration is constrained
29. The fiscal situation acts as a constraint on India’s progress towards global integration. Notwithstanding the significant reduction in tariffs and quantitative restrictions of the past decade, India’s trade regime is amongst the most restrictive in the world. However, further reduction and simplification of tariffs is being held up because of the adverse implications of reducing the revenues from customs duties. Another manifestation of constraints is the fact that the authorities have not been able to address one of the main impediments to investment (including FDI)—namely the acute infrastructure bottlenecks. Lahiri (2000) notes that the precarious fiscal position holding up the progress of banking reforms in the process and is slowing down the introduction of capital account convertibility.
Favorable demographic trends cannot be counted on to save the day
30. According to this view, fiscal imbalances may not be relevant because the highly favorable demographic trends facing India are conducive to higher savings to finance an acceleration in investment and growth. Proponents of this view point out that the share of working age population is expected to increase significantly until 2035. They note that, because the working age population has a higher propensity to save, India will benefit from favorable savings trends, which will help fuel rapid growth. This argument, however, rests on the critical assumption that the economy will be able to create the conditions necessary for the large numbers of people that will join the workforce to be gainfully employed. Unfortunately, the track record on employment creation in the past decade has not been stellar. The rate of job growth fell from 2¾ percent per annum between 1983 and 1994 to a little over 1 percent per annum between 1994 and 2000. Thus, notwithstanding generally favorable demographic trends, India’s medium-term economic prospects depend critically
14 See Patnaik and Shah (2002), in which a large positive interest rate shock is simulated over a year for a sample of 42 major domestic banks in India. Twenty-five banks had ‘reverse’ exposures (i.e., they could lose between 25 percent and 105 percent of their equity capital); only nine banks were adequately hedged.

- 20 -
Tabl
e 12
. Ind
ia: G
over
nmen
t Sec
uriti
es H
oldi
ngs o
f Sch
edul
ed C
omm
erci
al B
anks
1/
1991
/92
1992
/93
1993
/94
1994
/95
1995
/96
1996
/97
1997
/98
1998
/99
1999
/00
2000
/01
2001
/02
2002
/03
1991
/92-
1996
/97
1997
/98-
2002
/03
Ann
ual A
vera
ge
(In
perc
ent o
f ban
k as
sets
)
Gov
ernm
ent a
nd o
ther
app
rove
d se
curit
ies h
oldi
ngs o
f SC
Bs
25.6
26.5
30.0
27.6
25.8
26.8
26.0
26.0
27.1
28.0
27.3
32.0
27.1
27.7
Pu
blic
sect
or b
anks
26.7
27.7
31.3
29.4
27.7
28.8
27.9
27.8
29.0
30.3
31.3
34.8
28.6
30.2
Of w
hich
: gov
ernm
ent s
ecur
ities
18.1
19.4
23.7
22.7
22.0
23.9
23.7
24.5
26.4
28.1
29.5
33.4
21.6
27.6
O
ther
ban
ks19
.219
.922
.519
.117
.518
.919
.319
.520
.520
.316
.524
.319
.520
.1
O
f whi
ch: g
over
nmen
t sec
uriti
es15
.517
.320
.117
.115
.617
.417
.918
.319
.519
.716
.123
.917
.219
.2
(In
perc
ent o
f ban
ks' d
eman
d an
d tim
e lia
bilit
ies)
Gov
ernm
ent a
nd o
ther
app
rove
d se
curit
ies h
oldi
ngs o
f SC
Bs
35.0
36.2
39.4
36.7
35.4
35.2
33.9
34.0
35.4
36.5
36.8
42.0
36.3
36.5
Pu
blic
sect
or b
anks
36.0
37.1
41.0
38.6
37.4
37.2
35.6
35.3
36.7
37.9
39.0
42.8
37.9
37.9
Of w
hich
: gov
ernm
ent s
ecur
ities
24.5
26.0
31.0
29.8
29.7
30.8
30.3
31.1
33.4
35.2
36.8
41.0
28.6
34.6
O
ther
ban
ks28
.330
.130
.226
.725
.526
.527
.028
.730
.331
.128
.839
.327
.930
.9
O
f whi
ch: g
over
nmen
t sec
uriti
es22
.926
.127
.024
.022
.724
.425
.127
.028
.930
.128
.038
.624
.529
.6
Sour
ces:
Res
erve
Ban
k of
Indi
a (R
BI);
and
Fun
d st
aff e
stim
ates
.
1/ O
n a
fisca
l yea
r bas
is b
egin
ning
Apr
il 1.

- 21 -
on progress with the closely intertwined tasks of fiscal consolidation and structural reforms. Together, such actions would strengthen the public finances, improve the efficiency of resource allocation and could trigger a virtuous economic cycle.
Is there any merit in trying to use fiscal policy to stimulate the economy?
31. Before closing this discussion, it is worth looking at an alternative argument that has been made about fiscal policy in India. This argument is based on the premise that a cutback in government investment in the attempt to contain the deficit contributed to the deceleration in private investment. Further it is argued, that with the large foreign exchange reserves acting as a buffer against external vulnerability and the ample foodstocks providing protection against a run-up in inflation, fiscal policy should be aimed at countering the slump in private demand.15 While this argument has some prima facie merit, there are several factors that would work against it. With the already unsustainably high debt and the fact that over 90 percent of net household financial savings are already being used to finance the fiscal gap, the only way for the government to step up spending in infrastructure spending is to make room for it through increases in revenues or cuts in other spending—a task that has not yet proven manageable. Second, as discussed above, there is some evidence that the authorities have been attempting to run such a counter-cyclical policy since 1997/98, without a discernible impact on growth. This is in line with the findings of recent careful empirical studies that fiscal multipliers are positive but very small.16 This is also at least suggestive evidence that a Keynesian-type fiscal stimulus may not work smoothly in the presence of significant structural impediments to resource reallocation.17
IV. CONCLUDING REMARKS
32. Although policy makers in India recognize the need for fiscal action and even the measures that need to be taken, fiscal adjustment in a country like India will not be easy.18 A very important first step has been taken to overcome political obstacles to fiscal adjustment. Following several failed attempts at reducing imbalances in the past, there is now
15 Rakshit (2000).
16 See Hemming, Kell, and Mahfouz (2002).
17 Of course, a decisive conclusion requires examining the counterfactual question of what would have happened if no attempts were made at countercyclical policy and/or stronger efforts were made to push ahead with fiscal consolidation.
18 The Prime Minister’s Economic Advisory Council wrote in February 2001, “The fiscal situation is undoubtedly one of the most serious weaknesses in the economy at present and corrective action in this area is urgently needed.” The RBI’s Annual Report for 2002–03 notes, “Arresting the dissaving in the public sector and halting the pre-emption of private saving by burgeoning public sector revenue deficits is critical to the drive for mobilizing finances for growth.”

- 22 -
a movement towards a rules-based approach to fiscal adjustment, as embodied in the recently enacted Fiscal Responsibility and Budget Management Act. There is also recognition that adjustment has to take place at both levels of government—the center and the states. This is evidenced by the recent initiatives to make some transfers to the states conditional on reforms, the efforts to restructure states’ debt and the passage by some states of their own fiscal responsibility legislation.
33. The specific measures that are needed to achieve fiscal consolidation are well-known and well-researched in India through the many task forces and committees set up to recommend reforms. Given India’s relatively low tax burden and large expenditure needs, the focus should be on raising more revenues in the least distortionary way possible and to reorient spending from wasteful areas to ones where India has dire needs—health, education, and physical infrastructure—and where spending is most conducive to sustained growth. In this context, the subnational VAT—now delayed more than three years—holds the key to creating a buoyant and efficient revenue raising mechanism, in part by facilitating the extension of service taxation and by helping bring down barriers to inter-state trade. Likewise, the removal of exemptions that create the opportunity for gaming the system should also receive high priority.
34. Given the large infrastructure gap, the bulk of the increase in tax revenues so raised should be directed toward infrastructure needs. The Infrastructure Report of 1996 and more recently, the World Bank suggests that gross domestic investment in infrastructure will need to nearly double from the present level of about 5 percent of GDP to 8 percent of GDP to support the government’s growth targets. Although there is scope for the private sector to finance some of this gap, a large part of the needed investment will have to be made by the public sector in the areas where the gaps are the largest, namely power, water, and rural infrastructure.
35. India can no longer afford to be complacent about the impact of fiscal imbalances on the macroeconomy. Although, to date, India has largely avoided the severely disruptive macroeconomic consequences of large fiscal deficits, the deficits and accumulated debt are taking a significant toll on the economy in terms of foregone growth and poverty reduction. The recent turnaround in activity—driven by a cyclical rebound in agriculture, continued resilience of the services sector, as well as the a revival in the manufacturing sector following a long period of corporate restructuring and cost cutting—is indeed a cause for optimism. However, it could also bring an end to the government’s ability to borrow without facing any competition from the private sector, as it has been able to do in the past few years. As argued by Kapur and Patel (2003), “While it is indeed the case that nominal interest rates have declined in recent months, real interest rates have declined only modestly and the crux here is how long can rates continue to be low against a background of an inherently loose fiscal stance and reversal of downward pressure on inflation.” Thus in the absence of a strong effort to reduce the public sector’s unrelenting demand on the economy’s resources, a strengthening of private sector activity will inevitably result in a rise in inflation and interest rates, and/or a real appreciation of the rupee. In turn, this would result in an unfortunate erosion in the hard-won improvement in the financial health of the corporate sector, and could abort the long awaited private sector revitalization.

- 23 -
References
Acharya, Shankar, 2001, “Macroeconomic Management in the Nineties,” New Delhi: Indian Council of Research on International Economic Relations. Ahluwalia, Montek, 2002, “Economic Reforms in India Since 1991: Has Gradualism Worked?,” Journal of Economic Perspectives, (Summer). Easterly, William, 2004, “The Widening Gyre: The Dynamics of Rising Public Debt and Falling Growth,” paper presented at the NIPFP/IMF Conference on Fiscal Policy in India (January). Eichengreen, Barry, Ricardo Hausmann and Ugo Panizza, “Original Sin: The Pain, the Mystery, and the Road to Redemption,” Working Paper No. 10036. Gale, W. and P. Orszag, 2002, The Economic Effects of Long-Term Fiscal Discipline,”
Urban-Brookings Tax Policy Center Discussion Paper. Hemming, Richard, Michael S. Kell, and, Selma Mahfouz, 2002, “The Effectiveness of Fiscal Policy in Stimulating Economic Activity—A Review of the Literature,”
IMF Working Paper No. 02/208 (Washington: International Monetary Fund). International Monetary Fund, 2002a, “ The Fiscal Situation in International Perspective” in India: Selected Issues and Statistical Appendix, IMF Country Report 02/193
(Washington: International Monetary Fund). International Monetary Fund, 2002b, “ Recent Trends in Growth and Investment” in India: Selected Issues and Statistical Appendix, IMF Country Report 02/193
(Washington: International Monetary Fund). International Monetary Fund, 2003, “State Government Finances,” in India: Selected Issues and Statistical Appendix, IMF Country Report 03/261 (Washington: International Monetary Fund). Kapur, Devesh and Urjit Patel, 2003, “Large Foreign Currency Reserves: Insurance for
Domestic Weakness and External Uncertainties?,” Economic and Political Weekly, March 2003
Lahiri, Ashok, 2000, “Budget Deficits and Reforms,” Economic and Political Weekly, (November). Lal, Deepak, Suman Bery and Devendra Kumar Pant, 2003, “The Growth Slowdown: Real Exchange Rate Misalignment, Fiscal Deficits and Capital Flows,” NCAER, New Delhi (unpublished), available in PDF format at www.ncaer.org. Lorie, Henri, 2003, “Priorities for Further Fiscal Reforms in the Commonwealth of

- 24 -
Independent States,” IMF Working Paper 03/209 (Washington: International Monetary Fund). Patnaik, Ila, and Ajay Shah, 2002, Interest Rate Risk in the Indian Banking System, ICRIER Working Paper No. 92 (December). Rakshit, Mihir, 2000, “On Correcting Fiscal Imbalances in the Indian Economy – Some Perspective,” Money and Finance, ICRA Bulletin (July-September). Rangarajan, C, and D. K. Srivastava, 2003, “Dynamics of Debt Accumulation in India: Impact of Primary Deficit, Growth and Interest Rate,” Economic and Political Weekly, pp. 4851–4858 (November). Reserve Bank of India, 2002, Report on Currency and Finance 2000–01 (Mumbai). Reynolds, Patricia, 2001, “Fiscal Adjustment and Growth Prospects in India,” in India at a Crossroads: Sustaining Growth and Reducing Poverty, edited by Tim Callen, Patricia Reynolds and Christopher Towe (Washington: International Monetary Fund). Shome, Parthasarathi, 2000, “India: Primary Aspects of a Medium Term Fiscal Strategy” (New Delhi: Indian Council of Research on International Economic Relations). Srinivasan, T.N., 2001, “India’s Fiscal Situation: Is a Crisis Ahead?,” Working Paper No. 92, Center for Research on Economic Development and Policy Reform, Stanford University (February).