macroeconomics chapter 8 - kevin...
TRANSCRIPT

MacroeconomicsCHAPTER 8
Long-Run Economic GrowthPowerPoint® Slides
by Can Erbil© 2006 Worth Publishers, all rights reserved

2
What you will learn in this chapter:
How long-run growth can be measured by the increase in real GDP per capita, how this measure has changed over time, and how it varies across countries
Why productivity is the key to long-run growth, and how productivity is driven by physical capital, human capital, and technological progress
The factors that explain why growth rates differ so much among countries
How growth has varied among several important regions of the world and why the convergence hypothesis applies to economically advanced countries

3
Comparing Economies Across Time and Space

4
U.S. Real GDP per Capita

5
Income Around the World

6
Growth Rates
How did the United States manage to produce nearly seven times more per person in 2000 than in 1900, a nearly 600% increase in real GDP per capita?
A little bit at a time.
Long-run economic growth is normally a gradual process, in which real GDP per capita grows at most a few percent per year. During the twentieth century, real GDP per capita in the United States increased an average of 1.9% each year.
7
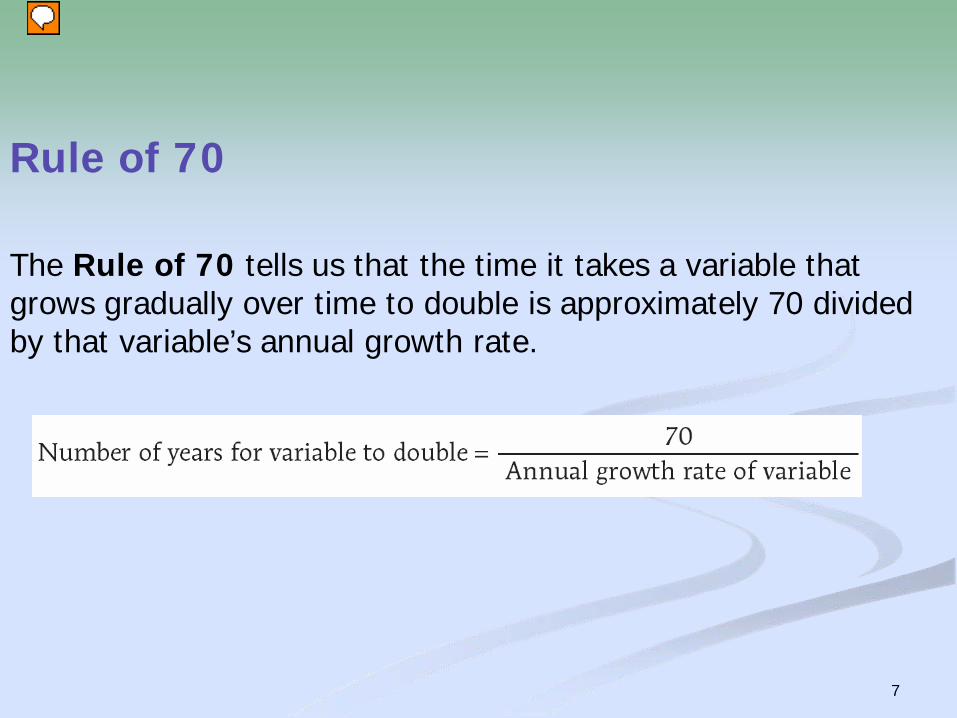
Rule of 70
The Rule of 70 tells us that the time it takes a variable that grows gradually over time to double is approximately 70 divided by that variable’s annual growth rate.

8
Average Annual Growth Rates of Real GDP per Capita, 1975–2003

9
Economics in Action: The Luck of the Irish
In the nineteenth century, Ireland was desperately poor.Even as late as the 1970s, Ireland remained one of the
poorest countries in Western Europe, poorer than Latin American countries such as Argentina and Venezuela.
But for the last few decades real GDP per capita has grown almost as fast in Ireland as in China, and all that growth has made Ireland richer than most of Europe: Irish real GDP per capita is now higher than in the United Kingdom, France, and Germany.
Why has Ireland, after centuries of poverty, done so well? A very good infrastructure and human capital.

10
The Sources of Long-Run Growth - Definitions:
Labor productivity, often referred to simply as productivity, is output per worker.
Physical capital consists of human-made resources such as buildings and machines.
Human capital is the improvement in labor created by the education and knowledge embodied in the workforce.
Technology is the technical means for the production of goods and services.
12
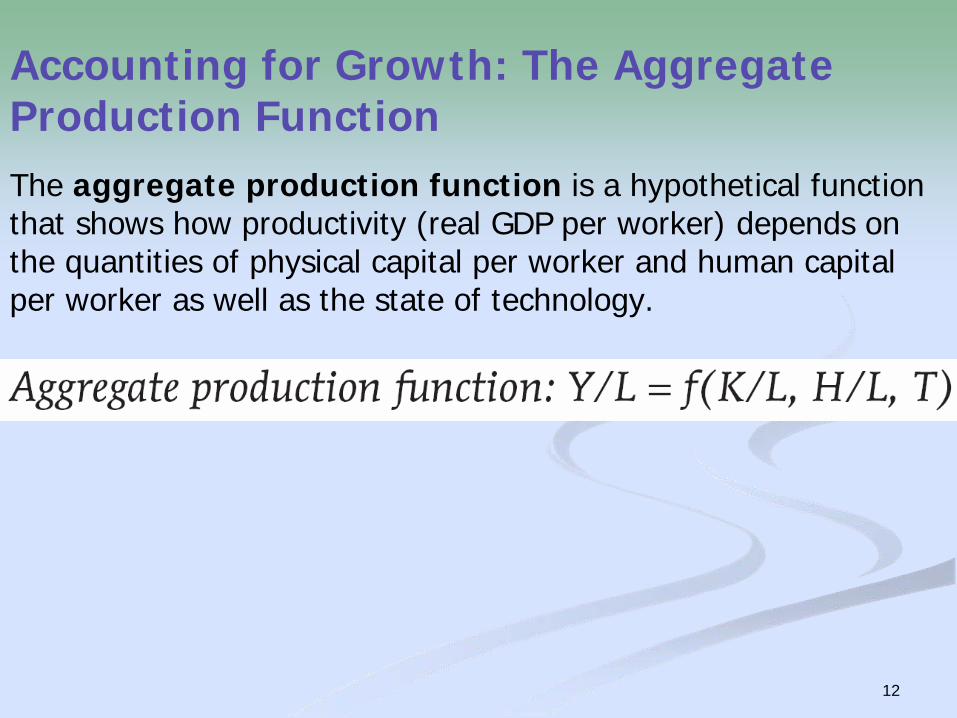
Accounting for Growth: The Aggregate Production FunctionThe aggregate production function is a hypothetical function that shows how productivity (real GDP per worker) depends on the quantities of physical capital per worker and human capital per worker as well as the state of technology.

13
Diminishing Returns to Physical Capital
An aggregate production function exhibits diminishing returns to physical capital when, holding the amount of human capital and the state of technology fixed, each successive increase in the amount of physical capital leads to a smaller increase in productivity.

14
Physical Capital and Productivity

15
Growth Accounting
Growth accounting estimates the contribution of each major factor in the aggregate production function to economic growth.
The amount of physical capital per worker grows 3% a year.
According to estimates of the aggregate production function, each 1% rise in physical capital per worker, holding human capital and technology constant, raises output per worker by 1⁄3 of 1%, or 0.33%.
16
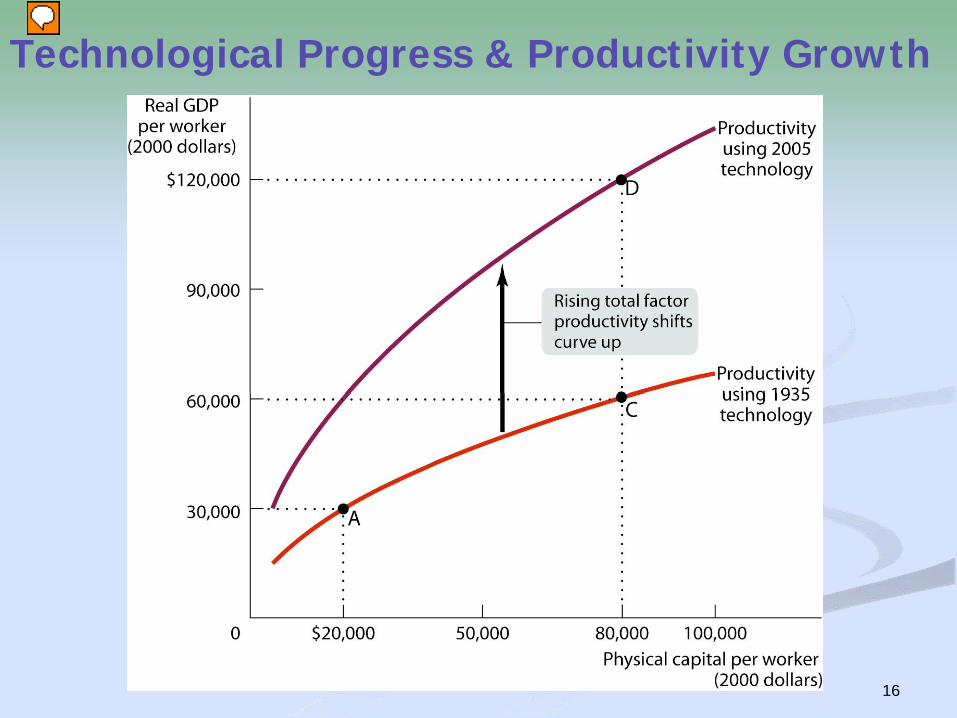
Technological Progress & Productivity Growth

18
What about Natural Resources?
In contrast to earlier times, in the modern world, natural resources are a much less important determinant of productivity than human or physical capital for the great majority of countries.
For example, some nations with very high real GDP per capita, such as Japan, have very few natural resources. Some resource-rich nations, such as Nigeria (which has sizable oil deposits), are very poor.

20
Why Growth Rates Differ
A number of factors influence differences among countries in their growth rates.
These are government policies and institutions that alter:
savings and investment spending
foreign investment
education
infrastructure
research and development
political stability
the protection of property rights

22
Political Stability, Property Rights, and Excessive Government Intervention
Political stability and protection of property rights are crucial ingredients in long-run economic growth.
There’s not much point in investing in a business if rioting mobs are likely to destroy it or saving your money if someone with political connections can steal it.
Even when governments aren’t corrupt, excessive government intervention can be a brake on economic growth.
If large parts of the economy are supported by government subsidies, protected from imports, or otherwise insulated from competition,productivity tends to suffer because of a lack of incentives.

23
Poor Countries Regulate Business the most…

24
Success, Disappointment, and Failure

25
Success, Disappointment, and Failure
The world economy contains examples of success and failure in the effort to achieve long-run economic growth.
East Asian economies have done many things right and achieved very high growth rates.
In Latin America, where some important conditions are lacking, growth has generally been disappointing.
In Africa, real GDP per capita has declined for several decades, although there are some signs of progress now.

26
Success, Disappointment, and Failure
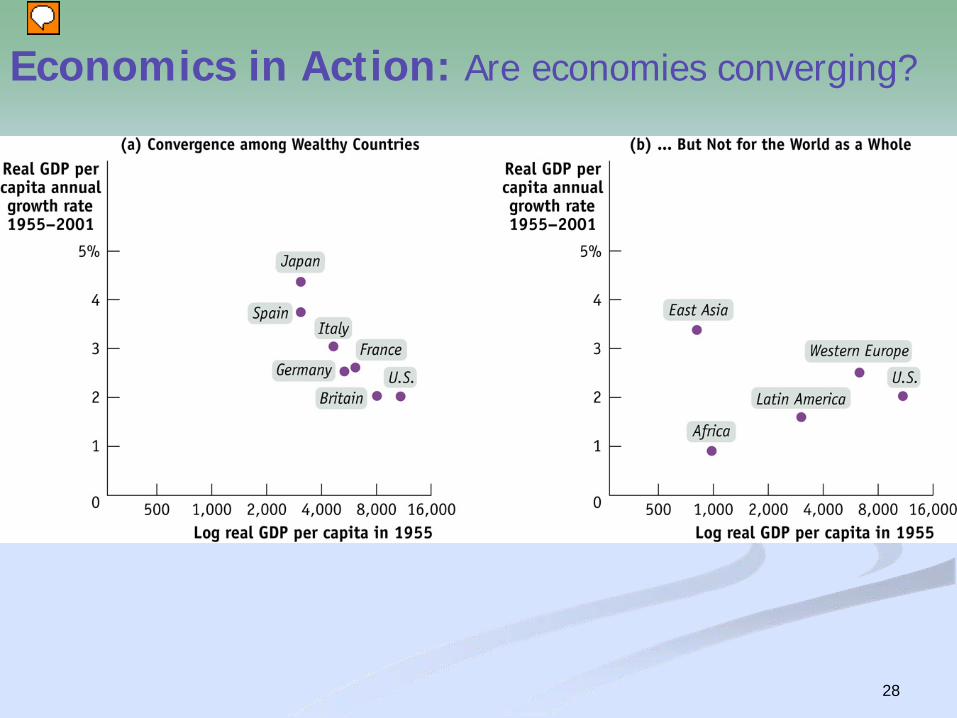
The growth rates of economically advanced countries have converged, but not the growth rates of countries across the world.
This has led economists to believe that the convergence hypothesis fits the data only when factors that affect growth, such as education, infrastructure, and favorable policies and institutions, are held equal across countries.
28
Economics in Action: Are economies converging?

29
The End of Chapter 8
coming attraction: Chapter 9:
Savings, Investment Spending, and the Financial
System