macromolecule stability curves - umass amherst · p - a feature that distinguishes protein...
TRANSCRIPT

Chem728 page 1 Spring 2012
Macromolecule Stability Curves Macromolecule Transitions - We have discussed in class the factors that determine the spontaneity of processes using conformational transitions of macromolecules as examples. Three commonly studied macromolecular transitions include the unfolding of Ribonucleic acids (RNA, e.g. transfer RNA), Deoxyribonucleic acids (DNA), and proteins. All of these macromolecules are known to exhibit conformational transitions when solutions are heated. Oligonucleotide DNA duplexes (dsDNA) which are stable at low temperatures undergo strand dissociation to form single-stranded DNA. Transfer RNA (tRNA) undergoes an unfolding transition from its 'cloverleaf' stem-loop structure to a random coil (disordered) conformation state. Finally proteins change from a folded and relatively ordered native conformation to an unfolded random coil through a cooperative process. Native and Denatured States – In some respects it over-simplifies the situation to say that there is one ordered and one disordered state, the nomenclature is nevertheless convenient as long as it is kept in mind that the term 'state' implies a distribution of related states. For example the native conformation of a protein is more precisely represented by a collection of closely related sub-states that are similar in their structure. Let's call the number of distinct sub-states Ωnat. Similarly the denatured state is a collection of 'sub-states' (Ωden). That there are many more conformations of the polypeptide chain as a denatured protein, i.e. Ωden >> Ωnat, means that the contribution to ΔS from the change in the number of chain configurations between the native and denatured states (ΔSconf) is positive, and is given by kBln(Ωden/Ωnat). Since these two distributions of states are largely distinct from one another, they may each be regarded, for simplicity, as single states. Just remember that when referring to either the native or denatured 'state', it is not a single conformation, but a collection of rapidly inter-converting conformations. These comments also apply to nucleic acids. Cooperativity of Transitions - The starting point for evaluating the stability of macromolecules, i.e. whether a conformational transition is spontaneous or non-spontaneous under a particular set of conditions, is an analysis of the contributions to ΔG by ΔH and ΔS. The molecular basis for the sign, magnitude and temperature-dependence of ΔH and ΔS depends on the properties of each class of macromolecule and the changes they undergo through the transition. Conformational transitions can be likened to phase transitions, in the sense that the physical properties of matter above the transition temperature are distinct from those below it. And just as there is a latent heat (ΔHtrans) accompanying phase transitions, as in the melting of ice, there is often an enthalpy change associated with the conformational transition of a macromolecule. When an ice crystal melts an immense number of water molecules change from the solid state to the liquid state over an extremely narrow temperature range, and thus the process is said to be cooperative. Protein and nucleic acid conformational transitions also exhibit limited cooperativity. One major difference is that macromolecules are not crystalline lattices of identical repeating units, but are finite independent units (limited by chain length), nevertheless they share the feature that order is maintained by favorable enthalpic interactions (i.e. noncovalent bonds) distributed throughout the structure. The bonded interactions that stabilize the duplex form of DNA and the native form of proteins are quite weak when taken one by one, but taken together they are strong enough to make the ordered forms of the macromolecule more stable. Once the unfolding or the duplex dissociation process is initiated and some of the stabilizing bonds are disrupted, the process will likely go completion because the remaining bonds are insufficient to maintain order in the structure.

Chem728 page 2 Spring 2012
Two-state vs. Non-two-state Mechanisms - Many small proteins (such as ribonuclease A, lysozyme, myoglobin, chymotrypsin) with molecular weights in the range of 15 to 20 kDa consist of a single structural domain, and are also said to consist of a single cooperative unit. As these proteins unfold, they often do so in an 'all or none' manner, which means that well below the melting transition temperature (TM), a solution of protein consists only of folded protein, and well above TM the solution consists of unfolded protein. Near TM, the sample is a mixture of just the completely folded and completely unfolded forms, i.e. two states. In a two-state mechanism, partly folded states (intermediate on the pathway from the folded to the unfolded state) are not thermodynamically stable and are not found in appreciable concentrations. This mechanism of unfolding (or in the reverse direction, folding) can be summarized in Process I, where A represents the folded form of a protein and B represents the unfolded form. I. two-state: A ⇌ B no stable intermediates II. non-two-state: A ⇌ X1 ⇌ X2 ⇌ . . . . ⇌ Xi ⇌ B stable intermediates (or multistate) As shown in Process II, a non-two-state mechanism includes the existence of one or more stable intermediates along the unfolding pathway. Here the term ‘pathway’ is used with some degree of uncertainty, since a manifold of intermediates may interconvert amongst themselves as well in addition to the equilibrium with the fold (and full-denatured states). While small single-domain proteins usually follow the two-state (mechanism I), many larger, more complex proteins that are composed of more than one structural domain display non-two-state behavior. Each structural domain in these larger proteins behaves like a cooperative unit. Since each cooperative unit will have a unique intrinsic stability, it is possible that the different domains will unfold at different temperatures. In nucleic acid melting transitions, two-state behavior is observed with relatively short oligonucleotide duplexes similar to the kind that was described in class. As the length and complexity of the DNA duplex increases the likelihood of observing non-two-state behavior increases. For example a long DNA duplex could contain a tract rich in A-T base pairs, which may melt at a lower temperature than a G-C rich tract. A further increase in temperature melts the duplex completely and leads to strand dissociation. Melting of tRNA is another example of a melting process that occurs with several intermediates. Folded tRNA consists of four to five stem-loop structures (hairpins). Each of these has a different intrinsic stability and melts with a different TM. The melting of tRNA molecules is actually described well by a collection of independent two-state transitions in which each transition can be assigned to the melting of one of the hairpins. Factors contributing to the Thermodynamic Parameters - It is well known that interactions that stabilize dsDNA are hydrogen bonds in the Watson-Crick base-pairing interactions, and intrachain base stacking. Energy is required to disrupt these interactions, thus ΔH is positive for duplex melting. Similar forces contribute to the stabilization of protein structures: hydrogen bonding in α-helices and β-sheets, ion-pairing interactions between charged side chains, and the van der Waals interactions between the nonpolar group in the protein interior. All of the enthalpic contributions associated with either protein unfolding or duplex melting are detected in a differential scanning calorimetry (DSC) experiment as an excess heat capacity CP
EX. CPEX represents the extra amount of heat needed to raise the temperature of a
solution of macromolecule undergoing such a transition relative to a solution of macromolecule not undergoing a conformational transition. CP
EX is detected in the DSC experiment as a large
Chem728 page 3 Spring 2012
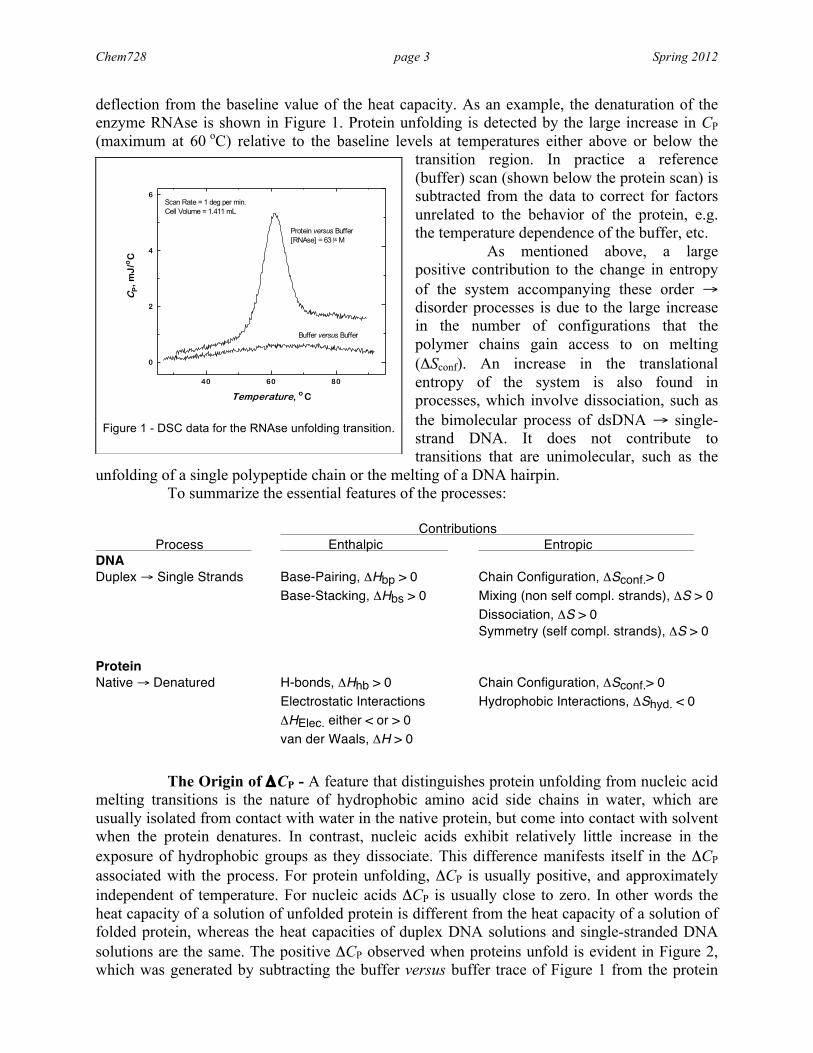
deflection from the baseline value of the heat capacity. As an example, the denaturation of the enzyme RNAse is shown in Figure 1. Protein unfolding is detected by the large increase in CP (maximum at 60 oC) relative to the baseline levels at temperatures either above or below the
transition region. In practice a reference (buffer) scan (shown below the protein scan) is subtracted from the data to correct for factors unrelated to the behavior of the protein, e.g. the temperature dependence of the buffer, etc. As mentioned above, a large positive contribution to the change in entropy of the system accompanying these order → disorder processes is due to the large increase in the number of configurations that the polymer chains gain access to on melting (ΔSconf). An increase in the translational entropy of the system is also found in processes, which involve dissociation, such as the bimolecular process of dsDNA → single-strand DNA. It does not contribute to transitions that are unimolecular, such as the
unfolding of a single polypeptide chain or the melting of a DNA hairpin. To summarize the essential features of the processes: Contributions Process Enthalpic Entropic DNA Duplex → Single Strands Base-Pairing, ΔHbp > 0 Chain Configuration, ΔSconf.> 0 Base-Stacking, ΔHbs > 0 Mixing (non self compl. strands), ΔS > 0 Dissociation, ΔS > 0 Symmetry (self compl. strands), ΔS > 0 Protein Native → Denatured H-bonds, ΔHhb > 0 Chain Configuration, ΔSconf.> 0 Electrostatic Interactions Hydrophobic Interactions, ΔShyd. < 0 ΔHElec. either < or > 0 van der Waals, ΔH > 0
The Origin of ΔCP - A feature that distinguishes protein unfolding from nucleic acid melting transitions is the nature of hydrophobic amino acid side chains in water, which are usually isolated from contact with water in the native protein, but come into contact with solvent when the protein denatures. In contrast, nucleic acids exhibit relatively little increase in the exposure of hydrophobic groups as they dissociate. This difference manifests itself in the ΔCP associated with the process. For protein unfolding, ΔCP is usually positive, and approximately independent of temperature. For nucleic acids ΔCP is usually close to zero. In other words the heat capacity of a solution of unfolded protein is different from the heat capacity of a solution of folded protein, whereas the heat capacities of duplex DNA solutions and single-stranded DNA solutions are the same. The positive ΔCP observed when proteins unfold is evident in Figure 2, which was generated by subtracting the buffer versus buffer trace of Figure 1 from the protein
Figure 1 - DSC data for the RNAse unfolding transition.
40 60 80
0
2
4
6
Buffer versus Buffer
Protein versus Buffer[RNAse] = 63 µM
Scan Rate = 1 deg per min.Cell Volume = 1.411 mL
CP,
mJ
/oC
Temperature, o C

Chem728 page 4 Spring 2012
versus buffer trace. (The data are also plotted as the molar heat capacity (obtained by dividing the data in figure 1 by the moles of RNAse in calorimeter cell). The data in the plot show that the high temperature and low temperature baselines, which represent the heat capacities of the unfolded protein and folded protein, respectively, are quite different. When the low and high temperature regions are extrapolated to the transition midpoint (TM) and the difference is taken (CP(unfolded protein) - CP(folded protein)), an estimate of ΔCP is obtained. To summarize the usual approximations for ΔCP of nucleic acid and protein denaturation: For protein unfolding: ΔCP = CP(denatured) - CP(folded) > 0,
and approximately constant. For DNA duplex melting: ΔCP = CP(ss DNA) - CP(dsDNA) ~ 0.
With these assumptions for ΔCP we are now in a position to consider the consequences of the sign and the magnitude of the thermodynamic parameters in the nucleic acid and protein conformational transitions. Nucleic Acid Stability Plot - First let's take the simpler case of nucleic acid ‘melting’. It is often (but not always) reasonable to assume that ΔCP = 0; thus ΔH and ΔS are temperature independent. This follows immediately from the equations for ΔH(T) and ΔS(T), which exhibit temperature dependence when ΔCP is not zero:
ΔS(T) and ΔH(T) are equal to ΔSM and ΔHM at a conveniently chosen reference temperature, in this case the transition (or melting) temperature, TM. For the case in which case ΔCP = 0 it is seen that ΔS(T) and ΔH(T) equal ΔSM and ΔHM at all temperatures. In this case, ΔG(T) is simply ΔG(T) = ΔHM - TΔSM Just as in the melting of ice, ΔHM and ΔSM are positive. At low temperatures the sign of ΔG will be dominated by ΔHM and the overall sign of ΔG will be positive. At low temperatures the amount of heat that needs to be withdrawn from the surroundings to melt the DNA duplex decreases the entropy of the surroundings (ΔSSURR) more than the entropy of the system (ΔSM) is
Δ Δ ΔH T H C T T( ) ( )= + −M P M ⎟⎟⎠
⎞⎜⎜⎝
⎛Δ+Δ=Δ
MPM ln)(
TTCSTS
Figure 2 - The heat capacity of RNAse unfolding which has been reference-trace-corrected, and normalized to show the molar heat capacity. CP above and below the transition region is different by the amount ΔCP. The baseline drawn under the peak reflects the continuous conversion of native to unfolded protein (and thus the continuous change from CP(folded) to CP(unfolded)).

Chem728 page 5 Spring 2012
increased. For a reversible, constant-P process ΔHM/T = -ΔHSURR/T = -ΔSSURR, which leads to the conclusion that ΔSSURR is negative, since both ΔHM and T are positive. Thus for small T, ΔSSURR (= -ΔHM/T) is likely to be larger than ΔSM. ΔSTOT will be negative and the reaction will be non-spontaneous. As T increases the ratio ΔHM/T decreases, ΔSSURR becomes smaller in absolute value and less negative, and as a result the sum of ΔSSYS and ΔSSURR will become positive at larger T. Figure 3 summarizes these features for a dsDNA oligo which is characterized by ΔHM = 376 kJ, TM = 330 K and ΔCP = 0. At low T, ΔG of the melting process is positive and non-spontaneous (TΔSM << ΔHM); dsDNA is the major species present. Far above the transition temperature (330 K), ΔG is negative (TΔSM >> ΔHM) and the single-stranded DNA will be the major form present. Near ΔG = 0, the region of the ΔG plot marked in bold, both dsDNA and ssDNA will be present in significant (measureable) amounts. Note the relative scales of the upper and lower plots in Figure 3, which
shows that TΔSM and ΔHM are large values that nearly cancel their respective contributions to ΔG. Protein Stability Plot - In the case of protein unfolding ΔCP is positive and approximately constant as a function of temperature. From the foregoing discussion it should be apparent that a nonzero ΔCP means that the heat capacities of the folded and the unfolded forms of the protein are different. This is due to the different properties that native and denatured proteins have; a significant contribution is attributed to the different ways in which the two forms interact with solvent (through the exposure of hydrophobic groups to solvent during unfolding). The consequence of a nonzero ΔCP means that both ΔH and ΔS are temperature-dependent, which results in the following expression for ΔG:
The stability behavior of proteins is quite different from nucleic acids due to the presence of the nonzero ΔCP. Figure 4 plots the stability curve of a protein with ΔHM = 376 kJ.mol-1, TM = 330 K and ΔCP = 8.2 kJ.mol-1.K-1. A comparison of Figures 3 and 4 shows just how the stability properties of a macromolecule in which ΔCP = 0 differs from one in which ΔCP is equal to a positive constant. The most obvious effects of a nonzero ΔCP are the pronounced temperature dependence of ΔH (upper plot in Figure 4) and the curvature in the plot of ΔG (lower plot in Figure 4). ΔG is a measure of native protein stability relative to denatured protein, and it is most stable when ΔG is at its most positive value. Note there is a temperature of maximum stability, and at this temperature the protein unfolding reaction is the most non-
⎭⎬⎫
⎩⎨⎧
⎟⎟⎠
⎞⎜⎜⎝
⎛Δ+Δ−−Δ+Δ=Δ
MPMMPM ln)()(
TTCSTTTCHTG
Figure 3 - Nucleic Acid Stability Plot
Chem728 page 6 Spring 2012
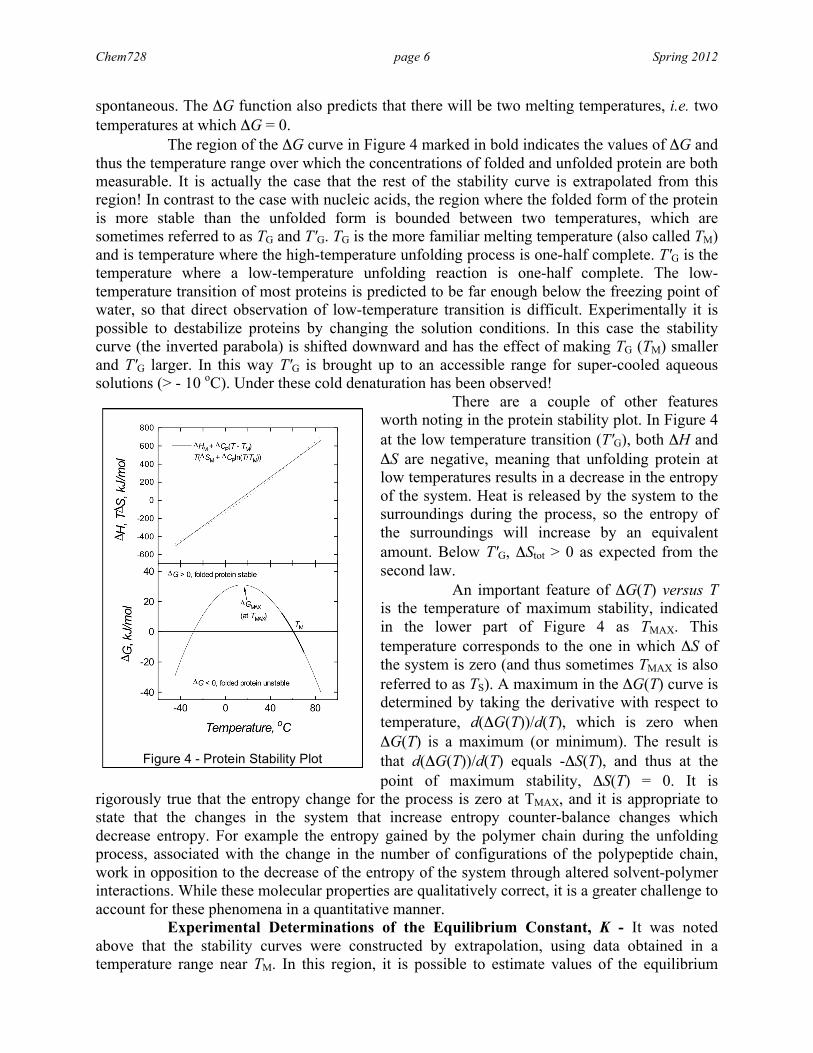
spontaneous. The ΔG function also predicts that there will be two melting temperatures, i.e. two temperatures at which ΔG = 0. The region of the ΔG curve in Figure 4 marked in bold indicates the values of ΔG and thus the temperature range over which the concentrations of folded and unfolded protein are both measurable. It is actually the case that the rest of the stability curve is extrapolated from this region! In contrast to the case with nucleic acids, the region where the folded form of the protein is more stable than the unfolded form is bounded between two temperatures, which are sometimes referred to as TG and T'G. TG is the more familiar melting temperature (also called TM) and is temperature where the high-temperature unfolding process is one-half complete. T'G is the temperature where a low-temperature unfolding reaction is one-half complete. The low-temperature transition of most proteins is predicted to be far enough below the freezing point of water, so that direct observation of low-temperature transition is difficult. Experimentally it is possible to destabilize proteins by changing the solution conditions. In this case the stability curve (the inverted parabola) is shifted downward and has the effect of making TG (TM) smaller and T'G larger. In this way T'G is brought up to an accessible range for super-cooled aqueous solutions (> - 10 oC). Under these cold denaturation has been observed!
There are a couple of other features worth noting in the protein stability plot. In Figure 4 at the low temperature transition (T'G), both ΔH and ΔS are negative, meaning that unfolding protein at low temperatures results in a decrease in the entropy of the system. Heat is released by the system to the surroundings during the process, so the entropy of the surroundings will increase by an equivalent amount. Below T'G, ΔStot > 0 as expected from the second law. An important feature of ΔG(T) versus T is the temperature of maximum stability, indicated in the lower part of Figure 4 as TMAX. This temperature corresponds to the one in which ΔS of the system is zero (and thus sometimes TMAX is also referred to as TS). A maximum in the ΔG(T) curve is determined by taking the derivative with respect to temperature, d(ΔG(T))/d(T), which is zero when ΔG(T) is a maximum (or minimum). The result is that d(ΔG(T))/d(T) equals -ΔS(T), and thus at the point of maximum stability, ΔS(T) = 0. It is
rigorously true that the entropy change for the process is zero at TMAX, and it is appropriate to state that the changes in the system that increase entropy counter-balance changes which decrease entropy. For example the entropy gained by the polymer chain during the unfolding process, associated with the change in the number of configurations of the polypeptide chain, work in opposition to the decrease of the entropy of the system through altered solvent-polymer interactions. While these molecular properties are qualitatively correct, it is a greater challenge to account for these phenomena in a quantitative manner. Experimental Determinations of the Equilibrium Constant, K - It was noted above that the stability curves were constructed by extrapolation, using data obtained in a temperature range near TM. In this region, it is possible to estimate values of the equilibrium
Figure 4 - Protein Stability Plot

Chem728 page 7 Spring 2012
constant K as a function of temperature, and thus (under optimum conditions) obtain values for ΔG, TM, ΔH and ΔCP. To illustrate how K is determined from experimental data, consider Figure 5 (taken from Biophysical Chemistry, by Tinoco, Sauer, Wang and Puglisi). Figure 5 is a spectrum of the ultraviolet light absorbance at 287 nm, expressed as the difference of the molar absorbance, ε, of a solution of at different temperatures minus the molar absorbance of native RNAse, εN. At low temperatures (< 30 oC) and high temperatures (> 55 oC) the absorbance is less dependent on
temperature compared to the absorbance between 35 and 50 oC, where ε - εN changes rapidly. In this temperature range the protein is undergoing an unfolding transition, which can be detected because of the difference in the molar absorbance of the native protein (εN) and denatured protein (εD). As illustrated in the graph, εN and εD are estimated in the transition region by extrapolation of the low- and high-temperature baselines, respectively. The intermediate value of ε - εN between 35 and 50 oC is a demonstration that the solution of RNAse consists of native and denatured protein. The value of K for the protein unfolding reaction is estimated at a particular temperature by the quotient of difference measurements. The difference between the observed absorbance and extrapolated molar absorbance of the native protein, ε - εN (labeled in the upper part of Figure 5) is divided by the difference between the extrapolated molar absorbance of the denatured and the observed molar absorbance, εD - ε. K = (ε - εN)/( εD - ε)
This manner of estimating K assumes that the two-state mechanism is valid. For a small, monomeric protein the two-state mechanism implies that Native = Denatured and K = [D]/[N] where [D] is the concentration of denatured protein and [N] is the concentration of native protein. Examination of this equation for the equilibrium constant will show that it has the expected behavior. At low temperatures [N] >> [D] and K ~ 0. At high temperatures [D] >> [N] and K approaches infinity. K changes gradually between these two limits in the intermediate temperature range. This method of estimating K also assumes that the unfolding process occurs reversibly in the thermodynamic sense, i.e. the reaction is at or near equilibrium for every temperature in the experiment. This can be confirmed by scanning down in temperature and showing that the data points for the upward and downward scans coincide. Equilibrium constants can be estimated using any number of techniques including UV-Vis absorbance, fluorescence, light scattering, circular dichroism and intrinsic viscosity measurements. The only requirements that need to be satisfied are the reversibility of the reaction, well-behaved low and high
Figure 5 - Top: Thermal denaturation of RNAse monitored by UV-Vis difference spectroscopy. Bottom: Normalized Data reflecting the fraction denatured as a function of temperature.
0.0
-0.5
-1.0
-1.5
-2.0
εD - ε
ε - εN
ε - ε
N
0 20 40 60
0.0
0.2
0.4
0.6
0.8
1.0
α
α , fr
actio
n de
natu
red
Temperature, oC

Chem728 page 8 Spring 2012
temperature baselines (for extrapolation), and that the property under observation must change measurably between the native and denatured state. To illustrate the generality of the result, the absorbance data in the upper part of Figure 5 have been scaled and re-plotted as the fraction of protein unfolded, α, which (by definition) ranges between 0 and 1. The conversion is accomplished through the use of the mass conservation equation, which expresses the total concentration of protein (Ptot) as the sum of the concentrations of native ([N]) and denatured ([D]) protein. The fraction of protein that has denatured, α, and the fraction of protein that has not, 1 - α, are given by: Ptot = [N] + [D] → 1 = [N]/Ptot + [D]/Ptot → α = [D]/Ptot and 1- α = [N]/Ptot K is equal to α/(1 - α), where α = (ε - εN)/(εD - εN) for the absorbance data. If the protein unfolding reaction is monitored at equilibrium and if the process follows a two-state mechanism, then the plot of α versus T should be the same irrespective of the physical parameter used to monitor the unfolding process. This will not necessarily be the case if stable intermediates are present. Conversely agreement among α versus T plots obtained by techniques to measure K is
taken as evidence in support of a two-state mechanism. ΔGo is related to K, for a system at equilibrium by ΔGo = -RTlnK. ΔH can be estimated from the values of ΔGo at various temperatures using the Gibbs-Helmholtz Equation:
∂(ΔG/T)/∂(1/T) = -ΔH/R For cases in which ΔCP = 0, ΔH is constant and a straight line will be obtained for a plot of (ΔG/T) versus 1/T. If ΔCP ≠ 0 the plot will have curvature. It is worth noting that K can be estimated from DSC experiments in a manner analogous
to the method described above for absorbance spectra by taking the relative areas under the CP curve as depicted in Figure 6. (CP is the temperature derivative of H, and a plot of H versus T would be treated exactly like absorbance versus T). The data in Figure 6 are the RNAse unfolding data of Figure 3 after the baseline has been subtracted. This has the effect of treating ΔCP as though it is equal to zero. Over the temperature range of an unfolding transition this can be acceptable approximation. The drop-line from the data to the baseline in Figure 6 indicates that temperature (T) at which an estimate of K will be obtained. As indicated in the plot, the area under the curve to the left of the drop-line divided by the total area under the curve is equal to fraction of denature protein, α, at the temperature T. The area under the curve above T, i.e. to the right of the drop-line, divided by the total area is equal to fraction of protein in the native state (1 - α). These values for the fraction of denatured protein are used to calculate K (= α/(1 - α)) over the temperature range of the transition to estimate the enthalpy of unfolding from the Gibbs-Helmholtz equation.
Figure 6 - DSC data of Figure 2 with baseline subtracted.

Chem728 page 9 Spring 2012
DSC as a Test of the Two-State Mechanism - In contrast to all other experimental techniques that monitor protein unfolding, a differential scanning calorimetry (DSC) experiment permits two independent estimates of ΔH. As mentioned above, the analysis of K as a function of temperature provides an estimate of ΔH called the van’t Hoff enthalpy (ΔHvH). Calorimetry alone provides a direct measure of ΔH, the true thermodynamic quantity, referred to as ΔHCAL. ΔHCAL in a calorimetry experiment is obtained by direct integration of the excess heat capacity, and is model-independent. ΔHCAL and ΔHvH will be equal provided that the expression for the equilibrium constant used to calculate ΔHvH describes the behavior of the system correctly. The DSC experiment actually becomes a test of whether or not the reaction mechanism can be treated as a two-state mechanism, and/or if appropriate equation for the reaction equilibrium has been
used. ΔHCAL and ΔHvH were determined using data from the DSC experiment of Figure 6. ΔHCAL was determined by direct integration of the area under the curve, normalized according the amount of protein in the calorimeter cell, and ΔHvH was determined by an analysis of the temperature dependence of the equilibrium constant as described above. The agreement between ΔHCAL and ΔHvH, 431 and 388 kJ/mol, respectively, is good considering the approximation that ΔCP = 0 and that the accuracy of ΔHCAL is limited by the accuracy of the protein concentration (used in
normalizing the data). From these data it can be concluded that the unfolding process occurs via a two-state mechanism. Another way to treat the data is to constrain the analysis by setting ΔHCAL = ΔHvH, which is a consequence of assuming a two-state mechanism. The ability of the theoretical curve to explain the data is thus a test of this assumption. As shown in Figure 7, the two-state model applied to the data in Figure 2, without assuming that ΔCP = 0, does explain the data well. Again these data support the conclusion that the thermal denaturation of RNAse is two-state: the only two species present in any appreciable concentration are fully folded (native) and completely unfolded (denatured) forms of the protein. Cooperativity of Transitions Revisited - Since two estimates of ΔH (ΔHCAL and ΔHvH) are obtained by calorimetry, the information relevant to the cooperativity of the transition may be obtained directly in DSC experiments. Up to this point the temperature dependence of the denaturation equilibrium has been considered only for a protein consisting of a single subunit, which is an example of the more general situation in which a protein in its folded form consists of n identical subunits (An):
!!A! ⇄ A (1)
Figure 7 - DSC data of Figure 2 analyzed according to a two-state model and nonzero ΔCP.

Chem728 page 10 Spring 2012
Equation (1) is written to emphasize the equilibrium per mole of protein subunit. Using the mass conservation equation defined in terms of the total number of polypeptide strands PTOT = n[An] + [A] (2) Based on Eq 1 and Eq 2, an expression for K in terms of the total subunit concentration (PTOT), the number of subunits in the oligomer (n), and the fraction of protein denatured (fD) can be obtained. As a result of the mass conservation equation the fraction of denatured protein (fD) and the fraction of native protein (fN) are [A]/PTOT and n[An]/PTOT, respectively. The expression for K is
(3)
The van’t Hoff analysis of the Eq 3 leads to
(4)
in which the enthalpy on the right hand side represents the enthalpy per mole of protein subunit, a consequence of writing the reaction equilibrium between 1/n moles of oligomer and 1 mole of
denatured monomer (An/n ⇄ A). One way in which the effect of different values of n on the equilibrium, An/n ⇄ A, can be explored, is to simulate fD as a function of T using Equation (3). Assigning the values of ΔH per mole of subunits and TM, 437 kJ and 330 K respectively, defines the values K as a function of T (via K = exp(-ΔH/RT) x exp(ΔS/R) in which ΔS = ΔH/TM). A graph of fD as a function of T for n = 1, 2, 5 and 20 is the top plot of Figure 8 (with PTOT = 1). As the value of n increases, fD versus T becomes steeper. The reaction becomes more cooperative. In a calorimetry experiment, the temperature derivative of fD is proportional to the heat capacity of the solution scaled by the enthalpy change that accompanies the transition. (In the terminology of the normalized plot in the lower part of Figure 5, α = CP/ΔH. Here α = fD)
(5)
When this equation is rearranged to solve explicitly for the excess heat capacity, CP
ex, the result is
( ) n
nn
ffnK /1D
/11TOTD
/1
-1P −
=
( )( ) 2
D
DD
DD
11
RTH
dTdf
fnfffn Δ
=−
+−
( )( ) 2
exP
DD
DD
-1-1
RTH
HC
fnfffn Δ
=Δ
+
Figure 8 - Unfolding transitions followed by fD and CP as a function of temperature for different values of the oligomer size (n).
Chem728 page 11 Spring 2012
(6)
A plot of Equation (6), scaled according to the total enthalpy change (CP/ΔH) as a function of T for different values of n (Figure 8) shows that the transition becomes progressively sharper as the value of n increases. The value of n in the cooperative unfolding equilibrium may be determined by measuring TM as a function of the PTOT. This approach may be used with techniques in which the enthalpy is not measured.
( )( ) 2
2
DD
DDexP -1
-1RTH
ffnfnfC Δ
+=