macronutrients in the ocean - solas
TRANSCRIPT

OUTLINE
What is a macronutrient?
Trends in nutrients & limitation
The N cycle – sources, sinks and recycling
Silicate – the body builder
Stoichiometry - The N and P cycles
Climate change & macronutrients
Macronutrients in the
ocean
Philip Boyd
NIWA/OTAGO, New Zealand
September 2011

What is a macronutrient?
“An element, such as carbon, hydrogen, oxygen, or nitrogen,
required in large proportion for the normal growth and development of a plant”
What are they required for?
The synthesis of macromolecules such as lipids, proteins and carbohydrates
NOAA 1994, Levitus
Joseph Wright

THE ELEMENTS OF
MICROBIAL LIFE Component Composition
Nucleus (DNA) C-N-P
Ribosome (RNA) C-N-P
Membranes C-P
Cell wall C-N
Proteins/enzyme
s/
flagellum
C-N
Storage bodies:
• PHB
• Poly-P
C
P
The elements required for each macromolecular group are defined
by the structure of the molecule, e.g. nucleotides comprise a
phosphate group, a carbohydrate molecule and a N-containing base

Capone 1992
Many complex pathways after nutrient uptake


Vmax2
Ks1 Ks2
Substrate concentration (S)
Upta
ke r
ate
(V
)
Nutrient uptake kinetics
Active uptake by membrane transporters
Internal storage pool
½ Vmax1
Vmax1
½ Vmax2

Global nutrient distributions - Phosphate

Global
Nutrient
distributions

Nutrient limitation patterns - Diatoms
(Moore et al., 2004).

Nutrient limitation patterns – N fixers

The Biogeochemical cycle of N in the ocean
Lipschultz et al. (2000)

N2 FIXATION
Discovered in late 19th century in soil bacteria
H. B. Bigelow (1931): “The possibility that so-called N2 fixers may also fertilize seawater must be taken into account”
Dugdale discovered N2 fixation in Sargasso Sea in 1961
Process was considered to be negligible in the 1980’s, but significant since JGOFS

Boyd &
Hurd
(2009)

N2 FIXATION AT STATION ALOHA
(1990-2000)
N2 accounts for 47±9% of “new” N
Large interannual variations:
36% in 1993 vs. 69% in 1999
Relative importance of N2 vs. NO3- as a
source of new N has increased since
1995
Karl et al. (2002)

Boyd & Hurd Figure 6
NO3 (µmol L-1)
0 5 10 15 20 25D
ep
th (
m)
0
50
100
150
200
250
winter 2004
spring 2005
summer 2005
autumn 2005
Sinks for N
Seasonal trends in nutrient profiles
Boyd & Hurd (2009)

N preferences
at HOT - SPSG
• Prochlorococcus
prefers NH4+/DON but
some phylotypes can
use NO2-
• Eukaryotic phototrophs
use NO3- and possibly
DON, and compete
with all others for NH4+
• Heterotrophic bacteria
may prefer NH4+/DON
but can also use NO3-
/NO2-
• Diazotrophs use N2
Slide – courtesy D. Karl

THE FOODWEB AND NITROGEN CYCLING
f ratio = (new N/(new N + regenerated N))


An N Cycle summary - an annual budget
Karl et al. (2002)

The biological pump recycles macronutrients
7-16 gT C yr-1
45-50 gT C yr-1
It is in balance over long timescales
(years) as:
PON
export
NO3
Eppley & Peterson (1979)

Nutrient remineralization
length scales
N
C
Si
Fe
depth
Export
Role of bacteria

“Classic” von Brand & Rakestraw diatom – rotting
experiment of 1935!
nitrification

• A typical
nutrient profile

Why such a difference in
These nutrient profiles?

Regional differences due to
age of the water mass
Determines “potential
productivity” of the basin

Arrigo (2005)

Silicate – the body builder
Courtesy Mary Silver (UCSB)
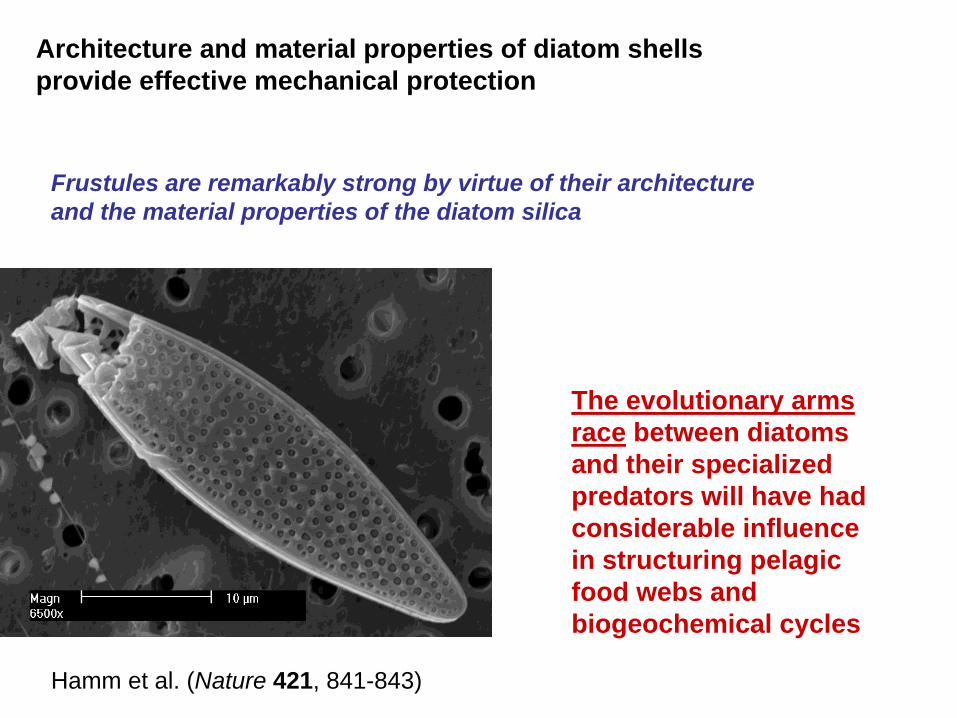
Hamm et al. (Nature 421, 841-843)
Architecture and material properties of diatom shells
provide effective mechanical protection
The evolutionary arms
race between diatoms
and their specialized
predators will have had
considerable influence
in structuring pelagic
food webs and
biogeochemical cycles
Frustules are remarkably strong by virtue of their architecture
and the material properties of the diatom silica

Broken diatom frustules are indicators of mortality
Fragilariopsis kerguelensis
Discoid diatoms
Courtesy V. Smetacek (AWI)

0 5 10 15 20
mm
ol
m-3
d-1
0.0
0.2
0.4
0.6
0.8
1.0nitrate depletion
silicic acid depletion
Days
Fe supply impacts the uptake stoichiometry of silicate relative to nitrate
And SILICIFICATION
Boyd et al. (2005)
+Fe -Fe
Under low Fe diatoms produce thicker
frustules

Biogenic silica / opal - mineral ballast – particle sinking
Radiolarian
Diatom Phaeodarian

NOAA 1994
Levitus
Global distribution of silicate
V. Smetacek (AWI)

Insights into diatom blooms in the geological
past are obtained from sediment cores
Marked increases in productivity & rapid settling of biogenic matter are
suggested in cores by the episodic accumulation of diatomaceous oozes
up to 1 m thick!

Ocean biogeochemical cycle of Silica (Trequer et al. 1995)
Rivers
5.0
Eolian 0.5
Mixed layer
Hydrothermal
0.2
Upwelled
114.5
240
120
90.9
29.1
6.1
0.4 basalt
23
Teramoles of Si /year
Biol.
Uptake
And recycling

Nutrient Stoichiometry - The N and P cycles
Stoichiometry refers to patterns of mass balance in chemical conversions
of different types of matter, which often have definite compositions.
Sterner and Elser (2002)

Further definitions
• Ecological stoichiometry--The balance of multiple chemical substances in ecological interactions and processes.
• Elemental imbalance--Dissimilarity in nutrient content between two things, such as between an autotroph and the inorganic medium.
If a consumer and resource have identical stoichiometry, they are perfectly balanced. The greater they differ, the more their imbalance.
Sterner & Elser (2002)

REDFIELD STOICHIOMETRY OF LIFE
C106:N16:P1
Carbon
Nitrogen
Phosphorus
C:N = 6.6 / C:P = 106 / N:P = 16

REDFIELD STOICHIOMETRY OF LIFE
C106:N16:P1
Carbon
Nitrogen
Phosphorus
Initially thought to be the imprint of the synthesis of
macromolecules including lipids, proteins and carbohydrates

• Redfield (1934)
N:P = 20
• Cooper (1937/1938)
N:P ratio redefinition
based on salt
correction
of 1.35x for P
analyses!
• Today N:P = 15-16
Atlantic
Ocean
N:P = 20
Redfield (1934)
“THE RATIO”
Courtesy D Karl


• C:N:P is plastic, not fixed
• N P limitation transition much higher than
16:1
General conclusion: “Our analysis suggests caution in
application of the Redfield Ratio in theoretical biogeochemical
analyses and as a conversion factor in field studies.”
R. Geider and J. La Roche (2002)
Redfield revisited: variability of C:N:P in marine
microalgae and its biochemical basis
Eur. J. Phycol. 37: 1-17

Klausmeier et al. (2004)

Their results show that “the canonical Redfield
N:P ratio of 16 is not a universal biochemical
optimum, but instead represents an average of
species-specific N:P ratios.”
Klausmeier et al. (2004)

N:P ratios and physiological strategies
Arrigo (2005)

Experimental Variation of the C:N:P Ratios (by Atoms)
in Cultures of the Freshwater Alga, Chlorella
pyrenoidosa
(Ketchum and Redfield, 1949)
Conditions C N P
Normal cells 47 5.6 1
Phosphorus deficient
cells
231 30.9 1
Nitrogen deficient cells 75 2.9 1
•Elemental imbalance--Dissimilarity in nutrient content between an autotroph
•and the inorganic medium.

N:P differences are evident within the biogeochemical cycles
Arrigo (2005)

Using the Redfield ratio perspective – i.e. P*
Basin-scale differences
North Atlantic P* < 0, P limited
South Atlantic P* > 0, N limited Moore et al. 2008

Are changes in P* due to N fixation or N:P uptake of other phytoplankton?

STA. ALOHA
• EZ SRP has decreased by >80% over past 17 years
• How low can it go?
CASE STUDY
STA. ALOHA

Climate change and macronutrients
Boyd and Doney
(2002)
Doney (2006)

Figure 2a. Total NOy+NHx Deposition in 1860, mg N m-2 yr-1

Figure 2c. Total NOy+NHx Deposition in 2050, mg N m-2 yr-1

Duce et al. 2008
Anthropogenic AN provides around 32% of external N supply

S
u
c
h
More N fixers
Due to warming?
Boyd & Doney (2002)
A)Co
cco
lith
oph
ore
cel
ls m
L-1
0
20
40
60
80
100
120
B)
Cal
cite
pro
duct
ion r
ate
(g C
(g C
hl a
-1)
d-1
)
0
1
2
3
4
5
C)
pCO2
19 Pa 39 Pa 76 Pa
N2
fix
atio
n r
ate
(nm
ol
N
mo
l C
-1 h
-1)
0
1
2
3
4
D)
pCO2
19 Pa 39 Pa 76 Pa
N2
fix
atio
n r
ate
(nm
ol
N
mo
l C
-1 h
-1)
0
1
2
3
4
Ambient
High CO2High Temperature
Greenhouse
Ambient
High CO2High Temperature
Greenhouse
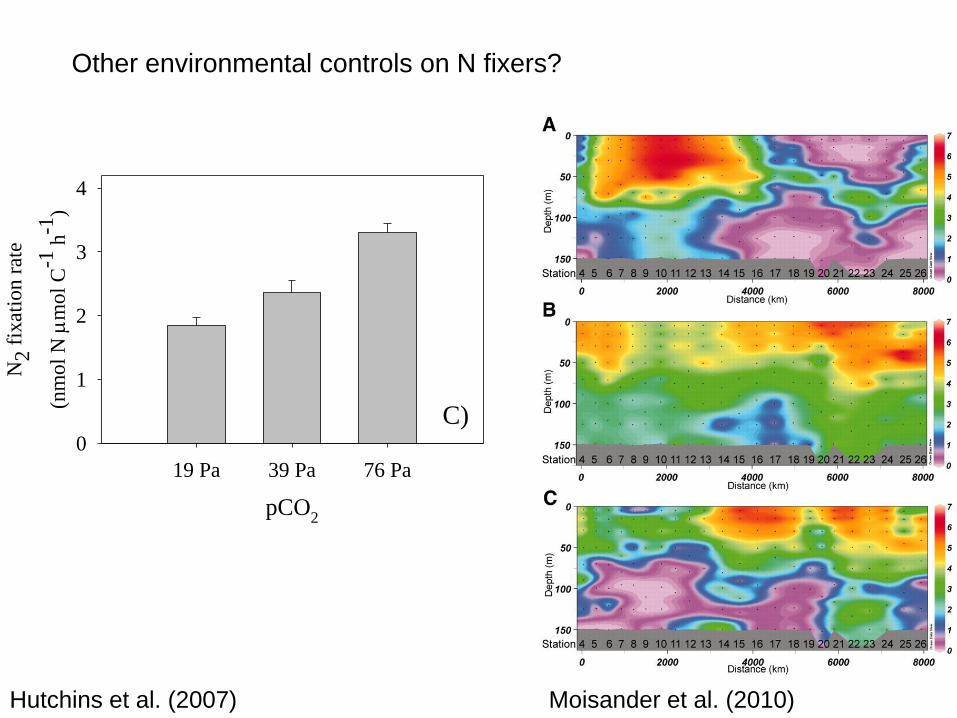
Hutchins et al. (2007)
Other environmental controls on N fixers?
Moisander et al. (2010)

What is needed
Surveys – e.g. AMT

And new modelling approaches
Follows (2007)

Conclusions
Macronutrients play a key role in setting the
productivity of the oceans
Their biogeochemical cycles are tightly
interlinked via stoichiometry – yet they are
also flexible
Other factors such as trace element
supply and climate-mediated changes
can subtly alter these links
Climate change will impact the
biogeochemistry of macronutrients in a
complex manner