macstats: medicaid and chip data book - macpac · macstats: medicaid and chip data book xi...
TRANSCRIPT

MACStats: Medicaid and CHIP Data Book
December 2016
Medicaid and CHIP Payment and Access Commission


December 2016
MACStats: Medicaid and CHIP Data Book
Medicaid and CHIP Payment and Access Commission


MACStats: Medicaid and CHIP Data Book v
Commission Members and Terms
Commission Members and TermsSara Rosenbaum, JD, Chair Washington, DC
Marsha Gold, ScD, Vice Chair Washington, DC
Term Expires April 2017Sharon Carte, MHS West Virginia Children’s Health Insurance Program South Charleston, WV
Andrea Cohen, JD NYC Health + Hospitals New York, NY
Herman Gray, MD, MBA United Way for Southeastern Michigan Detroit, MI
Norma Martínez Rogers, PhD, RN, FAAN The University of Texas Health Science Center at San Antonio San Antonio, TX
Sara Rosenbaum, JD The George Washington University Washington, DC
Term Expires April 2018Gustavo Cruz, DMD, MPH Health Equity Initiative New York, NY
Leanna George Beneficiary Representative Benson, NC
Marsha Gold, ScD Independent Consultant Washington, DC
Charles Milligan, JD, MPH UnitedHealthcare Community Plan of New Mexico Albuquerque, NM
Sheldon Retchin, MD, MSPH The Ohio State University Wexner Medical Center Columbus, OH
Peter Szilagyi, MD, MPH University of California, Los Angeles Los Angeles, CA
Term Expires April 2019Brian Burwell Truven Health Analytics Cambridge, MA
Toby Douglas, MPP, MPH Centene Corporation Davis, CA
Christopher Gorton, MD, MHSA Tufts Health Plan Watertown, MA
Stacey Lampkin, FSA, MAAA, MPA Mercer Government Human Services Consulting Tallahassee, FL
Penny Thompson, MPA Penny Thompson Consulting, LLC Ellicott City, MD
Alan Weil, JD, MPP Health Affairs Bethesda, MD

December 2016vi
Commission StaffAnne L. Schwartz, PhD, Executive Director
Office of the Executive DirectorAnnie Andrianasolo, MBA, Executive Assistant
Kathryn Ceja, Director of Communications
Angelica Hill, MA, Communications/Graphic Design Specialist
Policy DirectorsAmy Bernstein, ScD, MHSA Policy Director and Contracting Officer
Moira Forbes, MBA, Policy Director
Jane Horvath, MHSA, Policy Director
Principal AnalystsKirstin Blom, MIPA
Martha Heberlein, MA
Joanne Jee, MPH, Principal Analyst and Congressional Liaison
Jessica Morris, MPA
Chris Park, MS
Kristal Vardaman, MSPH
Senior AnalystsBenjamin Finder, MPH
Robert Nelb, MPH
Katie Weider, MPH
AnalystsKacey Buderi, MPA Kayla Holgash, MPH
Research AssistantMadeline Britvec
Operations and FinanceRicardo Villeta, MBA, Deputy Director of Operations, Finance, and Management
James Boissonnault, MA, Chief Information Officer
Allissa Jones, Administrative Assistant
Kevin Ochieng, IT Specialist
Ken Pezzella, Chief Financial Officer
Brian Robinson, Financial Analyst
Eileen Wilkie, Administrative Officer
Commission Staff

MACStats: Medicaid and CHIP Data Book vii
Table of Contents
Table of ContentsCommission Members and Terms ...................................................................................................................... v
Commission Staff ............................................................................................................................................... vi
Introduction ......................................................................................................................................................... xi
SECTION 1: Overview—Key Statistics ........................................................................................................ 1
Key Points ........................................................................................................................................... 2
EXHIBIT 1: Medicaid and CHIP Enrollment as a Share of the U.S. Population, 2015 (millions) ..... 3
EXHIBIT 2: Characteristics of Non-Institutionalized Individuals by Age and Source of Health Coverage, 2015 .................................................................................................... 4
EXHIBIT 3: National Health Expenditures by Type and Payer, 2014 ............................................... 9
EXHIBIT 4: Major Health Programs and Other Components of the Federal Budget as a Share of Federal Outlays, FYs 1965–2015 .................................................................. 12
EXHIBIT 5: Medicaid as a Share of States’ Total Budgets and State-Funded Budgets, SFY 2014 ............................................................................................................................ 14
EXHIBIT 6: Federal Medical Assistance Percentages (FMAPs) and Enhanced FMAPs (E-FMAPs) by State, FYs 2013–2017 ........................................................................... 17
SECTION 2: Trends ............................................................................................................................. 21
Key Points ......................................................................................................................................... 22
EXHIBIT 7: Medicaid Beneficiaries (Persons Served) by Eligibility Group, FYs 1975–2013 (thousands) ........................................................................................ 23
EXHIBIT 8: Medicaid Enrollment and Spending, FYs 1966–2015 ................................................. 25
EXHIBIT 9: Annual Growth in Medicaid Enrollment and Spending, FYs 1975–2015 ................... 26
EXHIBIT 10: Medicaid Enrollment and Total Spending Levels and Annual Growth, FYs 1966–2015 ............................................................................................................. 27
EXHIBIT 11: Full-Benefit Medicaid and CHIP Enrollment, Selected Months, 2013–2016 ............. 29
EXHIBIT 12: Historical and Projected National Health Expenditures by Payer for Selected Years, FYs 1970–2025 .................................................................................. 32
EXHIBIT 13: Medicaid as a Share of State Budgets Including and Excluding Federal Funds, SFYs 1987–2014 ........................................................................................................... 34
SECTION 3: Program Enrollment and Spending ....................................................................................... 37
Key Points ......................................................................................................................................... 38
Medicaid Overall
EXHIBIT 14: Medicaid Enrollment by State, Eligibility Group, and Dually Eligible Status, FY 2013 (thousands) .................................................................................................... 39
EXHIBIT 15: Medicaid Full-Year Equivalent Enrollment by State and Eligibility Group, FY 2013 (thousands) .................................................................................................... 42

December 2016viii
Table of Contents
EXHIBIT 16: Medicaid Spending by State, Category, and Source of Funds, FY 2015 (millions) .... 45
Medicaid Benefits
EXHIBIT 17: Total Medicaid Benefit Spending by State and Category, FY 2015 (millions) ..... 48
EXHIBIT 18: Distribution of Medicaid Benefit Spending by Eligibility Group and Service Category, FY 2013 ...................................................................................... 51
EXHIBIT 19: Medicaid Benefit Spending Per Full-Year Equivalent (FYE) Enrollee by Eligibility Group and Service Category, FY 2013 ................................................... 52
EXHIBIT 20: Distribution of Medicaid Enrollment and Benefit Spending by Users and Non-Users of Long-Term Services and Supports, FY 2013 .................................. 53
EXHIBIT 21: Medicaid Spending by State, Eligibility Group, and Dually Eligible Status, FY 2013 (millions) ................................................................................................... 54
EXHIBIT 22: Medicaid Benefit Spending Per Full-Year Equivalent (FYE) Enrollee by State and Eligibility Group, FY 2013 ................................................................................ 56
EXHIBIT 23: Medicaid Supplemental Payments to Hospital Providers by State, FY 2015 (millions) ................................................................................................... 59
EXHIBIT 24: Medicaid Supplemental Payments to Non-Hospital Providers by State, FY 2015 (millions) ................................................................................................... 61
EXHIBIT 25: Medicaid Gross Spending for Drugs by Delivery System and Brand or Generic Status, FY 2015 (millions) ...................................................................................... 64
EXHIBIT 26: Medicaid Drug Prescriptions by Delivery System and Brand or Generic Status, FY 2015 (thousands) .............................................................................................. 67
EXHIBIT 27: Medicaid Gross Spending and Rebates for Drugs by Delivery System, FY 2015 (millions) ................................................................................................... 69
Medicaid Managed Care
EXHIBIT 28: Percentage of Medicaid Enrollees in Managed Care by State, July 1, 2014 ....... 72
EXHIBIT 29: Percentage of Medicaid Enrollees in Managed Care by State and Eligibility Group, FY 2013 ......................................................................................................... 75
Medicaid Program Administration
EXHIBIT 30: Total Medicaid Administrative Spending by State and Category, FY 2015 (millions) .................................................................................................... 78
CHIP
EXHIBIT 31: Child Enrollment in CHIP and Medicaid by State, FY 2015 .................................. 81
EXHIBIT 32: CHIP Spending by State, FY 2015 (millions) ......................................................... 83
EXHIBIT 33: Federal CHIP Allotments, FY 2016 (millions) ........................................................ 86

MACStats: Medicaid and CHIP Data Book ix
Table of Contents
SECTION 4: Medicaid and CHIP Eligibility ....................................................................................... 89
Key Points .................................................................................................................................. 90
EXHIBIT 34: Medicaid and CHIP Income Eligibility Levels as a Percentage of the FPL for Children and Pregnant Women by State, July 2016 ............................................. 91
EXHIBIT 35: Medicaid Income Eligibility Levels as a Percentage of the FPL for Non-Aged, Non-Disabled, Non-Pregnant Adults by State, July 2016 ...................................... 94
EXHIBIT 36: Medicaid Income Eligibility Levels as a Percentage of the FPL for Individuals Age 65 and Older and Persons with Disabilities by State, 2016 .......................... 97
EXHIBIT 37: Income as a Percentage of the FPL for Various Family Sizes, 2016 ................ 100
SECTION 5: Beneficiary Health, Service Use, and Access to Care .................................................. 103
Key Points ................................................................................................................................ 104
EXHIBIT 38: Coverage, Demographic, and Health Characteristics of Non-Institutionalized Individuals Age 0–18 by Primary Source of Health Coverage, 2015 ................. 105
EXHIBIT 39: Use of Care among Non-Institutionalized Individuals Age 0–18 by Primary Source of Health Coverage, 2015, Data from National Health Interview Survey ........... 108
EXHIBIT 40: Use of Care among Non-Institutionalized Individuals Age 0–18 by Primary Source of Health Coverage, 2014, Data from Medical Expenditures Panel Survey ....... 110
EXHIBIT 41: Measures of Access to Care among Non-Institutionalized Individuals Age 0–18 by Primary Source of Health Coverage, 2015 ............................................ 112
EXHIBIT 42: Coverage, Demographic, and Health Characteristics of Non-Institutionalized Individuals Age 19–64 by Primary Source of Health Coverage, 2015 ............... 114
EXHIBIT 43: Use of Care among Non-Institutionalized Individuals Age 19–64 by Primary Source of Health Coverage, 2015, Data from National Health Interview Survey ........... 118
EXHIBIT 44: Use of Care among Non-Institutionalized Individuals Age 19–64 by Primary Source of Health Coverage, 2014, Data from Medical Expenditures Panel Survey ....... 121
EXHIBIT 45: Measures of Access to Care among Non-Institutionalized Individuals Age 19–64 by Primary Source of Health Coverage, 2015 .......................................... 123
SECTION 6: Technical Guide to MACStats ..................................................................................... 125
Interpreting Medicaid and CHIP Enrollment and Spending Numbers ...................................... 127
Understanding Data on Health and Other Characteristics of Medicaid and CHIP Populations ... 128
Methodology for Adjusting Benefit Spending Data .................................................................... 130
EXHIBIT 46: Medicaid Benefit Spending in MSIS and CMS-64 Data by State, FY 2013 (millions) ................................................................................................. 132
EXHIBIT 47: Service Categories Used to Adjust FY 2013 Medicaid Benefit Spending in the MSIS to Match CMS-64 Totals .................................................................. 134
Understanding Managed Care Enrollment and Spending Data ................................................. 136
Endnotes ................................................................................................................................ 137


MACStats: Medicaid and CHIP Data Book xi
Introduction
IntroductionThis 2016 edition of the MACStats: Medicaid and CHIP Data Book presents the most current data available on Medicaid and the State Children’s Health Insurance Program (CHIP), two programs that provide a safety net for low-income populations who otherwise would not have access to health care coverage and that cover services other payers often do not cover.
The MACStats data book compiles the broad range of Medicaid and CHIP statistics that MACPAC regularly updates on macpac.gov into a single, end-of-year publication. Our purpose is to bring together in one place federal and state data on Medicaid and CHIP that come from multiple data sources and are often difficult to find.
The data book provides context for understanding these programs and how they fit in the larger health care system. For example: Medicaid and CHIP combined still account for a smaller share of total health care spending than Medicare, despite covering more people (Section 1). After experiencing high rates of growth in 2014 and 2015, Medicaid and CHIP enrollment grew less than 1 percent in 2016 (Exhibit 11). Managed care enrollment and spending continue to climb (Exhibits 17 and 28). And children whose primary coverage source is Medicaid or CHIP are reported to have well-child checkups at rates similar to those with private coverage (Exhibit 39).
The December 2016 data book is divided into six sections:
• an overview with key statistics on Medicaid and CHIP;
• trends in Medicaid spending, enrollment, and share of state budgets;
• Medicaid and CHIP enrollment and spending, with information provided by state, service category, and eligibility group;
• Medicaid and CHIP eligibility;
• measures of beneficiary health, use of services, and access to care; and
• a technical guide.
The technical guide describes the data sources used in MACStats and the methods that MACPAC uses to analyze these data. It also provides guidance in interpreting the exhibits and how specific data—such as those on enrollment and spending—may differ from each other or from those published elsewhere.
We would like to thank the many individuals at the Centers for Medicare & Medicaid Services and our contractors—the State Health Access Data Assistance Center (SHADAC) and Acumen, LLC—who provided their insights and assistance. We would also like to thank Paula Gordon and GKV Communications for providing valuable support in copyediting, formatting, and producing this data book.


SECTION 1
Overview— Key Statistics

December 20162
Section 1: Overview—Key Statistics
Section 1: Overview—Key Statistics
Key Points• In 2015, more than one-quarter of the U.S. population was enrolled in Medicaid or the State
Children's Health Insurance Program (CHIP) at some point during the year. The estimated number of people ever enrolled in Medicaid was 81.0 million in fiscal year (FY) 2015; for CHIP, the figure was 8.9 million (Exhibit 1).
• Nearly half (45.9 percent) of all individuals enrolled in Medicaid in 2015 had family incomes below 100 percent of the federal poverty level (FPL). Nearly two-thirds (63.8 percent) of all individuals enrolled in Medicaid had incomes less than 138 percent FPL (Exhibit 2).
• People enrolled in Medicaid or CHIP were more likely to be Hispanic or black than those enrolled in other types of coverage. Additionally, Medicaid and CHIP enrollees were more likely to be in fair or poor health than either privately insured or uninsured individuals (Exhibit 2).
• Medicaid and CHIP together accounted for 16.8 percent of national health expenditures in calendar year 2014, Medicare accounted for 20.4 percent, and private insurance accounted for 32.7 percent (Exhibit 3).
• The share of the federal budget devoted to Medicaid and Medicare has grown steadily since the programs were enacted in 1965, but Medicaid continues to account for a smaller share (9.5 percent in FY 2015) than Medicare (14.6 percent) (Exhibit 4).
• Medicaid spending as a share of state budgets varies depending on whether federal funds are included. Looking only at the state-funded portion of state budgets (that is, the portion states must finance on their own through taxes and other means), Medicaid’s share was 15.3 percent in state fiscal year (SFY) 2014. After including federal funds in state budgets, Medicaid’s share was 25.6 percent in SFY 2014 (Exhibit 5).

MACStats: Medicaid and CHIP Data Book 3
Section 1: Overview—Key Statistics
MAC
Stat
sSe
ctio
n 1
Popu
latio
nEv
er d
urin
g FY
201
5Po
int i
n tim
e du
ring
FY 2
015
Poin
t in
time
durin
g CY
201
5
Estim
ates
bas
ed o
n ad
min
istr
ativ
e da
ta (C
MS)
1Su
rvey
dat
a (N
HIS
)2
Med
icai
d en
rolle
es81
.03
67.3
Not
ava
ilabl
e
CHIP
enr
olle
es8.
95.
8N
ot a
vaila
ble
Tota
ls fo
r Med
icai
d an
d CH
IP89
.93
73.1
56.3
Cens
us B
urea
u da
taSu
rvey
dat
a (N
HIS
)2
U.S
. pop
ulat
ion
321.
9432
0.74
316.
0
Adm
inis
trat
ive
and
Cens
us B
urea
u da
taSu
rvey
dat
a (N
HIS
)2
Med
icai
d an
d CH
IP e
nrol
lmen
t as
a pe
rcen
tage
of U
.S. p
opul
atio
n27
.9%
122
.8%
17.8
%
Not
es: F
Y is
fisc
al y
ear.
CY is
cal
enda
r yea
r. CM
S is
Cen
ters
for M
edic
are
& M
edic
aid
Serv
ices
. NH
IS is
Nat
iona
l Hea
lth In
terv
iew
Sur
vey.
Exc
lude
s th
e te
rrito
ries.
For
mor
e de
taile
d di
scus
sion
of w
hy M
edic
aid
and
CHIP
enr
ollm
ent n
umbe
rs c
an v
ary,
see
http
s://
ww
w.m
acpa
c.go
v/m
acst
ats/
data
-sou
rces
-and
-met
hods
/. As
not
ed in
this
exh
ibit,
reas
ons
incl
ude
diffe
renc
es in
the
sour
ces
of d
ata
(e.g
., ad
min
istr
ativ
e re
cord
s ve
rsus
sur
vey
inte
rvie
ws)
, the
indi
vidu
als
incl
uded
in th
e da
ta (e
.g.,
thos
e re
ceiv
ing
full
vers
us li
mite
d be
nefit
s, th
ose
who
are
livi
ng in
the
com
mun
ity v
ersu
s an
inst
itutio
n su
ch a
s a
nurs
ing
hom
e), a
nd th
e en
rollm
ent p
erio
d ex
amin
ed (e
.g.,
ever
dur
ing
the
year
ver
sus
at a
poi
nt in
tim
e).
1 Es
timat
es b
ased
on
adm
inis
trat
ive
data
are
from
the
Pres
iden
t’s b
udge
t for
FY
2017
. Med
icai
d an
d CH
IP e
nrol
lmen
t num
bers
obt
aine
d fr
om a
dmin
istr
ativ
e da
ta in
clud
e in
divi
dual
s w
ho re
ceiv
ed li
mite
d be
nefit
s (e
.g.,
emer
genc
y se
rvic
es o
nly)
. Com
bini
ng a
dmin
istr
ativ
e to
tals
from
Med
icai
d an
d CH
IP m
ay c
ause
som
e in
divi
dual
s to
be
doub
le-
coun
ted
if th
ey w
ere
enro
lled
in b
oth
prog
ram
s du
ring
the
year
. Ove
rcou
ntin
g of
enr
olle
es in
the
adm
inis
trat
ive
data
may
occ
ur fo
r oth
er re
ason
s—fo
r exa
mpl
e, in
divi
dual
s m
ay
mov
e an
d be
enr
olle
d in
two
stat
es’ M
edic
aid
prog
ram
s du
ring
the
year
. Exc
lude
s ab
out 1
.5 m
illio
n in
divi
dual
s in
the
terr
itorie
s. A
ll ot
her f
igur
es in
the
tabl
e ex
clud
e in
divi
dual
s in
the
terr
itorie
s, b
ut th
e nu
mbe
r of e
xclu
ded
indi
vidu
als
is n
ot a
vaila
ble.
2
NH
IS d
ata
excl
ude
indi
vidu
als
in in
stitu
tions
suc
h as
nur
sing
hom
es, a
nd a
ctiv
e-du
ty m
ilita
ry; i
n ad
ditio
n, s
urve
ys s
uch
as th
e N
HIS
gen
eral
ly d
o no
t cla
ssify
lim
ited
bene
fits
as M
edic
aid
or C
HIP
cov
erag
e an
d re
spon
dent
s ar
e kn
own
to u
nder
repo
rt M
edic
aid
and
CHIP
cov
erag
e.3
Ever
-enr
olle
d es
timat
e w
as n
ot a
vaila
ble
from
CM
S fo
r the
gro
up o
f new
adu
lts e
nrol
led
unde
r sta
te e
xpan
sion
s of
Med
icai
d th
at b
egan
in J
anua
ry 2
014
and
beyo
nd; t
otal
re
flect
s th
e po
int-i
n-tim
e es
timat
e fo
r thi
s gr
oup
inst
ead.
As
a re
sult,
the
tota
l is
an u
nder
estim
ate
of th
e nu
mbe
r of p
eopl
e ev
er e
nrol
led.
4
The
Cens
us B
urea
u nu
mbe
r in
the
ever
-enr
olle
d co
lum
n w
as th
e es
timat
ed U
.S. r
esid
ent p
opul
atio
n as
of S
epte
mbe
r 201
5 (t
he m
onth
with
the
larg
est c
ount
in F
Y 20
15);
the
num
ber o
f res
iden
ts e
ver l
ivin
g in
the
Uni
ted
Stat
es d
urin
g th
e ye
ar is
not
ava
ilabl
e. T
he C
ensu
s Bu
reau
poi
nt-in
-tim
e nu
mbe
r is
the
aver
age
estim
ated
mon
thly
num
ber o
f U.S
. re
side
nts
for F
Y 20
15.
Sour
ce: M
ACPA
C, 2
016,
ana
lysi
s of
Off
ice
of th
e Ac
tuar
y, CM
S, 2
016,
em
ail t
o M
ACPA
C st
aff,
Augu
st 1
5; a
naly
sis
of N
HIS
dat
a; a
nd a
naly
sis
of B
urea
u of
the
Cens
us, 2
016,
Mon
thly
po
pula
tion
estim
ates
for t
he U
nite
d St
ates
: Apr
il 1,
201
0 to
Dec
embe
r 1, 2
016,
Nat
iona
l tot
als:
vin
tage
201
5, h
ttp:
//w
ww
.cen
sus.
gov/
pope
st/d
ata/
natio
nal/t
otal
s/20
15/in
dex.
htm
l.
EXH
IBIT
1.
Med
icai
d an
d CH
IP E
nrol
lmen
t as
a Sh
are
of th
e U
.S. P
opul
atio
n, 2
015
(mill
ions
)

December 20164
Section 1: Overview—Key Statistics
MAC
Stat
sSe
ctio
n 1
Char
acte
ristic
Sele
cted
cov
erag
e so
urce
s at
tim
e of
inte
rvie
w, a
ll ag
es1
Sele
cted
cov
erag
e so
urce
s at
tim
e of
inte
rvie
w, a
ge 0
-181
Tota
lM
edic
are
Priv
ate2
Med
icai
d/CH
IP3
Uni
nsur
ed4
Tota
lPr
ivat
e2M
edic
aid/
CHIP
3U
nins
ured
4
Tota
l (pe
rcen
t dis
trib
utio
n ac
ross
co
vera
ge s
ourc
es)5
100.
0%16
.3%
62.9
%17
.9%
9.0%
100.
0%54
.9%
37.6
%4.
7%
Cove
rage
Leng
th o
f tim
e w
ith a
ny c
over
age
durin
g ye
ar
Full
year
87.2
*98
.7*
95.8
*92
.3–
92
.7*
97.5
*95
.6–
Part
yea
r6.
6*1.
3*4.
2*7.
727
.04.
9*2.
5*4.
441
.4
No
cove
rage
dur
ing
year
6.1
–
–
–73
.02.
5 –
–
58.6
Mul
tiple
cov
erag
e so
urce
s at
tim
e of
inte
rvie
w
Yes,
any
Med
icar
e an
d M
edic
aid/
CHIP
co
mbi
natio
n61.
7*10
.4
–
9.5
–
† –
†
–
Yes,
any
priv
ate
and
Med
icai
d/CH
IP
com
bina
tion
0.5*
–
0.8*
2.8
–
1.1*
2.0*
2.9
–
Yes,
any
oth
er c
ombi
natio
n7.
0*43
.4*
11.3
*0.
4–
†
0.0
––
No
90.8
*46
.2*
87.9
87
.410
0.0*
98.9
*98
.0*
97.0
100.
0*
Dem
ogra
phic
s
Age
0–18
24.6
*†
21.5
*51
.712
.9*
100.
010
0.0
100.
010
0.0
19–
6460
.7*
14.4
*67
.0*
41.8
86.3
*–
––
–
65 o
r old
er14
.7*
85.3
*11
.5*
6.5
†–
––
–
Gen
der
Mal
e48
.9
45.1
48
.9*
44.9
54.8
*51
.0*
50.4
51
.949
.7
Fem
ale
51.1
54
.9
51.1
*55
.145
.2*
49.0
*49
.6
48.1
50.3
Race
His
pani
c17
.7*
7.9*
11.8
*31
.538
.3*
24.6
*14
.7*
36.7
43.1
Whi
te, n
on-H
ispa
nic
62.7
*77
.4*
70.9
*40
.242
.8
53.7
*67
.4*
35.7
42.9
*
Blac
k, n
on-H
ispa
nic
12.6
*10
.0*
9.9*
21.8
13.3
*14
.6*
9.9*
21.9
8.3*
Oth
er n
on-w
hite
, non
-His
pani
c7.
0*4.
8*7.
4 6.
55.
7 7.
1*8.
0*5.
75.
7
EXH
IBIT
2.
Char
acte
ristic
s of
Non
-Inst
itutio
naliz
ed In
divi
dual
s by
Age
and
Sou
rce
of H
ealth
Cov
erag
e, 2
015

MACStats: Medicaid and CHIP Data Book 5
Section 1: Overview—Key Statistics
MAC
Stat
sSe
ctio
n 1
EXH
IBIT
2.
(con
tinue
d)
Char
acte
ristic
Sele
cted
cov
erag
e so
urce
s at
tim
e of
inte
rvie
w, a
ge 1
9-64
1Se
lect
ed c
over
age
sour
ces
at
time
of in
terv
iew
, age
65
and
olde
r1
Tota
lM
edic
are
Priv
ate2
Med
icai
d/CH
IP3
Uni
nsur
ed4
Tota
lM
edic
are
Priv
ate2
Med
icai
d/CH
IP3
Tota
l (pe
rcen
t dis
trib
utio
n ac
ross
co
vera
ge s
ourc
es)5
100.
0%3.
9%69
.6%
12.4
%12
.8%
10
0.0%
94.2
%48
.9%
7.9%
Cove
rage
Leng
th o
f tim
e w
ith a
ny c
over
age
durin
g ye
ar
Full
year
82.2
*95
.7*
94.6
*87
.2–
98.7
99
.2
99.4
99
.2
Part
yea
r8.
8*4.
3*5.
4*12
.825
.2*
0.9
0.8
0.6
†
No
cove
rage
dur
ing
year
9.1
–
–
–74
.80.
4 –
–
–
Mul
tiple
cov
erag
e so
urce
s at
tim
e of
inte
rvie
w
Yes,
any
Med
icar
e an
d M
edic
aid/
CHIP
co
mbi
natio
n61.
2*30
.3*
–
9.5
–
6.6*
7.0*
–
83.9
Yes,
any
priv
ate
and
Med
icai
d/CH
IP
com
bina
tion
0.4*
–
0.5*
3.0
–
†–
†
†
Yes,
any
oth
er c
ombi
natio
n0.
7*17
.3*
1.0*
†–
45
.1*
48.0
*92
.4*
4.5
No
97.8
*52
.4*
98.5
*87
.310
0.0*
48.2
*45
.0*
7.5*
11.4
Dem
ogra
phic
s
Age
0–18
––
––
––
––
–
19–
6410
0.0
100.
010
0.0
100.
010
0.0
––
––
65 o
r old
er–
––
––
100.
010
0.0
100.
010
0.0
Gen
der
Mal
e49
.0*
50.0
*49
.4*
38.0
55.7
*44
.5*
44.3
*43
.5*
34.7
Fem
ale
51.0
*50
.0*
50.6
*62
.044
.3*
55.5
*55
.7*
56.5
*65
.3
Race
His
pani
c17
.2*
9.5*
12.3
*25
.637
.7*
8.0*
7.6*
3.7*
27.9
Whi
te, n
on-H
ispa
nic
62.7
*69
.1*
69.4
*45
.242
.7
78.1
*78
.9*
86.0
*44
.4
Blac
k, n
on-H
ispa
nic
12.7
*17
.5*
10.5
*22
.314
.0*
8.8*
8.7*
6.5*
17.2
Oth
er n
on-w
hite
, non
-His
pani
c7.
4*3.
9*7.
8 7.
05.
5 5.
1*4.
8*3.
9*10
.5

December 20166
Section 1: Overview—Key Statistics
MAC
Stat
sSe
ctio
n 1
Char
acte
ristic
Sele
cted
cov
erag
e so
urce
s at
tim
e of
inte
rvie
w, a
ll ag
es1
Sele
cted
cov
erag
e so
urce
s at
tim
e of
inte
rvie
w, a
ge 0
-181
Tota
lM
edic
are
Priv
ate2
Med
icai
d/CH
IP3
Uni
nsur
ed4
Tota
lPr
ivat
e2M
edic
aid/
CHIP
3U
nins
ured
4
Educ
atio
n7
Less
than
hig
h sc
hool
12.1
%*
17.3
%*
6.1%
*28
.2%
27.7
%
–
–
––
H
igh
scho
ol d
iplo
ma/
GED
24.5
29
.9
21.0
*31
.733
.1
–
–
––
So
me
colle
ge31
.3*
26.9
*32
.0
31.3
28.1
*–
–
–
–
Colle
ge o
r gra
duat
e de
gree
32.1
*25
.9*
40.8
*8.
711
.1*
–
–
––
M
arita
l sta
tus7
Mar
ried
54.0
*52
.2*
60.6
*31
.939
.5*
–
–
––
Wid
owed
6.2*
22.6
*4.
6*6.
12.
0*–
–
–
–Di
vorc
ed o
r sep
arat
ed11
.7*
15.1
*9.
6*17
.313
.6*
–
–
––
Livi
ng w
ith p
artn
er7.
4*2.
9*6.
4*11
.113
.3*
–
–
––
Nev
er m
arrie
d20
.7*
7.2*
18.7
*33
.631
.5
–
–
––
Fam
ily in
com
eH
as in
com
e le
ss th
an 1
38 p
erce
nt F
PL22
.5*
20.8
*8.
3*63
.839
.7*
31.1
%*
8.5%
*63
.5%
38.9
%*
Has
inco
me
in ra
nges
sho
wn
belo
wLe
ss th
an 1
00 p
erce
nt F
PL14
.5*
11.1
*4.
3*45
.926
.4*
21.1
*4.
2*45
.822
.9*
100–
199
perc
ent F
PL19
.4*
23.1
*12
.0*
35.1
31.5
*23
.0*
12.6
*36
.135
.2
200–
399
perc
ent F
PL28
.7*
32.2
*31
.5*
15.1
31.0
*27
.6*
35.5
*14
.933
.0*
400
perc
ent F
PL o
r hig
her
37.2
*33
.4*
52.1
*3.
710
.9*
28.1
47
.6*
3.0
8.5*
Oth
er d
emog
raph
ic c
hara
cter
istic
sCi
tizen
of U
nite
d St
ates
93.1
*97
.6*
95.2
*93
.673
.5*
97.5
*98
.2
97.8
86.9
*Pa
rent
of a
dep
ende
nt c
hild
729
.6*
2.2*
31.1
*37
.936
.3
–
–
––
Cu
rren
tly w
orki
ng7
61.8
*13
.7*
73.6
*35
.264
.6*
–
–
––
Ve
tera
n78.
9*20
.5*
7.3*
3.8
2.8
–
–
––
Re
ceiv
es S
SI o
r SSD
I4.
2 13
.6
1.3*
13.4
0.8*
1.2*
0.5*
2.6
† H
ealth
Curr
ent h
ealth
sta
tus
Exce
llent
or v
ery
good
65.8
*40
.6*
72.1
*57
.661
.2*
84.2
*89
.9*
76.1
80.9
*G
ood
23.9
*33
.0*
21.6
*25
.628
.1*
14.0
*9.
2*20
.717
.7
Fair
or p
oor
10.3
*26
.4*
6.3*
16.8
10.8
*1.
9*0.
9*3.
3†
EXH
IBIT
2.
(con
tinue
d)

MACStats: Medicaid and CHIP Data Book 7
Section 1: Overview—Key Statistics
MAC
Stat
sSe
ctio
n 1
EXH
IBIT
2.
(con
tinue
d)
Char
acte
ristic
Sele
cted
cov
erag
e so
urce
s at
tim
e of
inte
rvie
w, a
ge 1
9-64
1Se
lect
ed c
over
age
sour
ces
at
time
of in
terv
iew
, age
65
and
olde
r1
Tota
lM
edic
are
Priv
ate2
Med
icai
d/CH
IP3
Uni
nsur
ed4
Tota
lM
edic
are
Priv
ate2
Med
icai
d/CH
IP3
Educ
atio
n7
Less
than
hig
h sc
hool
11.0
%*
22.8
%
5.2%
*25
.7%
27.7
%
16.6
%*
16.4
%*
11.3
%*
44.6
%H
igh
scho
ol d
iplo
ma/
GED
23.4
*35
.3
19.7
*32
.833
.2
28.9
29
.0
28.9
24
.9So
me
colle
ge32
.5*
30.0
33
.0
33.4
28.1
*26
.4*
26.4
*26
.5*
18.1
Colle
ge o
r gra
duat
e de
gree
33.0
*11
.9*
42.1
*8.
211
.0*
28.2
*28
.2*
33.4
*12
.4M
arita
l sta
tus7
Mar
ried
53.8
*36
.6
60.7
*32
.339
.5*
54.9
*54
.9*
60.4
*29
.0W
idow
ed1.
6*5.
2*1.
3*2.
31.
7 25
.1*
25.6
*23
.6*
30.7
Divo
rced
or s
epar
ated
11.3
*26
.3*
9.5*
15.6
13.5
*13
.4*
13.2
*10
.6*
28.0
Livi
ng w
ith p
artn
er8.
6*7.
6*7.
1*12
.413
.5
2.1
2.1
2.2
†N
ever
mar
ried
24.6
*24
.3*
21.4
*37
.431
.8*
4.5*
4.3*
3.3*
9.5
Fam
ily in
com
eH
as in
com
e le
ss th
an 1
38 p
erce
nt F
PL20
.5*
46.4
*8.
3*63
.939
.9*
16.5
*16
.3*
7.6*
65.9
Has
inco
me
in ra
nges
sho
wn
belo
wLe
ss th
an 1
00 p
erce
nt F
PL13
.3*
29.0
*4.
6*46
.026
.9*
8.5*
8.1*
3.2*
45.5
100–
199
perc
ent F
PL17
.6
34.1
11
.3*
34.4
31.1
*20
.5*
21.0
*14
.7*
32.3
200–
399
perc
ent F
PL28
.1*
25.2
*29
.7*
15.5
30.8
*33
.2*
33.5
*34
.5*
14.6
400
perc
ent F
PL o
r hig
her
40.9
*11
.7*
54.4
*3.
911
.1*
37.6
*37
.2*
47.5
*7.
2O
ther
dem
ogra
phic
cha
ract
eris
tics
Citiz
en o
f Uni
ted
Stat
es90
.3*
96.7
*93
.6*
89.2
71.7
*96
.9*
97.8
*98
.6*
88.1
Pare
nt o
f a d
epen
dent
chi
ld7
36.6
*12
.6*
36.3
*43
.836
.7*
0.5
0.4
† †
Curr
ently
wor
king
773
.0*
10.0
*82
.9*
40.1
64.9
*15
.7*
14.4
*19
.2*
3.6
Vete
ran7
5.7*
9.0*
4.6*
3.3
2.8
22.4
*22
.4*
22.5
*7.
1Re
ceiv
es S
SI o
r SSD
I5.
6*74
.7*
1.7*
24.1
0.8*
3.6*
3.4*
0.7*
30.7
Hea
lthCu
rren
t hea
lth s
tatu
sEx
celle
nt o
r ver
y go
od63
.3*
11.9
*70
.0*
40.5
58.5
*45
.3*
45.2
*51
.1*
21.3
Goo
d25
.7
30.4
23
.6*
31.1
29.6
33
.4
33.6
33
.1
29.5
Fair
or p
oor
11.0
*57
.8*
6.4*
28.5
11.9
*21
.3*
21.2
*15
.9*
49.2

December 20168
Section 1: Overview—Key Statistics
MAC
Stat
sSe
ctio
n 1
EXH
IBIT
2.
(con
tinue
d)
Not
es: F
PL is
fede
ral p
over
ty le
vel.
SSDI
is S
ocia
l Sec
urity
Dis
abili
ty In
sura
nce.
SSI
is S
uppl
emen
tal S
ecur
ity In
com
e. P
erce
ntag
e ca
lcul
atio
ns fo
r eac
h ite
m in
the
exhi
bit
excl
ude
indi
vidu
als
with
mis
sing
and
unk
now
n va
lues
. Sta
ndar
d er
rors
are
ava
ilabl
e on
line
in th
e do
wnl
oada
ble
Exce
l ver
sion
of t
his
exhi
bit a
t htt
ps:/
/ww
w.m
acpa
c.go
v/pu
blic
atio
n/ch
arac
teris
tics-
of-n
on-in
stitu
tiona
lized
-indi
vidu
als-
by-s
ourc
e-of
-hea
lth-in
sura
nce/
. The
indi
vidu
al c
ompo
nent
s lis
ted
unde
r the
sub
cate
gorie
s ar
e no
t alw
ays
mut
ually
exc
lusi
ve a
nd m
ay n
ot a
dd to
100
per
cent
. Due
to d
iffer
ence
s in
met
hodo
logy
(suc
h as
the
wor
ding
of q
uest
ions
, len
gth
of re
call
perio
ds, a
nd p
rom
pts
or p
robe
s us
ed
to e
licit
resp
onse
s), e
stim
ates
obt
aine
d fr
om d
iffer
ent s
urve
y da
ta s
ourc
es w
ill v
ary.
For
exa
mpl
e, th
e N
atio
nal H
ealth
Inte
rvie
w S
urve
y (N
HIS
) is
know
n to
pro
duce
hig
her
estim
ates
of s
ervi
ce u
se th
an th
e M
edic
al E
xpen
ditu
res
Pane
l Sur
vey
(MEP
S). F
or p
urpo
ses
of c
ompa
ring
grou
ps o
f ind
ivid
uals
(as
in th
is e
xhib
it), t
he N
HIS
pro
vide
s th
e m
ost
rece
nt in
form
atio
n av
aila
ble.
For
oth
er p
urpo
ses,
suc
h as
mea
surin
g le
vels
of u
se re
lativ
e to
a p
artic
ular
ben
chm
ark
or g
oal,
it m
ay b
e ap
prop
riate
to c
onsu
lt es
timat
es fr
om
MEP
S or
ano
ther
sou
rce.
* Di
ffer
ence
from
Med
icai
d/CH
IP is
sta
tistic
ally
sig
nific
ant a
t the
0.0
5 le
vel.
† Es
timat
e is
unr
elia
ble
beca
use
it ha
s a
rela
tive
stan
dard
err
or g
reat
er th
an 3
0 pe
rcen
t.
– D
ash
indi
cate
s ze
ro; 0
.0%
indi
cate
s an
am
ount
less
than
0.0
5% th
at ro
unds
to z
ero.
1 To
tal i
nclu
des
all n
on-in
stitu
tiona
lized
indi
vidu
als,
rega
rdle
ss o
f cov
erag
e so
urce
. In
this
exh
ibit,
the
sum
of v
alue
s ac
ross
hea
lth in
sura
nce
cove
rage
type
s m
ay n
ot a
dd
to 1
00 p
erce
nt fo
r eac
h ag
e gr
oup
beca
use
indi
vidu
als
may
hav
e m
ultip
le s
ourc
es o
f cov
erag
e an
d be
caus
e no
t all
type
s of
cov
erag
e ar
e di
spla
yed.
Oth
er M
ACSt
ats
exhi
bits
ap
ply
a hi
erar
chy
to a
ssig
n in
divi
dual
s w
ith m
ultip
le c
over
age
sour
ces
to a
prim
ary
sour
ce, a
nd m
ay th
eref
ore
have
diff
eren
t res
ults
than
thos
e sh
own
here
. Cov
erag
e so
urce
is
def
ined
as
of th
e tim
e of
the
surv
ey in
terv
iew
. Sin
ce a
n in
divi
dual
may
hav
e m
ultip
le c
over
age
sour
ces
or c
hang
es o
ver t
ime,
resp
onse
s to
sur
vey
ques
tions
may
refle
ct
char
acte
ristic
s or
exp
erie
nces
ass
ocia
ted
with
a c
over
age
sour
ce o
ther
than
the
one
assi
gned
in th
is e
xhib
it.2
Priv
ate
heal
th in
sura
nce
cove
rage
exc
lude
s pl
ans
that
pai
d fo
r onl
y on
e ty
pe o
f ser
vice
, suc
h as
acc
iden
ts o
r den
tal c
are.
3 M
edic
aid/
CHIP
als
o in
clud
es p
erso
ns c
over
ed b
y ot
her s
tate
-spo
nsor
ed h
ealth
pla
ns.
4 In
divi
dual
s w
ere
defin
ed a
s un
insu
red
if th
ey d
id n
ot h
ave
any
priv
ate
heal
th in
sura
nce,
Med
icai
d, C
HIP
, Med
icar
e, s
tate
-spo
nsor
ed o
r oth
er g
over
nmen
t-spo
nsor
ed h
ealth
pl
an, o
r mili
tary
pla
n. In
divi
dual
s w
ere
also
def
ined
as
unin
sure
d if
they
had
onl
y In
dian
Hea
lth S
ervi
ce c
over
age
or h
ad o
nly
a pr
ivat
e pl
an th
at p
aid
for o
ne ty
pe o
f ser
vice
, su
ch a
s ac
cide
nts
or d
enta
l car
e.5
Com
pone
nts
may
not
sum
to 1
00 p
erce
nt b
ecau
se in
divi
dual
s m
ay h
ave
mul
tiple
sou
rces
of c
over
age
and
beca
use
not a
ll ty
pes
of c
over
age
are
disp
laye
d.6
NH
IS a
nd o
ther
sur
vey
data
und
eres
timat
e th
e nu
mbe
r of i
ndiv
idua
ls d
ually
enr
olle
d in
Med
icar
e an
d M
edic
aid,
in p
art b
ecau
se m
ost s
urve
ys d
o no
t cou
nt th
ose
who
se o
nly
Med
icai
d be
nefit
is p
aym
ent o
f Med
icar
e pr
emiu
ms
and
cost
sha
ring
as h
avin
g M
edic
aid
cove
rage
.7
Info
rmat
ion
is li
mite
d to
thos
e ag
e 19
or o
lder
.
Sour
ce: M
ACPA
C, 2
016,
ana
lysi
s of
NH
IS d
ata.

MACStats: Medicaid and CHIP Data Book 9
Section 1: Overview—Key Statistics
MAC
Stat
sSe
ctio
n 1
EXH
IBIT
3.
Nat
iona
l Hea
lth E
xpen
ditu
res
by T
ype
and
Paye
r, 20
14
Type
of e
xpen
ditu
re
Paye
r am
ount
(mill
ions
)
Tota
lM
edic
aid
CHIP
Med
icar
ePr
ivat
e in
sura
nce
Oth
er
heal
th
insu
ranc
e1
Oth
er
third
par
ty
paye
rs2
Out
of
pock
et
Tota
l$3
,031
,292
$495
,766
$13,
183
$618
,706
$990
,988
$98,
245
$484
,585
$329
,819
Hos
pita
l car
e97
1,83
616
8,01
23,
362
250,
323
362,
097
56,9
9999
,669
31,3
73
Phys
icia
n an
d cl
inic
al s
ervi
ces
603,
655
63,9
933,
169
138,
366
254,
656
22,0
6567
,371
54,0
35
Dent
al s
ervi
ces
113,
549
10,0
681,
458
410
54,0
701,
333
485
45,7
26
Oth
er p
rofe
ssio
nal s
ervi
ces3
84,3
986,
266
250
19,6
1729
,713
–7,
259
21,2
92
Hom
e he
alth
car
e83
,198
29,6
4536
34,7
288,
278
429
2,71
47,
369
Oth
er n
on-d
urab
le m
edic
al p
rodu
cts4
56,9
36–
–2,
251
––
–54
,685
Pres
crip
tion
drug
s29
7,69
827
,333
1,41
386
,388
127,
288
8,51
42,
040
44,7
22
Dura
ble
med
ical
equ
ipm
ent5
46,3
556,
120
124
7,73
98,
174
–60
723
,592
Nur
sing
car
e fa
cilit
ies
and
cont
inui
ng c
are
retir
emen
t com
mun
ities
615
5,58
649
,594
1035
,704
13,0
834,
731
11,3
0641
,159
Oth
er h
ealth
, res
iden
tial,
and
pers
onal
car
e se
rvic
es7
150,
396
83,8
781,
017
5,18
411
,441
948
42,0
615,
867
Adm
inis
trat
ion8
234,
830
50,8
582,
346
37,9
9612
2,18
73,
226
18,2
17–
Publ
ic h
ealth
act
ivity
78,9
93–
––
––
78,9
92–
Inve
stm
ent
153,
862
––
––
–15
3,86
2–

December 201610
Section 1: Overview—Key Statistics
MAC
Stat
sSe
ctio
n 1
Type
of e
xpen
ditu
re
Shar
e of
tota
l
Tota
lM
edic
aid
CHIP
Med
icar
ePr
ivat
e in
sura
nce
Oth
er
heal
th
insu
ranc
e1
Oth
er
third
par
ty
paye
rs2
Out
of
pock
et
Tota
l10
0.0%
16.4
%0.
4%20
.4%
32.7
%3.
2%16
.0%
10.9
%
Hos
pita
l car
e10
0.0
17.3
0.3
25.8
37.3
5.9
10.3
3.2
Phys
icia
n an
d cl
inic
al s
ervi
ces
100.
010
.60.
522
.942
.23.
711
.29.
0
Dent
al s
ervi
ces
100.
08.
91.
30.
447
.61.
20.
440
.3
Oth
er p
rofe
ssio
nal s
ervi
ces3
100.
07.
40.
323
.235
.2–
8.6
25.2
Hom
e he
alth
car
e10
0.0
35.6
0.0
41.7
9.9
0.5
3.3
8.9
Oth
er n
on-d
urab
le m
edic
al p
rodu
cts4
100.
0–
–4.
0–
––
96.0
Pres
crip
tion
drug
s10
0.0
9.2
0.5
29.0
42.8
2.9
0.7
15.0
Dura
ble
med
ical
equ
ipm
ent5
100.
013
.20.
316
.717
.6–
1.3
50.9
Nur
sing
car
e fa
cilit
ies
and
cont
inui
ng c
are
retir
emen
t com
mun
ities
610
0.0
31.9
0.0
22.9
8.4
3.0
7.3
26.5
Oth
er h
ealth
, res
iden
tial, a
nd p
erso
nal c
are
serv
ices
710
0.0
55.8
0.7
3.4
7.6
0.6
28.0
3.9
Adm
inis
trat
ion8
100.
021
.71.
016
.252
.01.
47.
8–
Publ
ic h
ealth
act
ivity
100.
0–
––
––
100.
0–
Inve
stm
ent
100.
0–
––
––
100.
0–
Not
es: E
very
five
yea
rs th
e na
tiona
l hea
lth e
xpen
ditu
re a
ccou
nts
unde
rgo
a co
mpr
ehen
sive
revi
sion
that
incl
udes
the
inco
rpor
atio
n of
new
ly a
vaila
ble
sour
ce d
ata,
m
etho
dolo
gica
l and
def
initi
onal
cha
nges
, and
ben
chm
ark
estim
ates
from
the
U.S
. Cen
sus
Bure
au’s
qui
nque
nnia
l eco
nom
ic c
ensu
s. A
s a
resu
lt of
this
revi
sion
in 2
014,
th
e fig
ures
sho
wn
here
may
refle
ct m
etho
dolo
gica
l and
def
initi
onal
shi
fts
with
in p
ayer
and
ser
vice
cat
egor
ies
from
prio
r pub
licat
ions
of M
ACSt
ats.
For
exa
mpl
e, th
e 20
14
met
hodo
logy
impl
emen
ts a
new
met
hod
for a
lloca
ting
Med
icai
d m
anag
ed c
are
prem
ium
s to
the
good
s an
d se
rvic
es c
ateg
orie
s fo
r sta
tes
that
hav
e a
larg
e pe
rcen
tage
of
Med
icai
d m
anag
ed c
are
spen
ding
. Thi
s ch
ange
cau
sed
a do
wnw
ard
revi
sion
for h
ospi
tals
and
hom
e he
alth
car
e an
d an
upw
ard
revi
sion
for o
ther
ser
vice
cat
egor
ies.
– D
ash
indi
cate
s ze
ro; 0
.0%
indi
cate
s an
am
ount
less
than
0.0
5% th
at ro
unds
to z
ero.
EXH
IBIT
3.
(con
tinue
d)

MACStats: Medicaid and CHIP Data Book 11
Section 1: Overview—Key Statistics
MAC
Stat
sSe
ctio
n 1
1 U
.S. D
epar
tmen
t of D
efen
se a
nd U
.S. D
epar
tmen
t of V
eter
ans’
Aff
airs
.2
Incl
udes
all
othe
r pub
lic a
nd p
rivat
e pr
ogra
ms
and
expe
nditu
res
exce
pt fo
r out
-of-p
ocke
t am
ount
s.3
The
othe
r pro
fess
iona
l ser
vice
s ca
tego
ry in
clud
es s
ervi
ces
prov
ided
in e
stab
lishm
ents
ope
rate
d by
hea
lth p
ract
ition
ers
othe
r tha
n ph
ysic
ians
and
den
tists
, inc
ludi
ng th
ose
prov
ided
by
priv
ate-
duty
nur
ses,
chi
ropr
acto
rs, p
odia
tris
ts, o
ptom
etris
ts, a
nd p
hysi
cal,
occu
patio
nal,
and
spee
ch th
erap
ists
, am
ong
othe
rs.
4 Th
e ot
her n
on-d
urab
le m
edic
al p
rodu
cts
cate
gory
incl
udes
the
reta
il sa
les
of n
on-p
resc
riptio
n dr
ugs
and
med
ical
sun
drie
s.5
The
dura
ble
med
ical
equ
ipm
ent c
ateg
ory
incl
udes
reta
il sa
les
of it
ems
such
as
cont
act l
ense
s, e
yegl
asse
s, a
nd o
ther
oph
thal
mic
pro
duct
s, s
urgi
cal a
nd o
rtho
pedi
c pr
oduc
ts,
hear
ing
aids
, whe
elch
airs
, and
med
ical
equ
ipm
ent r
enta
ls.
6 Th
e nu
rsin
g ca
re fa
cilit
ies
and
cont
inui
ng c
are
retir
emen
t com
mun
ities
cat
egor
y in
clud
es n
ursi
ng a
nd re
habi
litat
ive
serv
ices
pro
vide
d in
free
stan
ding
nur
sing
hom
e fa
cilit
ies
that
are
gen
eral
ly p
rovi
ded
for a
n ex
tend
ed p
erio
d of
tim
e by
regi
ster
ed o
r lic
ense
d pr
actic
al n
urse
s an
d ot
her s
taff
.7
The
othe
r hea
lth, r
esid
entia
l, an
d pe
rson
al c
are
cate
gory
incl
udes
spe
ndin
g fo
r Med
icai
d ho
me
and
com
mun
ity-b
ased
wai
vers
, car
e pr
ovid
ed in
resi
dent
ial f
acili
ties
for
peop
le w
ith in
telle
ctua
l dis
abili
ties
or m
enta
l hea
lth a
nd s
ubst
ance
abu
se d
isor
ders
, am
bula
nce
serv
ices
, sch
ool h
ealth
, and
wor
k si
te h
ealth
car
e.8
The
adm
inis
trat
ive
cate
gory
incl
udes
the
adm
inis
trat
ive
cost
of h
ealth
car
e pr
ogra
ms
(e.g
., M
edic
are
and
Med
icai
d) a
nd th
e ne
t cos
t of p
rivat
e he
alth
insu
ranc
e (a
dmin
istr
ativ
e co
sts,
as
wel
l as
addi
tions
to re
serv
es, r
ate
cred
its a
nd d
ivid
ends
, pre
miu
m ta
xes,
and
pla
n pr
ofits
or l
osse
s).
Sour
ces:
Off
ice
of th
e Ac
tuar
y (O
ACT)
, Cen
ters
for M
edic
are
& M
edic
aid
Serv
ices
, 201
5, N
atio
nal h
ealth
exp
endi
ture
s by
type
of s
ervi
ce a
nd s
ourc
e of
fund
s: C
alen
dar y
ears
19
60–2
014,
Bal
timor
e, M
D: O
ACT,
htt
ps:/
/ww
w.c
ms.
gov/
Res
earc
h-St
atis
tics-
Data
-and
-Sys
tem
s/St
atis
tics-
Tren
ds-a
nd-R
epor
ts/N
atio
nalH
ealth
Expe
ndDa
ta/D
ownl
oads
/N
HE2
014.
zip.
OAC
T, 2
014,
Nat
iona
l hea
lth e
xpen
ditu
re a
ccou
nts:
Met
hodo
logy
pap
er, 2
014,
htt
ps:/
/ww
w.c
ms.
gov/
Res
earc
h-St
atis
tics-
Dat
a-an
d-Sy
stem
s/St
atis
tics-
Tren
ds-
and-
Rep
orts
/Nat
iona
lHea
lthEx
pend
Dat
a/D
ownl
oads
/DSM
-14.
pdf.
OAC
T, 2
014,
Sum
mar
y of
201
4 co
mpr
ehen
sive
revi
sion
to th
e na
tiona
l hea
lth e
xpen
ditu
re a
ccou
nts,
ht
tps:
//w
ww
.cm
s.go
v/R
esea
rch-
Stat
istic
s-D
ata-
and-
Syst
ems/
Stat
istic
s-Tr
ends
-and
-Rep
orts
/Nat
iona
lHea
lthEx
pend
Dat
a/D
ownl
oads
/ben
chm
ark2
014.
pdf.
EXH
IBIT
3.
(con
tinue
d)

December 201612
Section 1: Overview—Key Statistics
MAC
Stat
sSe
ctio
n 1
1965
1970
1975
1980
1985
1990
1995
2000
2005
2010
2015
Fiscal year
0%
10%
20%
30%
40%
50%
60%
70%
80%
90%
100%
Medicaid
Medicare
Social Security
Exchangesubsidies
CHIP
Other mandatory programs
Discretionary, defense
Discretionary, non-defense
Net interest
EXHIBIT 4. Major Health Programs and Other Components of the Federal Budget as a Share of Federal Outlays, FYs 1965–2015

MACStats: Medicaid and CHIP Data Book 13
Section 1: Overview—Key Statistics
MAC
Stat
sSe
ctio
n 1
Fisc
al y
ear
Man
dato
ry p
rogr
ams
Disc
retio
nary
pro
gram
s
Net
inte
rest
Med
icai
dCH
IPM
edic
are
Exch
ange
su
bsid
ies
Soci
al
Secu
rity
Oth
erDe
fens
eN
on-
defe
nse
1965
0.2%
––
–14
.4%
12.3
%43
.2%
22.6
%7.
3%19
701.
4–
3.0%
–15
.211
.641
.919
.67.
319
752.
1–
3.7
–19
.120
.626
.421
.27.
019
802.
4–
5.2
–19
.816
.922
.824
.08.
919
852.
4–
6.8
–19
.713
.526
.717
.213
.719
903.
3–
7.6
–19
.714
.724
.016
.014
.719
914.
0–
7.7
–20
.113
.224
.116
.114
.719
924.
9–
8.4
–20
.613
.021
.916
.714
.419
935.
4–
9.1
–21
.411
.720
.717
.514
.119
945.
6–
9.7
–21
.712
.119
.317
.713
.919
955.
9–
10.4
–22
.010
.518
.017
.915
.319
965.
9–
11.0
–22
.211
.317
.017
.115
.419
976.
0–
11.7
–22
.610
.317
.017
.215
.219
986.
10.
0%11
.5–
22.8
11.6
16.4
17.1
14.6
1999
6.3
0.0
11.0
–22
.712
.716
.217
.413
.520
006.
60.
110
.9–
22.7
13.0
16.5
17.9
12.5
2001
6.9
0.2
11.5
–23
.012
.416
.418
.411
.120
027.
30.
211
.3–
22.5
13.7
17.4
19.1
8.5
2003
7.4
0.2
11.4
–21
.813
.918
.719
.47.
120
047.
70.
211
.6–
21.4
13.1
19.8
19.2
7.0
2005
7.4
0.2
11.9
–21
.012
.920
.019
.27.
420
066.
80.
212
.2–
20.5
13.4
19.6
18.7
8.5
2007
7.0
0.2
13.6
–21
.311
.020
.118
.18.
720
086.
80.
212
.9–
20.5
13.0
20.5
17.5
8.5
2009
7.1
0.2
12.1
–19
.320
.818
.716
.55.
320
107.
90.
212
.9–
20.3
14.1
19.9
19.0
5.7
2011
7.6
0.2
13.3
–20
.114
.919
.418
.06.
420
127.
10.
313
.2–
21.7
15.2
19.0
17.4
6.2
2013
7.7
0.3
14.2
–23
.413
.218
.116
.76.
420
148.
60.
314
.40.
4%24
.112
.117
.016
.66.
520
159.
50.
314
.60.
723
.913
.215
.815
.96.
1
Not
es: F
Y is
fisc
al y
ear.
– D
ash
indi
cate
s ze
ro; 0
.0%
indi
cate
s am
ount
s le
ss th
an 0
.05%
that
roun
d to
zer
o.
Sour
ce: M
ACPA
C, 2
016,
ana
lysi
s of
Off
ice
of M
anag
emen
t and
Bud
get (
OM
B), F
isca
l yea
r 201
7 H
isto
rical
Tab
les:
Bud
get o
f the
U.S
. Gov
ernm
ent,
Tabl
es 6
.1, 8
.5, a
nd 8
.7,
Was
hing
ton,
DC:
OM
B; h
ttp:
//w
ww
.gpo
.gov
/fds
ys/s
earc
h/pa
gede
tails
.act
ion?
gran
uleI
d=&p
acka
geId
=BU
DGET
-201
7-TA
B.
EXH
IBIT
4.
(con
tinue
d)

December 201614
Section 1: Overview—Key Statistics
MAC
Stat
sSe
ctio
n 1
Stat
e
Tota
l bud
get (
incl
udin
g st
ate
and
fede
ral f
unds
)St
ate-
fund
ed b
udge
t (no
fede
ral f
unds
)
Dolla
rs
(mill
ions
)
Tota
l spe
ndin
g as
a s
hare
of
tota
l bud
get1
Dolla
rs
(mill
ions
)
Stat
e-fu
nded
spe
ndin
g as
a s
hare
of
sta
te-f
unde
d bu
dget
1
Med
icai
d
Elem
enta
ry
and
seco
ndar
y ed
ucat
ion
Hig
her
educ
atio
nM
edic
aid
Elem
enta
ry
and
seco
ndar
y ed
ucat
ion
Hig
her
educ
atio
nTo
tal
$1,7
36,5
46
25.6
%19
.8%
10.5
%$1
,214
,527
15
.3%
24.1
%13
.2%
Alab
ama
24,9
63
23.3
20.5
20.6
15,6
03
12.1
26.9
24.6
Alas
ka11
,397
11
.114
.18.
08,
692
5.1
16.0
9.1
Ariz
ona
29,1
03
31.0
18.3
16.9
16,2
66
16.5
26.2
25.7
Arka
nsas
22,7
65
22.1
15.1
15.6
16,2
61
7.5
18.0
21.7
Calif
orni
a21
5,39
3 24
.321
.37.
514
2,81
0 15
.027
.87.
7Co
lora
do31
,346
23
.025
.48.
023
,487
15
.931
.49.
1Co
nnec
ticut
29,1
93
23.2
14.2
10.6
23,7
84
15.9
15.4
11.5
Dela
war
e9,
608
17.3
24.1
4.5
7,70
5 8.
627
.44.
8Di
stric
t of C
olum
bia2
––
––
––
––
Flor
ida
68,0
33
32.0
19.2
7.0
43,6
79
20.8
25.5
10.7
Geo
rgia
43,4
44
21.6
24.3
18.8
30,2
60
13.7
27.0
26.8
Haw
aii
12,6
03
15.5
15.0
9.8
10,4
37
8.1
15.2
11.8
Idah
o6,
865
28.0
24.0
8.1
4,25
1 15
.533
.212
.9Ill
inoi
s61
,039
26
.114
.64.
147
,477
16
.414
.24.
7In
dian
a27
,260
32
.032
.06.
617
,282
14
.444
.810
.4Io
wa
20,3
46
20.9
16.6
26.7
14,4
18
12.9
20.3
34.4
Kans
as14
,723
22
.425
.917
.610
,823
15
.930
.918
.9Ke
ntuc
ky28
,941
24
.017
.423
.919
,344
9.
821
.931
.2Lo
uisi
ana
27,2
79
26.8
18.9
10.4
18,2
86
14.4
22.5
14.9
Mai
ne8,
088
34.4
17.0
3.5
5,39
2 18
.821
.95.
3M
aryl
and
38,0
36
22.5
18.8
14.4
27,5
22
13.6
22.1
18.6
Mas
sach
uset
ts56
,250
21
.412
.010
.447
,569
13
.711
.912
.3M
ichi
gan
49,6
56
27.6
26.9
4.3
31,5
04
14.0
36.4
6.4
Min
neso
ta32
,673
29
.828
.24.
423
,773
19
.435
.66.
0M
issi
ssip
pi18
,558
24
.616
.318
.910
,996
11
.421
.730
.0
EXH
IBIT
5.
Med
icai
d as
a S
hare
of S
tate
s’ T
otal
Bud
gets
and
Sta
te-F
unde
d Bu
dget
s, S
FY 2
014

MACStats: Medicaid and CHIP Data Book 15
Section 1: Overview—Key Statistics
MAC
Stat
sSe
ctio
n 1
EXH
IBIT
5.
(con
tinue
d)
Stat
e
Tota
l bud
get (
incl
udin
g st
ate
and
fede
ral f
unds
)St
ate-
fund
ed b
udge
t (no
fede
ral f
unds
)
Dolla
rs
(mill
ions
)
Tota
l spe
ndin
g as
a s
hare
of
tota
l bud
get1
Dolla
rs
(mill
ions
)
Stat
e-fu
nded
spe
ndin
g as
a s
hare
of
sta
te-f
unde
d bu
dget
1
Med
icai
d
Elem
enta
ry
and
seco
ndar
y ed
ucat
ion
Hig
her
educ
atio
nM
edic
aid
Elem
enta
ry
and
seco
ndar
y ed
ucat
ion
Hig
her
educ
atio
nM
isso
uri
$23,
172
35.8
%22
.8%
4.8%
$15,
971
25.4
%27
.2%
6.9%
Mon
tana
6,18
8 17
.015
.710
.44,
039
8.4
20.0
14.7
Neb
rask
a10
,542
17
.614
.423
.57,
631
11.2
16.0
28.1
Nev
ada
9,40
9 21
.519
.68.
16,
550
10.1
24.3
11.6
New
Ham
pshi
re5,
144
24.9
22.2
2.5
3,44
3 20
.927
.73.
7N
ew J
erse
y53
,103
22
.523
.67.
739
,731
12
.629
.510
.3N
ew M
exic
o16
,198
25
.818
.318
.010
,090
11
.025
.422
.2N
ew Y
ork
137,
526
29.1
19.3
7.6
96,3
55
16.3
23.5
10.6
Nor
th C
arol
ina
43,7
93
30.4
22.4
14.6
30,2
81
16.1
25.7
20.9
Nor
th D
akot
a6,
592
12.9
15.8
17.3
5,06
9 7.
818
.120
.1O
hio
61,2
22
35.8
16.8
4.2
48,1
76
32.4
17.4
5.3
Okl
ahom
a22
,381
23
.215
.623
.314
,977
14
.019
.131
.5O
rego
n32
,383
20
.917
.91.
324
,281
8.
821
.41.
6Pe
nnsy
lvan
ia68
,814
33
.318
.72.
644
,920
22
.923
.33.
9Rh
ode
Isla
nd8,
944
24.8
13.4
12.0
6,26
8 16
.415
.917
.1So
uth
Caro
lina
22,0
40
24.6
18.4
23.6
14,4
98
10.5
21.7
30.8
Sout
h Da
kota
4,09
9 20
.314
.021
.62,
696
12.4
15.1
30.3
Tenn
esse
e30
,702
30
.618
.314
.218
,502
19
.023
.822
.5Te
xas
110,
146
30.1
25.0
14.0
68,7
98
19.7
33.1
16.6
Uta
h12
,184
19
.525
.712
.78,
687
9.1
31.2
17.6
Verm
ont
5,27
1 26
.831
.71.
83,
511
17.5
44.2
2.6
Virg
inia
45,8
58
17.2
15.1
15.2
36,2
90
10.8
16.5
15.9
Was
hing
ton
36,8
67
16.5
23.4
13.7
27,2
36
8.8
28.3
18.5
Wes
t Virg
inia
23,8
88
14.8
9.8
12.1
19,4
76
4.7
10.3
13.7
Wis
cons
in44
,893
18
.416
.114
.233
,887
10
.218
.713
.7W
yom
ing
7,62
5 8.
010
.03.
95,
543
5.2
13.8
5.4

December 201616
Section 1: Overview—Key Statistics
MAC
Stat
sSe
ctio
n 1
EXH
IBIT
5.
(con
tinue
d)
Not
es: S
FY is
sta
te fi
scal
yea
r. To
tal b
udge
t inc
lude
s fe
dera
l and
all
othe
r fun
ds. S
tate
-fund
ed b
udge
t inc
lude
s st
ate
gene
ral f
unds
, oth
er s
tate
fund
s, a
nd b
onds
. Med
icai
d,
elem
enta
ry a
nd s
econ
dary
edu
catio
n, a
nd h
ighe
r edu
catio
n re
pres
ent t
he la
rges
t tot
al b
udge
t sha
res
amon
g fu
nctio
ns b
roke
n ou
t sep
arat
ely
by th
e N
atio
nal A
ssoc
iatio
n of
St
ate
Budg
et O
ffic
ers
(NAS
BO).
Func
tions
not
sho
wn
here
are
tran
spor
tatio
n, c
orre
ctio
ns, p
ublic
ass
ista
nce,
and
all
othe
r. M
edic
aid
spen
ding
am
ount
s ex
clud
e ad
min
istr
ativ
e co
sts
but i
nclu
de M
edic
are
Part
D p
hase
d-do
wn
stat
e co
ntrib
utio
n (a
lso
refe
rred
to a
s cl
awba
ck) p
aym
ents
.1
Tota
l and
sta
te-fu
nded
bud
get s
hare
s sh
ould
be
view
ed w
ith c
autio
n be
caus
e th
ey re
flect
var
ying
sta
te p
ract
ices
. For
exa
mpl
e, u
ntil
SFY
2014
, Con
nect
icut
repo
rted
all
of
its M
edic
aid
spen
ding
as
stat
e-fu
nded
spe
ndin
g du
e to
the
dire
ct d
epos
it of
fede
ral f
unds
into
the
stat
e tr
easu
ry. I
n ad
ditio
n, s
ome
func
tions
—pa
rtic
ular
ly e
lem
enta
ry a
nd
seco
ndar
y ed
ucat
ion—
may
be
part
ially
fund
ed o
utsi
de o
f the
sta
te b
udge
t by
loca
l gov
ernm
ents
.2
NAS
BO d
oes
not c
olle
ct in
form
atio
n fo
r the
Dis
tric
t of C
olum
bia.
Sour
ce: N
ASBO
, 201
5, S
tate
exp
endi
ture
repo
rt: E
xam
inin
g fis
cal 2
013-
2015
sta
te s
pend
ing,
Was
hing
ton,
DC:
NAS
BO,
http
s://
high
erlo
gicd
ownl
oad.
s3.a
maz
onaw
s.co
m/
NAS
BO/9
d2d2
db1-
c943
-4f1
b-b7
50-0
fca1
52d6
4c2/
Upl
oade
dIm
ages
/SER
%20
Arch
ive/
Stat
e%20
Expe
nditu
re%
20Re
port
%20
(Fis
cal%
2020
13-2
015)
S.pd
f.

MACStats: Medicaid and CHIP Data Book 17
Section 1: Overview—Key Statistics
MAC
Stat
sSe
ctio
n 1
Stat
eFM
APs
for M
edic
aid
E-FM
APs
for C
HIP
FY
201
3FY
201
41FY
201
51FY
201
61FY
201
71FY
201
3FY
201
4FY
201
5FY
201
62FY
201
72
Alab
ama
68.5
3%68
.12%
68.9
9%69
.87%
70.1
6%77
.97%
77.6
8%78
.29%
100.
00%
100.
00%
Alas
ka50
.00
50.0
050
.00
50.0
050
.00
65.0
065
.00
65.0
088
.00
88.0
0
Ariz
ona
65.6
867
.23
68.4
668
.92
69.2
475
.98
77.0
677
.92
100.
0010
0.00
Arka
nsas
70.1
770
.10
70.8
870
.00
69.6
979
.12
79.0
779
.62
100.
0010
0.00
Calif
orni
a50
.00
50.0
050
.00
50.0
050
.00
65.0
065
.00
65.0
088
.00
88.0
0
Colo
rado
50.0
050
.00
51.0
150
.72
50.0
265
.00
65.0
065
.71
88.5
088
.01
Conn
ectic
ut50
.00
50.0
050
.00
50.0
050
.00
65.0
065
.00
65.0
088
.00
88.0
0
Dela
war
e55
.67
55.3
153
.63
54.8
354
.20
68.9
768
.72
67.5
491
.38
90.9
4
Dist
rict o
f Col
umbi
a70
.00
70.0
070
.00
70.0
070
.00
79.0
079
.00
79.0
010
0.00
100.
00
Flor
ida
58.0
858
.79
59.7
260
.67
61.1
070
.66
71.1
571
.80
95.4
795
.77
Geo
rgia
65.5
665
.93
66.9
467
.55
67.8
975
.89
76.1
576
.86
100.
0010
0.00
Haw
aii
51.8
651
.85
52.2
353
.98
54.9
366
.30
66.3
066
.56
90.7
991
.45
Idah
o71
.00
71.6
471
.75
71.2
471
.51
79.7
080
.15
80.2
310
0.00
100.
00
Illin
ois
50.0
050
.00
50.7
650
.89
51.3
065
.00
65.0
065
.53
88.6
288
.91
Indi
ana
67.1
666
.92
66.5
266
.60
66.7
477
.01
76.8
476
.56
99.6
299
.72
Iow
a59
.59
57.9
355
.54
54.9
156
.74
71.7
170
.55
68.8
891
.44
92.7
2
Kans
as56
.51
56.9
156
.63
55.9
656
.21
69.5
669
.84
69.6
492
.17
92.3
5
Kent
ucky
70.5
569
.83
69.9
470
.32
70.4
679
.39
78.8
878
.96
100.
0010
0.00
Loui
sian
a365
.51
62.1
162
.05
62.2
162
.28
72.8
772
.69
73.4
496
.55
96.6
0
Mai
ne62
.57
61.5
561
.88
62.6
764
.38
73.8
073
.09
73.3
296
.87
98.0
7
Mar
ylan
d50
.00
50.0
050
.00
50.0
050
.00
65.0
065
.00
65.0
088
.00
88.0
0
Mas
sach
uset
ts50
.00
50.0
050
.00
50.0
050
.00
65.0
065
.00
65.0
088
.00
88.0
0
Mic
higa
n66
.39
66.3
265
.54
65.6
065
.15
76.4
776
.42
75.8
898
.92
98.6
1
Min
neso
ta50
.00
50.0
050
.00
50.0
050
.00
65.0
065
.00
65.0
088
.00
88.0
0
Mis
siss
ippi
73.4
373
.05
73.5
874
.17
74.6
381
.40
81.1
481
.51
100.
0010
0.00
Mis
sour
i61
.37
62.0
363
.45
63.2
863
.21
72.9
673
.42
74.4
297
.30
97.2
5
Mon
tana
66.0
066
.33
65.9
065
.24
65.5
676
.20
76.4
376
.13
98.6
798
.89
Neb
rask
a55
.76
54.7
453
.27
51.1
651
.85
69.0
368
.32
67.2
988
.81
89.3
0
EXH
IBIT
6.
Fede
ral M
edic
al A
ssis
tanc
e Pe
rcen
tage
s (F
MAP
s) a
nd E
nhan
ced
FMAP
s (E
-FM
APs)
by
Stat
e, F
Ys 2
013–
2017

December 201618
Section 1: Overview—Key Statistics
MAC
Stat
sSe
ctio
n 1
Stat
eFM
APs
for M
edic
aid
E-FM
APs
for C
HIP
FY
201
3FY
201
41FY
201
51FY
201
61FY
201
71FY
201
3FY
201
4FY
201
5FY
201
62FY
201
72
Nev
ada
59.7
4%63
.10%
64.3
6%64
.93%
64.6
7%71
.82%
74.1
7%75
.05%
98.4
5%98
.27%
New
Ham
pshi
re50
.00
50.0
050
.00
50.0
050
.00
65.0
065
.00
65.0
088
.00
88.0
0
New
Jer
sey
50.0
050
.00
50.0
050
.00
50.0
065
.00
65.0
065
.00
88.0
088
.00
New
Mex
ico
69.0
769
.20
69.6
570
.37
71.1
378
.35
78.4
478
.76
100.
0010
0.00
New
Yor
k50
.00
50.0
050
.00
50.0
050
.00
65.0
065
.00
65.0
088
.00
88.0
0
Nor
th C
arol
ina
65.5
165
.78
65.8
866
.24
66.8
875
.86
76.0
576
.12
99.3
799
.82
Nor
th D
akot
a52
.27
50.0
050
.00
50.0
050
.00
66.5
965
.00
65.0
088
.00
88.0
0
Ohi
o63
.58
63.0
262
.64
62.4
762
.32
74.5
174
.11
73.8
596
.73
96.6
2
Okl
ahom
a64
.00
64.0
262
.30
60.9
959
.94
74.8
074
.81
73.6
195
.69
94.9
6
Ore
gon
62.4
463
.14
64.0
664
.38
64.4
773
.71
74.2
074
.84
98.0
798
.13
Penn
sylv
ania
54.2
853
.52
51.8
252
.01
51.7
868
.00
67.4
666
.27
89.4
189
.25
Rhod
e Is
land
51.2
650
.11
50.0
050
.42
51.0
265
.88
65.0
865
.00
88.2
988
.71
Sout
h Ca
rolin
a70
.43
70.5
770
.64
71.0
871
.30
79.3
079
.40
79.4
510
0.00
100.
00
Sout
h Da
kota
56.1
953
.54
51.6
451
.61
54.9
469
.33
67.4
866
.15
89.1
391
.46
Tenn
esse
e66
.13
65.2
964
.99
65.0
564
.96
76.2
975
.70
75.4
998
.54
98.4
7
Texa
s59
.30
58.6
958
.05
57.1
356
.18
71.5
171
.08
70.6
492
.99
92.3
3
Uta
h69
.61
70.3
470
.56
70.2
469
.90
78.7
379
.24
79.3
910
0.00
100.
00
Verm
ont
56.0
455
.11
54.0
153
.90
54.4
669
.23
68.5
867
.81
90.7
391
.12
Virg
inia
50.0
050
.00
50.0
050
.00
50.0
065
.00
65.0
065
.00
88.0
088
.00
Was
hing
ton
50.0
050
.00
50.0
350
.00
50.0
065
.00
65.0
065
.02
88.0
088
.00
Wes
t Virg
inia
72.0
471
.09
71.3
571
.42
71.8
080
.43
79.7
679
.95
100.
0010
0.00
Wis
cons
in59
.74
59.0
658
.27
58.2
358
.51
71.8
271
.34
70.7
993
.76
93.9
6
Wyo
min
g50
.00
50.0
050
.00
50.0
050
.00
65.0
065
.00
65.0
088
.00
88.0
0
Amer
ican
Sam
oa55
.00
55.0
055
.00
55.0
055
.00
68.5
068
.50
68.5
091
.50
91.5
0
Gua
m55
.00
55.0
055
.00
55.0
055
.00
68.5
068
.50
68.5
091
.50
91.5
0
N. M
aria
na Is
land
s55
.00
55.0
055
.00
55.0
055
.00
68.5
068
.50
68.5
091
.50
91.5
0
Puer
to R
ico
55.0
055
.00
55.0
055
.00
55.0
068
.50
68.5
068
.50
91.5
091
.50
Virg
in Is
land
s55
.00
55.0
055
.00
55.0
055
.00
68.5
068
.50
68.5
091
.50
91.5
0
EXH
IBIT
6.
(con
tinue
d)

MACStats: Medicaid and CHIP Data Book 19
Section 1: Overview—Key Statistics
MAC
Stat
sSe
ctio
n 1
EXH
IBIT
6.
(con
tinue
d)
Not
es: F
MAP
is fe
dera
l med
ical
ass
ista
nce
perc
enta
ge. E
-FM
AP is
enh
ance
d FM
AP. F
Y is
fisc
al y
ear.
ACA
is P
atie
nt P
rote
ctio
n an
d Af
ford
able
Car
e Ac
t (P.
L. 1
11-1
48, a
s am
ende
d). T
he fe
dera
l gov
ernm
ent’s
sha
re o
f mos
t Med
icai
d se
rvic
e co
sts
is d
eter
min
ed b
y th
e FM
AP, w
ith s
ome
exce
ptio
ns. F
or M
edic
aid
adm
inis
trat
ive
cost
s, th
e fe
dera
l sh
are
does
not
var
y by
sta
te a
nd is
gen
eral
ly 5
0 pe
rcen
t. Th
e E-
FMAP
det
erm
ines
the
fede
ral s
hare
of b
oth
serv
ice
and
adm
inis
trat
ive
cost
s fo
r CH
IP, s
ubje
ct to
the
avai
labi
lity
of fu
nds
from
a s
tate
’s fe
dera
l allo
tmen
ts fo
r CH
IP.
FMAP
s fo
r Med
icai
d ar
e ge
nera
lly c
alcu
late
d ba
sed
on a
form
ula
that
com
pare
s ea
ch s
tate
’s p
er c
apita
inco
me
rela
tive
to U
.S. p
er c
apita
inco
me
and
prov
ides
a h
ighe
r fe
dera
l mat
ch fo
r sta
tes
with
low
er p
er c
apita
inco
mes
, sub
ject
to a
sta
tuto
ry m
inim
um (5
0 pe
rcen
t) a
nd m
axim
um (8
3 pe
rcen
t). T
he g
ener
al fo
rmul
a fo
r a g
iven
sta
te is
: FM
AP =
1 -
[sta
te p
er c
apita
inco
me
squa
red
/ U.S
. per
cap
ita in
com
e sq
uare
d ×
0.45
].
Med
icai
d ex
cept
ions
to th
is fo
rmul
a in
clud
e th
e Di
stric
t of C
olum
bia
(set
in s
tatu
te a
t 70
perc
ent)
and
the
terr
itorie
s (s
et in
sta
tute
at 5
5 pe
rcen
t). O
ther
Med
icai
d ex
cept
ions
ap
ply
to c
erta
in s
ervi
ces,
pro
vide
rs, o
r situ
atio
ns (e
.g.,
serv
ices
pro
vide
d th
roug
h an
Indi
an H
ealth
Ser
vice
faci
lity
rece
ive
an F
MAP
of 1
00 p
erce
nt).
Enha
nced
FM
APs
for C
HIP
ar
e ca
lcul
ated
by
redu
cing
the
stat
e sh
are
unde
r reg
ular
FM
APs
for M
edic
aid
by 3
0 pe
rcen
t and
add
ing
23 p
erce
ntag
e po
ints
.1
For c
erta
in n
ewly
elig
ible
indi
vidu
als
unde
r the
Med
icai
d ex
pans
ion
begi
nnin
g in
201
4, th
ere
is a
n in
crea
sed
FMAP
(100
per
cent
in 2
014
thro
ugh
2016
, pha
sing
dow
n to
90
per
cent
in 2
020
and
subs
eque
nt y
ears
). An
incr
ease
d FM
AP is
als
o av
aila
ble
for c
erta
in s
tate
s th
at p
revi
ousl
y ex
pand
ed e
ligib
ility
to lo
w-in
com
e pa
rent
s an
d no
n-pr
egna
nt
adul
ts w
ithou
t chi
ldre
n pr
ior t
o en
actm
ent o
f the
ACA
.2
Und
er th
e AC
A, b
egin
ning
on
Oct
ober
1, 2
015,
and
end
ing
on S
epte
mbe
r 30,
201
9, th
e en
hanc
ed F
MAP
will
be
incr
ease
d by
23
perc
enta
ge p
oint
s, n
ot to
exc
eed
100
perc
ent,
fo
r all
stat
es.
3 Lo
uisi
ana
rece
ived
a d
isas
ter-r
ecov
ery
stat
e FM
AP a
djus
tmen
t for
the
four
th q
uart
er o
f FY
2011
, and
FYs
201
2–20
14.
Sour
ce: U
.S. D
epar
tmen
t of H
ealth
and
Hum
an S
ervi
ces,
Fed
eral
Reg
iste
r not
ices
for v
ario
us y
ears
.


SECTION 2
Trends

December 201622
Section 2: Trends
Section 2: Trends
Key Points• Medicaid spending and enrollment are affected by federal and state policy choices as
well as economic factors (Exhibits 8–10). For example, spending and enrollment both grew around the recessions of 2001 and 2007–2009, and slowed as economic conditions subsequently improved. More recently, Medicaid spending in fiscal year (FY) 2014 and beyond grew in part due to expanded eligibility under the Patient Protection and Affordable Care Act (ACA, P.L. 111-148, as amended).
• Medicaid enrollment trends vary by eligibility group. Children (excluding those eligible on the basis of disability) experienced the largest enrollment increase in absolute numbers between FYs 1975 and 2013, from 9.6 million to 30.8 million. Individuals qualifying for Medicaid on the basis of disability—the smallest eligibility group in FY 1975 in terms of absolute numbers—had the largest percentage increase in enrollment, quadrupling over this nearly 40-year period (Exhibit 7).
• Medicaid’s share of both state-funded budgets (excluding federal funds) and total state budgets (including federal funds) has grown substantially since state fiscal year (SFY) 1987. In SFYs 2009 and 2010, the program’s share of state-funded budgets remained stable or dropped, while its share of total state budgets continued to increase due to a temporary increase in federal matching rates, which effectively allowed states to maintain their programs with a smaller state contribution (Exhibit 13). In SFY 2014, Medicaid’s share of total state budgets increased, but its share of state-funded budgets remained unchanged due to 100 percent federal funding available for non-disabled adults, newly eligible for Medicaid under the ACA adult group.
• After experiencing high rates of growth in 2014 and 2015, Medicaid and CHIP enrollment grew less than 1 percent in 2016. Enrollment in July 2014 was 17.2 percent higher than average monthly enrollment during July to September 2013, a baseline period that precedes the start of open enrollment for exchange plans and state expansions of Medicaid for adults under the ACA. Between July 2014 and July 2015, enrollment grew by an additional 8.2 percent. However, enrollment growth from 2015 to 2016 grew by 0.2 percent as enrollment began to level off after the initial increase in expansion states. Because not all states have chosen to expand Medicaid, state-specific growth rates varied substantially (Exhibit 11).
• Medicaid and the State Children's Health Insurance Program (CHIP) are projected to maintain a steady share of national health expenditures at about 17.7 percent through 2025, and Medicare’s share is projected to increase from 20.2 percent to 22.8 percent (Exhibit 12).

MACStats: Medicaid and CHIP Data Book 23
Section 2: Trends
MAC
Stat
sSe
ctio
n 2
Fisc
al y
ear
Tota
lCh
ildre
nAd
ults
Disa
bled
Aged
Unk
now
n19
7522
,007
9,59
84,
529
2,46
43,
615
1,80
119
7622
,815
9,92
44,
773
2,66
93,
612
1,83
719
7722
,832
9,65
14,
785
2,80
23,
636
1,95
819
7821
,965
9,37
64,
643
2,71
83,
376
1,85
219
7921
,520
9,10
64,
570
2,75
33,
364
1,72
719
8021
,605
9,33
34,
877
2,91
13,
440
1,04
419
8121
,980
9,58
15,
187
3,07
93,
367
766
1982
21,6
039,
563
5,35
62,
891
3,24
055
319
8321
,554
9,53
55,
592
2,92
13,
372
134
1984
21,6
079,
684
5,60
02,
913
3,23
817
219
8521
,814
9,75
75,
518
3,01
23,
061
466
1986
22,5
1510
,029
5,64
73,
182
3,14
051
719
8723
,109
10,1
685,
599
3,38
13,
224
737
1988
22,9
0710
,037
5,50
33,
487
3,15
972
119
8923
,511
10,3
185,
717
3,59
03,
132
754
1990
25,2
5511
,220
6,01
03,
718
3,20
21,
105
1991
27,9
6712
,855
6,70
34,
033
3,34
11,
035
1992
31,1
5015
,200
7,04
04,
487
3,74
967
419
9333
,432
16,2
857,
505
5,01
63,
863
763
1994
35,0
5317
,194
7,58
65,
458
4,03
578
019
9536
,282
17,1
647,
604
5,85
84,
119
1,53
719
9636
,118
16,7
397,
127
6,22
14,
285
1,74
619
9734
,872
15,7
916,
803
6,12
93,
955
2,19
519
9840
,096
18,9
697,
895
6,63
73,
964
2,63
119
9939
,748
18,2
337,
446
6,69
03,
698
3,68
220
0041
,212
18,5
288,
538
6,68
83,
640
3,81
720
0145
,164
20,1
819,
707
7,11
43,
812
4,34
920
0246
,839
21,4
8710
,847
7,18
23,
789
3,53
4
EXH
IBIT
7.
Med
icai
d Be
nefic
iarie
s (P
erso
ns S
erve
d) b
y El
igib
ility
Gro
up, F
Ys 1
975–
2013
(tho
usan
ds)

December 201624
Section 2: Trends
MAC
Stat
sSe
ctio
n 2
Fisc
al y
ear
Tota
lCh
ildre
nAd
ults
Disa
bled
Aged
Unk
now
n20
0350
,716
23,7
4211
,530
7,66
44,
041
3,73
920
0454
,250
25,4
1512
,325
8,12
34,
349
4,03
720
0556
,276
25,9
7912
,431
8,20
54,
395
5,26
620
0656
,264
26,3
5812
,495
8,33
44,
374
4,70
320
0755
,210
26,0
6112
,264
8,42
34,
044
4,41
820
0856
,962
26,4
7912
,739
8,68
54,
147
4,91
220
0960
,880
28,3
4414
,245
9,03
14,
195
5,06
620
1063
,730
30,0
2415
,368
9,34
14,
289
4,70
920
1165
,831
30,1
7516
,069
9,60
94,
331
5,64
620
1265
,584
30,4
6716
,483
9,83
64,
376
4,42
320
1367
,497
30,8
1016
,898
10,1
214,
499
5,16
9
Not
es: F
Y is
fisc
al y
ear.
Bene
ficia
ries
(enr
olle
es fo
r who
m p
aym
ents
are
mad
e) a
re s
how
n he
re b
ecau
se th
ey p
rovi
de th
e on
ly h
isto
rical
tim
e se
ries
data
dire
ctly
ava
ilabl
e pr
ior
to F
Y 19
90. M
ost c
urre
nt a
naly
ses
of in
divi
dual
s in
Med
icai
d re
flect
enr
olle
es. F
or a
dditi
onal
dis
cuss
ion,
see
htt
ps://
ww
w.m
acpa
c.go
v/m
acst
ats/
data
-sou
rces
-and
-met
hods
/.
The
incr
ease
in F
Y 19
98 re
flect
s a
chan
ge in
how
Med
icai
d be
nefic
iarie
s ar
e co
unte
d: b
egin
ning
in F
Y 19
98, a
Med
icai
d-el
igib
le p
erso
n w
ho re
ceiv
ed o
nly
cove
rage
for m
anag
ed
care
ben
efits
was
incl
uded
in th
is s
erie
s as
a b
enef
icia
ry. E
xclu
des
Med
icai
d-ex
pans
ion
CHIP
and
the
terr
itorie
s. C
hild
ren
and
adul
ts w
ho q
ualif
y fo
r Med
icai
d on
the
basi
s of
a
disa
bilit
y ar
e in
clud
ed in
the
disa
bled
cat
egor
y. In
add
ition
, alth
ough
dis
abili
ty is
not
a b
asis
of e
ligib
ility
for a
ged
indi
vidu
als,
sta
tes
may
repo
rt s
ome
enro
llees
age
65
and
olde
r in
the
disa
bled
cat
egor
y. U
nlik
e th
e m
ajor
ity o
f MAC
Stat
s, th
is e
xhib
it do
es n
ot re
code
indi
vidu
als
age
65 a
nd o
lder
who
are
repo
rted
as
disa
bled
, due
to la
ck o
f det
ail i
n th
e hi
stor
ical
dat
a. G
ener
ally
, ind
ivid
uals
who
se e
ligib
ility
gro
up is
unk
now
n ar
e pe
rson
s w
ho w
ere
enro
lled
in th
e pr
ior y
ear b
ut h
ad a
Med
icai
d cl
aim
pai
d in
the
curr
ent y
ear.
For M
ACPA
C’s
anal
ysis
, Med
icai
d en
rolle
es w
ere
assi
gned
a u
niqu
e na
tiona
l ide
ntifi
catio
n nu
mbe
r usi
ng a
n al
gorit
hm th
at in
corp
orat
es s
tate
-spe
cific
ID n
umbe
rs a
nd
bene
ficia
ry c
hara
cter
istic
s su
ch a
s da
te o
f birt
h an
d ge
nder
. The
nat
iona
l enr
ollm
ent c
ount
s sh
own
here
are
und
uplic
ated
usi
ng th
is n
atio
nal I
D.
Sour
ce: F
or F
Ys 1
999–
2013
: MAC
PAC,
201
6, a
naly
sis
of M
edic
aid
Stat
istic
al In
form
atio
n Sy
stem
(MSI
S) d
ata
for F
Ys 1
975–
1998
: Cen
ters
for M
edic
are
& M
edic
aid
Serv
ices
, Med
icar
e &
Med
icai
d st
atis
tical
sup
plem
ent,
2010
edi
tion,
Tab
le 1
3.4,
htt
ps:/
/ww
w.c
ms.
gov/
Rese
arch
-Sta
tistic
s-Da
ta-a
nd-S
yste
ms/
Stat
istic
s-Tr
ends
-and
-Rep
orts
/M
edic
areM
edic
aidS
tatS
upp/
Dow
nloa
ds/2
010_
Sect
ion1
3.pd
f#Ta
ble%
2013
.4.
EXH
IBIT
7.
(con
tinue
d)

MACStats: Medicaid and CHIP Data Book 25
Section 2: Trends
MAC
Stat
sSe
ctio
n 2
0
5
10
15
20
25
30
35
40
45
50
55
60
65
70
$0
$50
$100
$150
$200
$250
$300
$350
$400
$450
$500
$550
$600
$650
$700
Fiscal year
Spen
ding
(bill
ions
)
FYE
enro
llmen
t (m
illio
ns)
Spending
FYE enrollment
1967
1969
1971
1973
1975
1976
1979
1981
1983
1985
1987
1989
1991
1993
1995
1997
1999
2001
2003
2005
2007
2009
2011
2013
2015
Notes: FY is fiscal year. FYE is full-year equivalent, which also may be referred to as average monthly enrollment. All numbers exclude CHIP-financed coverage. Data prior to FY 1977 have been adjusted to the current federal fiscal year basis (October 1 to September 30). The amounts shown in this exhibit may differ from those published elsewhere due to slight differences in the timing of data and the treatment of certain adjustments. The amounts may also differ from prior versions of MACStats due to changes in methodology by the Centers for Medicare & Medicaid Services (CMS) Office of the Actuary (OACT). See https://www.cms.gov/Research-Statistics-Data-and-Systems/Research/ActuarialStudies/Downloads/MedicaidReport2015.pdf for more information. Spending consists of federal and state Medicaid expenditures for benefits and administration, excluding the Vaccines for Children program. Enrollment counts are full-year equivalents and, for fiscal years prior to FY 1990, have been estimated from counts of persons served. See https://www.macpac.gov/macstats/data-sources-and-methods/ for a discussion of how enrollees are counted. Enrollment data for FYs 2012–2015 are projected; those for FYs 1999–2015 include estimates for Puerto Rico and the Virgin Islands.
Source: OACT, CMS, 2016, data compilation provided to MACPAC staff August 15.
EXHIBIT 8. Medicaid Enrollment and Spending, FYs 1966–2015

December 201626
Section 2: Trends
MAC
Stat
sSe
ctio
n 2
-5%
0%
5%
10%
15%
20%
25%
30%
Spending
FYE enrollment
Fiscal year
1975
1977
1979
1981
1983
1985
1987
1989
1991
1993
1995
1997
1999
2001
2003
2005
2007
2009
2011
2013
2015
Notes: FY is fiscal year. FYE is full-year equivalent, which also may be referred to as average monthly enrollment. All numbers exclude CHIP-financed coverage. Data prior to FY 1977 have been adjusted to the current federal fiscal year basis (October 1 to September 30). The amounts shown in this exhibit may differ from those published elsewhere due to slight differences in the timing of data and the treatment of certain adjustments. The amounts may also differ from prior versions of MACStats due to changes in methodology by the Centers for Medicare & Medicaid Services (CMS) Office of the Actuary (OACT). See https://www.cms.gov/Research-Statistics-Data-and-Systems/Research/ActuarialStudies/Downloads/MedicaidReport2015.pdf for more information. Spending consists of federal and state Medicaid expenditures for benefits and administration, excluding the Vaccines for Children program. Enrollment counts are full-year equivalents and, for fiscal years prior to FY 1990, have been estimated from counts of persons served. See https://www.macpac.gov/macstats/data-sources-and-methods/ for a discussion of how enrollees are counted. Enrollment data for FYs 2012–2015 are projected; those for FYs 1999–2015 include estimates for Puerto Rico and the Virgin Islands.
Source: OACT, CMS, 2016, data compilation provided to MACPAC staff August 15.
EXHIBIT 9. Annual Growth in Medicaid Enrollment and Spending, FYs 1975–2015

MACStats: Medicaid and CHIP Data Book 27
Section 2: Trends
MAC
Stat
sSe
ctio
n 2
Fisc
al y
ear
Spen
ding
(b
illio
ns)
FYE
enro
llmen
t (m
illio
ns)
Spen
ding
per
FY
E en
rolle
e
Annu
al g
row
th
Spen
ding
Full-
year
equ
ival
ent
enro
llmen
tSp
endi
ng p
er
FYE
enro
llee
1966
$14.
0$2
22–
––
1967
27.
432
116
5.4%
83.3
%44
.8%
1968
410
.634
352
.442
.96.
719
694
11.5
381
21.1
8.9
11.3
1970
514
.036
515
.921
.3-4
.419
717
16.3
401
28.5
16.9
9.9
1972
816
.548
422
.41.
320
.919
739
17.6
534
17.0
6.2
10.2
1974
1119
.056
715
.18.
36.
319
7513
20.2
651
21.8
6.1
14.8
1976
1520
.772
013
.62.
710
.619
7717
20.7
830
15.3
0.1
15.3
1978
1920
.095
911
.2-3
.815
.619
7922
19.6
1,11
514
.0-2
.016
.319
8025
19.6
1,28
515
.70.
415
.219
8130
20.0
1,49
318
.21.
716
.219
8232
19.6
1,62
06.
7-1
.78.
519
8335
19.6
1,77
99.
6-0
.29.
919
8437
19.8
1,89
07.
41.
26.
219
8541
19.8
2,08
110
.20.
010
.219
8644
20.5
2,17
27.
73.
24.
419
8750
21.0
2,38
212
.52.
69.
619
8854
20.8
2,60
98.
6-0
.99.
519
8961
21.4
2,85
012
.12.
69.
319
9072
22.9
3,14
718
.67.
410
.419
9194
26.3
3,58
730
.614
.614
.019
9212
028
.94,
161
27.4
9.8
16.0
EXH
IBIT
10.
Med
icai
d En
rollm
ent a
nd T
otal
Spe
ndin
g Le
vels
and
Ann
ual G
row
th, F
Ys 1
966–
2015

December 201628
Section 2: Trends
MAC
Stat
sSe
ctio
n 2
EXH
IBIT
10.
(co
ntin
ued)
Fisc
al y
ear
Spen
ding
(b
illio
ns)
FYE
enro
llmen
t (m
illio
ns)
Spen
ding
per
FY
E en
rolle
e
Annu
al g
row
th
Spen
ding
Full-
year
equ
ival
ent
enro
llmen
tSp
endi
ng p
er
FYE
enro
llee
1993
$131
31.2
$4,1
828.
7%8.
1%0.
5%19
9414
432
.44,
434
10.1
3.9
6.0
1995
159
33.4
4,77
910
.92.
97.
819
9616
033
.24,
804
0.1
-0.4
0.5
1997
166
33.0
5,02
53.
9-0
.64.
619
9817
732
.55,
462
6.8
-1.7
8.7
1999
190
32.1
5,92
47.
1-1
.28.
520
0020
634
.55,
972
8.6
7.7
0.8
2001
229
36.9
6,21
311
.06.
74.
020
0225
840
.56,
380
12.8
9.8
2.7
2003
276
43.5
6,35
26.
97.
4-0
.420
0429
645
.26,
560
7.3
3.9
3.3
2005
316
46.3
6,81
96.
62.
63.
920
0631
546
.76,
751
-0.3
0.7
-1.0
2007
332
46.4
7,15
75.
4-0
.56.
020
0835
247
.77,
383
5.9
2.7
3.2
2009
379
50.9
7,44
37.
66.
70.
820
1040
254
.57,
361
6.1
7.2
-1.1
2011
427
55.8
7,66
06.
42.
34.
120
1243
157
.37,
525
0.9
2.7
-1.8
2013
456
58.6
7,77
35.
72.
33.
320
1449
464
.07,
724
8.5
9.2
-0.6
2015
554
68.9
8,04
212
.17.
74.
1
Not
es: F
Y is
fisc
al y
ear.
FYE
is fu
ll-ye
ar e
quiv
alen
t, w
hich
may
als
o be
refe
rred
to a
s av
erag
e m
onth
ly e
nrol
lmen
t. Al
l num
bers
exc
lude
CH
IP-fi
nanc
ed c
over
age.
Dat
a pr
ior t
o FY
197
7 ha
ve b
een
adju
sted
to th
e cu
rren
t fed
eral
fisc
al y
ear b
asis
(Oct
ober
1 to
Sep
tem
ber 3
0). T
he a
mou
nts
show
n in
this
exh
ibit
may
diff
er fr
om th
ose
publ
ishe
d el
sew
here
du
e to
slig
ht d
iffer
ence
s in
the
timin
g of
dat
a an
d th
e tr
eatm
ent o
f cer
tain
adj
ustm
ents
. The
am
ount
s m
ay a
lso
diff
er fr
om p
rior v
ersi
ons
of M
ACSt
ats
due
to c
hang
es in
m
etho
dolo
gy b
y th
e Ce
nter
s fo
r Med
icar
e &
Med
icai
d Se
rvic
es (C
MS)
Off
ice
of th
e Ac
tuar
y (O
ACT)
. See
htt
ps:/
/ww
w.c
ms.
gov/
Rese
arch
-Sta
tistic
s-Da
ta-a
nd-S
yste
ms/
Rese
arch
/Act
uaria
lStu
dies
/Dow
nloa
ds/M
edic
aidR
epor
t201
5.pd
f for
mor
e in
form
atio
n. S
pend
ing
cons
ists
of f
eder
al a
nd s
tate
Med
icai
d ex
pend
iture
s fo
r ben
efits
and
ad
min
istr
atio
n, e
xclu
ding
the
Vacc
ines
for C
hild
ren
prog
ram
. Enr
ollm
ent c
ount
s ar
e fu
ll-ye
ar e
quiv
alen
ts a
nd, f
or fi
scal
yea
rs p
rior t
o FY
199
0, h
ave
been
est
imat
ed fr
om c
ount
s of
per
sons
ser
ved.
See
htt
ps:/
/ww
w.m
acpa
c.go
v/m
acst
ats/
data
-sou
rces
-and
-met
hods
/ for
a d
iscu
ssio
n of
how
enr
olle
es a
re c
ount
ed. E
nrol
lmen
t dat
a fo
r FYs
201
2–20
15 a
re
proj
ecte
d; th
ose
for F
Ys 1
999–
2015
incl
ude
estim
ates
for P
uert
o Ri
co a
nd th
e Vi
rgin
Isla
nds.
Sour
ce: O
ACT,
CMS,
201
6, d
ata
com
pila
tion
prov
ided
to M
ACPA
C st
aff A
ugus
t 15.

MACStats: Medicaid and CHIP Data Book 29
Section 2: Trends
MAC
Stat
sSe
ctio
n 2
Stat
e
Num
ber o
f ind
ivid
uals
enr
olle
dAn
nual
and
cum
ulat
ive
grow
th
July
–Se
ptem
ber
2013
ave
rage
July
201
4 J
uly
2015
Jul
y 20
16
July
–Se
ptem
ber
2013
ave
rage
to
Jul
y 20
14Ju
ly 2
014
to
Jul
y 20
15Ju
ly 2
015
to
Jul
y 20
16
July
–Se
ptem
ber
2013
ave
rage
to
Jul
y 20
16To
tal
56,
392,
477 1
6
7,14
7,44
6 7
2,67
2,69
4 72
,810
,267
17.2
%2
8.2%
0.2%
27.3
%2
Alab
ama
799
,176
3
868
,174
8
91,9
12
885
,046
8.
62.
7-0
.810
.7Al
aska
122
,334
1
25,2
54
127
,401
1
58,4
53
2.4
1.7
24.4
29.5
Ariz
ona
1,2
01,7
70
1,4
63,7
23
1,5
95,6
17
1,6
99,6
35
21.8
9.0
6.5
41.4
Arka
nsas
556
,851
7
84,3
35
823
,741
8
89,0
82
40.9
5.0
7.9
59.7
Calif
orni
a4 7
,755
,381
1
0,90
0,00
0 5, 6
1
2,64
8,63
7 1
1,90
2,44
5 40
.516
.0-5
.953
.5Co
lora
do 7
83,4
20
1,1
06,1
34
1,2
74,8
49
1,3
53,7
57
41.2
15.3
6.2
72.8
Conn
ectic
ut–
749
,159
7
54,0
54
753
,413
–
0.7
-0.1
–De
law
are
223
,324
2
33,7
06
241
,749
2
36,2
48
4.6
3.4
-2.3
5.8
Dist
rict o
f Col
umbi
a7 2
35,7
86
250
,446
2
55,6
60
258
,918
6.
22.
11.
39.
8Fl
orid
a 3
,104
,996
3
,343
,988
8
3,5
58,0
92 8
3
,620
,085
8
7.7
6.4
1.7
16.6
Geo
rgia
1,5
35,0
90
1,7
39,1
41
1,7
81,5
37
1,7
44,0
95
13.3
2.4
-2.1
13.6
Haw
aii
288
,357
3
18,8
38
332
,027
3
40,8
29
10.6
4.1
2.7
18.2
Idah
o 2
38,1
50
283
,129
2
78,2
68
289
,858
18
.9-1
.74.
221
.7Ill
inoi
s 2
,626
,943
6
3,0
21,1
95
3,1
62,5
22
3,0
88,0
44
15.0
4.7
-2.4
17.6
Indi
ana9
1,1
20,6
74
1,2
11,1
25
1,3
89,5
19
1,4
73,4
14
8.1
14.7
6.0
31.5
Iow
a 4
93,5
15
565
,593
5
99,3
05
613
,386
14
.66.
02.
324
.3Ka
nsas
378
,160
4
01,9
80
398
,007
4
22,5
49
6.3
-1.0
6.2
11.7
Kent
ucky
606
,805
1
,048
,285
1
,119
,198
1
,223
,869
72
.86.
89.
410
1.7
Loui
sian
a 1
,019
,787
1
,037
,136
1
,075
,652
1
,308
,428
1.
73.
721
.628
.3M
aine
–
296
,206
2
80,2
41
270
,827
–
-5
.4-3
.4 –
M
aryl
and
856
,297
1
,151
,270
1
,179
,937
1
,226
,309
34
.42.
53.
943
.2M
assa
chus
etts
1,2
96,3
59
1,4
76,1
84 1
0 1
,649
,423
10
1,6
60,5
18
13.9
11.7
0.7
28.1
Mic
higa
n 1
,912
,009
2
,218
,845
2
,352
,127
2
,273
,394
16
.06.
0-3
.318
.9M
inne
sota
873
,040
11
1,0
68,3
05
1,0
28,1
61
1,0
26,0
23
22.4
-3.8
-0.2
17.5
Mis
siss
ippi
637
,229
6
93,4
25
709
,510
6
87,2
19
8.8
2.3
-3.1
7.8
Mis
sour
i 8
46,0
84
812
,785
9
32,0
26
961
,073
-3
.914
.73.
113
.6M
onta
na 1
48,9
74
163
,551
1
76,7
14
239
,250
9.
88.
035
.460
.6
EXH
IBIT
11.
Ful
l-Ben
efit
Med
icai
d an
d CH
IP E
nrol
lmen
t, Se
lect
ed M
onth
s, 2
013–
2016

December 201630
Section 2: Trends
MAC
Stat
sSe
ctio
n 2
Stat
e
Num
ber o
f ind
ivid
uals
enr
olle
dAn
nual
and
cum
ulat
ive
grow
th
July
–Se
ptem
ber
2013
ave
rage
July
201
4 J
uly
2015
Jul
y 20
16
July
–Se
ptem
ber
2013
ave
rage
to
Jul
y 20
14Ju
ly 2
014
to
Jul
y 20
15Ju
ly 2
015
to
Jul
y 20
16
July
–Se
ptem
ber
2013
ave
rage
to
Jul
y 20
16N
ebra
ska
244
,600
2
38,6
09
237
,243
2
34,8
36
-2.4
%-0
.6%
-1.0
%-4
.0%
Nev
ada
332
,560
5
27,9
29 9
5
66,0
17
609
,435
58
.77.
27.
783
.3N
ew H
amps
hire
127
,082
1
37,9
34
184
,266
1
85,7
35
8.5
33.6
0.8
46.2
New
Jer
sey
1,2
83,8
51
1,5
62,4
83
1,7
89,2
64
1,7
49,4
00
21.7
14.5
-2.2
36.3
New
Mex
ico
457
,678
7
05,1
28
717
,189
7
61,0
33
54.1
1.7
6.1
66.3
New
Yor
k 5
,678
,417
6
,143
,909
6
6,5
12,1
37 6
6
,372
,384
6
8.2
6.0
-2.1
12.2
Nor
th C
arol
ina
1,5
95,9
52
1,7
37,1
17
1,9
82,4
96
1,9
84,5
99
8.8
14.1
0.1
24.4
Nor
th D
akot
a 6
9,98
0 12
79,
076
88,
719
89,
460
13.0
12.2
0.8
27.8
Ohi
o 2
,341
,481
2
,708
,484
2
,988
,934
2
,941
,236
15
.710
.4-1
.625
.6O
klah
oma
790
,051
8
03,5
77
821
,867
7
87,3
31
1.7
2.3
-4.2
-0.3
Ore
gon
626
,356
13
997
,762
1
,055
,685
1
,019
,340
59
.35.
8-3
.462
.7Pe
nnsy
lvan
ia 2
,386
,046
2
,417
,392
2
,665
,455
2
,834
,129
1.
310
.36.
318
.8Rh
ode
Isla
nd 1
90,8
33
259
,183
14
277
,232
2
83,8
38
35.8
7.0
2.4
48.7
Sout
h Ca
rolin
a 8
89,7
44
868
,487
9
99,4
38
987
,147
-2
.415
.1-1
.211
.0So
uth
Dako
ta 1
15,5
01
116
,174
1
18,7
15
119
,252
0.
62.
20.
53.
3Te
nnes
see
1,2
44,5
16
1,3
52,2
43
1,5
12,6
58
1,6
28,1
96
8.7
11.9
7.6
30.8
Texa
s 4
,441
,605
4
,575
,968
9
4,6
78,3
94
4,7
08,0
51
3.0
2.2
0.6
6.0
Uta
h9 2
94,0
29
301
,311
3
10,2
73
306
,857
2.
53.
0-1
.14.
4Ve
rmon
t 1
61,0
81
208
,699
1
85,9
91
178
,142
29
.6-1
0.9
-4.2
10.6
Virg
inia
935
,434
9
37,4
93
980
,591
9
66,9
32
0.2
4.6
-1.4
3.4
Was
hing
ton
1,1
17,5
76
1,5
42,7
89
1,7
28,8
34
1,7
75,8
82
38.0
12.1
2.7
58.9
Wes
t Virg
inia
354
,544
5
19,6
72
542
,077
5
72,1
07
46.6
4.3
5.5
61.4
Wis
cons
in 9
85,5
31 1
5 1
,006
,257
15
1,0
48,8
17
1,0
45,1
60
2.1
4.2
-0.3
6.1
Wyo
min
g 6
7,51
8 6
7,85
8 6
4,51
6 6
3,61
8 0.
5-4
.9-1
.4-5
.8
Not
es: E
nrol
lmen
t exc
lude
s in
divi
dual
s w
ith li
mite
d be
nefit
s, s
uch
as th
ose
who
onl
y re
ceiv
e M
edic
aid
cove
rage
of M
edic
are
prem
ium
s an
d co
st s
harin
g, fa
mily
pla
nnin
g se
rvic
es, o
r em
erge
ncy
cove
rage
due
to n
on-c
itize
n st
atus
(sta
te-s
peci
fic e
xcep
tions
are
not
ed b
elow
). Th
e Ju
ly–
Sept
embe
r 201
3 pe
riod
show
n he
re s
erve
s as
a p
re-A
ffor
dabl
e Ca
re A
ct b
asel
ine,
repr
esen
ting
the
num
ber o
f peo
ple
cove
red
by M
edic
aid
and
CHIP
prio
r to
the
star
t of o
pen
enro
llmen
t for
exc
hang
e pl
ans
in O
ctob
er 2
013
and
the
stat
e ex
pans
ions
of M
edic
aid
for a
dults
that
beg
an in
Jan
uary
201
4 an
d be
yond
. Som
e da
ta a
re p
relim
inar
y or
est
imat
ed, a
nd a
ll da
ta a
re s
ubje
ct to
cha
nge
as s
tate
s m
ay re
vise
th
eir s
ubm
issi
ons
at a
ny ti
me.
See
sou
rce
docu
men
ts b
elow
for f
ull d
etai
ls.
EXH
IBIT
11.
(co
ntin
ued)

MACStats: Medicaid and CHIP Data Book 31
Section 2: Trends
MAC
Stat
sSe
ctio
n 2
– D
ash
indi
cate
s th
at s
tate
did
not
repo
rt d
ata.
1 Ex
clud
es tw
o st
ates
not
repo
rtin
g da
ta.
2 Pe
rcen
tage
cal
cula
ted
base
d on
sta
tes
repo
rtin
g da
ta fo
r bot
h pe
riods
.
3 Da
ta a
re fo
r Sep
tem
ber 2
013
only
.4
Incl
udes
indi
vidu
als
tran
sfer
red
from
the
Low
-Inco
me
Hea
lth P
rogr
am S
ectio
n 11
15 d
emon
stra
tion.
5 In
clud
es a
pplic
ants
like
ly e
ligib
le fo
r Med
icai
d or
CH
IP, b
ut w
hose
app
licat
ions
wer
e st
ill p
endi
ng v
erifi
catio
n.6
Incl
udes
retr
oact
ive
enro
llmen
t.7
Incl
udes
lim
ited-
bene
fit in
divi
dual
s w
ho a
re d
ually
elig
ible
for M
edic
are
and
Med
icai
d, a
nd in
divi
dual
s en
rolle
d in
the
loca
lly fu
nded
DC
Hea
lth A
llian
ce.
8 Ex
clud
es S
uppl
emen
tal S
ecur
ity In
com
e be
nefic
iarie
s en
rolle
d in
Med
icai
d.9
Incl
udes
lim
ited-
bene
fit in
divi
dual
s w
ho a
re d
ually
elig
ible
for M
edic
are
and
Med
icai
d.10
Ex
clud
es in
divi
dual
s re
ceiv
ing
tem
pora
ry tr
ansi
tiona
l cov
erag
e.11
M
ay in
clud
e du
plic
ates
.12
Da
ta a
re fo
r Jul
y 20
13 o
nly.
13 In
clud
es e
mer
genc
y M
edic
aid
popu
latio
n.14
In
clud
es o
nly
enro
llmen
ts b
ased
on
dete
rmin
atio
ns th
roug
h ne
w M
odifi
ed A
djus
ted
Gro
ss In
com
e (M
AGI)
syst
em.
15 Ex
clud
es re
troa
ctiv
e en
rollm
ent.
Sour
ce: M
ACPA
C, 2
016,
ana
lysi
s of
Cen
ters
for M
edic
are
& M
edic
aid
Serv
ices
(CM
S), 2
016,
Med
icai
d &
CHIP
Jun
e an
d Ju
ly 2
016
appl
icat
ion,
elig
ibili
ty, a
nd e
nrol
lmen
t dat
a, h
ttps
://
ww
w.m
edic
aid.
gov/
med
icai
d/pr
ogra
m-in
form
atio
n/do
wnl
oads
/jun
e-an
d-ju
ly-2
016-
enro
llmen
t-dat
a.zi
p; C
MS,
201
5, M
edic
aid
& CH
IP A
ugus
t and
Sep
tem
ber 2
015
appl
icat
ion,
el
igib
ility
, and
enr
ollm
ent d
ata,
htt
ps:/
/ww
w.m
edic
aid.
gov/
med
icai
d/pr
ogra
m-in
form
atio
n/do
wnl
oads
/aug
ust-a
nd-s
epte
mbe
r-201
5-en
rollm
ent-d
ata.
zip;
and
CM
S, 2
014,
Med
icai
d &
CHIP
Aug
ust a
nd S
epte
mbe
r 201
4 ap
plic
atio
n, e
ligib
ility
, and
enr
ollm
ent d
ata,
htt
ps:/
/ww
w.m
edic
aid.
gov/
med
icai
d/pr
ogra
m-in
form
atio
n/do
wnl
oads
/aug
ust-a
nd-s
epte
mbe
r-20
14-e
nrol
lmen
t-dat
a.zi
p.
EXH
IBIT
11.
(co
ntin
ued)

December 201632
Section 2: Trends
MAC
Stat
sSe
ctio
n 2
Cale
ndar
ye
ar
Paye
r am
ount
(bill
ions
) and
sha
re o
f tot
al
Tota
l (b
illio
ns)
Med
icai
d
and
CHIP
Med
icar
ePr
ivat
e in
sura
nce
Oth
er h
ealth
in
sura
nce1
Oth
er th
ird
part
y pa
yers
2O
ut o
f poc
ket
His
toric
al
1970
$75
$57.
1%$8
10.3
%$1
520
.8%
$34.
4%$1
823
.9%
$25
33.5
%
1975
133
1310
.116
12.3
3122
.96
4.5
3022
.337
28.0
1980
255
2610
.237
14.6
6927
.110
3.8
5521
.558
22.8
1985
443
419.
272
16.2
131
29.6
153.
488
19.9
9621
.6
1990
721
7410
.211
015
.323
432
.421
3.0
144
20.0
138
19.1
1995
1,02
214
514
.218
418
.032
531
.827
2.6
195
19.1
145
14.2
2000
1,37
020
314
.822
516
.445
833
.533
2.4
251
18.3
199
14.5
2005
2,02
531
715
.634
016
.870
234
.756
2.8
346
17.1
264
13.0
2010
2,59
640
915
.752
120
.186
333
.384
3.2
420
16.2
299
11.5
2011
2,69
741
815
.554
620
.390
333
.588
3.3
432
16.0
310
11.5
2012
2,79
943
515
.556
920
.393
433
.490
3.2
453
16.2
319
11.4
2013
2,88
046
016
.058
620
.494
933
.092
3.2
467
16.2
325
11.3
2014
3,03
150
916
.861
920
.499
132
.798
3.2
485
16.0
330
10.9
Proj
ecte
d
2015
$3,1
97$5
6317
.6%
$647
20.2
%$1
,042
32.6
%$1
013.
2%$5
0515
.8%
$338
10.6
%
2016
3,35
159
317
.768
120
.31,
093
32.6
106
3.2
527
15.7
350
10.4
2017
3,52
262
217
.772
120
.51,
149
32.6
112
3.2
552
15.7
365
10.4
2018
3,73
165
917
.777
020
.61,
217
32.6
119
3.2
583
15.6
383
10.3
2019
3,95
970
017
.782
820
.91,
286
32.5
126
3.2
616
15.6
403
10.2
2020
4,19
874
217
.789
321
.31,
350
32.2
134
3.2
651
15.5
427
10.2
2021
4,45
778
717
.796
221
.61,
425
32.0
143
3.2
689
15.5
451
10.1
EXH
IBIT
12.
His
toric
al a
nd P
roje
cted
Nat
iona
l Hea
lth E
xpen
ditu
res
by P
ayer
for S
elec
ted
Year
s, F
Ys 1
970–
2025

MACStats: Medicaid and CHIP Data Book 33
Section 2: Trends
MAC
Stat
sSe
ctio
n 2
Cale
ndar
ye
ar
Paye
r am
ount
(bill
ions
) and
sha
re o
f tot
al
Tota
l (b
illio
ns)
Med
icai
d
and
CHIP
Med
icar
ePr
ivat
e in
sura
nce
Oth
er h
ealth
in
sura
nce1
Oth
er th
ird
part
y pa
yers
2O
ut o
f poc
ket
2022
$4,7
33$8
3517
.6%
$1,0
3621
.9%
$1,5
0531
.8%
$151
3.2%
$729
15.4
%$4
7610
.1%
2023
5,02
288
517
.61,
117
22.2
1,58
731
.616
03.
277
115
.350
210
.0
2024
5,32
294
017
.71,
200
22.5
1,67
131
.416
93.
281
415
.352
89.
9
2025
5,63
199
917
.71,
282
22.8
1,75
631
.217
83.
285
915
.355
69.
9
Not
es: C
ompo
nent
s m
ay n
ot s
um to
tota
l due
to ro
undi
ng. T
he la
test
pro
ject
ions
beg
in a
fter
the
late
st h
isto
rical
yea
r (20
14) a
nd g
o th
roug
h 20
25.
1 U
.S. D
epar
tmen
t of D
efen
se a
nd U
.S. D
epar
tmen
t of V
eter
ans’
Aff
airs
.2
Incl
udes
all
othe
r pub
lic a
nd p
rivat
e pr
ogra
ms
and
expe
nditu
res
exce
pt fo
r out
-of-p
ocke
t am
ount
s.
Sour
ces:
For
his
toric
al d
ata:
MAC
PAC,
201
6, a
naly
sis
of O
ffic
e of
the
Actu
ary
(OAC
T), C
ente
rs fo
r Med
icar
e &
Med
icai
d Se
rvic
es, 2
015,
Nat
iona
l hea
lth e
xpen
ditu
res
by ty
pe o
f se
rvic
e an
d so
urce
of f
unds
: Cal
enda
r yea
rs 1
960–
2014
, htt
ps://
ww
w.c
ms.
gov/
Rese
arch
-Sta
tistic
s-Da
ta-a
nd-S
yste
ms/
Stat
istic
s-Tr
ends
-and
-Rep
orts
/Nat
iona
lHea
lthEx
pend
Data
/Do
wnl
oads
/NH
E201
4.zi
p. F
or p
roje
cted
dat
a: M
ACPA
C, 2
016,
ana
lysi
s of
OAC
T, 20
16, N
atio
nal h
ealth
exp
endi
ture
(NH
E) a
mou
nts
by ty
pe o
f exp
endi
ture
and
sou
rce
of fu
nds:
Ca
lend
ar y
ears
196
0–20
25 in
pro
ject
ions
form
at, a
s of
Jul
y 20
16, h
ttps
://w
ww
.cm
s.go
v/R
esea
rch-
Stat
istic
s-D
ata-
and-
Syst
ems/
Stat
istic
s-Tr
ends
-and
-Rep
orts
/N
atio
nalH
ealth
Expe
ndDa
ta/D
ownl
oads
/nhe
60-2
5.zi
p; a
nd a
naly
sis
of O
ACT,
2016
, Tab
le 1
7: H
ealth
insu
ranc
e en
rollm
ent a
nd e
nrol
lmen
t gro
wth
rate
s, c
alen
dar y
ears
200
9–20
25,
http
s://
ww
w.c
ms.
gov/
Rese
arch
-Sta
tistic
s-Da
ta-a
nd-S
yste
ms/
Stat
istic
s-Tr
ends
-and
-Rep
orts
/Nat
iona
lHea
lthEx
pend
Data
/Dow
nloa
ds/P
roj2
015T
able
s.zi
p.
EXH
IBIT
12.
(co
ntin
ued)

December 201634
Section 2: Trends
MAC
Stat
sSe
ctio
n 2
EXHIBIT 13. Medicaid as a Share of State Budgets Including and Excluding Federal Funds, SFYs 1987–2014
0%
5%
10%
15%
20%
25%
Including state general funds only (no federal funds)
Including all federal and state funds
1988
1990
1992
1994
1996
1998
2000
2002
2004
2006
2008
2010
2012
2014
State fiscal year
Including all state funds (no federal funds)
10.8%
12.5%
17.8%
19.7% 19.9% 19.6% 19.1%
20.7%
22.1%21.4%
20.5%
22.2%
23.6%
25.6%
8.7%9.5%
12.1%
14.2%14.7% 14.8% 15.0%
15.8%
16.9%17.4%
16.0%14.8%
19.2% 19.3%
6.1%
6.9%
10.0%
11.3%11.7% 11.6% 11.0%
12.2%12.9% 13.3% 12.5%
11.6%
14.5%15.3%

MACStats: Medicaid and CHIP Data Book 35
Section 2: Trends
MAC
Stat
sSe
ctio
n 2
EXHIBIT 13. (continued)
State fiscal yearIncluding all federal
and state funds
Including state general funds only (no federal funds)
Including all state funds (no federal funds)
1987 10.2% 8.1% 5.7%1988 10.8 8.7 6.11989 11.3 9.0 6.31990 12.5 9.5 6.91991 14.2 10.5 7.91992 17.8 12.1 10.01993 18.8 13.3 10.91994 19.7 14.2 11.31995 19.8 14.4 11.61996 19.9 14.7 11.71997 20.0 14.6 11.51998 19.6 14.8 11.61999 19.5 14.4 11.42000 19.1 15.0 11.02001 19.7 15.2 11.72002 20.7 15.8 12.22003 22.0 17.2 13.12004 22.1 16.9 12.92005 22.3 17.1 13.52006 21.4 17.4 13.32007 20.9 16.6 12.82008 20.5 16.0 12.52009 21.9 16.3 12.32010 22.2 14.8 11.62011 23.8 16.5 13.32012 23.6 19.2 14.52013 24.3 19.3 15.22014 25.6 19.3 15.3
Notes: SFY is state fiscal year. Amounts shown here reflect the most recent information available in cases where data for a given year were published and then updated in a subsequent report.
The all federal and state funds category reflects amounts from any source. The state general funds category reflects amounts from revenues raised through income, sales, and other broad-based state taxes. The all state funds category reflects amounts from any non-federal source; these include state general funds, other state funds (amounts from revenue sources that are restricted by law for particular government functions or activities, which for Medicaid includes provider taxes and local funds), and bonds (expenditures from the sale of bonds, generally for capital projects).
Source: MACPAC, 2016, analysis of state expenditure reports from the National Association of State Budget Officers, http://www.nasbo.org/mainsite/reports-data/state-expenditure-report/state-expenditure-archives.


SECTION 3
Program Enrollment and Spending

December 201638
Section 3: Program Enrollment and Spending
Section 3: Program Enrollment and Spending
Key Points• Total Medicaid spending was $556 billion in fiscal year (FY) 2015, an 11.6 percent increase
from the prior year (Exhibit 16). Total State Children's Health Insurance Program (CHIP) spending increased by about 4.7 percent, to $13.7 billion (Exhibit 32).
• The share of Medicaid benefit spending on capitation payments for managed care reached 43.1 percent of all Medicaid benefit spending in FY 2015, up from 37.5 percent in the prior year (Exhibit 17).
• In FY 2013, individuals eligible on the basis of disability and those age 65 and older accounted for about one-quarter of Medicaid enrollees, but about two-thirds of program spending (Exhibits 14 and 21). Many of these individuals were users of long-term services and supports (LTSS). This group accounted for only 5.9 percent of Medicaid enrollees, but over 41.8 percent of all Medicaid spending (Exhibit 20).
• The majority of FY 2013 Medicaid spending for enrollees eligible on the basis of disability and enrollees age 65 and older was for LTSS, while more than half of spending for children and adults eligible on a basis other than disability was for capitation payments to managed care plans (Exhibit 18).
• Medicaid benefit spending per enrollee varies substantially across states (Exhibit 22). This variation reflects many factors, including the underlying costs of delivering health care services in specific geographic areas, the breadth of covered benefits, and the health status and other characteristics of enrollees that affect their use of health care services.
• Drug rebates reduced gross drug spending by about 45.3 percent in FY 2015 (Exhibit 27). Net drug spending (i.e., after rebates) increased by 27.3 percent from FY 2014. Over half (54.8 percent) of Medicaid gross spending for outpatient prescription drugs occurred under managed care in FY 2015 (Exhibit 25).
• Disproportionate share hospital (DSH), upper payment limit, and other types of supplemental payments accounted for almost half of fee-for-service payments to hospitals in FY 2015 (Exhibit 23).

MACStats: Medicaid and CHIP Data Book 39
Section 3: Program Enrollment and Spending—Medicaid Overall
MAC
Stat
sSe
ctio
n 3
Stat
eTo
tal
Basi
s of
elig
ibili
ty1
Dual
ly e
ligib
le s
tatu
s2
All d
ually
elig
ible
en
rolle
esDu
ally
elig
ible
with
fu
ll be
nefit
sDu
ally
elig
ible
with
lim
ited
bene
fits
Child
Adul
tDi
sabl
edAg
edTo
tal
Age
65+
Tota
lAg
e 65
+To
tal
Age
65+
Tota
l70
,134
32,2
6120
,468
10,5
126,
893
10,8
426,
357
7,87
04,
643
2,97
31,
714
Alab
ama3
1,21
259
724
424
212
923
612
810
454
132
74Al
aska
136
7435
1710
169
158
10
Ariz
ona
1,68
180
557
917
612
119
311
314
882
4631
Arka
nsas
696
355
109
160
7313
571
7141
6529
Calif
orni
a11
,742
4,02
75,
483
1,09
41,
138
1,42
91,
004
1,38
697
143
32Co
lora
do89
650
019
413
765
104
5974
4430
16Co
nnec
ticut
858
331
325
8112
217
411
784
4990
68De
law
are
260
102
114
2816
2916
137
169
Dist
rict o
f Col
umbi
a24
684
102
3921
2918
2817
00
Flor
ida
4,31
32,
145
943
662
563
817
529
402
279
416
250
Geo
rgia
32,
013
1,12
935
034
019
432
618
915
892
168
97H
awai
i30
012
110
843
2840
2735
235
3Id
aho
275
168
4047
2036
1620
815
8Ill
inoi
s3,
039
1,58
588
332
624
539
422
334
919
645
27In
dian
a1,
250
667
260
221
102
190
8912
361
6628
Iow
a63
428
621
290
4693
4573
3320
12Ka
nsas
442
262
6181
3975
3648
2527
12Ke
ntuc
ky92
745
013
923
899
192
9610
455
8842
Loui
sian
a1,
284
623
293
245
122
217
120
116
6310
058
Mai
ne3
371
132
104
7263
106
6261
2945
34M
aryl
and
1,13
951
538
914
985
142
8090
5052
29M
assa
chus
etts
1,52
743
651
239
318
629
915
827
413
426
24M
ichi
gan
2,29
11,
149
594
392
156
315
145
267
122
4824
Min
neso
ta1,
154
469
442
142
101
156
8114
072
1710
Mis
siss
ippi
786
400
118
175
9317
093
8649
8443
EXH
IBIT
14.
Med
icai
d En
rollm
ent b
y St
ate,
Elig
ibili
ty G
roup
, and
Dua
lly E
ligib
le S
tatu
s, F
Y 20
13 (t
hous
ands
)

December 201640
Section 3: Program Enrollment and Spending—Medicaid Overall
MAC
Stat
sSe
ctio
n 3
EXH
IBIT
14.
(co
ntin
ued)
Stat
eTo
tal
Basi
s of
elig
ibili
ty1
Dual
ly e
ligib
le s
tatu
s2
All d
ually
elig
ible
en
rolle
esDu
ally
elig
ible
with
fu
ll be
nefit
sDu
ally
elig
ible
with
lim
ited
bene
fits
Child
Adul
tDi
sabl
edAg
edTo
tal
Age
65+
Tota
lAg
e 65
+To
tal
Age
65+
Mis
sour
i1,
122
571
238
218
9418
989
164
7625
13M
onta
na14
281
2325
1427
1417
910
5N
ebra
ska
262
147
4743
2546
2340
205
3N
evad
a42
224
883
5535
5734
2516
3117
New
Ham
pshi
re16
692
2333
1737
1623
1014
6N
ew J
erse
y1,
190
635
195
198
162
239
150
210
131
2919
New
Mex
ico
660
354
186
7446
7846
4225
3520
New
Yor
k6,
002
2,12
02,
485
710
687
892
602
756
503
137
99N
orth
Car
olin
a2,
000
1,05
838
936
019
335
218
826
714
184
47N
orth
Dak
ota
8747
1813
1017
913
73
2O
hio
2,64
51,
133
890
417
203
383
188
249
129
134
58O
klah
oma
951
499
253
130
6812
766
103
5324
13O
rego
n76
036
721
011
469
121
6772
4149
25Pe
nnsy
lvan
ia2,
567
1,09
748
772
226
146
924
938
520
085
50Rh
ode
Isla
nd17
071
3838
2337
2031
166
3So
uth
Caro
lina
1,09
156
226
717
489
169
8914
374
2715
Sout
h Da
kota
134
7723
2113
2313
148
95
Tenn
esse
e1,
557
796
325
283
152
293
150
156
7913
771
Texa
s45,
240
3,27
472
774
249
776
448
544
929
431
519
1U
tah
389
225
9649
1939
1834
156
3Ve
rmon
t20
669
8826
2338
2229
169
6Vi
rgin
ia1,
136
591
234
192
118
204
111
133
7671
35W
ashi
ngto
n1,
421
794
286
232
109
195
106
137
7958
27W
est V
irgin
ia43
720
862
124
4489
4451
2638
18W
isco
nsin
1,25
449
244
017
914
317
887
154
7124
16W
yom
ing
8958
1312
612
67
45
3

MACStats: Medicaid and CHIP Data Book 41
Section 3: Program Enrollment and Spending—Medicaid Overall
MAC
Stat
sSe
ctio
n 3
Not
es: F
Y is
fisc
al y
ear.
Enro
llmen
t num
bers
gen
eral
ly in
clud
e in
divi
dual
s ev
er e
nrol
led
in M
edic
aid-
finan
ced
cove
rage
dur
ing
the
year
, eve
n if
for a
sin
gle
mon
th; h
owev
er, i
n th
e ev
ent i
ndiv
idua
ls w
ere
also
enr
olle
d in
CH
IP-fi
nanc
ed M
edic
aid
cove
rage
(i.e
., M
edic
aid-
expa
nsio
n CH
IP) d
urin
g th
e ye
ar, t
hey
are
excl
uded
if th
eir m
ost r
ecen
t enr
ollm
ent
mon
th w
as in
Med
icai
d-ex
pans
ion
CHIP
. Num
bers
exc
lude
indi
vidu
als
enro
lled
only
in M
edic
aid-
expa
nsio
n CH
IP d
urin
g th
e ye
ar a
nd e
nrol
lees
in th
e te
rrito
ries.
For M
ACPA
C’s
anal
ysis
, Med
icai
d en
rolle
es w
ere
assi
gned
a u
niqu
e na
tiona
l ide
ntifi
catio
n (ID
) num
ber u
sing
an
algo
rithm
that
inco
rpor
ates
sta
te-s
peci
fic ID
num
bers
and
be
nefic
iary
cha
ract
eris
tics
such
as
date
of b
irth
and
gend
er. T
he s
tate
and
nat
iona
l enr
ollm
ent c
ount
s sh
own
here
are
und
uplic
ated
usi
ng th
is n
atio
nal I
D. C
ateg
orie
s m
ay
not s
um to
tota
l for
eac
h st
ate
due
to ro
undi
ng. I
n ad
ditio
n, th
e su
m o
f the
sta
te to
tals
exc
eeds
the
natio
nal t
otal
bec
ause
indi
vidu
als
may
be
enro
lled
in m
ore
than
one
sta
te
durin
g th
e ye
ar.
0 in
dica
tes
an a
mou
nt le
ss th
an 5
00 th
at ro
unds
to z
ero.
1
Child
ren
and
adul
ts u
nder
age
65
who
qua
lify
for M
edic
aid
on th
e ba
sis
of d
isab
ility
are
incl
uded
in th
e di
sabl
ed c
ateg
ory.
Abo
ut 7
46,0
00 e
nrol
lees
age
65
and
olde
r are
id
entif
ied
in th
e da
ta a
s di
sabl
ed; g
iven
that
dis
abili
ty is
not
an
elig
ibili
ty p
athw
ay fo
r ind
ivid
uals
age
65
and
olde
r, M
ACPA
C re
code
s th
ese
enro
llees
as
aged
.2
Dual
ly e
ligib
le e
nrol
lees
are
cov
ered
by
both
Med
icai
d an
d M
edic
are;
thos
e w
ith li
mite
d be
nefit
s re
ceiv
e on
ly M
edic
aid
assi
stan
ce w
ith M
edic
are
prem
ium
s an
d co
st s
harin
g.3
Stat
e ha
d a
chan
ge in
tota
l enr
ollm
ent o
f 10
perc
ent o
r mor
e ov
er th
e pr
ior y
ear.
Thes
e da
ta m
ay re
flect
dat
a an
omal
ies
in th
e su
bmis
sion
of M
edic
aid
Stat
istic
al In
form
atio
n Sy
stem
(MSI
S) d
ata
for t
he c
urre
nt o
r prio
r yea
rs a
nd m
ay b
e up
date
d in
futu
re M
SIS
subm
issi
ons
by s
tate
s. M
SIS
data
ano
mal
ies
have
bee
n co
mpi
led
and
repo
rted
by
Mat
hem
atic
a Po
licy
Rese
arch
; the
dat
a an
omal
ies
repo
rt m
ay b
e fo
und
at: h
ttp:
//w
ww
.cm
s.go
v/Re
sear
ch-S
tatis
tics-
Data
-and
-Sys
tem
s/Co
mpu
ter-D
ata-
and-
Syst
ems/
Med
icai
dDat
aSou
rces
Gen
Info
/dow
nloa
ds/a
nom
alie
s1.p
df.
4 W
hen
com
pare
d to
the
Dece
mbe
r 201
5 ed
ition
of t
his
tabl
e, T
exas
had
a c
hang
e in
tota
l enr
ollm
ent o
f 10
perc
ent o
r mor
e ov
er th
e pr
ior y
ear.
How
ever
, Tex
as h
as s
ince
up
date
d its
201
2 en
rollm
ent t
otal
and
no
long
er h
as a
cha
nge
of 1
0 pe
rcen
t or m
ore.
Sour
ce: M
ACPA
C, 2
016,
ana
lysi
s of
MSI
S da
ta a
s of
Dec
embe
r 201
5.
EXH
IBIT
14.
(co
ntin
ued)

December 201642
Section 3: Program Enrollment and Spending—Medicaid Overall
MAC
Stat
sSe
ctio
n 3
Stat
e
Tota
lCh
ildAd
ult
Disa
bled
Aged
All
enro
llees
Full-
bene
fit
enro
llees
1Al
l en
rolle
esFu
ll-be
nefit
en
rolle
es1
All
enro
llees
Full-
bene
fit
enro
llees
1Al
l en
rolle
esFu
ll-be
nefit
en
rolle
es1
All
enro
llees
Full-
bene
fit
enro
llees
1
Tota
l56
,777
49,6
5526
,640
26,3
3814
,809
10,5
679,
379
8,29
55,
949
4,45
4Al
abam
a96
872
848
048
016
539
212
162
110
46Al
aska
111
110
6161
2525
1616
99
Ariz
ona
1,35
91,
235
648
636
442
373
161
147
108
78Ar
kans
as60
147
831
030
482
2314
411
365
38Ca
lifor
nia
9,30
76,
761
3,34
03,
160
3,90
71,
599
1,02
31,
013
1,03
699
0Co
lora
do2
718
690
406
406
145
142
111
9956
43Co
nnec
ticut
731
649
291
291
257
255
7556
108
47De
law
are
213
184
8584
8874
2618
147
Dist
rict o
f Col
umbi
a321
521
574
7485
8537
3719
19Fl
orid
a3,
386
2,90
91,
727
1,71
958
147
858
644
049
227
2G
eorg
ia2
1,59
31,
387
894
894
221
164
307
244
171
85H
awai
i25
224
810
710
782
8239
3725
22Id
aho
44
44
44
44
44
Illin
ois
2,67
72,
555
1,41
21,
412
746
666
302
285
217
192
Indi
ana
1,03
095
456
456
418
416
819
716
185
61Io
wa
516
458
236
234
157
119
8377
3928
Kans
as35
232
820
920
938
3872
5933
23Ke
ntuc
ky77
069
237
537
590
9021
717
688
51Lo
uisi
ana
44
44
44
44
44
Mai
ne2
322
280
115
114
8584
6555
5626
Mar
ylan
d96
389
144
844
730
527
813
711
774
48M
assa
chus
etts
31,
293
1,19
736
735
540
234
835
835
616
613
8M
ichi
gan
1,87
71,
753
971
963
418
345
355
334
132
111
Min
neso
ta90
186
338
338
031
429
313
112
574
65M
issi
ssip
pi65
454
932
832
884
5515
912
283
45
EXH
IBIT
15.
Med
icai
d Fu
ll-Ye
ar E
quiv
alen
t Enr
ollm
ent b
y St
ate
and
Elig
ibili
ty G
roup
, FY
2013
(tho
usan
ds)

MACStats: Medicaid and CHIP Data Book 43
Section 3: Program Enrollment and Spending—Medicaid Overall
MAC
Stat
sSe
ctio
n 3
Stat
e
Tota
lCh
ildAd
ult
Disa
bled
Aged
All
enro
llees
Full-
bene
fit
enro
llees
1Al
l en
rolle
esFu
ll-be
nefit
en
rolle
es1
All
enro
llees
Full-
bene
fit
enro
llees
1Al
l en
rolle
esFu
ll-be
nefit
en
rolle
es1
All
enro
llees
Full-
bene
fit
enro
llees
1
Mis
sour
i91
781
248
048
017
691
183
173
7768
Mon
tana
114
103
6565
1513
2218
117
Neb
rask
a21
320
812
412
430
3038
3621
18N
evad
a31
829
219
119
152
5147
3529
15N
ew H
amps
hire
136
124
7979
1414
2822
149
New
Jer
sey
986
959
541
541
122
120
181
172
143
125
New
Mex
ico
566
476
307
307
150
9167
5441
23N
ew Y
ork
5,11
54,
821
1,81
51,
783
2,01
01,
886
672
637
617
516
Nor
th C
arol
ina
1,64
61,
502
902
901
250
182
325
291
169
128
Nor
th D
akot
a65
6236
3610
1011
108
6O
hio
2,21
11,
913
978
973
689
515
373
305
170
120
Okl
ahom
a74
566
140
540
516
410
111
710
760
48O
rego
n62
555
729
528
916
714
710
483
6038
Penn
sylv
ania
2,15
91,
964
914
913
375
257
646
613
225
182
Rhod
e Is
land
44
44
44
44
44
Sout
h Ca
rolin
a92
680
548
948
820
110
415
714
779
66So
uth
Dako
ta10
710
063
6314
1419
1511
7Te
nnes
see
1,32
01,
200
682
682
249
249
255
198
133
71Te
xas
4,08
13,
674
2,59
02,
590
389
252
669
564
433
268
Uta
h28
628
017
017
058
5742
4016
14Ve
rmon
t17
016
258
5867
6724
2220
15Vi
rgin
ia93
582
249
649
616
311
417
314
110
271
Was
hing
ton
1,16
81,
038
678
677
195
116
202
174
9471
Wes
t Virg
inia
354
322
166
166
4040
110
9338
23W
isco
nsin
1,04
993
141
339
834
626
616
515
712
511
1W
yom
ing
6862
4444
87
119
53
EXH
IBIT
15.
(co
ntin
ued)

December 201644
Section 3: Program Enrollment and Spending—Medicaid Overall
MAC
Stat
sSe
ctio
n 3
EXH
IBIT
15.
(co
ntin
ued)
Not
es: F
Y is
fisc
al y
ear.
Full-
year
equ
ival
ent (
FYE)
may
als
o be
refe
rred
to a
s av
erag
e m
onth
ly e
nrol
lmen
t. En
rollm
ent n
umbe
rs g
ener
ally
incl
ude
indi
vidu
als
ever
enr
olle
d in
M
edic
aid-
finan
ced
cove
rage
dur
ing
the
year
, eve
n if
for a
sin
gle
mon
th; h
owev
er, i
n th
e ev
ent i
ndiv
idua
ls w
ere
also
enr
olle
d in
CH
IP-fi
nanc
ed M
edic
aid
cove
rage
(i.e
., M
edic
aid-
expa
nsio
n CH
IP) d
urin
g th
e ye
ar, t
hey
are
excl
uded
if th
eir m
ost r
ecen
t enr
ollm
ent m
onth
was
in M
edic
aid-
expa
nsio
n CH
IP. N
umbe
rs e
xclu
de in
divi
dual
s en
rolle
d on
ly in
M
edic
aid-
expa
nsio
n CH
IP d
urin
g th
e ye
ar a
nd e
nrol
lees
in th
e te
rrito
ries.
Chi
ldre
n an
d ad
ults
und
er a
ge 6
5 w
ho q
ualif
y fo
r Med
icai
d on
the
basi
s of
dis
abili
ty a
re in
clud
ed in
the
disa
bled
cat
egor
y. A
bout
746
,000
enr
olle
es a
ge 6
5 an
d ol
der a
re id
entif
ied
in th
e da
ta a
s di
sabl
ed; g
iven
that
dis
abili
ty is
not
an
elig
ibili
ty p
athw
ay fo
r ind
ivid
uals
age
65
and
olde
r, M
ACPA
C re
code
s th
ese
enro
llees
as
aged
.
For M
ACPA
C’s
anal
ysis
, Med
icai
d en
rolle
es w
ere
assi
gned
a u
niqu
e na
tiona
l ide
ntifi
catio
n nu
mbe
r usi
ng a
n al
gorit
hm th
at in
corp
orat
es s
tate
-spe
cific
ID n
umbe
rs a
nd
bene
ficia
ry c
hara
cter
istic
s su
ch a
s da
te o
f birt
h an
d ge
nder
. The
sta
te a
nd n
atio
nal e
nrol
lmen
t cou
nts
show
n he
re a
re u
ndup
licat
ed u
sing
this
nat
iona
l ID.
Cat
egor
ies
may
no
t sum
to to
tal f
or e
ach
stat
e du
e to
roun
ding
. In
addi
tion,
the
sum
of t
he s
tate
tota
ls e
xcee
ds th
e na
tiona
l tot
al b
ecau
se in
divi
dual
s m
ay b
e en
rolle
d in
mor
e th
an o
ne s
tate
du
ring
the
year
.1
In th
is e
xhib
it, fu
ll-be
nefit
enr
olle
es c
olum
ns e
xclu
des
enro
llees
repo
rted
by
stat
es in
the
Med
icai
d St
atis
tical
Info
rmat
ion
Syst
em (M
SIS)
as
rece
ivin
g co
vera
ge o
f onl
y fa
mily
pla
nnin
g se
rvic
es, a
ssis
tanc
e w
ith M
edic
are
prem
ium
s an
d co
st s
harin
g, o
r em
erge
ncy
serv
ices
.2
Stat
e ha
d a
chan
ge in
tota
l FYE
enr
olle
es o
f 10
perc
ent o
r mor
e ov
er th
e pr
ior y
ear.
Thes
e da
ta m
ay re
flect
dat
a an
omal
ies
in th
e su
bmis
sion
of M
SIS
data
for t
he c
urre
nt
or p
rior y
ears
and
may
be
upda
ted
in fu
ture
MSI
S su
bmis
sion
s by
sta
tes.
MSI
S da
ta a
nom
alie
s ha
ve b
een
com
pile
d an
d re
port
ed b
y M
athe
mat
ica
Polic
y Re
sear
ch; t
he d
ata
anom
alie
s re
port
may
be
foun
d at
: htt
p://
ww
w.c
ms.
gov/
Rese
arch
-Sta
tistic
s-Da
ta-a
nd-S
yste
ms/
Com
pute
r-Dat
a-an
d-Sy
stem
s/M
edic
aidD
ataS
ourc
esG
enIn
fo/d
ownl
oads
/an
omal
ies1
.3
Whe
n co
mpa
red
to th
e De
cem
ber 2
015
editi
on o
f thi
s ta
ble,
Dis
tric
t of C
olum
bia
and
Mas
sach
uset
ts h
ad a
cha
nge
in to
tal F
YE e
nrol
lees
of 1
0 pe
rcen
t or m
ore
over
the
prio
r ye
ar. H
owev
er, b
oth
stat
es h
ave
sinc
e up
date
d th
eir 2
012
enro
llmen
t tot
al a
nd n
o lo
nger
has
a c
hang
e of
10
perc
ent o
r mor
e.4
Stat
es w
ere
excl
uded
due
to d
ata
relia
bilit
y co
ncer
ns re
gard
ing
com
plet
enes
s of
mon
thly
cla
ims
and
enro
llmen
t dat
a.
Sour
ce: M
ACPA
C, 2
016,
ana
lysi
s of
MSI
S da
ta a
s of
Dec
embe
r 201
5.

MACStats: Medicaid and CHIP Data Book 45
Section 3: Program Enrollment and Spending—Medicaid Overall
MAC
Stat
sSe
ctio
n 3
Stat
e1
Bene
fits
Stat
e pr
ogra
m a
dmin
istr
atio
nTo
tal M
edic
aid
Tota
lFe
dera
lSt
ate
Tota
lFe
dera
lSt
ate
Tota
lFe
dera
lSt
ate
Alab
ama
$5,2
65$3
,663
$1,6
02$2
31$1
52$7
9$5
,496
$3,8
15$1
,681
Alas
ka1,
405
826
580
130
7951
1,53
590
463
1Ar
izon
a10
,618
7,89
72,
721
277
199
7810
,895
8,09
62,
799
Arka
nsas
5,47
04,
302
1,16
838
326
411
95,
853
4,56
61,
287
Calif
orni
a84
,983
53,2
0931
,774
5,63
13,
509
2,12
290
,614
56,7
1833
,896
Colo
rado
7,30
14,
410
2,89
138
524
414
17,
686
4,65
43,
032
Conn
ectic
ut7,
183
4,21
12,
972
414
278
135
7,59
74,
490
3,10
7De
law
are
1,86
01,
115
745
163
120
432,
024
1,23
578
8Di
stric
t of C
olum
bia
2,37
01,
759
611
151
9457
2,52
11,
853
668
Flor
ida
21,3
2012
,877
8,44
370
343
127
222
,023
13,3
088,
715
Geo
rgia
9,66
56,
526
3,13
958
039
818
310
,245
6,92
43,
321
Haw
aii
1,95
81,
259
699
119
9227
2,07
71,
351
726
Idah
o1,
715
1,23
448
110
572
331,
820
1,30
651
4Ill
inoi
s16
,938
10,1
826,
756
1,02
460
242
217
,962
10,7
847,
178
Indi
ana
9,25
06,
366
2,88
447
228
518
69,
722
6,65
13,
070
Iow
a4,
476
2,85
91,
617
196
140
564,
672
2,99
91,
673
Kans
as3,
011
1,71
41,
297
183
120
623,
194
1,83
41,
360
Kent
ucky
9,42
37,
506
1,91
824
317
370
9,66
67,
679
1,98
7Lo
uisi
ana
7,86
34,
923
2,94
028
919
297
8,15
25,
116
3,03
7M
aine
2,47
71,
549
928
143
9944
2,62
01,
648
973
Mar
ylan
d9,
410
5,63
23,
779
471
306
166
9,88
25,
937
3,94
4M
assa
chus
etts
15,3
788,
632
6,74
678
648
530
016
,164
9,11
77,
047
Mic
higa
n15
,867
11,5
384,
329
694
479
215
16,5
6112
,017
4,54
4M
inne
sota
10,7
056,
275
4,42
959
035
723
311
,295
6,63
34,
662
Mis
siss
ippi
5,13
63,
807
1,33
017
711
760
5,31
43,
924
1,39
0M
isso
uri
9,51
86,
099
3,41
935
021
913
29,
869
6,31
83,
551
Mon
tana
1,13
276
736
675
5321
1,20
782
038
7N
ebra
ska
1,84
699
085
612
787
401,
974
1,07
789
6N
evad
a3,
106
2,34
176
516
011
347
3,26
62,
454
812
New
Ham
pshi
re1,
716
1,01
170
512
491
331,
841
1,10
273
8N
ew J
erse
y14
,049
8,63
15,
418
780
455
326
14,8
309,
086
5,74
4N
ew M
exic
o4,
920
3,89
81,
023
163
107
565,
083
4,00
51,
078
EXH
IBIT
16.
Med
icai
d Sp
endi
ng b
y St
ate,
Cat
egor
y, an
d So
urce
of F
unds
, FY
2015
(mill
ions
)

December 201646
Section 3: Program Enrollment and Spending—Medicaid Overall
MAC
Stat
sSe
ctio
n 3
Stat
e1
Bene
fits
Stat
e pr
ogra
m a
dmin
istr
atio
nTo
tal M
edic
aid
Tota
lFe
dera
lSt
ate
Tota
lFe
dera
lSt
ate
Tota
lFe
dera
lSt
ate
New
Yor
k$5
7,89
7$3
1,75
7$2
6,14
0$1
,784
$1,0
40$7
45$5
9,68
1$3
2,79
7$2
6,88
4N
orth
Car
olin
a13
,213
8,74
34,
470
665
486
180
13,8
789,
228
4,65
0N
orth
Dak
ota
534
319
215
169
654
932
922
1O
hio
21,4
2314
,787
6,63
686
054
631
522
,284
15,3
336,
951
Okl
ahom
a4,
703
2,98
71,
716
245
158
874,
948
3,14
61,
802
Ore
gon
8,02
76,
251
1,77
654
132
721
58,
569
6,57
81,
991
Penn
sylv
ania
23,2
2412
,978
10,2
4687
655
731
924
,100
13,5
3510
,565
Rhod
e Is
land
2,58
51,
530
1,05
414
499
452,
729
1,62
91,
100
Sout
h Ca
rolin
a5,
768
4,08
31,
685
260
172
886,
028
4,25
51,
773
Sout
h Da
kota
806
452
354
5537
1886
148
937
2Te
nnes
see
9,09
45,
917
3,17
741
225
116
29,
507
6,16
83,
339
Texa
s34
,691
20,4
3014
,261
1,45
697
248
436
,148
21,4
0314
,745
Uta
h2,
148
1,52
362
515
210
844
2,30
01,
631
669
Verm
ont
1,63
398
764
633
303
1,66
61,
017
649
Virg
inia
8,03
34,
070
3,96
347
833
014
88,
511
4,40
04,
111
Was
hing
ton
10,4
946,
818
3,67
658
135
822
311
,075
7,17
63,
899
Wes
t Virg
inia
3,64
72,
801
845
189
128
613,
836
2,92
990
7W
isco
nsin
7,89
44,
644
3,24
931
920
711
28,
212
4,85
13,
361
Wyo
min
g55
928
527
462
4418
621
329
292
Subt
otal
(sta
tes)
$523
,709
$329
,371
$194
,338
$25,
451
$16,
271
$9,1
80$5
49,1
60$3
45,6
42$2
03,5
18Am
eric
an S
amoa
3017
134
30
3421
13G
uam
7347
263
21
7649
27N
. Mar
iana
Isla
nds
2715
111
00
2716
11Pu
erto
Ric
o2,
280
1,46
781
382
5428
2,36
21,
522
841
Virg
in Is
land
s39
2316
85
347
2819
Subt
otal
(sta
tes
and
terr
itorie
s)$5
26,1
59$3
30,9
42$1
95,2
17$2
5,54
7$1
6,33
6$9
,212
$551
,706
$347
,277
$204
,429
Stat
e M
edic
aid
Frau
d Co
ntro
l Uni
ts
(MFC
Us)
––
–14
510
936
145
109
36M
edic
aid
surv
ey a
nd c
ertif
icat
ion
of n
ursi
ng a
nd in
term
edia
te c
are
faci
litie
s–
––
326
245
8232
624
582
Vacc
ines
for C
hild
ren
(VFC
) pro
gram
––
––
––
3,84
53,
845
–To
tal
$526
,159
$330
,942
$195
,217
$26,
019
$16,
689
$9,3
30$5
56,0
232
$351
,476
2$2
04,5
47
EXH
IBIT
16.
(co
ntin
ued)

MACStats: Medicaid and CHIP Data Book 47
Section 3: Program Enrollment and Spending—Medicaid Overall
MAC
Stat
sSe
ctio
n 3
Not
es: F
Y is
fisc
al y
ear.
Tota
l fed
eral
spe
ndin
g sh
own
here
($35
1,47
6 m
illio
n) w
ill d
iffer
from
tota
l fed
eral
out
lays
sho
wn
in F
Y 20
17 b
udge
t doc
umen
ts d
ue to
slig
ht d
iffer
ence
s in
the
timin
g of
dat
a fo
r the
sta
tes
and
the
trea
tmen
t of c
erta
in a
djus
tmen
ts. F
eder
al s
pend
ing
in th
e te
rrito
ries
is c
appe
d; h
owev
er, t
errit
orie
s re
port
thei
r tot
al s
pend
ing
rega
rdle
ss o
f whe
ther
they
hav
e re
ache
d th
eir c
aps.
As
a re
sult,
fede
ral s
pend
ing
show
n he
re m
ay e
xcee
d th
e am
ount
s ac
tual
ly p
aid
to th
e te
rrito
ries.
Sta
te s
hare
s fo
r MFC
Us
and
surv
ey a
nd c
ertif
icat
ion
are
MAC
PAC
estim
ates
bas
ed o
n 75
per
cent
fede
ral m
atch
. Sta
te-le
vel e
stim
ates
for t
hese
item
s ar
e av
aila
ble
but a
re n
ot s
how
n he
re. T
he
VFC
prog
ram
is a
utho
rized
in th
e M
edic
aid
stat
ute
but i
s op
erat
ed a
s a
sepa
rate
pro
gram
; 100
per
cent
fede
ral f
undi
ng fi
nanc
es th
e pu
rcha
se o
f vac
cine
s fo
r chi
ldre
n w
ho
are
enro
lled
in M
edic
aid,
uni
nsur
ed, o
r priv
atel
y in
sure
d w
ithou
t vac
cine
cov
erag
e. S
pend
ing
on a
dmin
istr
atio
n is
onl
y fo
r sta
te p
rogr
ams;
fede
ral o
vers
ight
spe
ndin
g is
not
in
clud
ed.
– D
ash
indi
cate
s ze
ro; $
0 in
dica
tes
an a
mou
nt le
ss th
an $
0.5
mill
ion
that
roun
ds to
zer
o.1
Not
all
stat
es h
ad c
ertif
ied
thei
r CM
S-64
Fin
anci
al M
anag
emen
t Rep
ort (
FMR)
sub
mis
sion
s as
of M
ay 2
4, 2
016.
Cal
iforn
ia’s
firs
t, se
cond
, thi
rd, a
nd fo
urth
qua
rter
su
bmis
sion
s ar
e no
t cer
tifie
d; C
olor
ado
and
Nor
th D
akot
a’s
seco
nd, t
hird
, and
four
th q
uart
er s
ubm
issi
ons
are
not c
ertif
ied;
New
Jer
sey’
s th
ird a
nd fo
urth
qua
rter
sub
mis
sion
s ar
e no
t cer
tifie
d. F
igur
es p
rese
nted
in th
is e
xhib
it m
ay c
hang
e if
stat
es re
vise
thei
r exp
endi
ture
dat
a af
ter t
his
date
.2
Amou
nts
exce
ed th
e su
m o
f ben
efits
and
sta
te p
rogr
am a
dmin
istr
atio
n co
lum
ns d
ue to
the
incl
usio
n of
the
VFC
prog
ram
.
Sour
ces:
For
sta
te a
nd te
rrito
ry s
pend
ing:
MAC
PAC,
201
6, a
naly
sis
of C
MS-
64 F
MR
net e
xpen
ditu
re d
ata
as o
f May
24,
201
6. F
or a
ll ot
her s
pend
ing
(MCF
Us,
sur
vey
and
cert
ifica
tion,
VFC
): Ce
nter
s fo
r Med
icar
e &
Med
icai
d Se
rvic
es, 2
016,
Fis
cal y
ear 2
017
just
ifica
tion
of e
stim
ates
for a
ppro
pria
tions
com
mitt
ees,
Bal
timor
e, M
D, h
ttps
://w
ww
.cm
s.go
v/Ab
out-C
MS/
Agen
cy-In
form
atio
n/Pe
rfor
man
ceBu
dget
/Dow
nloa
ds/F
Y201
7-CJ
-Fin
al.p
df.
EXH
IBIT
16.
(co
ntin
ued)

December 201648
Section 3: Program Enrollment and Spending—Medicaid Benefits
MAC
Stat
sSe
ctio
n 3
EXH
IBIT
17.
Tot
al M
edic
aid
Bene
fit S
pend
ing
by S
tate
and
Cat
egor
y, FY
201
5 (m
illio
ns)
Stat
e1
Tota
l sp
endi
ng
on b
enef
its
Fee
for s
ervi
ceM
anag
ed
care
and
pr
emiu
m
assi
stan
ce
Med
icar
e pr
emiu
ms
and
coin
sura
nce
Colle
ctio
nsH
ospi
tal
Phys
icia
nDe
ntal
Oth
er
prac
titio
nerCl
inic
and
he
alth
ce
nter
Oth
er a
cute
Drug
sIn
stitu
tiona
l LT
SS
Hom
e an
d co
mm
unity
-ba
sed
LTSS
Alab
ama
$5,2
65$1
,992
$427
$80
$50
$94
$621
$283
$1,0
21$4
67-$
2$2
61-$
29
Alas
ka1,
405
317
121
6925
201
117
2919
832
30
21-1
6
Ariz
ona
10,6
181,
143
455
614
831
58
752
8,64
924
6-2
3
Arka
nsas
5,47
01,
021
334
7923
3992
715
595
752
61,
170
305
-67
Calif
orni
a84
,983
19,4
471,
038
1,03
225
3,46
15,
886
1,38
84,
072
7,71
439
,105
2,36
2-5
48
Colo
rado
7,30
12,
419
673
256
–16
429
331
774
11,
214
1,16
012
1-5
7
Conn
ectic
ut7,
183
1,86
540
718
417
929
854
461
71,
739
1,61
30
406
-670
Dela
war
e21,
860
6615
360
4269
-64
3611
71,
508
36-2
Dist
rict o
f Col
umbi
a2,
370
332
4018
317
654
9635
440
387
438
-17
Flor
ida
21,3
203,
617
545
1919
166
556
104
970
1,11
713
,022
1,34
3-1
56
Geo
rgia
9,66
52,
228
373
3330
1967
836
91,
371
1,03
63,
269
345
-85
Haw
aii
1,95
811
41
312
195
19
107
1,67
152
-54
Idah
o1,
715
394
119
-021
2620
370
317
322
206
53-1
6
Illin
ois
16,9
385,
155
600
124
114
248
1,01
328
72,
345
1,64
05,
101
411
-101
Indi
ana
9,25
01,
221
197
160
1240
055
919
62,
312
1,15
32,
901
219
-79
Iow
a4,
476
949
230
5429
9843
217
693
079
472
015
0-8
7
Kans
as2
3,01
114
813
02
478
-181
32,
630
83-3
0
Kent
ucky
9,42
338
833
24
119
368
391,
159
785
6,39
221
0-7
6
Loui
sian
a7,
863
1,89
118
21
–63
246
199
1,47
582
02,
904
277
-195
Mai
ne2,
477
563
9427
4524
041
296
450
448
320
2-1
03
Mar
ylan
d9,
410
1,10
711
713
029
100
1,01
424
31,
353
1,18
34,
005
271
-143
Mas
sach
uset
ts15
,378
2,02
541
225
027
101
1,45
534
41,
661
2,97
25,
879
440
-186
Mic
higa
n15
,867
1,75
246
256
1226
448
438
71,
816
777
9,52
641
2-8
2
Min
neso
ta10
,705
650
197
4220
373
712
161,
031
2,63
35,
201
179
-231
Mis
siss
ippi
5,13
61,
684
172
521
8136
010
41,
099
345
1,07
421
2-2
0
Mis
sour
i9,
518
3,09
527
1412
493
922
705
1,39
51,
433
1,17
134
1-9
0
Mon
tana
1,13
231
960
3322
1720
051
198
214
-137
-17
Neb
rask
a1,
846
142
2136
23
6484
416
382
635
103
-42
Nev
ada
3,10
657
315
342
2146
303
124
288
205
1,24
512
5-2
2
New
Ham
pshi
re2
1,71
613
818
243
515
1-6
399
300
669
32-1
6

MACStats: Medicaid and CHIP Data Book 49
Section 3: Program Enrollment and Spending—Medicaid Benefits
MAC
Stat
sSe
ctio
n 3
Stat
e1
Tota
l sp
endi
ng
on b
enef
its
Fee
for s
ervi
ceM
anag
ed
care
and
pr
emiu
m
assi
stan
ce
Med
icar
e pr
emiu
ms
and
coin
sura
nce
Colle
ctio
nsH
ospi
tal
Phys
icia
nDe
ntal
Oth
er
prac
titio
nerCl
inic
and
he
alth
ce
nter
Oth
er a
cute
Drug
sIn
stitu
tiona
l LT
SS
Hom
e an
d co
mm
unity
-ba
sed
LTSS
New
Jer
sey
$14,
049
$1,8
18$5
6$6
$3$2
39$7
63$2
9$2
,634
$1,0
35$7
,313
$341
-$18
6
New
Mex
ico
4,92
036
833
1143
752
929
337
3,95
589
-13
New
Yor
k57
,897
9,85
457
467
209
1,34
14,
848
1,05
97,
783
6,70
926
,053
1,31
0-1
,909
Nor
th C
arol
ina
13,2
134,
663
995
315
6618
01,
095
738
1,34
683
32,
843
407
-271
Nor
th D
akot
a53
479
296
66
2514
169
108
916
-3
Ohi
o21
,423
2,30
028
644
1655
1,65
710
92,
555
3,32
510
,862
388
-175
Okl
ahom
a4,
703
1,75
147
310
341
360
362
367
769
546
8913
6-2
94
Ore
gon
8,02
748
135
225
118
357
8541
51,
619
4,73
419
5-4
0
Penn
sylv
ania
23,2
241,
431
8628
210
836
924
4,79
73,
915
12,0
3759
8-1
71
Rhod
e Is
land
2,58
535
610
111
3654
82
181
11,
404
49-1
4
Sout
h Ca
rolin
a5,
768
1,07
913
111
419
205
380
4979
651
62,
494
181
-196
Sout
h Da
kota
806
206
6219
388
5632
172
146
228
-7
Tenn
esse
e9,
094
841
3716
00
4322
642
427
267
56,
109
358
-50
Texa
s34
,691
6,91
950
954
645
354,
992
230
2,99
32,
146
16,2
281,
055
-1,1
16
Uta
h2,
148
288
8218
411
144
6327
425
81,
016
39-4
8
Verm
ont2
1,63
345
20
01
1,54
6-9
312
08
07
-2
Virg
inia
8,03
385
316
214
730
461,
001
771,
241
1,38
32,
933
231
-71
Was
hing
ton
10,4
9495
414
718
224
653
469
170
930
1,81
44,
936
342
-127
Wes
t Virg
inia
3,64
773
223
929
2683
281
188
780
592
600
124
-29
Wis
cons
in7,
894
775
6544
2332
259
649
688
796
63,
563
237
-81
Wyo
min
g55
912
742
1420
3330
2313
612
62
14-7
Subt
otal
$523
,709
$92,
676
$11,
181
$4,2
14$2
,148
$11,
178
$38,
838
$10,
507
$59,
548
$58,
107
$227
,956
$15,
426
-$8,
070
Amer
ican
Sam
oa30
19-4
-0–
-216
1-0
––
––
Gua
m73
128
30
127
211
0–
1–
N. M
aria
na Is
land
s27
18–
0–
16
1–
0-0
0–
Puer
to R
ico
2,28
0–
––
––
16–
––
2,26
4–
–
Virg
in Is
land
s39
194
21
12
63
0–
1–
Tota
l$5
26,1
59$9
2,74
5$1
1,18
9$4
,218
$2,1
50$1
1,18
0$3
8,90
5$1
0,53
5$5
9,55
2$5
8,10
7$2
30,2
20$1
5,42
8-$
8,07
0Pe
rcen
t of t
otal
, ex
clus
ive
of
colle
ctio
ns–
17.4
%2.
1%0.
8%0.
4%2.
1%7.
3%2.
0%11
.1%
10.9
%43
.1%
2.9%
–
EXH
IBIT
17.
(co
ntin
ued)

December 201650
Section 3: Program Enrollment and Spending—Medicaid Benefits
MAC
Stat
sSe
ctio
n 3
Not
es: F
Y is
fisc
al y
ear.
LTSS
is lo
ng-te
rm s
ervi
ces
and
supp
orts
. Inc
lude
s fe
dera
l and
sta
te fu
nds.
Ser
vice
cat
egor
y de
finiti
ons
and
spen
ding
am
ount
s sh
own
here
may
di
ffer
from
oth
er C
ente
rs fo
r Med
icar
e &
Med
icai
d Se
rvic
es d
ata
sour
ces,
suc
h as
the
Med
icai
d St
atis
tical
Info
rmat
ion
Syst
em (M
SIS)
. The
spe
cific
ser
vice
s in
clud
ed in
ea
ch c
ateg
ory
have
cha
nged
ove
r tim
e an
d th
eref
ore
may
not
be
dire
ctly
com
para
ble
to e
arlie
r edi
tions
of M
ACSt
ats.
Col
lect
ions
incl
ude
third
-par
ty li
abili
ty, e
stat
e, a
nd
othe
r rec
over
ies.
– D
ash
indi
cate
s ze
ro; $
0 or
-$0
indi
cate
s an
am
ount
bet
wee
n $0
.5 a
nd -$
0.5
mill
ion
that
roun
ds to
zer
o.
Addi
tiona
l det
ail o
n ca
tego
ries:
• H
ospi
tal i
nclu
des
inpa
tient
, out
patie
nt, c
ritic
al a
cces
s ho
spita
l, an
d em
erge
ncy
hosp
ital s
ervi
ces,
as
wel
l as
rela
ted
disp
ropo
rtio
nate
sha
re h
ospi
tal (
DSH
) pay
men
ts.
• Ph
ysic
ian
incl
udes
phy
sici
an a
nd s
urgi
cal s
ervi
ces,
bot
h re
gula
r pay
men
ts a
nd th
ose
asso
ciat
ed w
ith th
e pr
imar
y ca
re p
hysi
cian
pay
men
t inc
reas
e.
• Cl
inic
and
hea
lth c
ente
r inc
lude
s no
n-ho
spita
l out
patie
nt c
linic
, rur
al h
ealth
clin
ic, f
eder
ally
qua
lifie
d he
alth
cen
ter,
and
free
stan
ding
birt
h ce
nter
.
• O
ther
acu
te in
clud
es la
b or
X-ra
y; s
teril
izat
ions
; abo
rtio
ns; E
arly
and
Per
iodi
c Sc
reen
ing,
Dia
gnos
tic, a
nd T
reat
men
t scr
eeni
ngs;
em
erge
ncy
serv
ices
for u
naut
horiz
ed
alie
ns; n
on-e
mer
genc
y tr
ansp
orta
tion;
phy
sica
l, oc
cupa
tiona
l, sp
eech
, and
hea
ring
ther
apy;
pro
sthe
tics,
den
ture
s, a
nd e
yegl
asse
s; p
reve
ntiv
e se
rvic
es w
ith U
.S. P
reve
ntiv
e Se
rvic
es T
ask
Forc
e (U
SPST
F) G
rade
A o
r B a
nd A
dvis
ory
Com
mitt
ee o
n Im
mun
izat
ion
Prac
tices
(ACI
P) v
acci
nes;
oth
er d
iagn
ostic
scr
eeni
ng a
nd p
reve
ntiv
e se
rvic
es;
scho
ol-b
ased
ser
vice
s; h
ealth
hom
e w
ith c
hron
ic c
ondi
tions
; tob
acco
ces
satio
n fo
r pre
gnan
t wom
en; p
rivat
e du
ty n
ursi
ng; c
ase
man
agem
ent (
excl
udin
g pr
imar
y ca
re
case
man
agem
ent)
; reh
abili
tativ
e se
rvic
es; h
ospi
ce; a
nd o
ther
car
e no
t oth
erw
ise
cate
goriz
ed.
• Dr
ugs
are
net o
f reb
ates
.
• In
stitu
tiona
l LTS
S in
clud
es n
ursi
ng fa
cilit
y, in
term
edia
te c
are
faci
lity
for i
ndiv
idua
ls w
ith in
telle
ctua
l dis
abili
ties,
and
men
tal h
ealth
faci
lity.
• H
ome
and
com
mun
ity-b
ased
LTS
S in
clud
es h
ome
heal
th, w
aive
r and
sta
te p
lan
serv
ices
, and
per
sona
l car
e.
• M
anag
ed c
are
and
prem
ium
ass
ista
nce
incl
udes
com
preh
ensi
ve a
nd li
mite
d-be
nefit
man
aged
car
e pl
ans,
prim
ary
care
cas
e m
anag
emen
t, em
ploy
er-s
pons
ored
pre
miu
m
assi
stan
ce p
rogr
ams,
and
Pro
gram
s of
All-
incl
usiv
e Ca
re fo
r the
Eld
erly
. Com
preh
ensi
ve p
lans
acc
ount
for o
ver 9
0 pe
rcen
t of s
pend
ing
in th
e m
anag
ed c
are
cate
gory
. M
anag
ed c
are
also
incl
udes
reba
tes
for d
rugs
pro
vide
d by
man
aged
car
e pl
ans,
and
man
aged
car
e pa
ymen
ts a
ssoc
iate
d w
ith th
e pr
imar
y ca
re p
hysi
cian
pay
men
t in
crea
se, C
omm
unity
Firs
t Cho
ice
optio
n, a
nd p
reve
ntiv
e se
rvic
es w
ith U
SPST
F G
rade
A o
r B, a
nd A
CIP
vacc
ines
.
1 N
ot a
ll st
ates
had
cer
tifie
d th
eir C
MS-
64 F
inan
cial
Man
agem
ent R
epor
t (FM
R) s
ubm
issi
ons
as o
f May
24,
201
6. C
alifo
rnia
’s fi
rst,
seco
nd, t
hird
, and
four
th q
uart
er
subm
issi
ons
are
not c
ertif
ied;
Col
orad
o an
d N
orth
Dak
ota’
s se
cond
, thi
rd, a
nd fo
urth
qua
rter
sub
mis
sion
s ar
e no
t cer
tifie
d; N
ew J
erse
y’s
third
and
four
th q
uart
er s
ubm
issi
ons
are
not c
ertif
ied.
Fig
ures
pre
sent
ed in
this
exh
ibit
may
cha
nge
if st
ates
revi
se th
eir e
xpen
ditu
re d
ata
afte
r thi
s da
te.
2 St
ate
repo
rts
nega
tive
fee-
for-s
ervi
ce (F
FS) d
rug
spen
ding
aft
er th
e ap
plic
atio
n of
dru
g re
bate
s. T
he n
egat
ive
net a
mou
nt m
ay re
flect
a s
hift
of s
ome
FFS
drug
spe
ndin
g in
to
Med
icai
d m
anag
ed c
are
or th
e st
ate
not s
epar
atel
y re
port
ing
the
FFS
and
man
aged
car
e dr
ug re
bate
s. V
erm
ont s
how
s ne
gativ
e dr
ug s
pend
ing
beca
use
it re
port
s m
ost o
f its
be
nefit
spe
ndin
g un
der o
ther
car
e se
rvic
es in
its
CMS-
64 s
ubm
issi
on.
Sour
ce: M
ACPA
C, 2
016,
ana
lysi
s of
CM
S-64
FM
R ne
t exp
endi
ture
dat
a as
of M
ay 2
4, 2
016.
EXH
IBIT
17.
(co
ntin
ued)

MACStats: Medicaid and CHIP Data Book 51
Section 3: Program Enrollment and Spending—Medicaid Benefits
MAC
Stat
sSe
ctio
n 3
All enrollees$401.2 billion
Child$76.4 billion
Adult$62.2 billion
Disabled$170.2 billion
Aged$92.6 billion
Medicare premiums
LTSS institutional
LTSS non-institutional
Managed care
Drugs
Non-hospital acute
Inpatient and outpatient hospital
17.3%
2.0%
16.1%
18.7%
2.6%
12.7%
5.8%
0.3%
45.1%
18.9%
2.3%
1.2%1.5%*
28.3%
2.3%
0.5%0.2%0.3%
14.2%
3.3%
13.6%
3.1%
7.0%
8.6%
23.0%
15.5%
14.2%
3.3%
13.6%
3.1%
7.0%
8.6%
23.0%
15.5%
13.8% 22.8%
16.6%
33.3%
13.8%
26.5%
22.8%
16.6%
16.6%
53.0% 52.9%
Notes: FY is fiscal year. LTSS is long-term services and supports. Includes federal and state funds. Excludes spending for administration, the territories, and Medicaid-expansion CHIP enrollees. Children and adults under age 65 who qualify for Medicaid on the basis of disability are included in the disabled category. About 746,000 enrollees age 65 and older are identified in the data as disabled; given that disability is not an eligibility pathway for individuals age 65 and older, MACPAC recodes these enrollees as aged. Amounts are fee for service unless otherwise noted. Benefit spending from Medicaid Statistical Information System (MSIS) data has been adjusted to reflect CMS-64 totals. Due to changes in both methods and data, figures shown here are not directly comparable to earlier years. With regard to methods, spending totals now exclude disproportionate share hospital (DSH) and certain incentive and uncompensated care pool payments made under Section 1115 waiver expenditure authority, which were previously included prior to the December 2015 data book. See https://www.macpac.gov/macstats/data-sources-and-methods/ for additional information. Excludes Idaho, Louisiana, and Rhode Island due to data reliability concerns regarding completeness of monthly claims and enrollment data.
* Values less than 0.1 percent are not shown.
Sources: MACPAC, 2016, analysis of MSIS data as of December 2015 and analysis of CMS-64 Financial Management Report net expenditure data from the Centers for Medicare & Medicaid Services as of June 2016.
EXHIBIT 18. Distribution of Medicaid Benefit Spending by Eligibility Group and Service Category, FY 2013

December 201652
Section 3: Program Enrollment and Spending—Medicaid Benefits
MAC
Stat
s
Medicare premiums
LTSS institutional
LTSS non-institutional
Managed care
Drugs
Non-hospital acute
Inpatient and outpatienthospital
All enrollees$7,067
Child$2,866
Adult$4,197
Disabled$18,145
Aged$15,557
$1,000
$140
$2,356 $2,219
$975
$1,138
$236
$1,221 $543 $1,188$3,399
$2,467
$478
$4,803
$4,138
$2,302
$558 $1,340
$7,012
$2,585
$2,584
$41
$1,087
$908
$659 $648
$67 $97
$1,520
$34 $20
$43 $10
* $14
Notes: FY is fiscal year. LTSS is long-term services and supports. Includes federal and state funds. Excludes spending for administration, the territories, and Medicaid-expansion CHIP enrollees. Children and adults under age 65 who qualify for Medicaid on the basis of disability are included in the disabled category. About 746,000 enrollees age 65 and older are identified in the data as disabled; given that disability is not an eligibility pathway for individuals age 65 and older, MACPAC recodes these enrollees as aged. Amounts are fee for service unless otherwise noted, and they reflect all enrollees, including those with limited benefits. Benefit spending from Medicaid Statistical Information System (MSIS) data has been adjusted to reflect CMS-64 totals. Due to changes in both methods and data, figures shown here are not directly comparable to earlier years. With regard to methods, spending totals now exclude disproportionate share hospital (DSH) and certain incentive and uncompensated care pool payments made under Section 1115 waiver expenditure authority, which were previously included prior to the December 2015 data book. See https://www.macpac.gov/macstats/data-sources-and-methods/ for additional information. Excludes Idaho, Louisiana, and Rhode Island due to data reliability concerns regarding completeness of monthly claims and enrollment data.
* Values less than $1 are not shown.
Sources: MACPAC, 2016, analysis of MSIS data as of December 2015 and analysis of CMS-64 Financial Management Report net expenditure data from the Centers for Medicare & Medicaid Services as of June 2016.
EXHIBIT 19. Medicaid Benefit Spending Per Full-Year Equivalent (FYE) Enrollee by Eligibility Group and Service Category, FY 2013
Sect
ion
3

MACStats: Medicaid and CHIP Data Book 53
Section 3: Program Enrollment and Spending—Medicaid Benefits
MAC
Stat
sSe
ctio
n 3
All enrollees68.5 million
Benefit spending for LTSS and all other services
$401.2 billion
41.8% of spending ($167.7 billion)is for LTSS users
5.9% of enrollees(4.1 million) are
LTSS users
Not using LTSS
Using LTSS: Non-institutional only, no services under HCBS waiver1
Using LTSS: Non-institutional only,with some services under HCBS waiver1
Using LTSS: Institutional only
Using LTSS: Both institutional andnon-institutional
94.1%
58.2%
7.8%
17.9%
2.9%2.4%
13.6%
1.9%1.9%1.9%0.3%
Notes: FY is fiscal year. LTSS is long-term services and supports. HCBS is home and community-based services. Includes federal and state funds. Excludes spending on administration, the territories, and Medicaid-expansion CHIP enrollees. Benefit spending from Medicaid Statistical Information System (MSIS) data has been adjusted to reflect CMS-64 totals, and enrollment counts are unduplicated using unique national identification numbers. Due to changes in both methods and data, figures shown here are not directly comparable to earlier years. With regard to methods, spending totals now exclude disproportionate share hospital (DSH) payments and certain incentive and uncompensated care pool payments made under Section 1115 waiver expenditure authority, which were previously included prior to the December 2015 data book. See https://www.macpac.gov/macstats/data-sources-and-methods/ for additional information.
LTSS users are defined here as enrollees having at least one LTSS claim during the year under a fee-for-service arrangement. (The data do not allow a breakout of LTSS services delivered through managed care.) For example, an enrollee with a short stay in a nursing facility for rehabilitation following a hospital discharge and an enrollee with permanent residence in a nursing facility would both be counted as LTSS users. Excludes Idaho, Louisiana, and Rhode Island due to data reliability concerns regarding completeness of monthly claims and enrollment data.1 All states have HCBS waiver programs that provide a range of LTSS for targeted populations of non-institutionalized enrollees who require institutional levels of care. Based on a comparison with CMS-372 data (a state-reported source containing aggregate spending and enrollment for HCBS waivers), the number of HCBS waiver enrollees may be underreported in the MSIS.
Source: MACPAC, 2016, analysis of MSIS data as of December 2015 and CMS-64 Financial Management Report net expenditure data from the Centers for Medicare & Medicaid Services as of June 2016.
EXHIBIT 20. Distribution of Medicaid Enrollment and Benefit Spending by Users and Non-Users of Long-Term Services and Supports, FY 2013

December 201654
Section 3: Program Enrollment and Spending—Medicaid Benefits
MAC
Stat
s
Stat
eTo
tal
Basi
s of
elig
ibilt
y1
Dual
ly e
ligib
le s
tatu
s2
All d
ually
elig
ible
en
rolle
esDu
ally
elig
ible
with
full
bene
fits
Dual
ly e
ligib
le w
ith
limite
d be
nefit
sCh
ildAd
ult
Disa
bled
Aged
Tota
lAg
e 65
+To
tal
Age
65+
Tota
lAg
e 65
+To
tal
$401
,238
19.0
%15
.5%
42.4
%23
.1%
$143
,337
60.5
%$1
37,2
9260
.8%
$6,0
4453
.7%
Alab
ama
4,56
823
.79.
941
.924
.61,
651
67.1
1,41
469
.223
754
.7Al
aska
1,33
527
.416
.336
.120
.139
957
.239
857
.21
69.3
Ariz
ona
7,58
624
.028
.533
.713
.71,
611
57.3
1,55
357
.157
62.4
Arka
nsas
4,14
125
.04.
947
.422
.71,
494
60.9
1,34
663
.414
838
.0Ca
lifor
nia
57,2
9718
.117
.740
.323
.917
,994
67.4
17,5
2567
.446
968
.8Co
lora
do4,
898
21.4
15.0
42.5
21.1
1,58
561
.31,
544
61.7
4146
.5Co
nnec
ticut
6,45
215
.624
.031
.329
.02,
985
59.2
2,81
058
.817
565
.1De
law
are
1,55
219
.131
.532
.017
.446
556
.043
156
.834
46.0
Dist
rict o
f Col
umbi
a2,
232
11.2
20.9
47.9
20.0
610
61.3
609
61.3
136
.2Fl
orid
a17
,232
19.0
14.0
40.9
26.1
6,70
663
.05,
867
64.4
839
53.2
Geo
rgia
8,53
024
.113
.041
.421
.52,
634
67.2
2,37
268
.926
251
.8H
awai
i1,
524
14.1
22.0
35.3
28.6
578
71.8
568
72.0
1062
.8Id
aho
33
33
33
33
33
3
Illin
ois
15,2
1124
.117
.638
.020
.44,
725
57.8
4,63
758
.088
49.5
Indi
ana
7,63
016
.812
.446
.024
.93,
145
57.8
2,94
759
.319
835
.7Io
wa
3,64
917
.310
.649
.322
.71,
682
48.9
1,64
348
.739
56.6
Kans
as2,
441
22.9
7.8
46.6
22.8
945
55.5
893
56.6
5237
.4Ke
ntuc
ky5,
606
22.9
11.0
47.3
18.8
1,67
860
.61,
517
62.3
161
45.4
Loui
sian
a3
33
33
33
33
33
Mai
ne2,
850
14.2
16.1
44.8
24.8
1,26
455
.31,
149
54.0
115
67.5
Mar
ylan
d7,
647
19.2
20.3
41.0
19.5
2,32
359
.42,
188
60.1
135
49.0
Mas
sach
uset
ts12
,338
12.1
13.8
47.0
27.2
5,46
357
.65,
421
57.3
4294
.9M
ichi
gan
11,9
9818
.616
.145
.819
.53,
804
58.8
3,69
959
.110
548
.0M
inne
sota
8,87
315
.922
.341
.620
.23,
428
50.1
3,40
050
.127
51.0
Mis
siss
ippi
4,51
820
.39.
945
.524
.41,
711
64.0
1,50
466
.720
744
.2M
isso
uri
8,24
823
.69.
249
.317
.92,
695
49.7
2,63
749
.858
46.6
Mon
tana
989
25.2
10.7
39.0
25.1
387
64.0
363
65.1
2447
.1N
ebra
ska
1,78
818
.610
.646
.224
.678
751
.377
851
.39
52.5
Nev
ada
1,74
229
.612
.942
.714
.838
460
.332
962
.154
50.0
New
Ham
pshi
re1,
162
23.5
6.1
38.0
32.4
607
59.0
585
59.7
2240
.5N
ew J
erse
y9,
266
16.2
8.3
46.3
29.3
4,47
257
.04,
429
56.9
4366
.1
EXH
IBIT
21.
Med
icai
d Sp
endi
ng b
y St
ate,
Elig
ibili
ty G
roup
, and
Dua
lly E
ligib
le S
tatu
s, F
Y 20
13 (m
illio
ns)
Sect
ion
3

MACStats: Medicaid and CHIP Data Book 55
Section 3: Program Enrollment and Spending—Medicaid Benefits
MAC
Stat
sSe
ctio
n 3
Stat
eTo
tal
Basi
s of
elig
ibilt
y1
Dual
ly e
ligib
le s
tatu
s2
All d
ually
elig
ible
en
rolle
esDu
ally
elig
ible
with
full
bene
fits
Dual
ly e
ligib
le w
ith
limite
d be
nefit
sCh
ildAd
ult
Disa
bled
Aged
Tota
lAg
e 65
+To
tal
Age
65+
Tota
lAg
e 65
+N
ew M
exic
o$3
,270
39.4
%25
.3%
31.7
%3.
5%$3
5031
.1%
$300
27.2
%$4
954
.7%
New
Yor
k50
,354
10.6
21.6
38.9
28.9
21,4
7063
.321
,169
63.2
301
70.7
Nor
th C
arol
ina
11,2
9823
.113
.645
.617
.83,
499
56.7
3,36
157
.113
847
.5N
orth
Dak
ota
783
16.7
8.4
43.2
31.6
429
56.9
424
57.0
546
.1O
hio
16,1
5415
.017
.144
.823
.05,
899
56.9
5,62
757
.827
238
.1O
klah
oma
4,75
428
.815
.638
.916
.71,
380
53.7
1,34
853
.833
51.3
Ore
gon
4,78
216
.922
.737
.822
.61,
637
63.8
1,55
164
.986
44.3
Penn
sylv
ania
20,2
4516
.16.
752
.924
.37,
719
61.5
7,58
861
.613
154
.8Rh
ode
Isla
nd3
33
33
33
33
33
Sout
h Ca
rolin
a4,
449
23.0
15.8
41.4
19.7
1,50
058
.51,
470
58.5
2956
.0So
uth
Dako
ta76
523
.411
.744
.220
.828
454
.926
555
.620
44.9
Tenn
esse
e7,
617
23.2
14.4
39.5
22.9
2,88
559
.12,
684
60.1
201
45.2
Texa
s24
,417
30.2
6.9
43.4
19.6
7,33
063
.56,
596
63.6
733
62.6
Uta
h2,
101
28.8
17.1
43.8
10.2
559
36.8
551
36.7
840
.3Ve
rmon
t1,
431
44
44
44
44
44
Virg
inia
7,10
521
.111
.445
.721
.82,
575
54.4
2,44
655
.012
941
.7W
ashi
ngto
n7,
805
22.2
15.0
44.0
18.8
2,33
861
.22,
215
62.2
123
41.8
Wes
t Virg
inia
2,94
916
.89.
650
.123
.61,
120
61.1
1,05
462
.166
46.4
Wis
cons
in7,
105
11.9
15.7
43.7
28.8
3,52
256
.33,
484
56.3
3957
.6W
yom
ing
554
20.4
8.8
45.3
25.6
277
50.7
257
51.3
1941
.4
Not
es: F
Y is
fisc
al y
ear.
Incl
udes
fede
ral a
nd s
tate
fund
s. E
xclu
des
spen
ding
for a
dmin
istra
tion,
the
terri
torie
s, a
nd M
edic
aid-
expa
nsio
n CH
IP e
nrol
lees
. Ben
efit
spen
ding
from
M
edic
aid
Stat
istic
al In
form
atio
n Sy
stem
(MSI
S) d
ata
has
been
adj
uste
d to
refle
ct C
MS-
64 to
tals
. Due
to c
hang
es in
bot
h m
etho
ds a
nd d
ata,
figu
res
show
n he
re a
re n
ot d
irect
ly
com
para
ble
to e
arlie
r yea
rs. W
ith re
gard
to m
etho
ds, s
pend
ing
tota
ls n
ow e
xclu
de d
ispr
opor
tiona
te s
hare
hos
pita
l (DS
H) a
nd c
erta
in in
cent
ive
and
unco
mpe
nsat
ed c
are
pool
pa
ymen
ts m
ade
unde
r Sec
tion
1115
wai
ver e
xpen
ditu
re a
utho
rity,
whi
ch w
ere
prev
ious
ly in
clud
ed p
rior t
o th
e De
cem
ber 2
015
data
boo
k. S
ee h
ttps:
//w
ww
.mac
pac.
gov/
mac
stat
s/da
ta-s
ourc
es-a
nd-m
etho
ds/ f
or a
dditi
onal
info
rmat
ion.
1 Ch
ildre
n an
d ad
ults
und
er a
ge 6
5 w
ho q
ualif
y fo
r Med
icai
d on
the
basi
s of
dis
abili
ty a
re in
clud
ed in
the
disa
bled
cat
egor
y. A
bout
746
,000
enr
olle
es a
ge 6
5 an
d ol
der a
re
iden
tifie
d in
the
data
as
disa
bled
; giv
en th
at d
isab
ility
is n
ot a
n el
igib
ility
pat
hway
for i
ndiv
idua
ls a
ge 6
5 an
d ol
der,
MAC
PAC
reco
des
thes
e en
rolle
es a
s ag
ed.
2 Du
ally
elig
ible
enr
olle
es a
re c
over
ed b
y bo
th M
edic
aid
and
Med
icar
e; th
ose
with
lim
ited
bene
fits
rece
ive
only
Med
icai
d as
sist
ance
with
Med
icar
e pr
emiu
ms
and
cost
sha
ring.
3 St
ates
wer
e ex
clud
ed d
ue to
dat
a re
liabi
lity
conc
erns
rega
rdin
g co
mpl
eten
ess
of m
onth
ly c
laim
s an
d en
rollm
ent d
ata.
4 Du
e to
larg
e di
ffer
ence
s in
the
way
spe
ndin
g is
repo
rted
by
Verm
ont i
n CM
S-64
and
MSI
S da
ta, M
ACPA
C’s
adju
stm
ent m
etho
dolo
gy is
app
lied
only
to to
tal M
edic
aid
spen
ding
.
Sour
ce: M
ACPA
C, 2
016,
ana
lysi
s of
MSI
S da
ta a
s of
Dec
embe
r 201
5 an
d an
alys
is o
f CM
S-64
Fin
anci
al M
anag
emen
t Rep
ort n
et e
xpen
ditu
re d
ata
as o
f Jun
e 20
16.
EXH
IBIT
21.
(co
ntin
ued)

December 201656
Section 3: Program Enrollment and Spending—Medicaid Benefits
MAC
Stat
s
Stat
e
Tota
lCh
ildAd
ult
Disa
bled
Aged
All
enro
llees
Full-
bene
fit
enro
llees
1Al
l en
rolle
esFu
ll-be
nefit
en
rolle
es1
All
enro
llees
Full-
bene
fit
enro
llees
1Al
l en
rolle
esFu
ll-be
nefit
en
rolle
es1
All
enro
llees
Full-
bene
fit
enro
llees
1
Tota
l$7
,067
$7,7
66$2
,866
$2,8
84$4
,197
$5,1
38$1
8,14
5$2
0,09
1$1
5,55
7$1
9,91
2
Alab
ama
4,71
75,
598
2,25
22,
252
2,73
15,
077
9,00
111
,092
10,1
7321
,493
Alas
ka12
,061
12,1
025,
957
5,95
78,
879
8,86
930
,736
31,0
1329
,998
31,1
01
Ariz
ona
5,58
25,
821
2,81
02,
844
4,89
45,
337
15,9
2016
,495
9,66
612
,321
Arka
nsas
6,89
08,
206
3,33
83,
374
2,47
26,
076
13,5
9916
,603
14,5
5523
,224
Calif
orni
a6,
156
7,89
33,
107
3,24
02,
594
4,47
422
,581
22,5
4113
,199
13,2
84
Colo
rado
26,
819
6,92
22,
574
2,55
85,
072
4,82
318
,778
20,6
2818
,399
23,5
90
Conn
ectic
ut8,
830
9,67
13,
463
3,46
56,
036
6,07
526
,992
35,0
0917
,353
37,2
86
Dela
war
e7,
272
8,11
03,
476
3,50
05,
547
6,20
619
,352
25,9
8218
,766
38,6
39
Dist
rict o
f Col
umbi
a310
,366
10,3
383,
373
3,37
35,
466
5,38
229
,100
29,1
2723
,326
23,4
01
Flor
ida
5,09
05,
420
1,89
91,
880
4,15
53,
978
12,0
3815
,048
9,12
014
,733
Geo
rgia
25,
355
5,81
92,
301
2,30
05,
000
5,63
311
,530
13,9
2910
,713
19,8
95
Haw
aii
6,04
66,
097
2,01
72,
015
4,06
64,
058
13,9
6114
,403
17,6
9619
,529
Idah
o4
44
44
44
44
4
Illin
ois
5,68
35,
854
2,59
52,
595
3,58
23,
794
19,1
3320
,049
14,3
0515
,856
Indi
ana
7,40
97,
743
2,27
02,
270
5,12
85,
361
17,8
3620
,940
22,2
3129
,935
Iow
a7,
078
7,64
72,
674
2,67
92,
471
2,40
521
,626
23,1
8321
,130
28,4
69
Kans
as6,
944
7,24
92,
671
2,66
95,
004
4,77
115
,782
18,7
1916
,956
23,7
50
Kent
ucky
7,27
97,
848
3,42
23,
416
6,83
56,
749
12,2
3614
,527
11,9
5319
,362
Loui
sian
a4
44
44
44
44
4
Mai
ne2
8,85
69,
754
3,53
83,
542
5,39
25,
422
19,4
9522
,395
12,5
5624
,275
Mar
ylan
d7,
937
8,19
53,
278
3,26
65,
094
4,85
122
,912
26,1
2820
,151
29,6
13
Mas
sach
uset
ts3
9,54
110
,161
4,05
44,
162
4,24
44,
641
16,1
7016
,221
20,2
0323
,818
Mic
higa
n6,
394
6,72
92,
301
2,31
54,
615
5,37
515
,482
16,2
5217
,646
20,4
79
Min
neso
ta9,
843
10,1
813,
688
3,69
86,
304
6,61
328
,119
29,3
9424
,389
27,4
14
Mis
siss
ippi
6,90
47,
624
2,79
22,
791
5,30
55,
864
12,9
0215
,904
13,2
3822
,685
EXH
IBIT
22.
Med
icai
d Be
nefit
Spe
ndin
g Pe
r Ful
l-Yea
r Equ
ival
ent (
FYE)
Enr
olle
e by
Sta
te a
nd E
ligib
ility
Gro
up, F
Y 20
13
Sect
ion
3

MACStats: Medicaid and CHIP Data Book 57
Section 3: Program Enrollment and Spending—Medicaid Benefits
MAC
Stat
sSe
ctio
n 3
EXH
IBIT
22.
(co
ntin
ued)
Stat
e
Tota
lCh
ildAd
ult
Disa
bled
Aged
All
enro
llees
Full-
bene
fit
enro
llees
1Al
l en
rolle
esFu
ll-be
nefit
en
rolle
es1
All
enro
llees
Full-
bene
fit
enro
llees
1Al
l en
rolle
esFu
ll-be
nefit
en
rolle
es1
All
enro
llees
Full-
bene
fit
enro
llees
1
Mis
sour
i$8
,993
$9,8
44$4
,056
$4,0
57$4
,310
$6,3
03$2
2,18
3$2
3,26
8$1
9,04
6$2
1,32
6
Mon
tana
8,71
29,
309
3,81
13,
811
7,13
98,
031
17,6
3020
,683
21,6
2433
,225
Neb
rask
a8,
415
8,55
32,
688
2,68
86,
443
6,43
421
,633
22,5
9820
,859
23,6
63
Nev
ada
5,47
15,
673
2,70
12,
685
4,35
64,
089
15,9
7920
,184
8,75
314
,971
New
Ham
pshi
re8,
560
9,16
33,
458
3,45
84,
894
4,89
615
,604
19,7
5526
,629
39,0
61
New
Jer
sey
9,39
49,
561
2,76
92,
768
6,31
46,
064
23,7
0424
,726
19,0
1921
,439
New
Mex
ico
5,78
16,
453
4,19
64,
194
5,53
17,
503
15,3
8118
,636
2,82
13,
798
New
Yor
k9,
845
10,2
082,
943
2,96
45,
412
5,46
329
,115
30,4
9523
,594
27,5
36
Nor
th C
arol
ina
6,86
47,
322
2,89
32,
891
6,12
67,
631
15,8
6717
,404
11,8
5315
,128
Nor
th D
akot
a12
,053
12,5
443,
662
3,66
26,
303
6,29
831
,115
34,8
1531
,199
39,3
29
Ohi
o7,
307
8,17
52,
483
2,48
84,
010
4,98
919
,415
23,0
4621
,856
30,0
57
Okl
ahom
a6,
377
6,95
33,
385
3,38
54,
509
6,10
015
,796
17,1
2813
,360
16,0
99
Ore
gon
7,64
98,
340
2,74
72,
793
6,50
57,
039
17,4
2921
,218
17,9
9127
,696
Penn
sylv
ania
9,37
710
,128
3,56
33,
561
3,60
34,
560
16,5
9117
,337
21,9
1126
,665
Rhod
e Is
land
44
44
44
44
44
Sout
h Ca
rolin
a4,
803
5,26
72,
094
2,09
53,
499
5,12
111
,740
12,4
0611
,127
13,0
54
Sout
h Da
kota
7,11
77,
445
2,83
12,
831
6,19
86,
124
18,0
2421
,554
14,1
9120
,838
Tenn
esse
e5,
771
6,18
02,
594
2,59
44,
411
4,41
311
,776
14,6
2013
,078
23,3
18
Texa
s5,
982
6,30
72,
846
2,83
54,
306
5,38
115
,820
18,1
1711
,045
15,8
84
Uta
h7,
356
7,36
53,
573
3,56
66,
227
5,90
321
,796
22,9
0413
,382
15,3
46
Verm
ont
8,42
75
55
55
55
55
Virg
inia
7,60
38,
319
3,02
13,
019
4,97
06,
316
18,7
6222
,254
15,1
1520
,760
Was
hing
ton
6,67
96,
989
2,55
42,
539
6,00
06,
884
17,0
1019
,124
15,6
8819
,816
Wes
t Virg
inia
8,33
28,
957
2,97
22,
972
7,14
37,
140
13,4
2315
,467
18,2
7829
,247
Wis
cons
in6,
775
7,42
32,
041
2,07
83,
214
3,74
218
,821
19,6
2216
,393
18,2
08
Wyo
min
g8,
142
8,48
92,
550
2,56
76,
134
6,54
823
,675
27,4
4226
,898
42,9
21

December 201658
Section 3: Program Enrollment and Spending—Medicaid Benefits
MAC
Stat
sSe
ctio
n 3
Not
es: F
Y is
fisc
al y
ear.
Full
year
equ
ival
ent (
FYE)
may
als
o be
refe
rred
to a
s av
erag
e m
onth
ly e
nrol
lmen
t. In
clud
es fe
dera
l and
sta
te fu
nds.
Exc
lude
s sp
endi
ng fo
r ad
min
istr
atio
n, th
e te
rrito
ries,
and
Med
icai
d-ex
pans
ion
CHIP
enr
olle
es. C
hild
ren
and
adul
ts u
nder
age
65
who
qua
lify
for M
edic
aid
on th
e ba
sis
of a
dis
abili
ty a
re in
clud
ed in
the
disa
bled
cat
egor
y. A
bout
746
,000
enr
olle
es a
ge 6
5 an
d ol
der a
re id
entif
ied
in th
e da
ta a
s di
sabl
ed; g
iven
that
dis
abili
ty is
not
an
elig
ibili
ty p
athw
ay fo
r ind
ivid
uals
age
65
and
olde
r, M
ACPA
C re
code
s th
ese
enro
llees
as
aged
. Ben
efit
spen
ding
from
Med
icai
d St
atis
tical
Info
rmat
ion
Syst
em (M
SIS)
dat
a ha
s be
en a
djus
ted
to re
flect
CM
S-64
tota
ls. D
ue
to c
hang
es in
bot
h m
etho
ds a
nd d
ata,
figu
res
show
n he
re a
re n
ot d
irect
ly c
ompa
rabl
e to
ear
lier y
ears
. With
rega
rd to
met
hods
, spe
ndin
g to
tals
now
exc
lude
dis
prop
ortio
nate
sh
are
hosp
ital (
DSH
) and
cer
tain
ince
ntiv
e an
d un
com
pens
ated
car
e po
ol p
aym
ents
mad
e un
der S
ectio
n 11
15 w
aive
r exp
endi
ture
aut
horit
y, w
hich
wer
e pr
evio
usly
incl
uded
pr
ior t
o th
e De
cem
ber 2
015
data
boo
k. S
ee h
ttps
://w
ww
.mac
pac.
gov/
mac
stat
s/da
ta-s
ourc
es-a
nd-m
etho
ds/ f
or a
dditi
onal
info
rmat
ion.
1 In
this
tabl
e, fu
ll-be
nefit
enr
olle
es e
xclu
des
thos
e re
port
ed b
y st
ates
in M
SIS
as re
ceiv
ing
cove
rage
of o
nly
fam
ily p
lann
ing
serv
ices
, ass
ista
nce
with
Med
icar
e pr
emiu
ms
and
cost
sha
ring,
or e
mer
genc
y se
rvic
es.
2 St
ate
had
a ch
ange
in F
YE e
nrol
lees
of 1
0 pe
rcen
t or m
ore
over
the
prio
r yea
r. Th
ese
data
may
refle
ct d
ata
anom
alie
s in
the
subm
issi
on o
f MSI
S da
ta a
nd m
ay b
e up
date
d in
fu
ture
MSI
S su
bmis
sion
s. M
SIS
data
ano
mal
ies
have
bee
n co
mpi
led
and
repo
rted
by
Mat
hem
atic
a Po
licy
Rese
arch
; the
dat
a an
omal
ies
repo
rt m
ay b
e fo
und
at: h
ttp:
//w
ww
.cm
s.go
v/Re
sear
ch-S
tatis
tics-
Data
-and
-Sys
tem
s/Co
mpu
ter-D
ata-
and-
Syst
ems/
Med
icai
dDat
aSou
rces
Gen
Info
/dow
nloa
ds/a
nom
alie
s1.p
df.
3 W
hen
com
pare
d to
the
Dece
mbe
r 201
5 ed
ition
of t
his
tabl
e, D
istr
ict o
f Col
umbi
a an
d M
assa
chus
etts
had
a c
hang
e in
tota
l FYE
enr
olle
es o
f 10
perc
ent o
r mor
e ov
er th
e pr
ior
year
. How
ever
, bot
h st
ates
hav
e si
nce
upda
ted
thei
r 201
2 en
rollm
ent t
otal
and
no
long
er h
as a
cha
nge
of 1
0 pe
rcen
t or m
ore.
4 St
ates
wer
e ex
clud
ed d
ue to
dat
a re
liabi
lity
conc
erns
rega
rdin
g co
mpl
eten
ess
of m
onth
ly c
laim
s an
d en
rollm
ent d
ata.
5 Du
e to
larg
e di
ffer
ence
s in
the
way
spe
ndin
g is
repo
rted
by
Verm
ont i
n CM
S-64
and
MSI
S da
ta, M
ACPA
C’s
adju
stm
ent m
etho
dolo
gy is
onl
y ap
plie
d to
tota
l Med
icai
d sp
endi
ng.
Sour
ce: M
ACPA
C, 2
016,
ana
lysi
s of
MSI
S da
ta a
s of
Dec
embe
r 201
5 an
d CM
S-64
Fin
anci
al M
anag
emen
t Rep
ort n
et e
xpen
ditu
re d
ata
as o
f Jun
e 20
16.
EXH
IBIT
22.
(co
ntin
ued)

MACStats: Medicaid and CHIP Data Book 59
Section 3: Program Enrollment and Spending—Medicaid Benefits
MAC
Stat
s
Stat
e1
Inpa
tient
and
out
patie
nt h
ospi
tals
2
Tota
l Med
icai
d pa
ymen
tsDS
H p
aym
ents
Non
-DSH
sup
plem
enta
l pa
ymen
tsSe
ctio
n 11
15 w
aive
r au
thor
ity p
aym
ents
Supp
lem
enta
l pa
ymen
ts a
s %
of t
otal
Tota
l$9
7,27
8.9
$15,
663.
2$2
0,24
9.9
$11,
931.
649
.2%
Alab
ama
1,99
1.8
482.
957
9.4
–53
.3Al
aska
317.
09.
0–
–2.
8Ar
izon
a31,
142.
614
2.6
156.
315
5.7
39.8
Arka
nsas
1,02
1.0
64.0
318.
5–
37.5
Calif
orni
a3, 4
20,7
68.1
2,39
0.1
7,65
0.4
2,29
9.7
59.4
Colo
rado
2,41
8.6
196.
51,
011.
6–
50.0
Conn
ectic
ut1,
865.
223
.586
.4–
5.9
Dela
war
e66
.18.
4–
–12
.7Di
stric
t of C
olum
bia
332.
030
.616
.1–
14.1
Flor
ida3
3,61
7.1
239.
779
.91,
872.
660
.6G
eorg
ia2,
227.
943
5.0
233.
1–
30.0
Haw
aii3
114.
0–
0.8
94.1
83.3
Idah
o39
3.7
24.2
9.1
–8.
4Ill
inoi
s5,
154.
835
9.5
1,59
6.5
–37
.9In
dian
a1,
220.
923
2.1
18.4
–20
.5Io
wa
949.
147
.130
.9–
8.2
Kans
as3
148.
152
.92.
272
.886
.4Ke
ntuc
ky38
8.1
188.
919
.2–
53.6
Loui
sian
a1,
891.
41,
203.
524
0.8
–76
.4M
aine
563.
2–
12.5
–2.
2M
aryl
and
1,10
7.4
52.0
36.6
–8.
0M
assa
chus
etts
3, 5
2,02
4.8
–30
9.7
45.0
17.5
Mic
higa
n1,
751.
833
6.5
753.
8–
62.2
Min
neso
ta5
649.
532
.012
.071
.617
.8M
issi
ssip
pi1,
684.
022
4.5
533.
1–
45.0
Mis
sour
i3,
094.
647
3.6
132.
9–
19.6
Mon
tana
318.
818
.647
.9–
20.9
Neb
rask
a14
1.6
37.0
––
26.1
Nev
ada
573.
478
.015
6.8
–40
.9N
ew H
amps
hire
137.
868
.36.
8–
54.5
New
Jer
sey4,
51,
818.
173
1.8
–27
3.4
55.3
New
Mex
ico
368.
522
.710
5.4
–34
.8N
ew Y
ork4,
510
,680
.82,
820.
31,
082.
982
7.3
44.3
Nor
th C
arol
ina
4,66
3.3
371.
02,
375.
1–
58.9
Nor
th D
akot
a78
.80.
40.
1–
0.6
Ohi
o2,
300.
559
3.5
597.
5–
51.8
Sect
ion
3
EXH
IBIT
23.
Med
icai
d Su
pple
men
tal P
aym
ents
to H
ospi
tal P
rovi
ders
by
Stat
e, F
Y 20
15 (m
illio
ns)

December 201660
Section 3: Program Enrollment and Spending—Medicaid Benefits
MAC
Stat
sSe
ctio
n 3
Stat
e1
Inpa
tient
and
out
patie
nt h
ospi
tals
2
Tota
l Med
icai
d pa
ymen
tsDS
H p
aym
ents
Non
-DSH
sup
plem
enta
l pa
ymen
tsSe
ctio
n 11
15 w
aive
r au
thor
ity p
aym
ents
Supp
lem
enta
l pa
ymen
ts a
s %
of t
otal
Okl
ahom
a$1
,751
.4$4
0.2
$848
.4–
50.7
%O
rego
n48
1.1
40.8
153.
3–
40.3
Penn
sylv
ania
1,43
1.2
519.
233
9.5
–60
.0Rh
ode
Isla
nd35
6.0
140.
511
.4–
42.7
Sout
h Ca
rolin
a1,
078.
643
5.5
179.
4–
57.0
Sout
h Da
kota
205.
80.
82.
8–
1.8
Tenn
esse
e3, 5
841.
481
.7–
$737
.797
.4Te
xas3,
49,
374.
72,
026.
531
.15,
481.
680
.4U
tah
288.
324
.554
.7–
27.5
Verm
ont
45.1
37.4
––
83.1
Virg
inia
853.
29.
117
2.7
–21
.3W
ashi
ngto
n95
4.1
230.
4–
–24
.1W
est V
irgin
ia73
2.0
53.7
167.
1–
30.2
Wis
cons
in77
5.1
31.4
57.6
–11
.5W
yom
ing
126.
50.
518
.9–
15.3
Not
es: F
Y is
fisc
al y
ear.
DSH
is d
ispr
opor
tiona
te s
hare
hos
pita
l. In
clud
es fe
dera
l and
sta
te fu
nds.
Exc
lude
s pa
ymen
ts m
ade
unde
r man
aged
car
e ar
rang
emen
ts. A
ll am
ount
s in
this
tabl
e ar
e as
repo
rted
by s
tate
s in
CM
S-64
dat
a du
ring
the
fisca
l yea
r to
obta
in fe
dera
l mat
chin
g fu
nds;
am
ount
s in
clud
e ex
pend
iture
s fo
r the
cur
rent
fisc
al y
ear a
nd a
djus
tmen
ts to
exp
endi
ture
s fo
r prio
r fis
cal y
ears
that
may
be
posi
tive
or n
egat
ive.
Am
ount
s re
porte
d by
sta
tes
for a
ny g
iven
cat
egor
y (e
.g., i
npat
ient
hos
pita
l) so
met
imes
sho
w s
ubst
antia
l ann
ual f
luct
uatio
ns. T
he
Cent
ers
for M
edic
are
& M
edic
aid
Serv
ices
onl
y be
gan
to re
quire
sep
arat
e re
porti
ng o
f non
-DSH
sup
plem
enta
l pay
men
ts in
FY
2010
and
is c
ontin
uing
to w
ork
with
sta
tes
to s
tand
ardi
ze th
is
repo
rting
. As
a re
sult,
the
info
rmat
ion
pres
ente
d m
ay n
ot re
flect
a c
onsi
sten
t cla
ssifi
catio
n of
sup
plem
enta
l pay
men
t spe
ndin
g ac
ross
sta
tes.
Rep
ortin
g is
exp
ecte
d to
impr
ove
over
tim
e.
– D
ash
indi
cate
s ze
ro; $
0.0
indi
cate
s an
am
ount
less
than
$0.
05 m
illio
n th
at ro
unds
to z
ero.
1 N
ot a
ll st
ates
had
cer
tifie
d th
eir C
MS-
64 F
inan
cial
Man
agem
ent R
epor
t (FM
R) s
ubm
issi
ons
as o
f May
24,
201
6. C
alifo
rnia
’s fi
rst,
seco
nd, t
hird
, and
four
th q
uart
er
subm
issi
ons
are
not c
ertif
ied;
Col
orad
o an
d N
orth
Dak
ota’
s se
cond
, thi
rd, a
nd fo
urth
qua
rter
sub
mis
sion
s ar
e no
t cer
tifie
d; N
ew J
erse
y's th
ird a
nd fo
urth
qua
rter
sub
mis
sion
s ar
e no
t cer
tifie
d. F
igur
es p
rese
nted
in th
is e
xhib
it m
ay c
hang
e if
stat
es re
vise
thei
r exp
endi
ture
dat
a af
ter t
his
date
.2
Incl
udes
inpa
tient
, out
patie
nt, c
ritic
al a
cces
s ho
spita
l, an
d em
erge
ncy
hosp
ital c
ateg
orie
s in
the
CMS-
64 d
ata.
The
CM
S-64
inst
ruct
ions
to s
tate
s no
te th
at D
SH p
aym
ents
ar
e th
ose
mad
e in
acc
orda
nce
with
Sec
tion
1923
of t
he S
ocia
l Sec
urity
Act
. Non
-DSH
sup
plem
enta
l pay
men
ts a
re d
escr
ibed
in th
e CM
S-64
inst
ruct
ions
to s
tate
s as
thos
e m
ade
in a
dditi
on to
the
stan
dard
fee
sche
dule
or o
ther
sta
ndar
d pa
ymen
t for
a g
iven
ser
vice
. The
y in
clud
e pa
ymen
ts m
ade
unde
r ins
titut
iona
l upp
er p
aym
ent l
imit
rule
s an
d pa
ymen
ts to
hos
pita
ls fo
r gra
duat
e m
edic
al e
duca
tion.
Sec
tion
1115
wai
ver e
xpen
ditu
re a
utho
rity
paym
ents
incl
ude
thos
e m
ade
unde
r unc
ompe
nsat
ed c
are
pool
s, d
eliv
ery
syst
em re
form
ince
ntiv
e pa
ymen
ts (D
SRIP
), an
d ot
her n
on-D
SH s
uppl
emen
tal p
aym
ents
that
hav
e be
en a
utho
rized
und
er S
ectio
n 11
15 w
aive
rs. B
ecau
se th
e m
ajor
ity o
f DSR
IP
paym
ents
go
to h
ospi
tals
, DSR
IP p
aym
ents
that
wer
e re
port
ed a
s ot
her c
are
serv
ices
on
the
CMS-
64 w
ere
incl
uded
in th
e Se
ctio
n 11
15 w
aive
r exp
endi
ture
cat
egor
y an
d th
e to
tal h
ospi
tal p
aym
ent c
ateg
ory.
3 St
ate
mad
e su
pple
men
tal p
aym
ents
thro
ugh
an u
ncom
pens
ated
car
e po
ol u
nder
Sec
tion
1115
wai
ver e
xpen
ditu
re a
utho
rity.
4
Stat
e m
ade
supp
lem
enta
l pay
men
ts th
roug
h a
DSRI
P un
der S
ectio
n 11
15 w
aive
r exp
endi
ture
aut
horit
y.5
Stat
e m
ade
othe
r sup
plem
enta
l pay
men
ts, i
nclu
ding
gra
duat
e m
edic
al e
duca
tion,
und
er S
ectio
n 11
15 w
aive
r exp
endi
ture
aut
horit
y.
Sour
ce: M
ACPA
C, 2
016,
ana
lysi
s of
CM
S-64
FM
R ne
t exp
endi
ture
dat
a as
of M
ay 2
4, 2
016
and
CMS-
64 S
ched
ule
C w
aive
r rep
ort d
ata
as o
f Aug
ust 2
, 201
6.
EXH
IBIT
23.
(co
ntin
ued)

MACStats: Medicaid and CHIP Data Book 61
Section 3: Program Enrollment and Spending—Medicaid Benefits
MAC
Stat
sSe
ctio
n 3
Stat
e1
Men
tal h
ealth
faci
litie
s2N
ursi
ng fa
cilit
ies
and
ICFs
/ID3
Phys
icia
ns a
nd o
ther
pra
ctiti
oner
s4
Tota
l M
edic
aid
paym
ents
Supp
lem
enta
l pa
ymen
ts
Supp
lem
enta
l pa
ymen
ts a
s
% o
f tot
al
Tota
l M
edic
aid
paym
ents
Supp
lem
enta
l pa
ymen
ts
Supp
lem
enta
l pa
ymen
ts a
s
% o
f tot
al
Tota
l M
edic
aid
paym
ents
Supp
lem
enta
l pa
ymen
ts
Supp
lem
enta
l pa
ymen
ts a
s
% o
f tot
alTo
tal
$5,1
66.2
$3,0
15.5
58.4
%$5
4,38
2.0
$2,8
02.5
5.2%
$13,
072.
8$9
88.8
7.6%
Alab
ama
74.6
––
946.
5–
–44
8.4
––
Alas
ka26
.510
.941
.217
1.7
––
146.
4–
–Ar
izon
a30
.428
.593
.744
.45.
612
.748
.8–
–Ar
kans
as11
7.4
0.8
0.7
839.
9–
–35
5.7
38.0
10.7
Calif
orni
a36
.80.
00.
14,
034.
927
5.6
6.8
1,06
0.3
108.
310
.2Co
lora
do7.
2–
–73
3.9
97.8
13.3
673.
14.
90.
7Co
nnec
ticut
195.
810
5.6
53.9
1,54
3.5
––
586.
2–
–De
law
are
6.1
6.0
99.0
29.6
––
15.4
––
Dist
rict o
f Col
umbi
a29
.66.
321
.332
4.3
––
41.5
––
Flor
ida5
151.
211
9.1
78.8
818.
5–
–56
1.6
204.
536
.4G
eorg
ia30
.6–
–1,
340.
097
.37.
340
2.1
35.7
8.9
Haw
aii
––
–9.
2–
–2.
4–
–Id
aho
1.7
––
315.
610
1.7
32.2
140.
5–
–Ill
inoi
s18
1.7
82.7
45.5
2,16
3.0
––
691.
5–
–In
dian
a49
.1–
–2,
263.
364
1.0
28.3
207.
625
.712
.4Io
wa5,
613
.6–
–91
6.2
0.0
0.0
249.
90.
00.
0Ka
nsas
26.1
26.0
99.8
54.7
––
14.5
10.5
72.1
Kent
ucky
44.4
37.7
84.8
1,11
4.8
0.6
0.0
35.3
3.7
10.5
Loui
sian
a12
9.6
125.
696
.91,
345.
7–
–18
2.4
20.5
11.3
Mai
ne93
.242
.145
.135
6.7
––
121.
42.
62.
1M
aryl
and
158.
756
.035
.31,
194.
05.
10.
413
8.4
––
Mas
sach
uset
ts7
129.
196
.474
.71,
531.
7–
–42
9.0
28.0
6.5
Mic
higa
n29
.80.
10.
31,
786.
534
2.4
19.2
469.
213
4.3
28.6
Min
neso
ta13
0.5
25.1
19.2
900.
9–
–36
9.7
11.0
3.0
Mis
siss
ippi
74.4
––
1,02
4.9
19.5
1.9
173.
5–
–M
isso
uri
230.
320
7.2
90.0
1,16
4.8
––
38.9
––
Mon
tana
23.4
––
174.
615
.58.
980
.5–
–N
ebra
ska
2.9
1.4
49.3
412.
7–
–23
.0–
–N
evad
a56
.2–
–23
2.2
84.6
36.4
168.
33.
72.
2N
ew H
amps
hire
48.1
40.4
83.9
350.
7–
–19
.4–
–
EXH
IBIT
24.
Med
icai
d Su
pple
men
tal P
aym
ents
to N
on-H
ospi
tal P
rovi
ders
by
Stat
e, F
Y 20
15 (m
illio
ns)

December 201662
Section 3: Program Enrollment and Spending—Medicaid Benefits
MAC
Stat
sSe
ctio
n 3
Stat
e1
Men
tal h
ealth
faci
litie
s2N
ursi
ng fa
cilit
ies
and
ICFs
/ID3
Phys
icia
ns a
nd o
ther
pra
ctiti
oner
s4
Tota
l M
edic
aid
paym
ents
Supp
lem
enta
l pa
ymen
ts
Supp
lem
enta
l pa
ymen
ts a
s
% o
f tot
al
Tota
l M
edic
aid
paym
ents
Supp
lem
enta
l pa
ymen
ts
Supp
lem
enta
l pa
ymen
ts a
s
% o
f tot
al
Tota
l M
edic
aid
paym
ents
Supp
lem
enta
l pa
ymen
ts
Supp
lem
enta
l pa
ymen
ts a
s
% o
f tot
alN
ew J
erse
y$4
63.2
$357
.477
.2%
$2,1
70.4
––
$57.
3–
–N
ew M
exic
o1.
7–
–27
.1–
–75
.2$6
.68.
8%N
ew Y
ork
941.
461
0.8
64.9
6,84
1.8
$71.
71.
0%78
3.1
30.6
3.9
Nor
th C
arol
ina
160.
616
0.3
99.8
1,18
5.6
––
1,01
7.6
43.9
4.3
Nor
th D
akot
a7.
90.
56.
316
1.0
0.8
0.5
31.0
––
Ohi
o93
.493
.410
0.0
2,46
2.0
––
302.
3–
–O
klah
oma
94.6
3.3
3.5
674.
6–
–51
1.4
––
Ore
gon
29.0
19.9
68.7
385.
6–
–56
.4–
–Pe
nnsy
lvan
ia31
0.3
231.
874
.74,
486.
871
4.1
15.9
86.8
––
Rhod
e Is
land
4.5
––
176.
8–
–11
.1–
–So
uth
Caro
lina
76.5
52.3
68.4
719.
119
.82.
814
8.4
35.9
24.2
Sout
h Da
kota
3.6
0.8
21.1
168.
32.
71.
664
.2–
–Te
nnes
see
51.0
––
221.
0–
–37
.0–
–Te
xas5
321.
730
3.5
94.3
2,67
1.6
200.
97.
51,
142.
498
.98.
7U
tah
15.8
0.9
5.9
258.
622
.28.
685
.219
.823
.3Ve
rmon
t0.
0–
–11
9.6
––
2.1
––
Virg
inia
164.
211
.67.
01,
077.
011
.11.
019
1.7
32.5
16.9
Was
hing
ton
162.
613
2.2
81.3
767.
5–
–17
1.5
54.4
31.7
Wes
t Virg
inia
105.
818
.917
.867
4.2
––
258.
534
.713
.4W
isco
nsin
16.0
––
870.
841
.94.
886
.2–
–W
yom
ing
13.1
––
123.
330
.624
.858
.4–
–
Not
es: F
Y is
fisc
al y
ear.
ICF/
ID is
inte
rmed
iate
car
e fa
cilit
y fo
r per
sons
with
inte
llect
ual d
isab
ilitie
s. In
clud
es fe
dera
l and
sta
te fu
nds.
Exc
lude
s pa
ymen
ts m
ade
unde
r man
aged
ca
re a
rran
gem
ents
. All
amou
nts
in th
is ta
ble
are
as re
port
ed b
y st
ates
in C
MS-
64 d
ata
durin
g th
e fis
cal y
ear t
o ob
tain
fede
ral m
atch
ing
fund
s; a
mou
nts
incl
ude
expe
nditu
res
for t
he c
urre
nt fi
scal
yea
r and
adj
ustm
ents
to e
xpen
ditu
res
for p
rior f
isca
l yea
rs th
at m
ay b
e po
sitiv
e or
neg
ativ
e. A
mou
nts
repo
rted
by
stat
es fo
r any
giv
en c
ateg
ory
(e.g
., nu
rsin
g fa
cilit
y) s
omet
imes
sho
w s
ubst
antia
l ann
ual f
luct
uatio
ns.
– D
ash
indi
cate
s ze
ro; $
0.0
indi
cate
s an
am
ount
less
than
$0.
05 m
illio
n th
at ro
unds
to z
ero.
1 N
ot a
ll st
ates
had
cer
tifie
d th
eir C
MS-
64 F
inan
cial
Man
agem
ent R
epor
t (FM
R) s
ubm
issi
ons
as o
f May
24,
201
6. C
alifo
rnia
’s fi
rst,
seco
nd, t
hird
, and
four
th q
uart
er
subm
issi
ons
are
not c
ertif
ied;
Col
orad
o an
d N
orth
Dak
ota’
s se
cond
, thi
rd, a
nd fo
urth
qua
rter
sub
mis
sion
s ar
e no
t cer
tifie
d; N
ew J
erse
y's th
ird a
nd fo
urth
qua
rter
sub
mis
sion
s ar
e no
t cer
tifie
d. F
igur
es p
rese
nted
in th
is e
xhib
it m
ay c
hang
e if
stat
es re
vise
thei
r exp
endi
ture
dat
a af
ter t
his
date
.
EXH
IBIT
24.
(co
ntin
ued)

MACStats: Medicaid and CHIP Data Book 63
Section 3: Program Enrollment and Spending—Medicaid Benefits
MAC
Stat
sSe
ctio
n 3
2 In
clud
es in
patie
nt p
sych
iatr
ic s
ervi
ces
for i
ndiv
idua
ls u
nder
age
21
and
inpa
tient
hos
pita
l or n
ursi
ng fa
cilit
y se
rvic
es fo
r ind
ivid
uals
age
65
and
olde
r in
an in
stitu
tion
for
men
tal d
isea
ses.
Sup
plem
enta
l pay
men
ts in
clud
e di
spro
port
iona
te s
hare
hos
pita
l (DS
H) p
aym
ents
mad
e in
acc
orda
nce
with
Sec
tion
1923
of t
he S
ocia
l Sec
urity
Act
as
wel
l as
unco
mpe
nsat
ed c
are
pool
and
oth
er n
on-D
SH s
uppl
emen
tal p
aym
ents
mad
e un
der S
ectio
n 11
15 w
aive
r exp
endi
ture
aut
horit
y. S
tate
s ar
e no
t ins
truc
ted
to b
reak
out
non
-DSH
su
pple
men
tal p
aym
ents
for m
enta
l hea
lth fa
cilit
ies.
3 In
clud
es n
ursi
ng fa
cilit
ies
and
ICF/
IDs.
Sup
plem
enta
l pay
men
ts in
clud
e th
ose
paym
ents
that
are
mad
e in
add
ition
to th
e st
anda
rd fe
e sc
hedu
le o
r oth
er s
tand
ard
paym
ents
fo
r a g
iven
ser
vice
, inc
ludi
ng p
aym
ents
mad
e un
der i
nstit
utio
nal u
pper
pay
men
t lim
it ru
les
and
unco
mpe
nsat
ed c
are
pool
s m
ade
unde
r Sec
tion
1115
wai
ver e
xpen
ditu
re
auth
ority
. 4
Incl
udes
the
phys
icia
n an
d ot
her p
ract
ition
er c
ateg
orie
s in
CM
S-64
dat
a; e
xclu
des
addi
tiona
l cat
egor
ies
(e.g
., de
ntal
, nur
se-m
idw
ife, n
urse
pra
ctiti
oner
) for
whi
ch s
tate
s ar
e no
t ins
truc
ted
to b
reak
out
sup
plem
enta
l pay
men
ts. S
uppl
emen
tal p
aym
ents
incl
ude
thos
e pa
ymen
ts th
at a
re m
ade
in a
dditi
on to
the
stan
dard
fee
sche
dule
pay
men
t as
wel
l as
unc
ompe
nsat
ed c
are
pool
pay
men
ts m
ade
unde
r Sec
tion
1115
wai
ver e
xpen
ditu
re a
utho
rity.
Unl
ike
for i
nstit
utio
nal p
rovi
ders
, the
re is
not
a re
gula
tory
upp
er p
aym
ent l
imit
for p
hysi
cian
s an
d ot
her p
ract
ition
ers.
5 St
ate
mad
e pa
ymen
ts to
phy
sici
ans
and
othe
r pra
ctiti
oner
s th
roug
h an
unc
ompe
nsat
ed c
are
pool
und
er S
ectio
n 11
15 w
aive
r exp
endi
ture
aut
horit
y.6
Stat
e m
ade
paym
ents
to n
ursi
ng fa
cilit
ies
thro
ugh
an u
ncom
pens
ated
car
e po
ol u
nder
Sec
tion
1115
wai
ver e
xpen
ditu
re a
utho
rity.
7 St
ate
mad
e no
n-DS
H p
aym
ents
to m
enta
l hea
lth fa
cilit
ies
thro
ugh
an u
ncom
pens
ated
car
e po
ol o
r mad
e ot
her n
on-D
SH s
uppl
emen
tal p
aym
ents
und
er S
ectio
n 11
15 w
aive
r ex
pend
iture
aut
horit
y.
Sour
ce: M
ACPA
C, 2
016,
ana
lysi
s of
CM
S-64
FM
R ne
t exp
endi
ture
dat
a as
of M
ay 2
4, 2
016
and
CMS-
64 S
ched
ule
C w
aive
r rep
ort d
ata
as o
f Aug
ust 2
, 201
6.
EXH
IBIT
24.
(co
ntin
ued)

December 201664
Section 3: Program Enrollment and Spending—Medicaid Benefits
MAC
Stat
sSe
ctio
n 3
Stat
eTo
tal
Fee
for s
ervi
ceM
anag
ed c
are
Tota
lBr
and1
Gen
eric
2U
nkno
wn3
Tota
lBr
and1
Gen
eric
2U
nkno
wn3
Tota
lBr
and1
Gen
eric
2U
nkno
wn3
Tota
l4$5
3,03
6.3
76.9
%23
.1%
0.1%
$23,
961.
780
.2%
19.8
%0.
1%$2
9,07
4.6
74.1
%25
.8%
0.1%
Alab
ama
605.
775
.324
.60.
160
5.7
75.3
24.6
0.1
––
––
Alas
ka67
.466
.133
.50.
367
.466
.133
.50.
3–
––
–
Ariz
ona
909.
068
.930
.90.
29.
986
.912
.50.
689
9.1
68.7
31.1
0.2
Arka
nsas
358.
871
.128
.80.
135
8.8
71.1
28.8
0.1
––
––
Calif
orni
a6,
404.
178
.621
.30.
04,
056.
886
.014
.00.
02,
347.
365
.934
.00.
0
Colo
rado
674.
872
.926
.80.
267
4.8
72.9
26.8
0.2
––
––
Conn
ectic
ut1,
116.
682
.317
.70.
01,
116.
682
.317
.70.
0–
––
–
Dela
war
e20
2.9
81.7
18.3
0.0
49.5
79.9
20.1
0.0
153.
482
.317
.70.
0
Dist
rict o
f Col
umbi
a13
0.6
77.0
22.9
0.0
72.1
84.7
15.3
0.0
58.5
67.6
32.4
0.0
Flor
ida
2,61
5.5
80.0
19.9
0.0
563.
584
.215
.70.
22,
051.
978
.921
.10.
0
Geo
rgia
1,05
4.7
75.0
25.0
0.0
651.
382
.018
.0–
403.
563
.736
.30.
0
Haw
aii5
881.
860
.039
.90.
10.
274
.625
.4–
881.
660
.039
.90.
1
Idah
o17
1.1
78.2
21.8
0.0
171.
178
.221
.80.
0–
––
–
Illin
ois
1,18
8.3
73.4
26.6
0.0
671.
072
.627
.40.
051
7.4
74.6
25.4
0.0
Indi
ana
1,09
7.5
77.6
22.3
0.1
829.
378
.621
.30.
226
8.2
74.4
25.6
0.1
Iow
a43
2.6
76.5
23.5
0.0
431.
676
.423
.60.
01.
096
.33.
7–
Kans
as28
9.6
75.4
24.6
0.0
0.4
80.1
19.9
0.0
289.
275
.424
.60.
0
Kent
ucky
1,04
2.0
68.5
31.4
0.1
63.8
76.0
23.6
0.4
978.
268
.031
.90.
0
Loui
sian
a70
3.1
70.3
29.7
0.0
226.
972
.727
.30.
047
6.2
69.1
30.9
0.0
Mai
ne22
7.5
82.1
17.9
0.0
227.
582
.117
.90.
0–
––
–
Mar
ylan
d99
3.1
83.6
16.4
0.0
502.
587
.712
.30.
049
0.6
79.4
20.6
0.0
Mas
sach
uset
ts1,
113.
675
.424
.50.
152
4.9
74.8
25.0
0.1
588.
775
.923
.90.
1
Mic
higa
n1,
552.
274
.725
.20.
089
4.8
78.8
21.2
0.0
657.
469
.230
.70.
1
Min
neso
ta86
4.5
72.2
27.7
0.0
224.
573
.226
.80.
064
0.0
71.9
28.1
0.0
Mis
siss
ippi
507.
669
.530
.50.
020
3.9
71.7
28.3
0.0
303.
668
.131
.90.
0
Mis
sour
i1,
199.
072
.327
.70.
11,
199.
072
.327
.70.
1–
––
–
Mon
tana
97.8
80.2
19.8
0.0
97.8
80.2
19.8
0.0
––
––
Neb
rask
a16
8.5
74.9
25.1
0.0
162.
674
.525
.50.
05.
985
.714
.20.
0
EXH
IBIT
25.
Med
icai
d G
ross
Spe
ndin
g fo
r Dru
gs b
y De
liver
y Sy
stem
and
Bra
nd o
r Gen
eric
Sta
tus,
FY
2015
(mill
ions
)

MACStats: Medicaid and CHIP Data Book 65
Section 3: Program Enrollment and Spending—Medicaid Benefits
MAC
Stat
sSe
ctio
n 3
Stat
eTo
tal
Fee
for s
ervi
ceM
anag
ed c
are
Tota
lBr
and1
Gen
eric
2U
nkno
wn3
Tota
lBr
and1
Gen
eric
2U
nkno
wn3
Tota
lBr
and1
Gen
eric
2U
nkno
wn3
Nev
ada
$333
.677
.3%
22.7
%0.
1%$2
12.3
81.6
%18
.3%
0.0%
$121
.369
.6%
30.2
%0.
1%
New
Ham
pshi
re10
5.8
75.5
24.5
0.0
7.5
78.9
21.0
0.2
98.3
75.3
24.7
0.0
New
Jer
sey
1,35
2.6
76.3
23.7
0.0
47.6
79.0
21.0
0.0
1,30
5.0
76.2
23.8
0.0
New
Mex
ico
261.
671
.128
.90.
05.
465
.934
.10.
025
6.2
71.2
28.8
0.0
New
Yor
k5,
306.
679
.820
.20.
067
8.9
82.5
17.5
0.0
4,62
7.7
79.4
20.6
0.0
Nor
th C
arol
ina
1,65
6.1
80.8
19.2
0.0
1,65
6.1
80.8
19.2
0.0
––
––
Nor
th D
akot
a53
.473
.826
.10.
131
.270
.229
.80.
022
.278
.820
.90.
3
Ohi
o2,
418.
473
.526
.30.
237
5.5
77.8
21.8
0.4
2,04
2.9
72.7
27.1
0.2
Okl
ahom
a46
5.3
76.1
23.9
0.0
465.
376
.123
.90.
0–
––
–
Ore
gon
589.
574
.425
.60.
015
2.8
70.1
29.9
0.0
436.
775
.924
.10.
0
Penn
sylv
ania
2,12
0.7
76.8
23.1
0.1
67.2
75.8
24.2
0.0
2,05
3.5
76.8
23.1
0.1
Rhod
e Is
land
4.0
92.3
7.7
–4.
092
.37.
7–
––
––
Sout
h Ca
rolin
a47
5.8
72.0
28.0
0.0
92.5
79.2
20.8
0.1
383.
370
.229
.70.
0
Sout
h Da
kota
81.2
68.1
31.9
0.0
81.2
68.1
31.9
0.0
––
––
Tenn
esse
e93
1.3
79.4
20.5
0.1
876.
778
.521
.50.
054
.693
.95.
11.
0
Texa
s3,
155.
179
.920
.10.
067
9.5
83.8
16.2
0.0
2,47
5.7
78.8
21.2
0.0
Uta
h18
0.0
74.5
25.5
–11
2.6
75.9
24.1
–67
.472
.028
.0–
Verm
ont
158.
874
.625
.40.
015
8.8
74.6
25.4
0.0
––
––
Virg
inia
900.
058
.140
.61.
310
0.4
73.4
26.0
0.6
799.
656
.242
.51.
3
Was
hing
ton
794.
476
.323
.60.
112
8.9
78.3
21.6
0.1
665.
575
.924
.00.
0
Wes
t Virg
inia
528.
876
.723
.20.
143
3.4
77.4
22.6
0.1
95.5
73.8
26.2
0.0
Wis
cons
in97
8.3
78.2
21.8
0.0
977.
078
.221
.80.
01.
371
.029
.00.
0
Wyo
min
g34
.278
.521
.40.
134
.278
.521
.40.
1–
––
–
Not
es: F
Y is
fisc
al y
ear.
Amou
nts
incl
ude
fede
ral a
nd s
tate
fund
s. G
ross
spe
ndin
g re
flect
s ex
pend
iture
s pr
ior t
o th
e ap
plic
atio
n of
man
ufac
ture
r reb
ates
. Dru
g ex
pend
iture
s in
th
is e
xhib
it us
e in
form
atio
n fr
om th
e st
ate
drug
util
izat
ion
data
that
sta
tes
subm
it to
the
Cent
ers
for M
edic
are
& M
edic
aid
Serv
ices
(CM
S) fo
r reb
ate
purp
oses
, and
are
diff
eren
t fr
om th
e CM
S-64
Fin
anci
al M
anag
emen
t Rep
ort a
nd M
edic
aid
Stat
istic
al In
form
atio
n Sy
stem
(MSI
S) d
ata
that
ser
ve a
s ou
r usu
al s
ourc
es o
f exp
endi
ture
dat
a. S
pend
ing
show
n in
the
drug
util
izat
ion
data
may
diff
er fr
om th
ese
othe
r sou
rces
due
to d
iffer
ence
s in
tim
ing
and
run-
out o
f dat
a us
ed. I
n ad
ditio
n, th
e dr
ug u
tiliz
atio
n da
ta m
ay in
clud
e ph
ysic
ian-
adm
inis
tere
d dr
ugs
for w
hich
reba
tes
are
avai
labl
e; th
ese
drug
s ar
e ty
pica
lly re
port
ed u
nder
the
phys
icia
n se
rvic
es c
ateg
ory
inst
ead
of th
e ou
tpat
ient
pre
scrip
tion
drug
cat
egor
y in
oth
er d
ata.
The
sta
te d
rug
utili
zatio
n da
ta p
rovi
de b
oth
fee-
for-s
ervi
ce a
nd m
anag
ed c
are
drug
util
izat
ion
and
spen
ding
info
rmat
ion
at th
e na
tiona
l dru
g co
de
(NDC
) lev
el. T
o as
sign
bra
nd a
nd g
ener
ic s
tatu
s, w
e lin
ked
the
quar
terly
sta
te d
rug
utili
zatio
n da
ta to
the
quar
terly
Med
icai
d dr
ug p
rodu
ct d
ata
from
CM
S us
ing
the
NDC
cod
e.
EXH
IBIT
25.
(co
ntin
ued)

December 201666
Section 3: Program Enrollment and Spending—Medicaid Benefits
MAC
Stat
sSe
ctio
n 3
Bran
d an
d ge
neric
sta
tus
was
ass
igne
d us
ing
the
drug
cat
egor
y in
dica
tor f
rom
the
drug
pro
duct
file
. The
sta
te d
rug
utili
zatio
n da
ta a
re a
vaila
ble
at h
ttps
://w
ww
.med
icai
d.go
v/m
edic
aid/
pres
crip
tion-
drug
s/st
ate-
drug
-util
izat
ion-
data
/ind
ex.h
tml a
nd th
e dr
ug p
rodu
ct d
ata
are
avai
labl
e at
htt
ps:/
/ww
w.m
edic
aid.
gov/
med
icai
d/pr
escr
iptio
n-dr
ugs/
med
icai
d-dr
ug-re
bate
-pro
gram
/dat
a/in
dex.
htm
l. Be
ginn
ing
in O
ctob
er 2
016,
CM
S, a
s ob
ligat
ed b
y th
e Pr
ivac
y Ac
t of 1
974
(5 U
.S.C
. § 5
52a)
and
the
Hea
lth In
sura
nce
Port
abili
ty
and
Acco
unta
bilit
y Ac
t priv
acy
rule
(45
CFR
Part
s 16
0 an
d 16
4), h
as s
uppr
esse
d al
l rec
ords
in th
e st
ate
drug
util
izat
ion
data
that
are
less
than
11
coun
ts. T
he d
iffer
ent b
rand
an
d ge
neric
pro
port
ions
und
er fe
e fo
r ser
vice
and
man
aged
car
e m
ay re
flect
diff
eren
ces
in th
e po
pula
tions
and
spe
cific
dru
gs c
over
ed u
nder
eac
h de
liver
y sy
stem
(e.g
., be
havi
oral
hea
lth d
rugs
car
ved
out o
f man
aged
car
e), a
s w
ell a
s di
ffer
ence
s in
how
the
stat
e an
d pa
rtic
ipat
ing
heal
th p
lans
man
aged
the
drug
ben
efit.
– D
ash
indi
cate
s ze
ro; 0
.0%
indi
cate
s an
am
ount
less
than
0.0
5% th
at ro
unds
to z
ero.
1 Fo
r thi
s ex
hibi
t, br
and
drug
s w
ere
defin
ed a
s si
ngle
sou
rce
drug
s an
d in
nova
tor,
mul
tiple
sou
rce
drug
s as
indi
cate
d in
that
qua
rter
’s M
edic
aid
drug
pro
duct
dat
a.2
For t
his
exhi
bit,
gene
ric d
rugs
wer
e de
fined
as
non-
inno
vato
r, m
ultip
le s
ourc
e dr
ugs
as in
dica
ted
in th
at q
uart
er’s
Med
icai
d dr
ug p
rodu
ct fi
le.
3 Fo
r thi
s ex
hibi
t, un
know
n dr
ugs
wer
e th
ose
drug
s w
hose
NDC
did
not
hav
e a
mat
ch in
that
qua
rter
’s M
edic
aid
drug
pro
duct
file
.4
The
natio
nal t
otal
doe
s no
t equ
al th
e su
m o
f the
sta
tes
due
to th
e su
ppre
ssio
n of
reco
rds
(as
desc
ribed
in th
e N
otes
abo
ve).
Reco
rds
for d
rugs
that
wer
e su
ppre
ssed
at t
he
stat
e le
vel w
ere
not n
eces
saril
y su
ppre
ssed
onc
e th
e in
divi
dual
sta
te d
ata
wer
e ro
lled
up in
to th
e na
tiona
l sum
mar
y fil
e. W
hile
we
do n
ot k
now
how
muc
h sp
endi
ng h
as b
een
supp
ress
ed in
the
natio
nal s
umm
ary
file,
com
paris
on o
f the
upd
ated
FY
2014
file
s w
ith d
ata
supp
ress
ion
to la
st y
ear's
MAC
Stat
s in
dica
te th
at a
bout
$37
0 m
illio
n do
llars
(0.9
pe
rcen
t) h
ave
been
sup
pres
sed
in th
e FY
201
4 da
ta.
5 H
awai
i's m
anag
ed c
are
spen
ding
mor
e th
an d
oubl
ed fr
om F
Y 20
14 w
hile
pre
scrip
tion
volu
me
rem
aine
d ab
out t
he s
ame.
Sour
ce: M
ACPA
C, 2
016,
ana
lysi
s of
Med
icai
d dr
ug p
rodu
ct d
ata
and
stat
e dr
ug re
bate
util
izat
ion
data
as
of O
ctob
er 2
016.
EXH
IBIT
25.
(co
ntin
ued)

MACStats: Medicaid and CHIP Data Book 67
Section 3: Program Enrollment and Spending—Medicaid Benefits
MAC
Stat
sSe
ctio
n 3
Stat
eTo
tal
Fee
for s
ervi
ceM
anag
ed c
are
Tota
lBr
and1
Gen
eric
2U
nkno
wn3
Tota
lBr
and1
Gen
eric
2U
nkno
wn3
Tota
lBr
and1
Gen
eric
2U
nkno
wn3
Tota
l467
2,75
618
.1%
81.5
%0.
4%24
4,52
421
.2%
78.4
%0.
4%42
8,23
216
.3%
83.3
%0.
4%Al
abam
a7,
477
22.1
77.8
0.2
7,47
722
.177
.80.
2–
––
–Al
aska
871
20.3
79.5
0.2
871
20.3
79.5
0.2
––
––
Ariz
ona
16,6
9713
.885
.70.
589
17.7
81.4
0.9
16,6
0913
.785
.70.
5Ar
kans
as4,
962
19.8
80.0
0.2
4,96
219
.880
.00.
2–
––
–Ca
lifor
nia
79,4
4517
.082
.70.
326
,532
26.0
73.8
0.2
52,9
1312
.587
.20.
3Co
lora
do7,
641
18.7
81.2
0.2
7,64
118
.781
.20.
2–
––
–Co
nnec
ticut
9,09
925
.374
.60.
29,
099
25.3
74.6
0.2
––
––
Dela
war
e2,
464
21.5
78.3
0.1
642
21.7
78.3
0.0
1,82
221
.578
.40.
2Di
stric
t of C
olum
bia
2,12
017
.182
.90.
082
920
.379
.70.
01,
291
15.0
85.0
0.1
Flor
ida
29,8
9719
.680
.30.
13,
834
26.2
73.5
0.3
26,0
6318
.781
.30.
1G
eorg
ia17
,032
17.5
82.5
0.0
7,66
118
.881
.2–
9,37
216
.483
.60.
0H
awai
i2,
601
14.2
84.0
1.9
54.
096
.0–
2,59
614
.284
.01.
9Id
aho
2,15
020
.779
.20.
12,
150
20.7
79.2
0.1
––
––
Illin
ois
19,7
9216
.783
.30.
010
,541
17.5
82.5
0.0
9,25
115
.784
.30.
0In
dian
a12
,543
20.3
79.5
0.2
8,86
321
.778
.10.
33,
680
17.1
82.8
0.2
Iow
a6,
738
19.7
80.3
0.0
6,68
019
.680
.40.
058
29.8
70.2
–Ka
nsas
3,72
220
.979
.00.
16
18.0
81.4
0.6
3,71
620
.979
.00.
1Ke
ntuc
ky20
,951
14.6
84.9
0.5
1,19
013
.582
.83.
719
,761
14.7
85.0
0.3
Loui
sian
a11
,245
18.9
81.0
0.1
3,04
923
.077
.00.
08,
197
17.4
82.5
0.1
Mai
ne2,
673
24.7
75.2
0.0
2,67
324
.775
.20.
0–
––
–M
aryl
and
13,8
1718
.381
.70.
04,
256
24.6
75.4
0.0
9,56
115
.484
.50.
0M
assa
chus
etts
14,3
8016
.681
.91.
57,
009
15.5
82.2
2.3
7,37
117
.681
.60.
8M
ichi
gan
27,1
0015
.584
.10.
48,
988
20.2
79.5
0.2
18,1
1113
.186
.40.
5M
inne
sota
11,8
0316
.183
.70.
22,
714
18.2
81.7
0.2
9,08
915
.584
.30.
2M
issi
ssip
pi6,
097
20.7
79.3
0.0
2,29
325
.574
.50.
03,
804
17.8
82.2
0.0
Mis
sour
i12
,327
20.9
78.8
0.3
12,3
2720
.978
.80.
3–
––
–M
onta
na1,
138
21.9
78.0
0.1
1,13
821
.978
.00.
1–
––
–N
ebra
ska
2,50
518
.281
.70.
22,
419
17.8
82.1
0.2
8530
.069
.90.
2N
evad
a5,
041
15.3
84.3
0.5
2,39
618
.581
.20.
32,
645
12.4
87.1
0.6
New
Ham
pshi
re1,
652
20.1
79.6
0.3
194
17.2
81.5
1.3
1,45
820
.579
.30.
2N
ew J
erse
y19
,732
16.4
83.6
0.0
734
18.2
81.8
0.0
18,9
9816
.383
.60.
0N
ew M
exic
o5,
147
15.2
84.8
0.0
118
18.0
81.8
0.2
5,02
915
.184
.80.
0N
ew Y
ork
70,7
6016
.783
.30.
010
,117
15.5
84.4
0.1
60,6
4316
.983
.10.
0
EXH
IBIT
26.
Med
icai
d Dr
ug P
resc
riptio
ns b
y De
liver
y Sy
stem
and
Bra
nd o
r Gen
eric
Sta
tus,
FY
2015
(tho
usan
ds)

December 201668
Section 3: Program Enrollment and Spending—Medicaid Benefits
MAC
Stat
sSe
ctio
n 3
Stat
eTo
tal
Fee
for s
ervi
ceM
anag
ed c
are
Tota
lBr
and1
Gen
eric
2U
nkno
wn3
Tota
lBr
and1
Gen
eric
2U
nkno
wn3
Tota
lBr
and1
Gen
eric
2U
nkno
wn3
Nor
th C
arol
ina
17,2
2026
.6%
73.3
%0.
1%17
,220
26.6
%73
.3%
0.1%
––
––
Nor
th D
akot
a72
518
.481
.30.
347
418
.980
.90.
225
117
.4%
81.9
%0.
7%O
hio
38,7
7716
.281
.52.
35,
142
17.4
76.4
6.3
33,6
3516
.182
.21.
7O
klah
oma
6,02
319
.880
.20.
06,
023
19.8
80.2
0.0
––
––
Ore
gon
10,0
2114
.985
.10.
02,
280
12.0
88.0
0.0
7,74
115
.784
.30.
0Pe
nnsy
lvan
ia27
,994
17.3
82.3
0.4
1,82
812
.487
.40.
226
,167
17.6
81.9
0.4
Rhod
e Is
land
230
16.5
83.5
–23
016
.583
.5–
––
––
Sout
h Ca
rolin
a7,
459
17.7
82.0
0.3
1,11
521
.877
.80.
46,
344
17.0
82.7
0.2
Sout
h Da
kota
726
24.4
75.6
0.0
726
24.4
75.6
0.0
––
––
Tenn
esse
e13
,142
19.1
80.5
0.3
12,6
8318
.781
.20.
145
930
.263
.16.
7Te
xas
37,0
7322
.977
.10.
04,
886
31.5
68.5
0.0
32,1
8721
.678
.40.
0U
tah
2,78
318
.681
.4–
1,28
919
.680
.4–
1,49
417
.782
.3–
Verm
ont
1,53
824
.875
.20.
01,
538
24.8
75.2
0.0
––
––
Virg
inia
9,91
717
.581
.11.
41,
945
17.7
76.8
5.5
7,97
217
.582
.10.
4W
ashi
ngto
n14
,776
14.1
85.5
0.5
2,22
413
.585
.51.
012
,552
14.2
85.5
0.4
Wes
t Virg
inia
9,38
217
.682
.20.
27,
350
17.3
82.5
0.2
2,03
218
.881
.00.
1W
isco
nsin
11,8
2021
.378
.70.
111
,741
21.3
78.6
0.1
799.
890
.10.
1W
yom
ing
455
21.0
78.9
0.1
455
21.0
78.9
0.1
––
––
Not
es: F
Y is
fisc
al y
ear.
Drug
util
izat
ion
in th
is e
xhib
it re
flect
s th
e nu
mbe
r of p
resc
riptio
ns re
port
ed in
the
stat
e dr
ug u
tiliz
atio
n da
ta th
at s
tate
s su
bmit
to th
e Ce
nter
s fo
r M
edic
are
& M
edic
aid
Serv
ices
(CM
S) fo
r reb
ate
purp
oses
, and
are
diff
eren
t fro
m M
edic
aid
Stat
istic
al In
form
atio
n Sy
stem
(MSI
S) d
ata
that
ser
ve a
s ou
r usu
al s
ourc
e of
ut
iliza
tion
data
. Util
izat
ion
show
n in
the
drug
util
izat
ion
data
may
diff
er fr
om th
ese
othe
r sou
rces
due
to d
iffer
ence
s in
tim
ing
and
run-
out o
f dat
a us
ed. I
n ad
ditio
n, th
e dr
ug
utili
zatio
n da
ta m
ay in
clud
e ph
ysic
ian-
adm
inis
tere
d dr
ugs
for w
hich
reba
tes
are
avai
labl
e; th
ese
drug
s ar
e ty
pica
lly re
port
ed u
nder
the
phys
icia
n se
rvic
es c
ateg
ory
inst
ead
of
the
outp
atie
nt p
resc
riptio
n dr
ug c
ateg
ory
in o
ther
dat
a. T
he s
tate
dru
g ut
iliza
tion
data
pro
vide
bot
h fe
e-fo
r-ser
vice
and
man
aged
car
e dr
ug u
tiliz
atio
n an
d sp
endi
ng in
form
atio
n at
the
natio
nal d
rug
code
(NDC
) lev
el. T
o as
sign
bra
nd a
nd g
ener
ic s
tatu
s, w
e lin
ked
the
quar
terly
sta
te d
rug
utili
zatio
n da
ta to
the
quar
terly
Med
icai
d dr
ug p
rodu
ct d
ata
from
CM
S us
ing
the
NDC
cod
e. B
rand
and
gen
eric
sta
tus
was
ass
igne
d us
ing
the
drug
cat
egor
y in
dica
tor f
rom
the
drug
pro
duct
file
. The
sta
te d
rug
utili
zatio
n da
ta a
re a
vaila
ble
at
http
s://
ww
w.m
edic
aid.
gov/
med
icai
d/pr
escr
iptio
n-dr
ugs/
stat
e-dr
ug-u
tiliz
atio
n-da
ta/i
ndex
.htm
l and
the
drug
pro
duct
dat
a ar
e av
aila
ble
at h
ttps
://w
ww
.med
icai
d.go
v/m
edic
aid/
pres
crip
tion-
drug
s/m
edic
aid-
drug
-reba
te-p
rogr
am/d
ata/
inde
x.ht
ml.
Begi
nnin
g in
Oct
ober
201
6, C
MS,
as
oblig
ated
by
the
Priv
acy
Act o
f 197
4 (5
U.S
.C. §
552
a) a
nd th
e H
ealth
In
sura
nce
Port
abili
ty a
nd A
ccou
ntab
ility
Act
priv
acy
rule
(45
CFR
Part
s 16
0 an
d 16
4), s
uppr
esse
d al
l rec
ords
in th
e st
ate
drug
util
izat
ion
data
that
are
less
than
11
coun
ts.
The
diff
eren
t bra
nd a
nd g
ener
ic p
ropo
rtio
ns u
nder
fee
for s
ervi
ce a
nd m
anag
ed c
are
may
refle
ct d
iffer
ence
s in
the
popu
latio
ns a
nd s
peci
fic d
rugs
cov
ered
und
er e
ach
deliv
ery
syst
em (e
.g.,
beha
vior
al h
ealth
dru
gs c
arve
d ou
t of m
anag
ed c
are)
, as
wel
l as
diff
eren
ces
in h
ow th
e st
ate
and
part
icip
atin
g he
alth
pla
ns m
anag
ed th
e dr
ug b
enef
it.
– D
ash
indi
cate
s ze
ro; 0
.0%
indi
cate
s an
am
ount
less
than
0.0
5% th
at ro
unds
to z
ero.
1 Fo
r thi
s ex
hibi
t, br
and
drug
s w
ere
defin
ed a
s si
ngle
sou
rce
drug
s an
d in
nova
tor,
mul
tiple
sou
rce
drug
s as
indi
cate
d in
that
qua
rter
’s M
edic
aid
drug
pro
duct
dat
a.2
For t
his
exhi
bit,
gene
ric d
rugs
wer
e de
fined
as
non-
inno
vato
r, m
ultip
le s
ourc
e dr
ugs
as in
dica
ted
in th
at q
uart
er’s
Med
icai
d dr
ug p
rodu
ct fi
le.
3 Fo
r thi
s ex
hibi
t, un
know
n dr
ugs
wer
e th
ose
drug
s w
hose
NDC
did
not
hav
e a
mat
ch in
that
qua
rter
’s M
edic
aid
drug
pro
duct
file
.4
The
natio
nal t
otal
doe
s no
t equ
al th
e su
m o
f the
sta
tes
due
to th
e su
ppre
ssio
n of
reco
rds
(as
desc
ribed
in th
e N
otes
abo
ve).
Reco
rds
for d
rugs
that
wer
e su
ppre
ssed
at
the
stat
e le
vel w
ere
not n
eces
saril
y su
ppre
ssed
onc
e th
e in
divi
dual
sta
te d
ata
wer
e ro
lled
up in
to th
e na
tiona
l sum
mar
y fil
e. W
hile
we
do n
ot k
now
how
man
y pr
escr
iptio
ns
has
been
sup
pres
sed
in th
e na
tiona
l sum
mar
y fil
e, c
ompa
rison
of t
he u
pdat
ed F
Y 20
14 fi
les
with
dat
a su
ppre
ssio
n to
last
yea
r's M
ACSt
ats
indi
cate
that
abo
ut 4
mill
ion
pres
crip
tions
(0.7
per
cent
) hav
e be
en s
uppr
esse
d in
the
FY 2
014
data
. So
urce
: MAC
PAC,
201
6, a
naly
sis
of M
edic
aid
drug
pro
duct
dat
a an
d st
ate
drug
reba
te u
tiliz
atio
n da
ta a
s of
Oct
ober
201
6.
EXH
IBIT
26.
(co
ntin
ued)

MACStats: Medicaid and CHIP Data Book 69
Section 3: Program Enrollment and Spending—Medicaid Benefits
MAC
Stat
sSe
ctio
n 3
Stat
eG
ross
spe
ndin
gRe
bate
sTo
tal
Fee
for s
ervi
ceM
anag
ed c
are
Tota
lFe
e fo
r ser
vice
Man
aged
car
eTo
tal1
$53,
036.
3$2
3,96
1.7
$29,
074.
6-$
24,0
12.8
-$12
,135
.5-$
11,8
77.3
Alab
ama
605.
760
5.7
–-3
30.8
-330
.8–
Alas
ka67
.467
.4–
-37.
8-3
7.8
–
Ariz
ona
909.
09.
989
9.1
-395
.3-8
.5-3
86.8
Arka
nsas
358.
835
8.8
–-2
16.8
-216
.8–
Calif
orni
a6,
404.
14,
056.
82,
347.
3-2
,633
.3-2
,127
.2-5
06.1
Colo
rado
674.
867
4.8
–-3
76.6
-373
.0-3
.6
Conn
ectic
ut1,
116.
61,
116.
6–
-583
.5-5
83.5
–
Dela
war
e220
2.9
49.5
153.
4-1
29.5
-123
.1-6
.4
Dist
rict o
f Col
umbi
a13
0.6
72.1
58.5
-83.
7-4
5.4
-38.
3
Flor
ida
2,61
5.5
563.
52,
051.
9-1
,316
.0-4
45.8
-870
.2
Geo
rgia
1,05
4.7
651.
340
3.5
-486
.6-3
15.3
-171
.3
Haw
aii3
881.
80.
288
1.6
-61.
0-0
.3-6
0.7
Idah
o17
1.1
171.
1–
-104
.5-1
04.5
–
Illin
ois
1,18
8.3
671.
051
7.4
-577
.7-4
08.3
-169
.3
Indi
ana2
1,09
7.5
829.
326
8.2
-615
.7-5
87.1
-28.
6
Iow
a43
2.6
431.
61.
0-2
58.8
-258
.8-0
.0
Kans
as28
9.6
0.4
289.
2-2
24.7
-1.8
-222
.9
Kent
ucky
1,04
2.0
63.8
978.
2-4
31.1
-45.
6-3
85.5
Loui
sian
a70
3.1
226.
947
6.2
-385
.2-1
00.5
-284
.7
Mai
ne22
7.5
227.
5–
-141
.2-1
41.2
–
Mar
ylan
d99
3.1
502.
549
0.6
-504
.6-2
59.2
-245
.4
Mas
sach
uset
ts1,
113.
652
4.9
588.
7-5
41.9
-283
.0-2
58.9
Mic
higa
n1,
552.
289
4.8
657.
4-8
13.5
-519
.4-2
94.1
Min
neso
ta86
4.5
224.
564
0.0
-436
.9-2
32.1
-204
.8
Mis
siss
ippi
250
7.6
203.
930
3.6
-237
.8-1
43.3
-94.
4
Mis
sour
i41,
199.
01,
199.
0–
-542
.2-5
60.6
18.4
Mon
tana
97.8
97.8
–-6
0.9
-60.
9–
EXH
IBIT
27.
Med
icai
d G
ross
Spe
ndin
g an
d Re
bate
s fo
r Dru
gs b
y De
liver
y Sy
stem
, FY
2015
(mill
ions
)

December 201670
Section 3: Program Enrollment and Spending—Medicaid Benefits
MAC
Stat
sSe
ctio
n 3
EXH
IBIT
27.
(co
ntin
ued)
Stat
eG
ross
spe
ndin
gRe
bate
sTo
tal
Fee
for s
ervi
ceM
anag
ed c
are
Tota
lFe
e fo
r ser
vice
Man
aged
car
eN
ebra
ska5
$168
.5$1
62.6
$5.9
-$98
.5-$
98.5
–
Nev
ada
333.
621
2.3
121.
3-1
81.0
-115
.6-$
65.4
New
Ham
pshi
re10
5.8
7.5
98.3
-97.
2-1
8.2
-79.
0
New
Jer
sey
1,35
2.6
47.6
1,30
5.0
-632
.4-3
8.7
-593
.7
New
Mex
ico
261.
65.
425
6.2
-200
.8-4
.8-1
96.0
New
Yor
k65,
306.
667
8.9
4,62
7.7
-2,2
04.4
306.
4-2
,510
.9
Nor
th C
arol
ina
1,65
6.1
1,65
6.1
–-9
06.1
-906
.1–
Nor
th D
akot
a253
.431
.222
.2-1
3.8
-10.
3-3
.5
Ohi
o2,
418.
437
5.5
2,04
2.9
-1,0
68.0
-323
.8-7
44.2
Okl
ahom
a46
5.3
465.
3–
-228
.9-2
28.9
–
Ore
gon
589.
515
2.8
436.
7-2
84.0
-84.
5-1
99.5
Penn
sylv
ania
2,12
0.7
67.2
2,05
3.5
-996
.0-5
7.1
-938
.9
Rhod
e Is
land
74.
04.
0–
-85.
4-1
3.3
-72.
1
Sout
h Ca
rolin
a47
5.8
92.5
383.
3-2
44.7
-59.
3-1
85.4
Sout
h Da
kota
81.2
81.2
–-3
3.8
-33.
8–
Tenn
esse
e593
1.3
876.
754
.6-6
08.5
-608
.5–
Texa
s3,
155.
167
9.5
2,47
5.7
-1,8
70.3
-502
.3-1
,367
.9
Uta
h18
0.0
112.
667
.4-1
11.9
-67.
3-4
4.5
Verm
ont
158.
815
8.8
–-9
6.9
-96.
9–
Virg
inia
900.
010
0.4
799.
6-3
22.3
-23.
9-2
98.4
Was
hing
ton
794.
412
8.9
665.
5-3
90.6
-83.
6-3
07.0
Wes
t Virg
inia
528.
843
3.4
95.5
-305
.1-2
52.4
-52.
8
Wis
cons
in97
8.3
977.
01.
3-4
79.4
-475
.0-4
.4
Wyo
min
g34
.234
.2–
-25.
1-2
5.1
–
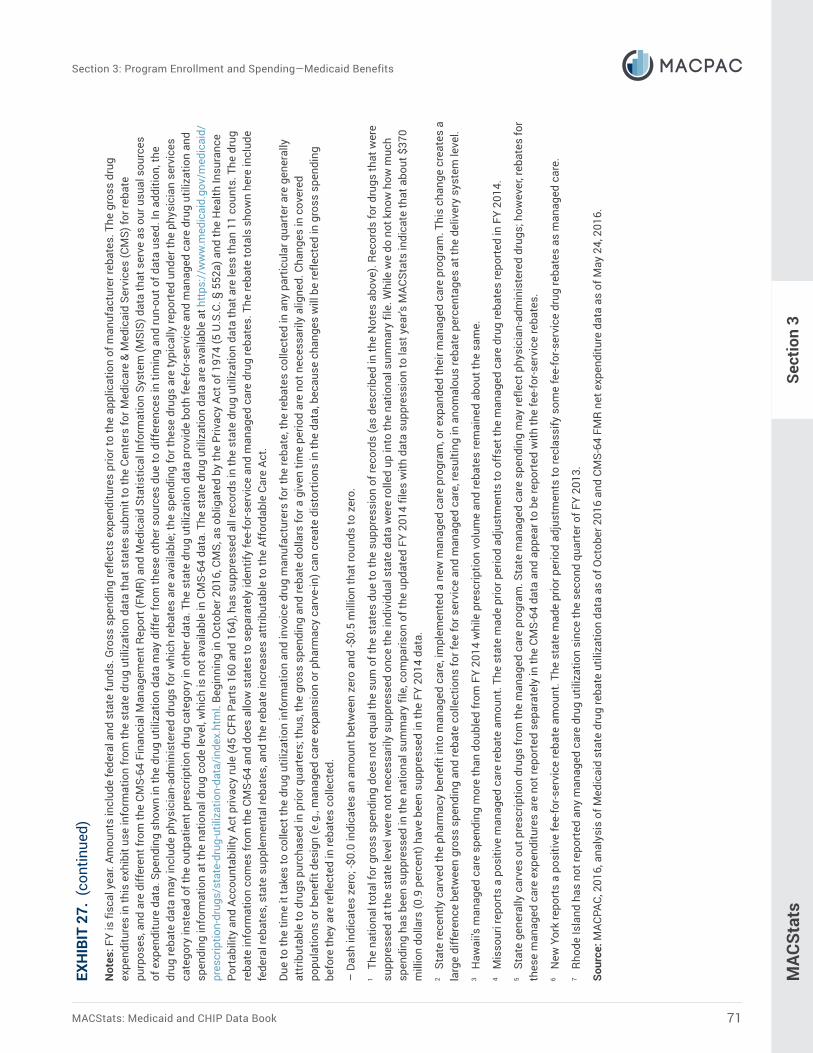
MACStats: Medicaid and CHIP Data Book 71
Section 3: Program Enrollment and Spending—Medicaid Benefits
MAC
Stat
sSe
ctio
n 3
EXH
IBIT
27.
(co
ntin
ued)
Not
es: F
Y is
fisc
al y
ear.
Amou
nts
incl
ude
fede
ral a
nd s
tate
fund
s. G
ross
spe
ndin
g re
flect
s ex
pend
iture
s pr
ior t
o th
e ap
plic
atio
n of
man
ufac
ture
r reb
ates
. The
gro
ss d
rug
expe
nditu
res
in th
is e
xhib
it us
e in
form
atio
n fr
om th
e st
ate
drug
util
izat
ion
data
that
sta
tes
subm
it to
the
Cent
ers
for M
edic
are
& M
edic
aid
Serv
ices
(CM
S) fo
r reb
ate
purp
oses
, and
are
diff
eren
t fro
m th
e CM
S-64
Fin
anci
al M
anag
emen
t Rep
ort (
FMR)
and
Med
icai
d St
atis
tical
Info
rmat
ion
Syst
em (M
SIS)
dat
a th
at s
erve
as
our u
sual
sou
rces
of
exp
endi
ture
dat
a. S
pend
ing
show
n in
the
drug
util
izat
ion
data
may
diff
er fr
om th
ese
othe
r sou
rces
due
to d
iffer
ence
s in
tim
ing
and
run-
out o
f dat
a us
ed. I
n ad
ditio
n, th
e dr
ug re
bate
dat
a m
ay in
clud
e ph
ysic
ian-
adm
inis
tere
d dr
ugs
for w
hich
reba
tes
are
avai
labl
e; th
e sp
endi
ng fo
r the
se d
rugs
are
typi
cally
repo
rted
und
er th
e ph
ysic
ian
serv
ices
ca
tego
ry in
stea
d of
the
outp
atie
nt p
resc
riptio
n dr
ug c
ateg
ory
in o
ther
dat
a. T
he s
tate
dru
g ut
iliza
tion
data
pro
vide
bot
h fe
e-fo
r-ser
vice
and
man
aged
car
e dr
ug u
tiliz
atio
n an
d sp
endi
ng in
form
atio
n at
the
natio
nal d
rug
code
leve
l, w
hich
is n
ot a
vaila
ble
in C
MS-
64 d
ata.
The
sta
te d
rug
utili
zatio
n da
ta a
re a
vaila
ble
at h
ttps
://w
ww
.med
icai
d.go
v/m
edic
aid/
pres
crip
tion-
drug
s/st
ate-
drug
-util
izat
ion-
data
/inde
x.ht
ml.
Begi
nnin
g in
Oct
ober
201
6, C
MS,
as
oblig
ated
by
the
Priv
acy
Act o
f 197
4 (5
U.S
.C. §
552
a) a
nd th
e H
ealth
Insu
ranc
e Po
rtab
ility
and
Acc
ount
abili
ty A
ct p
rivac
y ru
le (4
5 CF
R Pa
rts
160
and
164)
, has
sup
pres
sed
all r
ecor
ds in
the
stat
e dr
ug u
tiliz
atio
n da
ta th
at a
re le
ss th
an 1
1 co
unts
. The
dru
g re
bate
info
rmat
ion
com
es fr
om th
e CM
S-64
and
doe
s al
low
sta
tes
to s
epar
atel
y id
entif
y fe
e-fo
r-ser
vice
and
man
aged
car
e dr
ug re
bate
s. T
he re
bate
tota
ls s
how
n he
re in
clud
e fe
dera
l reb
ates
, sta
te s
uppl
emen
tal r
ebat
es, a
nd th
e re
bate
incr
ease
s at
trib
utab
le to
the
Affo
rdab
le C
are
Act.
Due
to th
e tim
e it
take
s to
col
lect
the
drug
util
izat
ion
info
rmat
ion
and
invo
ice
drug
man
ufac
ture
rs fo
r the
reba
te, t
he re
bate
s co
llect
ed in
any
par
ticul
ar q
uart
er a
re g
ener
ally
at
trib
utab
le to
dru
gs p
urch
ased
in p
rior q
uart
ers;
thus
, the
gro
ss s
pend
ing
and
reba
te d
olla
rs fo
r a g
iven
tim
e pe
riod
are
not n
eces
saril
y al
igne
d. C
hang
es in
cov
ered
po
pula
tions
or b
enef
it de
sign
(e.g
., m
anag
ed c
are
expa
nsio
n or
pha
rmac
y ca
rve-
in) c
an c
reat
e di
stor
tions
in th
e da
ta, b
ecau
se c
hang
es w
ill b
e re
flect
ed in
gro
ss s
pend
ing
befo
re th
ey a
re re
flect
ed in
reba
tes
colle
cted
.
– D
ash
indi
cate
s ze
ro; -
$0.0
indi
cate
s an
am
ount
bet
wee
n ze
ro a
nd -$
0.5
mill
ion
that
roun
ds to
zer
o.1
The
natio
nal t
otal
for g
ross
spe
ndin
g do
es n
ot e
qual
the
sum
of t
he s
tate
s du
e to
the
supp
ress
ion
of re
cord
s (a
s de
scrib
ed in
the
Not
es a
bove
). Re
cord
s fo
r dru
gs th
at w
ere
supp
ress
ed a
t the
sta
te le
vel w
ere
not n
eces
saril
y su
ppre
ssed
onc
e th
e in
divi
dual
sta
te d
ata
wer
e ro
lled
up in
to th
e na
tiona
l sum
mar
y fil
e. W
hile
we
do n
ot k
now
how
muc
h sp
endi
ng h
as b
een
supp
ress
ed in
the
natio
nal s
umm
ary
file,
com
paris
on o
f the
upd
ated
FY
2014
file
s w
ith d
ata
supp
ress
ion
to la
st y
ear's
MAC
Stat
s in
dica
te th
at a
bout
$37
0 m
illio
n do
llars
(0.9
per
cent
) hav
e be
en s
uppr
esse
d in
the
FY 2
014
data
. 2
Stat
e re
cent
ly c
arve
d th
e ph
arm
acy
bene
fit in
to m
anag
ed c
are,
impl
emen
ted
a ne
w m
anag
ed c
are
prog
ram
, or e
xpan
ded
thei
r man
aged
car
e pr
ogra
m. T
his
chan
ge c
reat
es a
la
rge
diff
eren
ce b
etw
een
gros
s sp
endi
ng a
nd re
bate
col
lect
ions
for f
ee fo
r ser
vice
and
man
aged
car
e, re
sulti
ng in
ano
mal
ous
reba
te p
erce
ntag
es a
t the
del
iver
y sy
stem
leve
l.3
Haw
aii's
man
aged
car
e sp
endi
ng m
ore
than
dou
bled
from
FY
2014
whi
le p
resc
riptio
n vo
lum
e an
d re
bate
s re
mai
ned
abou
t the
sam
e.4
Mis
sour
i rep
orts
a p
ositi
ve m
anag
ed c
are
reba
te a
mou
nt. T
he s
tate
mad
e pr
ior p
erio
d ad
just
men
ts to
off
set t
he m
anag
ed c
are
drug
reba
tes
repo
rted
in F
Y 20
14.
5 St
ate
gene
rally
car
ves
out p
resc
riptio
n dr
ugs
from
the
man
aged
car
e pr
ogra
m. S
tate
man
aged
car
e sp
endi
ng m
ay re
flect
phy
sici
an-a
dmin
iste
red
drug
s; h
owev
er, r
ebat
es fo
r th
ese
man
aged
car
e ex
pend
iture
s ar
e no
t rep
orte
d se
para
tely
in th
e CM
S-64
dat
a an
d ap
pear
to b
e re
port
ed w
ith th
e fe
e-fo
r-ser
vice
reba
tes.
6 N
ew Y
ork
repo
rts
a po
sitiv
e fe
e-fo
r-ser
vice
reba
te a
mou
nt. T
he s
tate
mad
e pr
ior p
erio
d ad
just
men
ts to
recl
assi
fy s
ome
fee-
for-s
ervi
ce d
rug
reba
tes
as m
anag
ed c
are.
7 Rh
ode
Isla
nd h
as n
ot re
port
ed a
ny m
anag
ed c
are
drug
util
izat
ion
sinc
e th
e se
cond
qua
rter
of F
Y 20
13.
Sour
ce: M
ACPA
C, 2
016,
ana
lysi
s of
Med
icai
d st
ate
drug
reba
te u
tiliz
atio
n da
ta a
s of
Oct
ober
201
6 an
d CM
S-64
FM
R ne
t exp
endi
ture
dat
a as
of M
ay 2
4, 2
016.

December 201672
Section 3: Program Enrollment and Spending—Medicaid Managed Care
MAC
Stat
sSe
ctio
n 3
Stat
eTo
tal M
edic
aid
enro
llees
Perc
enta
ge o
f enr
olle
es in
man
aged
car
e
Com
preh
ensi
ve
man
aged
car
e1
Lim
ited-
bene
fit p
lans
PCCM
MLT
SSBH
O (P
IHP
and/
or P
AHP)
Dent
alTr
ansp
orta
tion
Oth
erTo
tal
70,2
46,1
9759
.7%
0.3%
15.5
%9.
3%11
.3%
1.7%
10.3
%
Alab
ama
1,05
4,94
10.
0–
––
–1.
958
.8
Alas
ka13
2,55
6–
––
––
––
Ariz
ona
1,54
8,32
585
.1–
––
––
–
Arka
nsas
595,
807
0.0
––
–86
.3–
81.7
Calif
orni
a11
,522
,853
67.8
–0.
07.
0–
0.0
–
Colo
rado
1,07
9,69
96.
1–
95.1
––
2.5
60.7
Conn
ectic
ut72
4,74
1–
––
––
––
Dela
war
e22
7,55
486
.2–
––
––
–
Dist
rict o
f Col
umbi
a25
7,45
066
.9–
––
20.4
––
Flor
ida2
3,53
1,94
575
.32.
40.
00.
0–
0.0
0.0
Geo
rgia
1,96
1,08
568
.6–
––
–0.
6–
Haw
aii
321,
027
98.5
––
––
––
Idah
o26
6,17
20.
3–
96.0
99.7
98.6
–91
.5
Illin
ois
3,24
9,83
513
.5–
––
––
53.1
Indi
ana
1,17
6,44
762
.7–
––
––
3.1
Iow
a59
3,57
29.
9–
89.6
–71
.1–
52.1
Kans
as39
9,29
989
.3–
––
––
–
Kent
ucky
1,20
9,55
289
.4–
––
––
–
Loui
sian
a1,
305,
671
32.1
–78
.779
.2–
–37
.0
Mai
ne26
2,33
4–
––
––
–61
.5
Mar
ylan
d1,
309,
260
82.8
––
––
––
Mas
sach
uset
ts1,
878,
120
42.8
–16
.3–
––
16.3
Mic
higa
n3,
871,
806
47.3
–50
.213
.3–
––
Min
neso
ta1,
112,
174
71.1
––
––
––
Mis
siss
ippi
699,
153
22.2
––
––
––
EXH
IBIT
28.
Per
cent
age
of M
edic
aid
Enro
llees
in M
anag
ed C
are
by S
tate
, Jul
y 1,
201
4

MACStats: Medicaid and CHIP Data Book 73
Section 3: Program Enrollment and Spending—Medicaid Managed Care
MAC
Stat
sSe
ctio
n 3
Stat
eTo
tal M
edic
aid
enro
llees
Perc
enta
ge o
f enr
olle
es in
man
aged
car
e
Com
preh
ensi
ve
man
aged
car
e1
Lim
ited-
bene
fit p
lans
PCCM
MLT
SSBH
O (P
IHP
and/
or P
AHP)
Dent
alTr
ansp
orta
tion
Oth
erM
isso
uri
825,
974
47.1
%–
––
49.5
%–
–
Mon
tana
131,
923
––
––
––
69.0
%
Neb
rask
a24
2,57
875
.7–
94.7
%–
––
–
Nev
ada
533,
734
67.5
––
–86
.9–
7.1
New
Ham
pshi
re14
2,31
585
.1–
––
––
–
New
Jer
sey
1,54
2,02
285
.3–
––
92.0
––
New
Mex
ico
727,
214
79.8
––
––
––
New
Yor
k5,
845,
589
73.4
2.1%
––
––
–
Nor
th C
arol
ina
1,71
7,65
80.
1–
95.1
––
–81
.6
Nor
th D
akot
a79
,031
14.9
––
––
0.3%
57.1
Ohi
o2,
796,
017
72.5
––
––
––
Okl
ahom
a82
6,43
40.
0–
––
89.2
–64
.3
Ore
gon3
1,05
1,64
578
.8–
0.4
22.6
%–
––
Penn
sylv
ania
2,15
2,84
677
.7–
91.6
–22
.1–
–
Rhod
e Is
land
263,
574
82.6
––
29.0
––
3.7
Sout
h Ca
rolin
a1,
089,
973
66.1
––
––
–0.
0
Sout
h Da
kota
122,
352
––
––
––
74.6
Tenn
esse
e31,
288,
631
100.
0–
–59
.6–
89.3
–
Texa
s4,
137,
121
78.1
–10
.765
.741
.6–
0.3
Uta
h28
7,75
470
.0–
98.1
46.3
81.5
––
Verm
ont4
188,
337
42.3
––
––
––
Virg
inia
961,
843
67.2
––
––
––
Was
hing
ton
1,24
5,32
210
0.0
–10
0.0
–10
0.0
––
Wes
t Virg
inia
486,
839
41.8
––
––
–0.
7
Wis
cons
in1,
199,
773
55.1
3.2
0.1
––
0.1
–
Wyo
min
g68
,320
0.1
––
––
––
EXH
IBIT
28.
(co
ntin
ued)

December 201674
Section 3: Program Enrollment and Spending—Medicaid Managed Care
MAC
Stat
sSe
ctio
n 3
EXH
IBIT
28.
(co
ntin
ued)
Not
es: P
CCM
is p
rimar
y ca
re c
ase
man
agem
ent.
MLT
SS is
man
aged
long
-term
ser
vice
s an
d su
ppor
ts. B
HO
is b
ehav
iora
l hea
lth o
rgan
izat
ion.
PIH
P is
pre
paid
inpa
tient
hea
lth
plan
. PAH
P is
pre
paid
am
bula
tory
hea
lth p
lan.
Exc
lude
s th
e te
rrito
ries.
Thi
s ex
hibi
t inc
lude
s M
edic
aid-
expa
nsio
n CH
IP e
nrol
lees
. Med
icai
d be
nefic
iarie
s m
ay b
e en
rolle
d co
ncur
rent
ly in
mor
e th
an o
ne ty
pe o
f man
aged
car
e pr
ogra
m (e
.g.,
a co
mpr
ehen
sive
pla
n an
d a
BHO
), so
the
sum
of e
nrol
lmen
t in
each
pro
gram
type
as
a pe
rcen
tage
of t
otal
M
edic
aid
enro
llmen
t may
be
grea
ter t
han
100
perc
ent.
– D
ash
indi
cate
s ze
ro. 0
.0%
indi
cate
s an
am
ount
less
than
0.0
5% th
at ro
unds
to z
ero.
1 In
clud
es c
ompr
ehen
sive
man
aged
car
e an
d Pr
ogra
ms
of A
ll-In
clus
ive
Care
for t
he E
lder
ly. C
ompr
ehen
sive
man
aged
car
e or
gani
zatio
ns (M
COs)
cov
er a
cute
, prim
ary,
and
spec
ialty
med
ical
car
e se
rvic
es; t
hey
may
als
o co
ver b
ehav
iora
l hea
lth, l
ong-
term
ser
vice
s an
d su
ppor
ts, a
nd o
ther
ben
efits
in s
ome
stat
es.
2 Fl
orid
a re
port
ed e
nrol
lmen
t as
of A
ugus
t 1, 2
014.
3 So
me
plan
s th
at a
ppea
r to
be li
mite
d-be
nefit
pla
ns (d
enta
l, BH
O, o
r oth
er m
anag
ed c
are)
wer
e cl
assi
fied
as c
ompr
ehen
sive
man
aged
car
e in
the
Cent
ers
for M
edic
are
& M
edic
aid
Serv
ices
(CM
S) re
port
. The
val
ues
show
n he
re u
se p
lan-
leve
l inf
orm
atio
n in
the
CMS
repo
rt to
reca
tego
rize
enro
llmen
t in
thos
e lim
ited-
bene
fit p
lans
as
BHO,
den
tal,
or
othe
r man
aged
car
e.4
The
Depa
rtm
ent o
f Ver
mon
t Hea
lth A
cces
s, a
sta
te a
genc
y, ac
ts a
s Ve
rmon
t’s s
ingl
e M
CO e
ntity
.
Sour
ce: M
ACPA
C, 2
016,
ana
lysi
s of
dat
a fr
om C
MS,
201
6, M
edic
aid
man
aged
car
e en
rollm
ent a
nd p
rogr
am c
hara
cter
istic
s, 2
014,
htt
p://
ww
w.m
edic
aid.
gov/
med
icai
d-ch
ip-p
rogr
am-
info
rmat
ion/
by-to
pics
/dat
a-an
d-sy
stem
s/m
edic
aid-
man
aged
-car
e/do
wnl
oads
/201
4-m
edic
aid-
man
aged
-car
e-en
rollm
ent-r
epor
t.pdf
.

MACStats: Medicaid and CHIP Data Book 75
Section 3: Program Enrollment and Spending—Medicaid Managed Care
MAC
Stat
sSe
ctio
n 3
Stat
e
Tota
l M
edic
aid
enro
llees
(th
ousa
nds)
Perc
enta
ge o
f enr
olle
es in
man
aged
car
eCo
mpr
ehen
sive
man
aged
car
e1Li
mite
d-be
nefit
pla
nsPr
imar
y ca
re c
ase
man
agem
ent
Tota
lCh
ildre
nAd
ults
Disa
bled
Aged
Tota
lCh
ildre
nAd
ults
Disa
bled
Aged
Tota
lCh
ildre
nAd
ults
Disa
bled
Aged
Tota
l70
,134
53.9
%67
.8%
50.9
%40
.2%
18.1
%49
.5%
58.8
%35
.9%
53.1
%40
.7%
12.7
%17
.4%
9.3%
11.3
%2.
5%
Alab
ama
1,21
22.
4–
0.0
5.6
12.4
––
––
–46
.069
.713
.444
.41.
4
Alas
ka13
6–
––
––
––
––
––
––
––
Ariz
ona
1,68
181
.191
.477
.966
.948
.190
.697
.684
.691
.371
.3–
––
––
Arka
nsas
696
0.0
–0.
0–
0.2
78.7
98.4
46.3
74.3
40.4
64.1
91.3
27.7
56.0
3.5
Calif
orni
a11
,742
49.6
76.5
29.4
67.2
34.7
68.2
94.1
37.1
99.6
96.5
––
––
–
Colo
rado
896
11.6
12.7
11.2
9.1
9.8
95.4
99.5
96.2
89.7
73.2
2.9
2.7
2.3
4.1
4.4
Conn
ectic
ut85
8–
––
––
––
––
––
––
––
Dela
war
e26
085
.995
.087
.867
.647
.889
.498
.990
.274
.249
.52.
11.
72.
52.
60.
5
Dist
rict o
f Co
lum
bia
246
73.9
92.1
93.3
22.1
3.0
37.3
20.1
28.3
80.5
69.9
––
––
–
Flor
ida
4,31
339
.653
.237
.226
.86.
346
.678
.313
.029
.52.
524
.233
.914
.224
.93.
4
Geo
rgia
2,01
368
.393
.987
.32.
80.
085
.296
.978
.674
.448
.2–
––
––
Haw
aii
300
98.2
99.8
99.6
96.4
88.9
2.2
2.0
0.0
8.9
1.5
––
––
–
Idah
o27
5–
––
––
94.4
99.9
97.6
84.7
64.9
85.5
93.6
84.9
74.5
44.6
Illin
ois
3,03
911
.09.
814
.511
.84.
84.
35.
94.
30.
10.
061
.976
.164
.429
.05.
0
Indi
ana
1,25
069
.192
.485
.111
.30.
2–
––
––
3.9
2.1
0.1
15.2
1.7
Iow
a63
46.
710
.55.
70.
30.
378
.999
.246
.892
.674
.159
.773
.872
.014
.43.
5
Kans
as44
246
.666
.052
.11.
70.
775
.082
.466
.474
.539
.45.
72.
91.
019
.62.
1
Kent
ucky
927
85.1
99.7
97.3
71.5
34.9
89.6
99.1
97.6
80.2
57.4
––
––
–
Loui
sian
a1,
284
0.0
––
0.0
0.3
83.6
66.1
100.
010
0.0
100.
036
.752
.623
.824
.311
.5
Mai
ne37
1–
––
––
––
––
–54
.478
.174
.129
.00.
7
Mar
ylan
d1,
139
81.7
97.5
86.7
59.6
2.1
––
––
––
––
––
Mas
sach
uset
ts1,
527
43.3
55.8
50.5
30.7
20.8
34.8
42.8
37.3
38.6
1.4
29.7
33.8
36.7
29.6
1.4
Mic
higa
n2,
291
73.1
87.5
70.7
58.9
11.5
93.8
98.9
85.0
95.2
85.7
––
––
–
Min
neso
ta1,
154
76.5
87.0
80.8
40.7
59.4
––
––
––
––
––
Mis
siss
ippi
786
25.6
10.9
69.9
42.3
1.0
87.3
99.9
82.9
78.6
54.8
––
––
–
EXH
IBIT
29.
Per
cent
age
of M
edic
aid
Enro
llees
in M
anag
ed C
are
by S
tate
and
Elig
ibili
ty G
roup
, FY
2013

December 201676
Section 3: Program Enrollment and Spending—Medicaid Managed Care
MAC
Stat
sSe
ctio
n 3
EXH
IBIT
29.
(co
ntin
ued)
Stat
e
Tota
l M
edic
aid
enro
llees
(th
ousa
nds)
Perc
enta
ge o
f enr
olle
es in
man
aged
car
eCo
mpr
ehen
sive
man
aged
car
e1Li
mite
d-be
nefit
pla
nsPr
imar
y ca
re c
ase
man
agem
ent
Tota
lCh
ildre
nAd
ults
Disa
bled
Aged
Tota
lCh
ildre
nAd
ults
Disa
bled
Aged
Tota
lCh
ildre
nAd
ults
Disa
bled
Aged
Mis
sour
i1,
122
45.5
%67
.7%
50.0
%2.
0%0.
2%–
––
––
––
––
–
Mon
tana
142
––
––
–0.
6%–
0.0%
3.6%
0.1%
73.3
%92
.0%
75.8
%49
.8%
1.4%
Neb
rask
a26
273
.991
.983
.940
.65.
893
.398
.2%
89.6
91.2
74.7
––
––
–
Nev
ada
422
59.9
77.4
71.3
1.7
0.0
87.6
95.7
90.0
72.1
49.1
––
––
–
New
Ham
pshi
re16
6–
––
––
––
––
––
––
––
New
Jer
sey
1,19
084
.295
.062
.985
.565
.596
.898
.799
.495
.187
.8–
––
––
New
Mex
ico
660
66.8
84.4
58.6
43.2
2.6
67.3
84.3
38.0
68.6
53.3
––
––
–
New
Yor
k6,
002
76.9
90.5
90.0
50.6
15.0
2.0
0.0
0.1
2.5
15.0
0.0
0.0
0.0
0.0
–
Nor
th C
arol
ina
2,00
00.
0–
–0.
00.
491
.399
.181
.389
.172
.380
.096
.060
.272
.446
.6
Nor
th D
akot
a87
2.5
4.5
0.1
0.1
0.8
2.1
3.4
0.3
1.4
0.2
53.9
71.9
72.4
1.3
0.0
Ohi
o2,
645
73.0
94.1
74.2
46.4
5.6
––
––
––
––
––
Okl
ahom
a95
10.
0–
–0.
00.
288
.296
.775
.685
.279
.270
.290
.264
.341
.31.
2
Ore
gon
760
79.9
91.4
82.6
63.9
36.3
87.6
96.0
85.7
79.0
62.3
0.4
0.4
0.1
0.6
0.7
Penn
sylv
ania
2,56
775
.395
.574
.369
.68.
187
.797
.877
.792
.849
.68.
110
.57.
67.
50.
4
Rhod
e Is
land
170
58.8
88.0
81.0
15.8
1.0
31.6
70.0
0.0
9.5
––
––
––
Sout
h Ca
rolin
a1,
091
48.7
63.4
45.0
30.8
1.3
89.1
99.8
65.5
93.9
83.0
19.5
23.4
14.0
20.9
8.4
Sout
h Da
kota
134
––
––
––
––
––
72.3
91.8
87.5
28.6
0.9
Tenn
esse
e1,
557
91.6
100.
010
0.0
78.6
54.2
91.6
100.
010
0.0
78.6
54.0
––
––
–
Texa
s5,
240
81.5
96.2
62.3
67.0
34.8
11.8
14.3
7.8
10.0
4.2
0.0
0.0
–0.
0–
Uta
h38
923
.827
.818
.818
.315
.890
.198
.770
.692
.281
.828
.131
.521
.628
.919
.1
Verm
ont
206
0.1
––
0.1
0.5
––
––
–67
.186
.777
.137
.73.
1
Virg
inia
1,13
663
.584
.459
.140
.05.
5–
––
––
––
––
–
Was
hing
ton
1,42
169
.787
.659
.852
.22.
390
.999
.973
.188
.377
.40.
80.
90.
91.
10.
0
Wes
t Virg
inia
437
54.1
89.1
80.2
1.4
0.0
––
––
–1.
21.
81.
50.
50.
0
Wis
cons
in1,
254
59.1
85.4
70.7
3.8
2.4
89.0
98.0
93.7
93.3
38.6
––
––
–
Wyo
min
g89
––
––
––
––
––
––
––
–

MACStats: Medicaid and CHIP Data Book 77
Section 3: Program Enrollment and Spending—Medicaid Managed Care
MAC
Stat
sSe
ctio
n 3
EXH
IBIT
29.
(co
ntin
ued)
Not
es: F
Y is
fisc
al y
ear.
Enro
llmen
t num
bers
gen
eral
ly in
clud
e in
divi
dual
s ev
er e
nrol
led
in M
edic
aid-
finan
ced
cove
rage
dur
ing
the
year
, eve
n if
for a
sin
gle
mon
th; h
owev
er, i
n th
e ev
ent i
ndiv
idua
ls w
ere
also
enr
olle
d in
CH
IP-fi
nanc
ed M
edic
aid
cove
rage
(i.e
., M
edic
aid-
expa
nsio
n CH
IP) d
urin
g th
e ye
ar, t
hey
are
excl
uded
if th
eir m
ost r
ecen
t enr
ollm
ent m
onth
w
as in
Med
icai
d-ex
pans
ion
CHIP
. Num
bers
exc
lude
indi
vidu
als
enro
lled
only
in M
edic
aid-
expa
nsio
n CH
IP d
urin
g th
e ye
ar a
nd e
nrol
lees
in th
e te
rrito
ries.
Chi
ldre
n an
d ad
ults
un
der a
ge 6
5 w
ho q
ualif
y fo
r Med
icai
d on
the
basi
s of
dis
abili
ty a
re in
clud
ed in
the
disa
bled
cat
egor
y. A
bout
746
,000
enr
olle
es a
ge 6
5 an
d ol
der a
re id
entif
ied
in th
e da
ta a
s di
sabl
ed; g
iven
that
dis
abili
ty is
not
an
elig
ibili
ty p
athw
ay fo
r ind
ivid
uals
age
65
and
olde
r, M
ACPA
C re
code
s th
ese
enro
llees
as
aged
.
Due
to c
hang
es in
bot
h m
etho
ds a
nd d
ata
over
tim
e, fi
gure
s sh
own
here
may
not
be
dire
ctly
com
para
ble
to e
arlie
r yea
rs. W
ith re
gard
to m
etho
ds, i
ndiv
idua
ls a
re c
ount
ed a
s pa
rtic
ipat
ing
in m
anag
ed c
are
if th
ey h
ad a
t lea
st o
ne m
onth
indi
catin
g pl
an e
nrol
lmen
t; pr
ior t
o th
e 20
15 d
ata
book
, ind
ivid
uals
wer
e co
unte
d as
par
ticip
atin
g if
at le
ast o
ne
man
aged
car
e pa
ymen
t was
mad
e on
thei
r beh
alf d
urin
g th
e fis
cal y
ear.
For M
ACPA
C’s
anal
ysis
, Med
icai
d en
rolle
es w
ere
assi
gned
a u
niqu
e na
tiona
l ide
ntifi
catio
n nu
mbe
r usi
ng
an a
lgor
ithm
that
inco
rpor
ates
sta
te-s
peci
fic ID
num
bers
and
ben
efic
iary
cha
ract
eris
tics
such
as
date
of b
irth
and
gend
er. T
he s
tate
and
nat
iona
l enr
ollm
ent c
ount
s sh
own
here
ar
e un
dupl
icat
ed u
sing
this
nat
iona
l ID.
The
sum
of t
he s
tate
tota
ls e
xcee
ds th
e na
tiona
l tot
al b
ecau
se in
divi
dual
s m
ay b
e en
rolle
d in
mor
e th
an o
ne s
tate
dur
ing
the
year
. See
ht
tps:
//w
ww
.mac
pac.
gov/
mac
stat
s/da
ta-s
ourc
es-a
nd-m
etho
ds/ f
or a
dditi
onal
info
rmat
ion
on m
etho
ds a
nd d
ata.
Med
icai
d en
rolle
es m
ay b
e en
rolle
d co
ncur
rent
ly in
mor
e th
an
one
type
of m
anag
ed c
are
prog
ram
(e.g
., a
com
preh
ensi
ve p
lan
and
a lim
ited-
bene
fit p
lan)
, so
the
sum
of e
nrol
lmen
t in
each
pro
gram
type
as
a pe
rcen
tage
of t
otal
Med
icai
d en
rollm
ent m
ay b
e gr
eate
r tha
n 10
0 pe
rcen
t.
Figu
res
show
n he
re, w
hich
are
bas
ed o
n M
edic
aid
Stat
istic
al In
form
atio
n Sy
stem
(MSI
S) d
ata,
may
diff
er fr
om th
ose
that
use
Med
icai
d m
anag
ed c
are
enro
llmen
t rep
ort d
ata.
Re
ason
s fo
r diff
eren
ces
incl
ude
diff
erin
g tim
e pe
riods
, sta
te re
port
ing
anom
alie
s, a
nd th
e tr
eatm
ent o
f Med
icai
d-ex
pans
ion
CHIP
enr
olle
es (e
xclu
ded
here
but
incl
uded
in
enro
llmen
t rep
ort d
ata)
. Alth
ough
the
enro
llmen
t rep
ort i
s a
com
mon
ly c
ited
sour
ce, i
t doe
s no
t pro
vide
info
rmat
ion
on th
e ch
arac
teris
tics
of e
nrol
lees
in m
anag
ed c
are
(e.g
., el
igib
ility
gro
up).
– D
ash
indi
cate
s ze
ro; 0
.0%
indi
cate
s an
am
ount
less
than
0.0
5% th
at ro
unds
to z
ero.
1 In
clud
es c
ompr
ehen
sive
man
aged
car
e an
d Pr
ogra
ms
of A
ll-In
clus
ive
Care
for t
he E
lder
ly.
Sour
ce: M
ACPA
C, 2
016,
ana
lysi
s of
MSI
S da
ta a
s of
Dec
embe
r 201
5.

December 201678
Section 3: Program Enrollment and Spending—Medicaid Program Administration
MAC
Stat
sSe
ctio
n 3
Stat
e1
Tota
l sp
endi
ng o
n ad
min
istr
atio
n
Spen
ding
by
cate
gory
Colle
ctio
nsM
MIS
2El
igib
ility
sy
stem
2
EHR
ince
ntiv
e pr
ogra
m3
Oth
er fu
nctio
ns,
fede
ral m
atch
, ab
ove
50%
4
Oth
er fu
nctio
ns,
fede
ral m
atch
of
50%
5
Alab
ama
$231
$32
$39
$28
$10
$123
-$0
Alas
ka13
08
259
584
–Ar
izon
a27
727
138
448
60-0
Arka
nsas
383
8556
1948
175
–Ca
lifor
nia
5,63
164
11,
626
166
240
2,95
8–
Colo
rado
385
7146
289
231
–Co
nnec
ticut
414
4015
614
3416
9–
Dela
war
e16
334
565
662
–Di
stric
t of C
olum
bia
151
2022
73
98–
Flor
ida
703
7310
254
3444
0–
Geo
rgia
580
130
164
498
230
-0H
awai
i11
914
5519
328
–Id
aho
105
2721
105
41–
Illin
ois
1,02
458
4479
6677
7–
Indi
ana
472
7628
2518
325
–Io
wa
196
5776
245
33–
Kans
as18
328
4815
388
-0Ke
ntuc
ky24
349
4538
1595
–Lo
uisi
ana
289
4458
3910
138
–M
aine
143
4414
1810
57–
Mar
ylan
d47
135
8935
6225
0–
Mas
sach
uset
ts78
611
013
329
3148
3–
Mic
higa
n69
428
952
6347
242
–M
inne
sota
590
6297
507
374
–M
issi
ssip
pi17
745
1228
983
-0M
isso
uri
350
5265
2910
195
-0M
onta
na75
634
63
27-0
Neb
rask
a12
722
4014
943
–N
evad
a16
026
789
1038
–
EXH
IBIT
30.
Tot
al M
edic
aid
Adm
inis
trat
ive
Spen
ding
by
Stat
e an
d Ca
tego
ry, F
Y 20
15 (m
illio
ns)

MACStats: Medicaid and CHIP Data Book 79
Section 3: Program Enrollment and Spending—Medicaid Program Administration
MAC
Stat
sSe
ctio
n 3
EXH
IBIT
30.
(co
ntin
ued)
Stat
e1
Tota
l sp
endi
ng o
n ad
min
istr
atio
n
Spen
ding
by
cate
gory
Colle
ctio
nsM
MIS
2El
igib
ility
sy
stem
2
EHR
ince
ntiv
e pr
ogra
m3
Oth
er fu
nctio
ns,
fede
ral m
atch
, ab
ove
50%
4
Oth
er fu
nctio
ns,
fede
ral m
atch
of
50%
5
New
Ham
pshi
re$1
24$3
7$4
9$3
$4$3
1–
New
Jer
sey
780
5510
428
3356
1–
New
Mex
ico
163
2644
1111
75-$
3N
ew Y
ork
1,78
419
621
140
691,
357
–N
orth
Car
olin
a66
570
339
5225
180
–N
orth
Dak
ota
163
11
010
–O
hio
860
8917
169
1451
8–
Okl
ahom
a24
540
1029
3413
2–
Ore
gon
541
3698
247
376
-0Pe
nnsy
lvan
ia87
610
723
148
2346
8–
Rhod
e Is
land
144
2934
94
69–
Sout
h Ca
rolin
a26
071
4820
1310
9–
Sout
h Da
kota
559
210
231
–Te
nnes
see
412
6864
3915
228
-1Te
xas
1,45
628
259
975
4346
6-8
Uta
h15
229
3920
1252
–Ve
rmon
t33
815
80
1–
Virg
inia
478
3124
430
3114
1–
Was
hing
ton
581
8268
467
377
–W
est V
irgin
ia18
968
613
2279
–W
isco
nsin
319
7844
309
167
-10
Wyo
min
g62
1617
82
20–
Subt
otal
(sta
tes)
$25,
451
$3,6
36$5
,667
$1,6
65$1
,110
$13,
396
-$23
Amer
ican
Sam
oa4
––
3–
1–
Gua
m3
––
00
2–
N. M
aria
na Is
land
s1
––
0–
0–
Puer
to R
ico
822
–25
–55
–Vi
rgin
Isla
nds
81
02
–5
–Su
btot
al (s
tate
s an
d te
rrito
ries)
$25,
547
$3,6
39$5
,668
$1,6
96$1
,110
$13,
458
-$23

December 201680
Section 3: Program Enrollment and Spending—Medicaid Program Administration
MAC
Stat
sSe
ctio
n 3
EXH
IBIT
30.
(co
ntin
ued)
Stat
e1
Tota
l sp
endi
ng o
n ad
min
istr
atio
n
Spen
ding
by
cate
gory
Colle
ctio
nsM
MIS
2El
igib
ility
sy
stem
2
EHR
ince
ntiv
e pr
ogra
m3
Oth
er fu
nctio
ns,
fede
ral m
atch
, ab
ove
50%
4
Oth
er fu
nctio
ns,
fede
ral m
atch
of
50%
5
Med
icai
d Fr
aud
Cont
rol U
nits
(MFC
U)6
$145
––
–$1
45–
–M
edic
aid
surv
ey a
nd c
ertif
icat
ion
of
nurs
ing
and
inte
rmed
iate
car
e fa
cilit
ies6
326
––
–32
6–
–To
tal
$26,
019
$3,6
39$5
,668
$1,6
96$1
,581
$13,
458
-$23
Perc
ent o
f tot
al, e
xclu
sive
of c
olle
ctio
ns–
14.0
%21
.8%
6.5%
6.1%
51.7
%–
Not
es: F
Y is
fisc
al y
ear.
MM
IS is
Med
icai
d m
anag
emen
t inf
orm
atio
n sy
stem
. EH
R is
ele
ctro
nic
heal
th re
cord
. Inc
lude
s fe
dera
l and
sta
te fu
nds.
Exc
lude
s ad
min
istr
ativ
e ac
tiviti
es p
erfo
rmed
by
Med
icai
d m
anag
ed c
are
plan
s (w
hich
are
incl
uded
in th
e ca
pita
tion
paym
ents
that
sta
tes
mak
e to
thes
e pl
ans)
and
act
iviti
es th
at a
re e
xclu
sive
ly
fede
ral,
such
as
prog
ram
ove
rsig
ht b
y Ce
nter
s fo
r Med
icar
e &
Med
icai
d Se
rvic
es (C
MS)
sta
ff. C
olle
ctio
ns m
ay in
clud
e, fo
r exa
mpl
e, d
onat
ions
mad
e by
hos
pita
ls to
co
mpe
nsat
e fo
r the
cos
t of o
n-si
te s
tatio
ning
of s
tate
or l
ocal
Med
icai
d ag
ency
per
sonn
el to
det
erm
ine
elig
ibili
ty o
r pro
vide
out
reac
h. F
or m
ore
info
rmat
ion
on s
peci
fic
item
s no
ted
in th
is e
xhib
it, s
ee C
MS,
201
4, M
BES
CBES
cat
egor
y of
ser
vice
line
def
initi
ons
for t
he 6
4.10
bas
e fo
rm, h
ttps
://w
ww
.med
icai
d.go
v/m
edic
aid/
finan
cing
-and
-re
imbu
rsem
ent/
dow
nloa
ds/c
ms-
6410
-adm
in-c
ateg
ory-
of-s
ervi
ces-
defin
ition
-2-1
4.pd
f.
– D
ash
indi
cate
s ze
ro; $
0 or
-$0
indi
cate
an
amou
nt b
etw
een
$0.5
and
-$0.
5 m
illio
n th
at ro
unds
to z
ero.
1 N
ot a
ll st
ates
had
cer
tifie
d th
eir C
MS-
64 F
inan
cial
Man
agem
ent R
epor
t (FM
R) s
ubm
issi
ons
as o
f May
24,
201
6. C
alifo
rnia
’s fi
rst,
seco
nd, t
hird
, and
four
th q
uart
er
subm
issi
ons
are
not c
ertif
ied;
Col
orad
o an
d N
orth
Dak
ota’
s se
cond
, thi
rd, a
nd fo
urth
qua
rter
sub
mis
sion
s ar
e no
t cer
tifie
d; N
ew J
erse
y’s
third
and
four
th q
uart
er s
ubm
issi
ons
are
not c
ertif
ied.
Fig
ures
pre
sent
ed in
this
exh
ibit
may
cha
nge
if st
ates
revi
se th
eir e
xpen
ditu
re d
ata
afte
r thi
s da
te.
2 In
clud
es d
esig
n an
d de
velo
pmen
t of s
yste
ms
(90
perc
ent f
eder
al m
atch
), op
erat
ion
of a
ppro
ved
syst
ems
(75
perc
ent)
, and
oth
er c
osts
(50
perc
ent)
.3
Incl
udes
EH
R in
cent
ive
paym
ents
to p
rovi
ders
(100
per
cent
fede
ral m
atch
) and
adm
inis
trat
ion
of p
aym
ents
(90
perc
ent)
.4
Incl
udes
ski
lled
med
ical
pro
fess
iona
ls, p
read
mis
sion
scr
eeni
ng a
nd re
side
nt re
view
, med
ical
and
util
izat
ion
revi
ew, e
xter
nal i
ndep
ende
nt re
view
, sur
vey
and
cert
ifica
tion,
an
d M
FCU
ope
ratio
ns (a
ll at
75
perc
ent f
eder
al m
atch
); tr
ansl
atio
n an
d in
terp
reta
tion
serv
ices
for c
hild
ren
and
plan
ning
act
iviti
es fo
r the
Hea
lth H
ome
bene
fit (b
oth
at m
atch
eq
ual t
o a
stat
e’s
fede
ral m
edic
al a
ssis
tanc
e pe
rcen
tage
); el
igib
ility
cha
nges
ass
ocia
ted
with
the
Tem
pora
ry A
ssis
tanc
e fo
r Nee
dy F
amili
es p
rogr
am (7
5 or
90
perc
ent)
; ad
min
istr
atio
n of
fam
ily p
lann
ing
serv
ices
(90
perc
ent)
; and
imm
igra
tion
stat
us v
erifi
catio
n sy
stem
s (1
00 p
erce
nt).
Excl
udes
MM
IS a
nd e
ligib
ility
sys
tem
s, w
hich
are
incl
uded
in
thei
r ow
n ca
tego
ries.
5 Ex
clud
es M
MIS
and
elig
ibili
ty s
yste
ms,
whi
ch a
re in
clud
ed in
thei
r ow
n ca
tego
ries.
6 St
ate-
leve
l est
imat
es fo
r MFC
Us
and
surv
ey a
nd c
ertif
icat
ion
are
avai
labl
e bu
t are
not
incl
uded
in th
e CM
S-64
dat
a th
at M
ACPA
C ty
pica
lly u
ses
to a
naly
ze M
edic
aid
spen
ding
.
Sour
ces:
For
sta
te a
nd te
rrito
ry s
pend
ing:
MAC
PAC,
201
6, a
naly
sis
of C
MS-
64 F
MR
net e
xpen
ditu
re d
ata
as o
f May
24,
201
6; fo
r MCF
Us
and
surv
ey a
nd c
ertif
icat
ion:
CM
S,
2016
, Fis
cal y
ear 2
017
just
ifica
tion
of e
stim
ates
for a
ppro
pria
tions
com
mitt
ees,
Bal
timor
e, M
D: C
MS,
htt
p://
ww
w.c
ms.
gov/
Abou
t-CM
S/Ag
ency
-Info
rmat
ion/
Perf
orm
ance
Budg
et/
Dow
nloa
ds/F
Y201
7-CJ
-Fin
al.p
df.

MACStats: Medicaid and CHIP Data Book 81
Section 3: Program Enrollment and Spending—CHIP
MAC
Stat
sSe
ctio
n 3
Stat
eCH
IP a
nd M
edic
aid
CHIP
-fun
ded
cove
rage
Med
icai
d-fu
nded
co
vera
geTo
tal
Med
icai
d ex
pans
ion
Sepa
rate
CH
IPTo
tal1
Tota
lTo
tal
45,2
31,3
154,
702,
185
3,68
9,81
78,
397,
651
36,8
33,6
64Al
abam
a79
1,28
545
,697
87,3
4613
3,04
365
8,24
2Al
aska
97,7
1910
,182
–10
,182
87,5
37Ar
izon
a98
1,35
737
,412
1,39
938
,811
942,
546
Arka
nsas
476,
893
108,
706
3,36
511
2,07
136
4,82
2Ca
lifor
nia2
6,80
0,80
21,
787,
470
124,
658
1,91
2,12
84,
888,
674
Colo
rado
588,
343
23,6
8762
,446
86,1
3350
2,21
0Co
nnec
ticut
390,
560
–24
,884
24,8
8436
5,67
6De
law
are
116,
637
238
16,1
4116
,379
100,
258
Dist
rict o
f Col
umbi
a99
,886
10,6
76–
10,6
7689
,210
Flor
ida
2,69
2,43
813
4,70
829
3,38
642
8,09
42,
264,
344
Geo
rgia
1,57
2,48
353
,906
176,
909
230,
815
1,34
1,66
8H
awai
i17
0,31
427
,239
–27
,239
143,
075
Idah
o23
6,70
38,
937
25,5
7634
,513
202,
190
Illin
ois
1,87
1,26
511
3,10
521
7,46
633
0,57
11,
540,
694
Indi
ana
790,
232
69,4
6231
,098
100,
560
689,
672
Iow
a41
7,07
621
,777
60,8
8082
,657
334,
419
Kans
as32
7,22
354
77,0
8577
,139
250,
084
Kent
ucky
612,
492
50,9
2636
,050
86,9
7652
5,51
6Lo
uisi
ana
820,
777
122,
878
12,7
3613
5,61
468
5,16
3M
aine
189,
181
13,4
408,
870
22,3
1016
6,87
1M
aryl
and
674,
417
142,
327
–14
2,32
753
2,09
0M
assa
chus
etts
373
7,38
779
,299
89,6
4216
8,94
156
8,44
6M
ichi
gan4
1,25
9,68
129
,226
90,4
7311
9,69
91,
139,
982
Min
neso
ta60
3,56
547
43,
361
3,83
559
9,73
0M
issi
ssip
pi53
4,98
830
,819
56,2
8687
,105
447,
883
Mis
sour
i65
7,36
338
,600
39,7
4478
,344
579,
019
Mon
tana
139,
807
16,0
0829
,253
45,2
6194
,546
Neb
rask
a22
7,39
955
,515
6,70
362
,218
165,
181
Nev
ada
414,
418
17,7
6344
,145
61,9
0835
2,51
0N
ew H
amps
hire
111,
139
16,6
51–
16,6
5194
,488
New
Jer
sey
970,
667
100,
826
114,
365
215,
191
755,
476
New
Mex
ico
416,
059
17,1
5540
17,1
9539
8,86
4N
ew Y
ork
2,92
4,44
023
5,94
539
4,78
763
0,73
22,
293,
708
Nor
th C
arol
ina
1,38
0,62
913
4,41
310
0,24
123
4,65
41,
145,
975
Nor
th D
akot
a66
,480
–4,
955
4,95
561
,525
EXH
IBIT
31.
Chi
ld E
nrol
lmen
t in
CHIP
and
Med
icai
d by
Sta
te, F
Y 20
15

December 201682
Section 3: Program Enrollment and Spending—CHIP
MAC
Stat
sSe
ctio
n 3
EXH
IBIT
31.
(co
ntin
ued)
Stat
eCH
IP a
nd M
edic
aid
CHIP
-fun
ded
cove
rage
Med
icai
d-fu
nded
co
vera
geTo
tal
Med
icai
d ex
pans
ion
Sepa
rate
CH
IPTo
tal1
Tota
lO
hio
1,54
4,42
918
1,10
0–
181,
100
1,36
3,32
9O
klah
oma
710,
552
174,
167
16,6
9119
0,85
851
9,69
4O
rego
n560
8,88
2–
121,
869
121,
869
487,
013
Penn
sylv
ania
1,53
5,59
164
,638
229,
704
294,
342
1,24
1,24
9Rh
ode
Isla
nd13
1,03
629
,948
1,37
631
,324
99,7
12So
uth
Caro
lina
718,
195
98,3
36–
98,3
3661
9,85
9So
uth
Dako
ta96
,980
12,4
413,
775
16,2
1680
,764
Tenn
esse
e92
5,67
117
,971
88,2
4410
6,21
581
9,45
6Te
xas
4,58
5,37
833
6,76
971
2,85
41,
049,
623
3,53
5,75
5U
tah
310,
061
27,7
6227
,523
55,2
8525
4,77
6Ve
rmon
t79
,484
4,76
6–
4,76
674
,718
Virg
inia
865,
234
86,5
5110
2,81
518
9,36
667
5,86
8W
ashi
ngto
n83
3,52
3–
46,0
3746
,037
787,
486
Wes
t Virg
inia
634
5,72
815
,242
33,0
3648
,278
297,
450
Wis
cons
in71
5,15
596
,973
71,6
0316
8,57
654
6,57
9W
yom
ing7
63,3
118
85,
649
57,6
62
Not
es: F
Y is
fisc
al y
ear.
Tota
l col
umn
refle
cts
child
ren
ever
enr
olle
d in
CH
IP o
r Med
icai
d du
ring
the
year
, eve
n if
for a
sin
gle
mon
th. M
ost s
tate
s co
unte
d ch
ildre
n w
ho w
ere
enro
lled
in m
ultip
le c
ateg
orie
s du
ring
the
year
(for
exa
mpl
e, in
Med
icai
d-fu
nded
cov
erag
e fo
r the
firs
t hal
f of t
he y
ear b
ut in
CH
IP-fu
nded
cov
erag
e fo
r the
sec
ond
half)
in th
e m
ost r
ecen
t cat
egor
y (s
tate
-spe
cific
exc
eptio
ns to
this
rule
are
not
ed b
elow
). M
edic
aid-
fund
ed c
hild
enr
ollm
ent s
how
n he
re in
clud
es a
ll ch
ildre
n, re
gard
less
of d
isab
ility
sta
tus;
in
oth
er M
ACSt
ats
exhi
bits
that
bre
ak e
nrol
lmen
t out
by
elig
ibili
ty g
roup
, chi
ldre
n qu
alify
ing
on th
e ba
sis
of d
isab
ility
may
be
coun
ted
in th
e di
sabl
ed c
ateg
ory
rath
er th
an th
e ch
ild c
ateg
ory.
Dat
a w
ere
repo
rted
by
indi
vidu
al s
tate
s as
of M
ay 2
, 201
6, a
nd m
ay b
e re
vise
d at
a la
ter d
ate.
– D
ash
indi
cate
s ze
ro.
1 To
tal e
xcee
ds th
e su
m o
f Med
icai
d ex
pans
ion
and
sepa
rate
CH
IP c
olum
ns d
ue to
onl
y to
tal C
HIP
enr
ollm
ent b
eing
repo
rted
for W
yom
ing.
2 Du
e to
repo
rtin
g sy
stem
upd
ates
, CH
IP e
nrol
lmen
t tot
als
are
estim
ates
as
a re
sult
of th
e ex
clus
ion
of c
erta
in u
nbor
n CH
IP e
nrol
lees
in re
port
ing.
3 Ce
rtai
n en
rolle
es w
ho s
houl
d ha
ve b
een
assi
gned
to C
HIP
wer
e as
sign
ed to
Med
icai
d be
ginn
ing
in th
e se
cond
qua
rter
of 2
014,
mak
ing
FY 2
015
tota
ls a
rtifi
cial
ly lo
w.
4 CH
IP-fu
nded
Med
icai
d en
rolle
es a
re in
clud
ed in
Med
icai
d en
rollm
ent c
ount
s, ra
ther
than
in C
HIP
for F
Y 20
15. T
here
fore
, the
CH
IP e
nrol
lmen
t tot
als
are
artif
icia
lly lo
w a
nd th
e M
edic
aid
enro
llmen
t tot
als
are
artif
icia
lly h
igh.
5 Ce
rtai
n en
rolle
es w
ho s
houl
d ha
ve b
een
assi
gned
to C
HIP
wer
e as
sign
ed to
Med
icai
d-fu
nded
cov
erag
e fo
r FY
2014
and
FY
2015
.6
Enro
llmen
t tot
als
are
artif
icia
lly h
igh
beca
use
child
ren
who
tran
sitio
ned
betw
een
CHIP
and
Med
icai
d ar
e re
porte
d in
bot
h pr
ogra
ms,
rath
er th
an th
e pr
ogra
m th
ey w
ere
last
enr
olle
d.7
The
Cent
ers
for M
edic
are
& M
edic
aid
Serv
ices
(CM
S) F
Y 20
15 c
hild
ren’
s en
rollm
ent r
epor
t con
side
rs th
ese
valu
es to
be
estim
ates
.8
Due
to in
cons
iste
ncie
s be
twee
n th
e St
atis
tical
Enr
ollm
ent D
ata
Syst
em (S
EDS)
dat
a an
d th
e CM
S FY
201
5 ch
ildre
n’s
enro
llmen
t rep
ort,
we
do n
ot re
port
enr
ollm
ent f
or
Med
icai
d ex
pans
ion
and
sepa
rate
CH
IP. W
e on
ly re
port
tota
l CH
IP e
nrol
lmen
t as
prov
ided
in th
e CM
S FY
201
5 ch
ildre
n’s
enro
llmen
t rep
ort.
Sour
ce: C
MS,
201
6, F
Y 20
15 n
umbe
r of c
hild
ren
ever
enr
olle
d in
Med
icai
d an
d CH
IP, h
ttp:
//w
ww
.med
icai
d.go
v/ch
ip/d
ownl
oads
/fy-
2015
-chi
ldre
ns-e
nrol
lmen
t-rep
ort.p
df a
nd
MAC
PAC,
201
6, a
naly
sis
of C
HIP
SED
S da
ta.

MACStats: Medicaid and CHIP Data Book 83
Section 3: Program Enrollment and Spending—CHIP
MAC
Stat
sSe
ctio
n 3
EXH
IBIT
32.
CH
IP S
pend
ing
by S
tate
, FY
2015
(mill
ions
)
Stat
e
Tota
l CH
IP
Bene
fits
Stat
e pr
ogra
m
adm
inis
trat
ion
Sect
ion
2105
(g)
spen
ding
2M
edic
aid-
expa
nsio
n CH
IPSe
para
te C
HIP
pro
gram
s an
d co
vera
ge o
f pre
gnan
t wom
en1
Tota
lFe
dera
lSt
ate
Tota
lFe
dera
lSt
ate
Tota
lFe
dera
lSt
ate
Tota
lFe
dera
lSt
ate
Fede
ral
Alab
ama
$267
.4$2
09.0
$58.
4$1
18.7
$92.
6$2
6.1
$141
.3$1
10.6
$30.
7$7
.4$5
.8$1
.6–
Alas
ka22
.114
.37.
721
.413
.97.
5–
––
0.6
0.4
0.2
–
Ariz
ona
118.
392
.126
.211
1.2
86.6
24.6
6.6
5.1
1.5
0.6
0.4
0.1
–
Arka
nsas
170.
013
5.4
34.6
167.
613
3.3
34.3
0.8
0.7
0.1
1.6
1.4
0.2
–
Calif
orni
a2,
216.
31,
440.
677
5.7
1,99
5.4
1,29
7.0
698.
413
2.2
86.0
46.3
88.6
57.6
31.0
–
Colo
rado
239.
415
7.3
82.0
112.
674
.038
.712
0.9
79.5
41.4
5.9
3.9
2.0
–
Conn
ectic
ut36
.634
.42.
2–
––
33.0
21.4
11.5
3.7
2.4
1.3
$10.
6
Dela
war
e42
.228
.613
.616
.611
.45.
324
.816
.78.
10.
80.
60.
3–
Dist
rict o
f Col
umbi
a23
.718
.75.
023
.318
.44.
9–
––
0.7
0.5
0.1
–
Flor
ida
581.
641
7.9
163.
714
8.2
106.
841
.437
5.4
269.
510
5.9
58.0
41.7
16.4
–
Geo
rgia
403.
030
9.6
93.4
96.9
74.3
22.6
274.
221
0.7
63.4
31.9
24.6
7.4
–
Haw
aii
49.2
32.7
16.5
46.3
30.8
15.5
––
–2.
92.
01.
0–
Idah
o61
.749
.512
.210
.08.
02.
049
.039
.39.
72.
72.
20.
5–
Illin
ois
437.
828
6.8
151.
011
4.0
74.4
39.6
288.
218
9.1
99.1
35.6
23.4
12.2
–
Indi
ana
157.
612
0.7
37.0
104.
379
.924
.547
.336
.211
.16.
04.
61.
4–
Iow
a15
3.3
105.
747
.634
.623
.810
.810
6.9
73.7
33.2
11.8
8.2
3.7
–
Kans
as11
6.0
80.8
35.2
––
–10
5.9
73.8
32.1
10.1
7.0
3.1
–
Kent
ucky
222.
017
4.8
47.2
130.
510
2.5
27.9
80.5
63.5
16.9
11.0
8.7
2.3
–
Loui
sian
a23
7.4
174.
363
.117
9.4
131.
747
.745
.533
.512
.112
.59.
23.
3–
Mai
ne31
.823
.48.
518
.713
.75.
012
.29.
03.
21.
00.
70.
3–
Mar
ylan
d31
3.2
203.
610
9.6
289.
018
7.9
101.
2–
––
24.2
15.7
8.5
–
Mas
sach
uset
ts58
1.3
377.
920
3.5
271.
617
6.6
95.1
251.
516
3.5
88.0
58.1
37.8
20.3
–
Mic
higa
n32
7.5
248.
978
.621
8.6
166.
352
.410
4.5
79.3
25.2
4.3
3.3
1.0
–
Min
neso
ta32
.546
.8-1
4.3
1.1
0.7
0.4
30.5
19.9
10.6
0.9
0.6
0.3
25.6
Mis
siss
ippi
235.
019
1.5
43.4
58.1
47.3
10.7
173.
714
1.6
32.1
3.2
2.6
0.6
–
Mis
sour
i17
1.8
127.
744
.110
6.3
79.1
27.2
48.4
35.9
12.4
17.1
12.7
4.4
–
Mon
tana
91.7
69.8
21.9
24.7
18.8
5.9
62.0
47.2
14.8
5.1
3.9
1.2
–
Neb
rask
a82
.555
.527
.067
.145
.222
.013
.59.
14.
41.
91.
30.
6–
Nev
ada
61.2
45.9
15.3
15.2
11.4
3.8
43.4
32.6
10.8
2.6
1.9
0.6
–

December 201684
Section 3: Program Enrollment and Spending—CHIP
MAC
Stat
sSe
ctio
n 3
Stat
e
Tota
l CH
IP
Bene
fits
Stat
e pr
ogra
m
adm
inis
trat
ion
Sect
ion
2105
(g)
spen
ding
2M
edic
aid-
expa
nsio
n CH
IPSe
para
te C
HIP
pro
gram
s an
d co
vera
ge o
f pre
gnan
t wom
en1
Tota
lFe
dera
lSt
ate
Tota
lFe
dera
lSt
ate
Tota
lFe
dera
lSt
ate
Tota
lFe
dera
lSt
ate
Fede
ral
New
Ham
pshi
re$2
9.0
$24.
8$4
.2$2
8.9
$18.
8$1
0.1
$0.0
$0.0
$0.0
$0.0
$0.0
$0.0
$6.0
New
Jer
sey
441.
928
7.6
154.
321
6.7
140.
875
.820
2.5
131.
970
.522
.714
.87.
9–
New
Mex
ico
116.
191
.524
.711
3.6
89.4
24.1
1.5
1.2
0.3
1.1
0.8
0.2
–
New
Yor
k1,
165.
475
7.7
407.
861
7.6
401.
421
6.2
532.
534
6.3
186.
315
.310
.05.
4–
Nor
th C
arol
ina
430.
332
7.6
102.
825
3.6
193.
160
.616
8.4
128.
240
.28.
36.
32.
0–
Nor
th D
akot
a22
.314
.57.
812
.48.
04.
38.
95.
83.
11.
00.
70.
4–
Ohi
o34
9.2
257.
991
.334
6.7
256.
190
.6–
––
2.5
1.9
0.7
–
Okl
ahom
a17
9.6
131.
847
.815
5.2
113.
841
.418
.913
.95.
05.
64.
11.
5–
Ore
gon
206.
315
4.4
51.9
5.3
4.0
1.3
186.
813
9.8
47.0
14.1
10.6
3.6
–
Penn
sylv
ania
388.
825
7.7
131.
163
.642
.221
.530
8.0
204.
110
3.8
17.2
11.4
5.8
–
Rhod
e Is
land
72.8
47.3
25.5
68.1
44.2
23.9
2.7
1.8
1.0
2.0
1.3
0.7
–
Sout
h Ca
rolin
a15
4.4
122.
431
.914
9.2
118.
530
.7–
––
5.2
3.9
1.3
–
Sout
h Da
kota
24.7
16.3
8.4
18.2
12.0
6.2
6.0
4.0
2.0
0.4
0.3
0.1
–
Tenn
esse
e20
5.5
155.
150
.452
.439
.612
.813
5.6
102.
333
.217
.513
.24.
3–
Texa
s1,
354.
195
6.4
397.
742
1.8
297.
812
3.9
866.
361
1.9
254.
466
.146
.719
.4–
Uta
h14
7.5
117.
030
.411
4.2
90.6
23.6
27.3
21.7
5.6
6.0
4.7
1.2
–
Verm
ont
9.5
13.6
-4.1
10.0
6.9
3.1
––
–0.
90.
70.
37.
0
Virg
inia
287.
718
7.0
100.
711
9.9
78.0
42.0
146.
495
.251
.321
.313
.97.
5–
Was
hing
ton
117.
912
5.3
-7.4
28.3
18.4
9.9
84.9
55.3
29.6
4.6
3.0
1.6
48.6
Wes
t Virg
inia
62.1
49.7
12.5
18.3
14.6
3.7
39.7
31.8
8.0
4.1
3.3
0.8
–
Wis
cons
in20
0.4
150.
549
.810
0.5
71.0
29.5
92.1
65.2
26.9
7.8
5.5
2.3
8.8
Wyo
min
g12
.07.
84.
21.
71.
10.
69.
56.
23.
30.
80.
50.
3–
Subt
otal
$13,
461.
4$9
,528
.0$3
,933
.4$7
,417
.6$5
,166
.6$2
,251
.0$5
,410
.1$3
,813
.8$1
,596
.3$6
35.5
$442
.3$1
93.2
$106
.6
Amer
ican
Sam
oa2.
11.
70.
42.
11.
70.
4–
––
––
––
Gua
m8.
15.
92.
28.
15.
92.
2–
––
––
––
N. M
aria
na Is
land
s1.
00.
90.
11.
00.
90.
1–
––
––
––
Puer
to R
ico
184.
112
8.9
55.1
184.
112
8.9
55.1
––
––
––
–
Virg
in Is
land
s5.
43.
81.
65.
43.
81.
6–
––
––
––
Tota
l$1
3,66
2.2
$9,6
69.3
$3,9
93.0
$7,6
18.4
$5,3
07.9
$2,3
10.5
$5,4
10.1
$3,8
13.8
$1,5
96.3
$635
.5$4
42.3
$193
.2$1
06.6
EXH
IBIT
32.
(co
ntin
ued)

MACStats: Medicaid and CHIP Data Book 85
Section 3: Program Enrollment and Spending—CHIP
MAC
Stat
sSe
ctio
n 3
Not
es: F
Y is
fisc
al y
ear.
Com
pone
nts
may
not
add
to to
tal d
ue to
roun
ding
. Fed
eral
CH
IP s
pend
ing
on a
dmin
istr
atio
n is
gen
eral
ly li
mite
d to
10
perc
ent o
f a s
tate
’s to
tal f
eder
al
CHIP
spe
ndin
g fo
r the
yea
r. St
ates
with
a M
edic
aid-
expa
nsio
n CH
IP p
rogr
am m
ay e
lect
to re
ceiv
e re
imbu
rsem
ent f
or a
dmin
istr
ativ
e sp
endi
ng fr
om M
edic
aid
rath
er th
an C
HIP
fu
nds;
Med
icai
d fu
nds
are
not s
how
n in
this
exh
ibit.
– D
ash
indi
cate
s ze
ro; 0
.0%
indi
cate
s an
am
ount
less
than
0.0
5% th
at ro
unds
to z
ero.
1 Fo
ur s
tate
s (C
olor
ado,
New
Jer
sey,
Rhod
e Is
land
, and
Virg
inia
) use
CH
IP fu
nds
to p
rovi
de c
over
age
for p
regn
ant w
omen
.2
Sect
ion
2105
(g) o
f the
Soc
ial S
ecur
ity A
ct p
erm
its 1
1 qu
alify
ing
stat
es to
use
CH
IP fu
nds
to p
ay th
e di
ffer
ence
bet
wee
n th
e re
gula
r Med
icai
d m
atch
ing
rate
and
the
enha
nced
CH
IP m
atch
ing
rate
for M
edic
aid-
enro
lled,
Med
icai
d-fin
ance
d ch
ildre
n w
hose
fam
ily in
com
e ex
ceed
s 13
3 pe
rcen
t of t
he fe
dera
l pov
erty
leve
l. Al
thou
gh th
ese
are
CHIP
fund
s, th
ey e
ffec
tivel
y re
duce
sta
te s
pend
ing
on c
hild
ren
in M
edic
aid
and
do n
ot re
quire
a s
tate
mat
ch w
ithin
the
CHIP
pro
gram
. In
case
s w
here
the
sum
of 2
105(
g)
fede
ral C
HIP
spe
ndin
g (f
or M
edic
aid
enro
llees
) and
regu
lar f
eder
al C
HIP
spe
ndin
g (f
or C
HIP
enr
olle
es) e
xcee
ds to
tal s
pend
ing
for C
HIP
enr
olle
es, s
tate
s ar
e sh
own
in th
is ta
ble
as h
avin
g ne
gativ
e st
ate
CHIP
spe
ndin
g (M
inne
sota
, Ver
mon
t, an
d W
ashi
ngto
n).
Sour
ce: M
ACPA
C, 2
015,
ana
lysi
s of
Med
icai
d an
d CH
IP B
udge
t Exp
endi
ture
Sys
tem
dat
a fr
om C
ente
rs fo
r Med
icar
e &
Med
icai
d Se
rvic
es a
s of
Dec
embe
r 30,
201
5.
EXH
IBIT
32.
(co
ntin
ued)

December 201686
Section 3: Program Enrollment and Spending—CHIP
MAC
Stat
sSe
ctio
n 3
Stat
eFY
201
4 fe
dera
l CH
IP a
llotm
ents
1FY
201
5 fe
dera
l CH
IP a
llotm
ents
FY 2
016
fede
ral C
HIP
allo
tmen
ts2
Alab
ama
$173
.1
$172
.9
$267
.6
Alas
ka21
.8
23.9
20
.4
Ariz
ona
145.
4 80
.7
123.
7 Ar
kans
as10
9.7
94.0
17
4.5
Calif
orni
a1,
377.
3 1,
744.
1 1,
995.
2 Co
lora
do14
0.5
157.
5 22
8.3
Conn
ectic
ut43
.9
48.1
61
.9
Dela
war
e16
.7
20.3
38
.5
Dist
rict o
f Col
umbi
a16
.3
20.7
25
.6
Flor
ida
382.
3 56
6.0
595.
0 G
eorg
ia30
0.9
410.
6 41
8.2
Haw
aii
27.5
46
.3
46.3
Id
aho
38.2
66
.2
66.4
Ill
inoi
s29
2.8
361.
4 40
6.2
Indi
ana
153.
9 16
2.9
165.
7 Io
wa
98.3
12
6.0
147.
6 Ka
nsas
58.9
85
.1
112.
2 Ke
ntuc
ky15
7.2
171.
9 23
2.0
Loui
sian
a18
2.9
180.
1 23
8.9
Mai
ne33
.5
27.4
32
.3
Mar
ylan
d17
0.5
234.
3 29
0.8
Mas
sach
uset
ts35
1.6
413.
8 53
5.8
Mic
higa
n358
.2
118.
6 32
3.9
Min
neso
ta34
.1
41.1
98
.6
Mis
siss
ippi
188.
0 22
6.2
246.
7 M
isso
uri
130.
7 16
3.2
172.
9 M
onta
na68
.2
91.7
95
.8
Neb
rask
a64
.4
69.7
78
.2
Nev
ada
33.5
43
.1
63.3
N
ew H
amps
hire
19.3
20
.0
39.2
N
ew J
erse
y68
0.3
344.
8 40
6.8
New
Mex
ico
132.
0 73
.6
122.
5 N
ew Y
ork
677.
3 97
2.8
1,07
4.6
Nor
th C
arol
ina
323.
7 39
5.0
448.
2 N
orth
Dak
ota
18.8
21
.0
21.2
O
hio
357.
1 34
2.8
352.
6
EXH
IBIT
33.
Fed
eral
CH
IP A
llotm
ents
, FY
2016
(mill
ions
)

MACStats: Medicaid and CHIP Data Book 87
Section 3: Program Enrollment and Spending—CHIP
MAC
Stat
sSe
ctio
n 3
Stat
eFY
201
4 fe
dera
l CH
IP a
llotm
ents
1FY
201
5 fe
dera
l CH
IP a
llotm
ents
FY 2
016
fede
ral C
HIP
allo
tmen
ts2
Okl
ahom
a$1
21.9
$1
73.1
$1
89.2
O
rego
n15
2.9
193.
5 21
1.3
Penn
sylv
ania
324.
9 37
1.1
364.
3 Rh
ode
Isla
nd42
.0
46.0
65
.4
Sout
h Ca
rolin
a10
4.7
142.
9 16
2.0
Sout
h Da
kota
20.8
18
.9
23.6
Te
nnes
see
212.
9 19
8.1
213.
3 Te
xas
955.
8 1,
068.
7 1,
345.
1 U
tah
66.8
59
.1
148.
9 Ve
rmon
t13
.9
15.6
29
.3
Virg
inia
198.
3 24
7.6
265.
2 W
ashi
ngto
n10
3.3
129.
0 21
5.3
Wes
t Virg
inia
51.3
55
.2
65.4
W
isco
nsin
109.
5 22
1.2
225.
8 W
yom
ing
11.5
11
.4
10.9
Su
btot
al
$9,5
69.5
$1
1,08
9.2
$13,
302.
8 Am
eric
an S
amoa
1.4
1.7
2.1
Gua
m4.
8 5.
9 8.
0 N
. Mar
iana
Isla
nds
1.0
1.2
1.0
Puer
to R
ico
141.
0 18
3.2
179.
8 Vi
rgin
Isla
nds
0.0
5.0
5.3
Tota
l $9
,717
.7
$11,
286.
1 $1
3,49
9.2
Not
es: F
Y is
fisc
al y
ear.
1 Th
ese
amou
nts
refle
ct in
crea
ses
prov
ided
to A
rizon
a, M
onta
na, N
ebra
ska,
and
New
Yor
k fo
r app
rove
d pr
ogra
m e
xpan
sion
s de
scrib
ed in
Sec
tion
2104
(m)(
7) o
f the
Soc
ial
Secu
rity
Act (
the
Act)
.2
Per s
tatu
te, F
Y 20
15 a
nd F
Y 20
16 fe
dera
l CH
IP a
llotm
ents
wer
e bo
th b
ased
on
each
sta
te's
prio
r-yea
r fed
eral
CH
IP s
pend
ing.
In a
dditi
on b
ecau
se a
23
perc
enta
ge p
oint
in
crea
se in
the
CHIP
mat
chin
g ra
te w
ent i
nto
effe
ct in
FY
2016
, the
FY
2016
allo
tmen
ts w
ere
calc
ulat
ed b
y in
crea
sing
fede
ral C
HIP
spe
ndin
g by
eac
h st
ate
in F
Y 20
15 a
s if
the
23 p
erce
ntag
e po
int i
ncre
ase
in th
e CH
IP m
atch
ing
rate
had
bee
n in
eff
ect i
n FY
201
5. T
he F
Y 20
16 a
llotm
ent i
ncre
ase
fact
or w
as th
en a
pplie
d, w
hich
was
app
roxi
mat
ely
5 pe
rcen
t for
mos
t sta
tes.
3
In F
Y 20
15, M
ichi
gan
was
poi
sed
to e
xhau
st it
s fe
dera
l CH
IP a
llotm
ents
. As
a re
sult,
the
stat
e re
ques
ted
and
qual
ified
for f
eder
al C
HIP
con
tinge
ncy
fund
s to
talin
g $5
2.6
mill
ion
(§21
04(n
) of t
he A
ct).
Beca
use
the
cont
inge
ncy
fund
pay
men
t was
insu
ffic
ient
to e
limin
ate
the
stat
e's s
hort
fall,
Mic
higa
n al
so q
ualif
ied
for $
61.5
mill
ion
in
redi
strib
utio
n fu
nds
(§21
04(f
) of t
he A
ct).
The
com
bina
tion
of c
ontin
genc
y an
d re
dist
ribut
ion
fund
s el
imin
ated
the
stat
e's s
hort
fall.
The
onl
y ot
her s
tate
to e
ver q
ualif
y fo
r co
ntin
genc
y fu
nds
was
Iow
a, in
FY
2011
, whi
ch d
id n
ot th
en re
quire
redi
strib
utio
n fu
nds.
Sour
ce: C
ente
rs fo
r Med
icar
e &
Med
icai
d Se
rvic
es, 2
016,
com
mun
icat
ion
with
MAC
PAC
staf
f, Fe
brua
ry 2
4, 2
016.
EXH
IBIT
33.
(co
ntin
ued)


SECTION 4
Medicaid and CHIP Eligibility

December 201690
Section 4: Medicaid and CHIP Eligibility
Section 4: Medicaid and CHIP Eligibility
Key Points• More than half of states are now covering non-disabled low-income adults, a new Medicaid
eligibility group created under the Patient Protection and Affordable Care Act (ACA, P.L. 111-148, as amended) (Exhibit 35). Most of these new adults are eligible at incomes up to 138 percent of the federal poverty level (FPL). This amounts to $16,394 for a single individual in 2016 (Exhibit 37).
• Beginning in 2014, Medicaid and State Children's Health Insurance Program (CHIP) eligibility levels for most child and adult populations reflect the application of uniform modified adjusted gross income (MAGI) rules across states. A maintenance of effort provision prevents states from lowering their existing eligibility levels for children through the end of fiscal year (FY) 2019 (Exhibits 34 and 35).
• Eligibility criteria for individuals eligible for Medicaid on the basis of disability and for individuals age 65 and older, who are not subject to MAGI rules, were largely unchanged between 2015 and 2016 (Exhibit 36).
• In 2016, in the lower 48 states and the District of Columbia, 100 percent FPL is $11,880 for an individual plus $4,140–$4,160 for each additional family member, depending on the size of the family (Exhibit 37).

MACStats: Medicaid and CHIP Data Book 91
Section 4: Medicaid and CHIP Eligibility
MAC
Stat
s
Stat
e
Med
icai
d co
vera
ge
CHIP
pro
gram
type
2 (a
s of
Jul
y 1,
201
6)
Sepa
rate
CH
IP
cove
rage
Med
icai
d/CH
IP
cove
rage
Infa
nts
unde
r age
1Ag
e 1–
5Ag
e 6–
18Bi
rth
thro
ugh
age
183
Unb
orn
child
ren3
Preg
nant
wom
en
and
deem
ed
new
born
s4M
edic
aid
fund
ed1
CHIP
fu
nded
1M
edic
aid
fund
ed1
CHIP
fu
nded
1M
edic
aid
fund
ed1
CHIP
fu
nded
1
Alab
ama
141%
–14
1%–
141%
107–
141%
Com
bina
tion
312%
–14
1%Al
aska
17
715
9–20
3%17
715
9–20
3%17
712
4–20
3M
edic
aid
expa
nsio
n–
–20
0Ar
izon
a14
7–
141
–13
310
4–13
3Co
mbi
natio
n20
05–
156
Arka
nsas
142
–14
2–
142
107–
142
Com
bina
tion
211
209%
209
Calif
orni
a20
820
8–26
114
214
2–26
113
310
8–26
1Co
mbi
natio
n31
7631
720
8Co
lora
do
142
–14
2–
142
108–
142
Com
bina
tion
260
–19
5/26
0Co
nnec
ticut
19
6–
196
–19
6–
Sepa
rate
318
–25
8De
law
are
212
194–
212
142
–13
311
0–13
3Co
mbi
natio
n21
27–
212
Dist
rict o
f Col
umbi
a31
920
6–31
931
914
6–31
931
911
2–31
9M
edic
aid
expa
nsio
n–
–31
9Fl
orid
a20
619
2–20
614
0–
133
112–
133
Com
bina
tion
2107
–19
1G
eorg
ia
205
–14
9–
133
113–
133
Com
bina
tion
247
–22
0H
awai
i 19
119
1–30
813
913
9–30
813
310
5–30
8M
edic
aid
expa
nsio
n–
–19
1Id
aho
142
–14
2–
133
107–
133
Com
bina
tion
185
–13
3Ill
inoi
s 14
2–
142
–14
210
8–14
2Co
mbi
natio
n31
320
820
8In
dian
a 20
815
7–20
815
814
1–15
815
810
6–15
8Co
mbi
natio
n25
0–
208
Iow
a37
524
0–37
516
7–
167
122–
167
Com
bina
tion
3027
–37
5Ka
nsas
16
6–
149
–13
311
3–13
3Co
mbi
natio
n23
8–
166
Kent
ucky
19
5–
142
142–
159
133
109–
159
Com
bina
tion
213
–19
5Lo
uisi
ana
142
142–
212
142
142–
212
142
108–
212
Com
bina
tion
250
209
133
Mai
ne
191
–15
714
0–15
715
713
2–15
7Co
mbi
natio
n20
8–
209
Mar
ylan
d 19
419
4–31
713
813
8–31
713
310
9–31
7M
edic
aid
expa
nsio
n–
–25
9M
assa
chus
etts
200
185–
200
150
133–
150
150
114–
150
Com
bina
tion
300
200
200
Mic
higa
n 19
519
5–21
216
014
3–21
216
010
9–21
2M
edic
aid
expa
nsio
n–
195
195
Min
neso
ta27
527
5–28
3827
5–
275
–Co
mbi
natio
n–
278
278
Mis
siss
ippi
19
4–
143
–13
310
7–13
3Co
mbi
natio
n20
9–
194
Mis
sour
i19
6–
148
148–
150
148
110–
150
Com
bina
tion
300
300
196/
300
Mon
tana
143
–14
3–
133
109–
143
Com
bina
tion
261
–15
7N
ebra
ska
162
162–
213
145
145–
213
133
109–
213
Com
bina
tion
–19
719
4N
evad
a16
0–
160
–13
312
2–13
3Co
mbi
natio
n20
0–
160
New
Ham
pshi
re
196
196–
318
196
196–
318
196
196–
318
Med
icai
d ex
pans
ion
––
196
New
Jer
sey
194
–14
2–
142
107–
142
Com
bina
tion
350
–19
4/20
0N
ew M
exic
o 24
020
0–30
024
020
0–30
019
013
8–24
0M
edic
aid
expa
nsio
n–
–25
0
EXH
IBIT
34.
Med
icai
d an
d CH
IP In
com
e El
igib
ility
Lev
els
as a
Per
cent
age
of th
e FP
L fo
r Chi
ldre
n an
d Pr
egna
nt W
omen
by
Stat
e,
July
201
6
Sect
ion
4

December 201692
Section 4: Medicaid and CHIP Eligibility
MAC
Stat
sSe
ctio
n 4
EXH
IBIT
34.
(co
ntin
ued)
Stat
e
Med
icai
d co
vera
ge
CHIP
pro
gram
type
2 (a
s of
Jul
y 1,
201
6)
Sepa
rate
CH
IP
cove
rage
Med
icai
d/CH
IP
cove
rage
Infa
nts
unde
r age
1Ag
e 1–
5Ag
e 6–
18Bi
rth
thro
ugh
age
183
Unb
orn
child
ren3
Preg
nant
wom
en
and
deem
ed
new
born
s4M
edic
aid
fund
ed1
CHIP
fu
nded
1M
edic
aid
fund
ed1
CHIP
fu
nded
1M
edic
aid
fund
ed1
CHIP
fu
nded
1
New
Yor
k 21
8%19
6–21
8%14
9%–
149%
110–
149%
Com
bina
tion
400%
–21
8%N
orth
Car
olin
a 21
019
4–21
021
014
1–21
0%13
310
7–13
3Co
mbi
natio
n21
19–
196
Nor
th D
akot
a14
7–
147
–13
311
1–13
3Co
mbi
natio
n17
0–
147
Ohi
o15
614
1–20
615
614
1–20
615
610
7–20
6M
edic
aid
expa
nsio
n–
–20
0O
klah
oma
205
169–
205
205
151–
205
205
115–
205
Com
bina
tion
–20
5%13
3O
rego
n 18
513
3–18
513
3–
133
100–
133
Com
bina
tion
300
185
185
Penn
sylv
ania
21
5–
157
–13
311
9–13
3Co
mbi
natio
n31
4–
215
Rhod
e Is
land
190
190–
261
142
142–
261
133
109–
261
Com
bina
tion
–25
319
0/25
3So
uth
Caro
lina
194
194–
208
143
143–
208
133
107–
208
Med
icai
d ex
pans
ion
––
194
Sout
h Da
kota
18
217
7–18
218
217
7–18
218
212
4–18
2Co
mbi
natio
n20
4–
133
Tenn
esse
e1019
5–
142
–13
310
9–13
3Co
mbi
natio
n25
025
019
5Te
xas
198
–14
4–
133
109–
133
Com
bina
tion
201
202
198
Uta
h13
9–
139
–13
310
5–13
3Co
mbi
natio
n20
0–
139
Verm
ont
312
237–
312
312
237–
312
312
237–
312
Med
icai
d ex
pans
ion
––
208
Virg
inia
143
–14
3–
143
109–
143
Com
bina
tion
200
–14
3/20
0W
ashi
ngto
n 21
0–
210
–21
0–
Sepa
rate
312
193
193
Wes
t Virg
inia
15
8–
141
–13
310
8–13
3Co
mbi
natio
n30
0–
158
Wis
cons
in
301
–18
6–
133
101–
151
Com
bina
tion
3017
301
301
Wyo
min
g 15
4–
154
–13
311
9–13
3Co
mbi
natio
n20
0–
154
Not
es: F
PL is
fede
ral p
over
ty le
vel.
In 2
016,
100
per
cent
FPL
is $
11,8
80 fo
r an
indi
vidu
al p
lus
$4,1
40–
$4,1
60 fo
r eac
h ad
ditio
nal f
amily
mem
ber i
n th
e lo
wer
48
stat
es a
nd
the
Dist
rict o
f Col
umbi
a. W
hen
dete
rmin
ing
Med
icai
d an
d CH
IP e
ligib
ility
prio
r to
2014
, sta
tes
had
the
flexi
bilit
y to
dis
rega
rd in
com
e so
urce
s an
d am
ount
s of
thei
r cho
osin
g.
Begi
nnin
g in
201
4, u
nifo
rm m
odifi
ed a
djus
ted
gros
s in
com
e (M
AGI)
rule
s m
ust b
e us
ed to
det
erm
ine
Med
icai
d an
d CH
IP e
ligib
ility
for m
ost n
on-d
isab
led
child
ren
and
adul
ts
unde
r age
65,
incl
udin
g th
e gr
oups
sho
wn
in th
is ta
ble.
As
a re
sult,
sta
tes
are
now
requ
ired
to u
se M
AGI-c
onve
rted
elig
ibili
ty le
vels
that
acc
ount
for t
he c
hang
e in
inco
me-
coun
ting
rule
s. T
he e
ligib
ility
leve
ls s
how
n in
this
tabl
e re
flect
thes
e M
AGI-c
onve
rted
leve
ls o
r ano
ther
MAG
I-bas
ed in
com
e lim
it in
eff
ect i
n ea
ch s
tate
for t
hese
gro
ups
as
of J
uly
2016
. Und
er fe
dera
l reg
ulat
ions
, the
eff
ectiv
e in
com
e lim
its m
ay b
e hi
gher
by
5 pe
rcen
tage
poi
nts
of th
e FP
L th
an th
ose
show
n on
this
tabl
e to
acc
ount
for a
gen
eral
in
com
e di
sreg
ard
that
app
lies
to a
n in
divi
dual
’s d
eter
min
atio
n of
elig
ibili
ty fo
r Med
icai
d an
d CH
IP o
vera
ll, ra
ther
than
for p
artic
ular
elig
ibili
ty g
roup
s w
ithin
Med
icai
d or
CH
IP.
Med
icai
d co
vera
ge o
f chi
ldre
n un
der a
ge 1
9 w
ith in
com
es b
elow
sta
tes’
elig
ibili
ty le
vels
in e
ffec
t as
of M
arch
31,
199
7, c
ontin
ues
to b
e fin
ance
d by
Med
icai
d (T
itle
XIX)
fund
ing.
An
y ex
pans
ion
of e
ligib
ility
to u
nins
ured
chi
ldre
n ab
ove
thos
e le
vels
—th
roug
h ex
pans
ions
of M
edic
aid
or th
roug
h se
para
te C
HIP
pro
gram
s—is
gen
eral
ly fi
nanc
ed b
y CH
IP
(Titl
e XX
I) fu
ndin
g. C
HIP
fund
ing
is n
ot p
erm
itted
for c
hild
ren
with
oth
er c
over
age.
Thu
s, w
here
Med
icai
d co
vera
ge in
this
tabl
e sh
ows
over
lapp
ing
elig
ibili
ty le
vels
for M
edic
aid
fund
ing
and
CHIP
fund
ing,
chi
ldre
n w
ith n
o ot
her c
over
age
are
fund
ed b
y CH
IP, w
hile
chi
ldre
n w
ith o
ther
cov
erag
e ar
e fu
nded
by
Med
icai
d. P
regn
ant w
omen
can
rece
ive
Med
icai
d- o
r CH
IP-fu
nded
ser
vice
s th
roug
h re
gula
r sta
te p
lan
elig
ibili
ty p
athw
ays
or th
roug
h Se
ctio
n 11
15 w
aive
rs; i
n ad
ditio
n, th
e un
born
chi
ldre
n of
pre
gnan
t wom
en m
ay
rece
ive
CHIP
-fund
ed c
over
age
unde
r a s
tate
pla
n op
tion.
Dee
med
new
born
s ar
e in
fant
s up
to a
ge 1
who
are
dee
med
elig
ible
for M
edic
aid
or C
HIP
—w
ith n
o se
para
te a
pplic
atio
n or
elig
ibili
ty d
eter
min
atio
n re
quire
d—if
thei
r mot
her w
as e
nrol
led
at th
e tim
e of
thei
r birt
h.

MACStats: Medicaid and CHIP Data Book 93
Section 4: Medicaid and CHIP Eligibility
MAC
Stat
sSe
ctio
n 4
EXH
IBIT
34.
(co
ntin
ued)
– D
ash
indi
cate
s th
at s
tate
doe
s no
t use
this
elig
ibili
ty p
athw
ay.
1 U
nder
Med
icai
d fu
nded
, the
re is
no
low
er b
ound
for i
ncom
e el
igib
ility
. The
elig
ibili
ty le
vels
list
ed u
nder
Med
icai
d fu
nded
are
the
high
est i
ncom
e le
vels
und
er w
hich
eac
h ag
e gr
oup
of c
hild
ren
is c
over
ed u
nder
the
Med
icai
d st
ate
plan
, whe
re e
ither
all
or ju
st in
sure
d ch
ildre
n ar
e cl
aim
ed w
ith M
edic
aid
fund
ing.
The
elig
ibili
ty le
vels
list
ed u
nder
CH
IP fu
nded
are
the
inco
me
leve
ls to
whi
ch M
edic
aid
has
expa
nded
with
CH
IP fu
ndin
g si
nce
its c
reat
ion
in 1
997.
For
sta
tes
that
hav
e di
ffer
ent C
HIP
-fund
ed e
ligib
ility
leve
ls
for c
hild
ren
age
6 th
roug
h 13
and
age
14
thro
ugh
18, t
his
tabl
e sh
ows
only
the
leve
ls fo
r chi
ldre
n ag
e 6
thro
ugh
13. I
n ad
ditio
n, S
ectio
n 21
05(g
) of t
he S
ocia
l Sec
urity
Act
pe
rmits
11
qual
ifyin
g st
ates
to u
se C
HIP
fund
s to
pay
the
diff
eren
ce b
etw
een
the
regu
lar M
edic
aid
mat
chin
g ra
te a
nd th
e en
hanc
ed C
HIP
mat
chin
g ra
te fo
r Med
icai
d-en
rolle
d,
Med
icai
d-fin
ance
d un
insu
red
child
ren
who
se fa
mily
inco
me
exce
eds
133
perc
ent F
PL (n
ot s
epar
atel
y no
ted
on th
is ta
ble)
.2
Und
er C
HIP
, sta
tes
have
the
optio
n to
use
an
expa
nsio
n of
Med
icai
d, a
sep
arat
e CH
IP p
rogr
am, o
r a c
ombi
natio
n of
bot
h ap
proa
ches
. Ten
sta
tes
(incl
udin
g th
e Di
stric
t of
Colu
mbi
a) a
re M
edic
aid
expa
nsio
ns a
nd 2
sta
tes
are
sepa
rate
CH
IP o
nly
(Con
nect
icut
and
Was
hing
ton)
. Thi
rty-
nine
sta
tes
are
com
bina
tion
prog
ram
s—an
d am
ong
thos
e, 1
1 co
nsid
er th
emse
lves
to h
ave
sepa
rate
pro
gram
s bu
t are
tech
nica
lly c
ombi
natio
ns d
ue to
the
tran
sitio
n of
chi
ldre
n be
low
133
per
cent
FPL
from
sep
arat
e CH
IP to
Med
icai
d (A
laba
ma,
Ariz
ona,
Geo
rgia
, Kan
sas,
Mis
siss
ippi
, Ore
gon,
Pen
nsyl
vani
a, T
exas
, Uta
h, W
est V
irgin
ia, W
yom
ing)
.3
Sepa
rate
CH
IP e
ligib
ility
for c
hild
ren
birt
h th
roug
h ag
e 18
gen
eral
ly b
egin
s w
here
Med
icai
d co
vera
ge e
nds
(as
show
n in
the
prev
ious
col
umns
). Fo
r unb
orn
child
ren,
ther
e is
no
low
er b
ound
for i
ncom
e el
igib
ility
if th
e m
othe
r is
not e
ligib
le fo
r Med
icai
d.4
Preg
nant
wom
en c
an b
e co
vere
d w
ith M
edic
aid
or C
HIP
fund
ing.
Und
er C
HIP
, cov
erag
e ca
n be
thro
ugh
a st
ate
plan
opt
ion
for t
arge
ted
low
-inco
me
preg
nant
wom
en o
r th
roug
h co
ntin
uatio
n of
an
exis
ting
Sect
ion
1115
wai
ver.
Whe
n tw
o va
lues
are
sho
wn
in th
is c
olum
n, th
e fir
st is
for M
edic
aid
and
the
seco
nd is
for C
HIP
.5
Ariz
ona
clos
ed it
s se
para
te C
HIP
pro
gram
(Kid
sCar
e) to
new
enr
ollm
ent i
n Ja
nuar
y 20
10. T
he s
tate
rein
stat
ed th
e pr
ogra
m o
n Se
ptem
ber 1
, 201
6.6
Calif
orni
a ha
s a
sepa
rate
CH
IP p
rogr
am in
thre
e co
untie
s on
ly th
at c
over
s ch
ildre
n up
to 3
17 p
erce
nt F
PL.
7 Th
e se
para
te C
HIP
pro
gram
s in
Del
awar
e, F
lorid
a, Io
wa,
and
Wis
cons
in c
over
chi
ldre
n ag
e 1–
18.
8 In
Min
neso
ta, o
nly
infa
nts
(def
ined
by
the
stat
e as
bei
ng u
nder
age
2) a
re e
ligib
le fo
r the
Med
icai
d-ex
pans
ion
CHIP
pro
gram
up
to 2
83 p
erce
nt F
PL.
9 N
orth
Car
olin
a’s
sepa
rate
CH
IP p
rogr
am c
over
s ch
ildre
n ag
e 6–
18.
10 W
hile
Ten
ness
ee c
over
s ch
ildre
n w
ith C
HIP
-fund
ed M
edic
aid,
enr
ollm
ent i
s cu
rren
tly c
appe
d, e
xcep
t for
chi
ldre
n w
ho ro
ll ov
er fr
om tr
aditi
onal
Med
icai
d.
Sour
ces:
MAC
PAC,
201
6, a
naly
sis
of C
ente
rs fo
r Med
icar
e &
Med
icai
d Se
rvic
es (C
MS)
, 201
6, S
tate
Med
icai
d an
d CH
IP in
com
e el
igib
ility
sta
ndar
ds (F
or s
elec
ted
MAG
I Gro
ups,
bas
ed
on s
tate
dec
isio
ns a
s of
Jun
e 1,
201
6), h
ttps
://w
ww
.med
icai
d.go
v/m
edic
aid-
chip
-pro
gram
-info
rmat
ion/
prog
ram
-info
rmat
ion/
med
icai
d-an
d-ch
ip-e
ligib
ility
-leve
ls/m
edic
aid-
chip
-el
igib
ility
-leve
ls.h
tml;
MAC
PAC,
201
6, a
naly
sis
of s
tate
web
site
s; M
ACPA
C, 2
015,
ana
lysi
s of
CM
S, 2
015,
MAG
I con
vers
ion
plan
s an
d SI
PP-b
ased
MAG
I con
vers
ion
resu
lts, h
ttp:
//w
ww
.med
icai
d.go
v/m
edic
aid-
chip
-pro
gram
-info
rmat
ion/
by-s
tate
/by-
stat
e.ht
ml;
MAC
PAC,
201
5, a
naly
sis
of C
MS,
201
5, M
edic
aid
stat
e pl
an a
men
dmen
ts, h
ttp://
ww
w.m
edic
aid.
gov/
stat
e-re
sour
ce-c
ente
r/m
edic
aid-
stat
e-pl
an-a
men
dmen
ts/m
edic
aid-
stat
e-pl
an-a
men
dmen
ts.h
tml;
MAC
PAC,
201
5, a
naly
sis
of C
MS,
201
5, C
HIP
sta
te p
lan
amen
dmen
ts, h
ttp:
//w
ww
.med
icai
d.go
v/ch
ip/s
tate
-pro
gram
-info
rmat
ion/
chip
-sta
te-p
rogr
am-in
form
atio
n.ht
ml;
MAC
PAC,
201
5, a
naly
sis
of C
MS,
201
5, C
hild
ren’
s H
ealth
Insu
ranc
e Pr
ogra
m: P
lan
activ
ity
as o
f May
1, 2
015,
htt
p://
ww
w.m
edic
aid.
gov/
chip
/dow
nloa
ds/c
hip-
map
; and
MAC
PAC,
201
5, a
naly
sis
of C
MS,
201
5, e
mai
l to
MAC
PAC
staf
f, O
ctob
er 2
9.
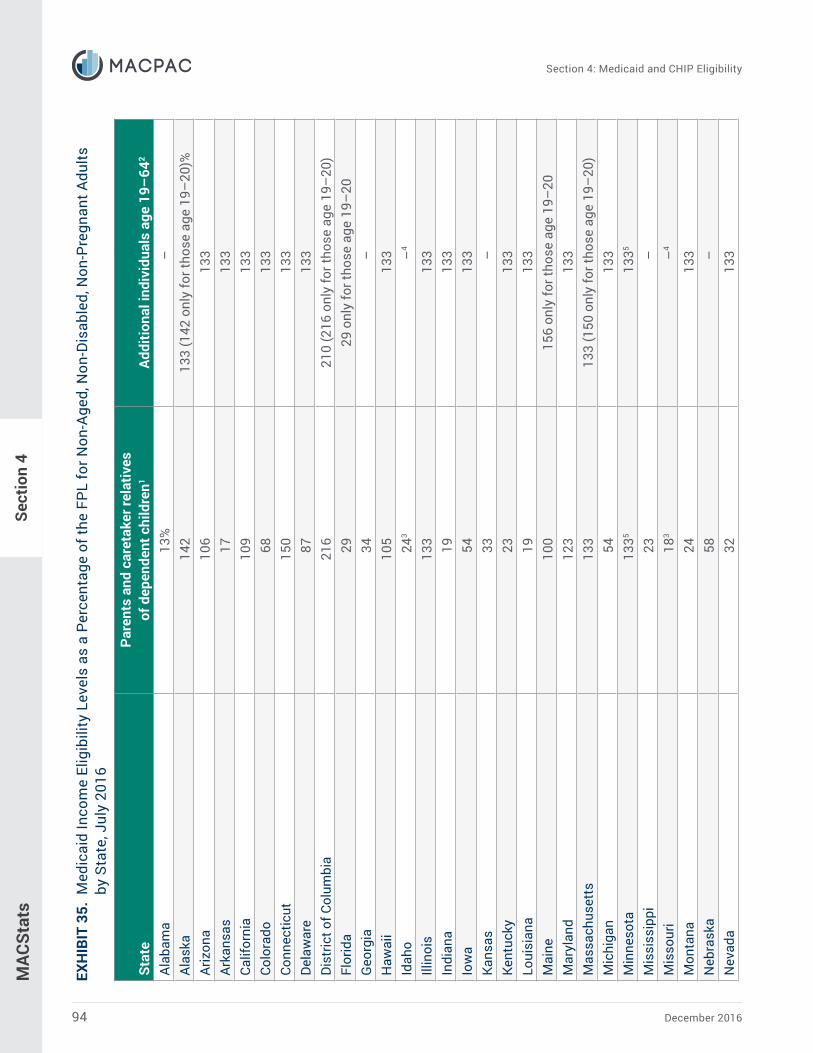
December 201694
Section 4: Medicaid and CHIP Eligibility
MAC
Stat
sSe
ctio
n 4
EXH
IBIT
35.
Med
icai
d In
com
e El
igib
ility
Lev
els
as a
Per
cent
age
of th
e FP
L fo
r Non
-Age
d, N
on-D
isab
led,
Non
-Pre
gnan
t Adu
lts
by S
tate
, Jul
y 20
16
Stat
ePa
rent
s an
d ca
reta
ker r
elat
ives
of
dep
ende
nt c
hild
ren1
Addi
tiona
l ind
ivid
uals
age
19–
642
Alab
ama
13%
–Al
aska
142
133
(142
onl
y fo
r tho
se a
ge 1
9–20
)%Ar
izon
a10
613
3Ar
kans
as17
133
Calif
orni
a10
913
3Co
lora
do68
133
Conn
ectic
ut15
013
3De
law
are
8713
3Di
stric
t of C
olum
bia
216
210
(216
onl
y fo
r tho
se a
ge 1
9–20
)Fl
orid
a29
29 o
nly
for t
hose
age
19–
20G
eorg
ia34
–H
awai
i10
513
3Id
aho
243
–4
Illin
ois
133
133
Indi
ana
1913
3Io
wa
5413
3Ka
nsas
33–
Kent
ucky
2313
3Lo
uisi
ana
1913
3M
aine
100
156
only
for t
hose
age
19–
20M
aryl
and
123
133
Mas
sach
uset
ts13
313
3 (1
50 o
nly
for t
hose
age
19–
20)
Mic
higa
n54
133
Min
neso
ta13
3513
35
Mis
siss
ippi
23–
Mis
sour
i18
3–
4
Mon
tana
2413
3N
ebra
ska
58–
Nev
ada
3213
3

MACStats: Medicaid and CHIP Data Book 95
Section 4: Medicaid and CHIP Eligibility
MAC
Stat
sSe
ctio
n 4
Stat
ePa
rent
s an
d ca
reta
ker r
elat
ives
of
dep
ende
nt c
hild
ren1
Addi
tiona
l ind
ivid
uals
age
19–
642
New
Ham
pshi
re68
%13
3%N
ew J
erse
y32
133
New
Mex
ico
4613
3N
ew Y
ork
1335
1335
Nor
th C
arol
ina
4444
onl
y fo
r tho
se a
ge 1
9–20
Nor
th D
akot
a52
133
Ohi
o90
133
Okl
ahom
a41
3–
4
Ore
gon
4013
3Pe
nnsy
lvan
ia33
133
Rhod
e Is
land
116
133
Sout
h Ca
rolin
a62
–So
uth
Dako
ta57
–Te
nnes
see
103
–Te
xas
15–
Uta
h44
3–
4
Verm
ont
5313
3Vi
rgin
ia49
–W
ashi
ngto
n40
133
Wes
t Virg
inia
1913
3W
isco
nsin
9595
Wyo
min
g55
–
Not
es: F
PL is
fede
ral p
over
ty le
vel.
In 2
016,
100
per
cent
FPL
is $
11,8
80 fo
r an
indi
vidu
al p
lus
$4,1
40–
$4,1
60 fo
r eac
h ad
ditio
nal f
amily
mem
ber i
n th
e lo
wer
48
stat
es a
nd
the
Dist
rict o
f Col
umbi
a. W
hen
dete
rmin
ing
Med
icai
d an
d CH
IP e
ligib
ility
prio
r to
2014
, sta
tes
had
the
flexi
bilit
y to
dis
rega
rd in
com
e so
urce
s an
d am
ount
s of
thei
r cho
osin
g.
Begi
nnin
g in
201
4, u
nifo
rm m
odifi
ed a
djus
ted
gros
s in
com
e (M
AGI)
rule
s m
ust b
e us
ed to
det
erm
ine
Med
icai
d an
d CH
IP e
ligib
ility
for m
ost n
on-d
isab
led
child
ren
and
adul
ts
unde
r age
65,
incl
udin
g th
e gr
oups
sho
wn
in th
is ta
ble.
As
a re
sult,
sta
tes
are
now
requ
ired
to u
se M
AGI-c
onve
rted
elig
ibili
ty le
vels
that
acc
ount
for t
he c
hang
e in
inco
me-
coun
ting
rule
s. T
he e
ligib
ility
leve
ls s
how
n in
this
tabl
e re
flect
thes
e M
AGI-c
onve
rted
leve
ls o
r ano
ther
MAG
I-bas
ed in
com
e lim
it in
eff
ect i
n ea
ch s
tate
for t
hese
gro
ups
as
of J
uly
2016
. Und
er fe
dera
l reg
ulat
ions
, the
eff
ectiv
e in
com
e lim
its m
ay b
e hi
gher
by
5 pe
rcen
tage
poi
nts
of th
e FP
L th
an th
ose
show
n on
this
tabl
e to
acc
ount
for a
gen
eral
in
com
e di
sreg
ard
that
app
lies
to a
n in
divi
dual
’s d
eter
min
atio
n of
elig
ibili
ty fo
r Med
icai
d an
d CH
IP o
vera
ll, ra
ther
than
for p
artic
ular
elig
ibili
ty g
roup
s w
ithin
Med
icai
d or
CH
IP.
EXH
IBIT
35.
(co
ntin
ued)

December 201696
Section 4: Medicaid and CHIP Eligibility
MAC
Stat
s
Stat
es a
re re
quire
d to
pro
vide
Med
icai
d co
vera
ge fo
r par
ents
and
oth
er c
aret
aker
rela
tives
(and
thei
r dep
ende
nt c
hild
ren)
, at a
min
imum
, at t
heir
1988
Aid
to F
amili
es w
ith
Depe
nden
t Chi
ldre
n el
igib
ility
leve
ls. U
nder
regu
lar M
edic
aid
stat
e pl
an ru
les,
sta
tes
may
opt
to c
over
add
ition
al p
aren
ts a
nd c
aret
aker
rela
tives
; chi
ldre
n ag
e 19
or 2
0; a
nd
othe
r ind
ivid
uals
age
d 19
–64
who
are
not
pre
gnan
t, no
t elig
ible
for M
edic
are,
and
hav
e in
com
es a
t or b
elow
133
per
cent
of t
he fe
dera
l pov
erty
leve
l. St
ates
may
als
o pr
ovid
e co
vera
ge u
nder
Sec
tion
1115
wai
vers
, whi
ch a
llow
them
to o
pera
te th
eir M
edic
aid
prog
ram
s w
ithou
t reg
ard
to c
erta
in s
tatu
tory
requ
irem
ents
. As
note
d in
this
tabl
e, th
e co
vere
d be
nefit
s un
der t
hese
wai
vers
may
be
mor
e lim
ited
than
thos
e pr
ovid
ed u
nder
regu
lar s
tate
pla
n ru
les
and
may
not
be
avai
labl
e to
all
indi
vidu
als
at th
e in
com
e le
vels
sh
own.
– D
ash
indi
cate
s th
at s
tate
doe
s no
t use
this
elig
ibili
ty p
athw
ay.
1 In
sta
tes
that
use
dol
lar a
mou
nts
rath
er th
an p
erce
ntag
es o
f the
FPL
to d
eter
min
e el
igib
ility
for p
aren
ts, t
hose
am
ount
s w
ere
conv
erte
d to
a p
erce
nt o
f the
FPL
for 2
016,
and
th
e hi
ghes
t per
cent
age
was
sel
ecte
d to
refle
ct e
ligib
ility
leve
l for
the
grou
p.2
Refle
cts
stat
e pl
an c
over
age
unde
r Sec
tion
1902
(a)(
10)(
A)(i)
(VIII
) of t
he S
ocia
l Sec
urity
Act
for i
ndiv
idua
ls w
ho a
re a
ge 1
9–64
, not
pre
gnan
t, no
t elig
ible
for M
edic
are,
and
ha
ve in
com
e at
or b
elow
133
per
cent
FPL
; sta
te p
lan
cove
rage
for c
hild
ren
age
19 o
r 20
whe
re in
dica
ted;
and
Sec
tion
1115
wai
ver c
over
age
that
is n
ot s
ubje
ct to
the
limita
tions
in
dica
ted
in n
ote
4.3
Refle
cts
pare
nt c
over
age
unde
r the
Med
icai
d st
ate
plan
. The
sta
te h
as s
ome
addi
tiona
l cov
erag
e ab
ove
stat
e pl
an e
ligib
ility
sta
ndar
ds th
roug
h a
Sect
ion
1115
dem
onst
ratio
n or
a p
endi
ng d
emon
stra
tion
prop
osal
. The
dem
onst
ratio
n in
clud
es li
mita
tions
on
elig
ibili
ty o
r ben
efits
, is
not o
ffer
ed to
all
resi
dent
s of
the
stat
e, o
r inc
lude
s an
enr
ollm
ent c
ap.
4 Th
e st
ate
has
a Se
ctio
n 11
15 d
emon
stra
tion
or a
pen
ding
dem
onst
ratio
n pr
opos
al th
at p
rovi
des
Med
icai
d co
vera
ge to
som
e lo
w-in
com
e ad
ults
. The
dem
onst
ratio
n in
clud
es
limita
tions
on
elig
ibili
ty o
r ben
efits
, is
not o
ffer
ed to
all
resi
dent
s of
the
stat
e, o
r inc
lude
s an
enr
ollm
ent c
ap.
5 In
Min
neso
ta a
nd N
ew Y
ork,
indi
vidu
als
with
inco
mes
bet
wee
n 13
3 an
d 20
0 pe
rcen
t FPL
are
cov
ered
und
er th
e Ba
sic
Hea
lth P
rogr
am.
Sour
ces:
MAC
PAC,
201
6, a
naly
sis
of C
ente
rs fo
r Med
icar
e &
Med
icai
d Se
rvic
es, 2
016,
Sta
te M
edic
aid
and
CHIP
inco
me
elig
ibili
ty s
tand
ards
(For
sel
ecte
d M
AGI G
roup
s, b
ased
on
sta
te d
ecis
ions
as
of J
une
1, 2
016)
, htt
ps:/
/ww
w.m
edic
aid.
gov/
med
icai
d-ch
ip-p
rogr
am-in
form
atio
n/pr
ogra
m-in
form
atio
n/m
edic
aid-
and-
chip
-elig
ibili
ty-le
vels
/med
icai
d-ch
ip-
elig
ibili
ty-le
vels
.htm
l; an
d M
ACPA
C, 2
016,
ana
lysi
s of
sta
te w
ebsi
tes.
EXH
IBIT
35.
(co
ntin
ued)
Sect
ion
4
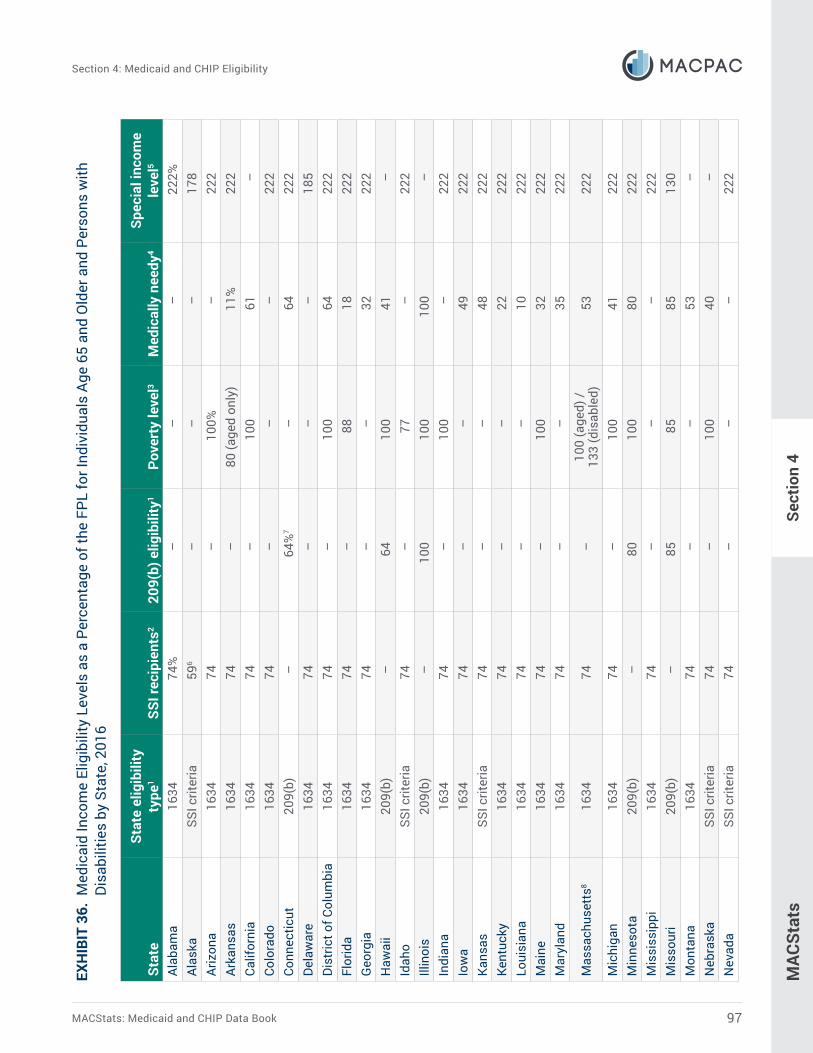
MACStats: Medicaid and CHIP Data Book 97
Section 4: Medicaid and CHIP Eligibility
MAC
Stat
s
Stat
eSt
ate
elig
ibili
ty
type
1SS
I rec
ipie
nts2
209(
b) e
ligib
ility
1Po
vert
y le
vel3
Med
ical
ly n
eedy
4Sp
ecia
l inc
ome
leve
l5
Alab
ama
1634
74%
––
–22
2%Al
aska
SSI c
riter
ia59
6–
––
178
Ariz
ona
1634
74–
100%
–22
2Ar
kans
as16
3474
–80
(age
d on
ly)
11%
222
Calif
orni
a16
3474
–10
061
–Co
lora
do16
3474
––
–22
2Co
nnec
ticut
209(
b)–
64%
7–
6422
2De
law
are
1634
74–
––
185
Dist
rict o
f Col
umbi
a16
3474
–10
064
222
Flor
ida
1634
74–
8818
222
Geo
rgia
1634
74–
–32
222
Haw
aii
209(
b)–
6410
041
–Id
aho
SSI c
riter
ia74
–77
–22
2Ill
inoi
s20
9(b)
–10
010
010
0–
Indi
ana
1634
74–
100
–22
2Io
wa
1634
74–
–49
222
Kans
asSS
I crit
eria
74–
–48
222
Kent
ucky
1634
74–
–22
222
Loui
sian
a16
3474
––
1022
2M
aine
1634
74–
100
3222
2M
aryl
and
1634
74–
–35
222
Mas
sach
uset
ts8
1634
74–
100
(age
d) /
133
(dis
able
d)53
222
Mic
higa
n16
3474
–10
041
222
Min
neso
ta20
9(b)
–80
100
8022
2M
issi
ssip
pi16
3474
––
–22
2M
isso
uri
209(
b)–
8585
8513
0M
onta
na16
3474
––
53–
Neb
rask
aSS
I crit
eria
74–
100
40–
Nev
ada
SSI c
riter
ia74
––
–22
2
EXH
IBIT
36.
Med
icai
d In
com
e El
igib
ility
Lev
els
as a
Per
cent
age
of th
e FP
L fo
r Ind
ivid
uals
Age
65
and
Old
er a
nd P
erso
ns w
ith
Disa
bilit
ies
by S
tate
, 201
6
Sect
ion
4

December 201698
Section 4: Medicaid and CHIP Eligibility
MAC
Stat
sSe
ctio
n 4
EXH
IBIT
36.
(co
ntin
ued)
Stat
eSt
ate
elig
ibili
ty
type
1SS
I rec
ipie
nts2
209(
b) e
ligib
ility
1Po
vert
y le
vel3
Med
ical
ly n
eedy
4Sp
ecia
l inc
ome
leve
l5
New
Ham
pshi
re20
9(b)
–75
%–
60%
222%
New
Jer
sey
1634
74%
–10
0%37
222
New
Mex
ico
1634
74–
––
222
New
Yor
k16
3474
–83
83–
Nor
th C
arol
ina
1634
74–
100
24–
Nor
th D
akot
a20
9(b)
–83
–83
–O
hio9
1634
74–
––
222
Okl
ahom
a9SS
I crit
eria
74–
100
–22
2O
rego
nSS
I crit
eria
74–
––
222
Penn
sylv
ania
1634
74–
100
4322
2Rh
ode
Isla
nd16
3474
–10
088
222
Sout
h Ca
rolin
a16
3474
–10
0–
222
Sout
h Da
kota
1634
74–
––
222
Tenn
esse
e16
3474
––
–22
2Te
xas
1634
74–
––
222
Uta
hSS
I crit
eria
74–
100
100
222
Verm
ont
1634
74–
–10
922
2Vi
rgin
ia20
9(b)
–74
8047
222
Was
hing
ton
1634
74–
–74
222
Wes
t Virg
inia
1634
74–
–20
222
Wis
cons
in16
3474
–83
6022
2W
yom
ing
1634
74–
––
222
Not
es: F
PL is
fede
ral p
over
ty le
vel.
SSI i
s Su
pple
men
tal S
ecur
ity In
com
e. 2
09(b
) ref
ers
to S
ectio
n 20
9(b)
of t
he S
ocia
l Sec
urity
Am
endm
ents
of 1
972;
163
4 re
fers
to S
ectio
n 16
34 o
f the
Soc
ial S
ecur
ity A
ct. I
n 20
16, 1
00 p
erce
nt F
PL is
$11
,880
for a
n in
divi
dual
and
$4,
140–
$4,1
60 fo
r eac
h ad
ditio
nal f
amily
mem
ber i
n th
e lo
wer
48
stat
es a
nd th
e Di
stric
t of C
olum
bia.
Elig
ibili
ty le
vels
sho
wn
here
app
ly to
cou
ntab
le in
com
e; a
s a
resu
lt, s
tate
s th
at u
se o
ptio
nal i
ncom
e di
sreg
ards
to re
duce
cou
ntab
le in
com
e ef
fect
ivel
y al
low
a la
rger
num
ber o
f peo
ple
to q
ualif
y at
a g
iven
elig
ibili
ty le
vel (
e.g.
, 100
per
cent
FPL
) rel
ativ
e to
sta
tes
that
do
not.
The
elig
ibili
ty le
vels
list
ed in
this
tabl
e ar
e fo
r in
divi
dual
s; th
e el
igib
ility
leve
ls fo
r cou
ples
diff
er fo
r cer
tain
cat
egor
ies.
In a
dditi
on, i
ncom
e el
igib
ility
leve
ls fo
r ind
ivid
uals
who
qua
lify
base
d on
blin
dnes
s m
ay b
e hi
gher
than
fo
r ind
ivid
uals
who
qua
lify
base
d on
oth
er d
isab
ilitie
s or
bei
ng a
ge 6
5 or
old
er.
In m
ost s
tate
s, e
nrol
lmen
t in
the
SSI p
rogr
am fo
r ind
ivid
uals
age
65
and
olde
r and
per
sons
with
dis
abili
ties
auto
mat
ical
ly q
ualif
ies
them
for M
edic
aid.
How
ever
, 209
(b) s
tate
s m
ay u
se m
ore
rest
rictiv
e cr
iteria
(rel
ated
to in
com
e an
d as
sets
, dis
abili
ty, o
r bot
h) th
an S
SI w
hen
dete
rmin
ing
Med
icai
d el
igib
ility
. All
stat
es h
ave
the
optio
n of
cov
erin
g ad
ditio
nal p
eopl
e w
ith lo
w in
com
es o
r hig
h m
edic
al e
xpen
ses
thro
ugh
othe
r elig
ibili
ty p
athw
ays,
suc
h as
pov
erty
leve
l, m
edic
ally
nee
dy, a
nd s
peci
al in
com
e le
vel.

MACStats: Medicaid and CHIP Data Book 99
Section 4: Medicaid and CHIP Eligibility
MAC
Stat
sSe
ctio
n 4
1 SS
I crit
eria
are
use
d to
det
erm
ine
Med
icai
d el
igib
ility
in b
oth
1634
and
SSI
-crit
eria
sta
tes.
In 1
634
stat
es, t
he fe
dera
l elig
ibili
ty d
eter
min
atio
n pr
oces
s fo
r SSI
aut
omat
ical
ly
qual
ifies
an
indi
vidu
al fo
r Med
icai
d; in
SSI
-crit
eria
sta
tes,
indi
vidu
als
mus
t sub
mit
info
rmat
ion
to th
e st
ate
for a
sep
arat
e el
igib
ility
det
erm
inat
ion.
209
(b) s
tate
s m
ay u
se
elig
ibili
ty c
riter
ia (r
elat
ed to
inco
me
and
asse
ts, d
isab
ility
, or b
oth)
mor
e re
stric
tive
than
the
SSI p
rogr
am b
ut m
ay n
ot u
se m
ore
rest
rictiv
e cr
iteria
than
thos
e in
eff
ect i
n th
e st
ate
on J
anua
ry 1
, 197
2. If
a 2
09(b
) sta
te d
oes
not h
ave
a se
para
te m
edic
ally
nee
dy s
tand
ard,
it m
ust a
llow
indi
vidu
als
with
hig
her i
ncom
es to
spe
nd d
own
to th
e 20
9(b)
in
com
e le
vel s
how
n he
re b
y de
duct
ing
incu
rred
med
ical
exp
ense
s fr
om th
e am
ount
of i
ncom
e th
at is
cou
nted
for M
edic
aid
elig
ibili
ty p
urpo
ses.
2 Th
e SS
I fed
eral
ben
efit
rate
as
a pe
rcen
t of t
he F
PL d
ecre
ased
from
last
yea
r due
the
FPL
incr
easi
ng a
bout
1 p
erce
nt fr
om 2
015
to 2
016
whi
le th
e SS
I fed
eral
ben
efit
rate
did
no
t cha
nge.
3 U
nder
the
pove
rty
leve
l opt
ion,
sta
tes
may
cho
ose
to p
rovi
de M
edic
aid
cove
rage
to p
erso
ns w
ho a
re a
ged
or d
isab
led
and
who
se in
com
e is
abo
ve th
e SS
I or 2
09(b
) lev
el, b
ut
is a
t or b
elow
the
FPL.
4 U
nder
the
med
ical
ly n
eedy
opt
ion,
indi
vidu
als
with
hig
her i
ncom
es c
an s
pend
dow
n to
the
med
ical
ly n
eedy
inco
me
leve
l sho
wn
here
by
dedu
ctin
g in
curr
ed m
edic
al e
xpen
ses
from
the
amou
nt o
f inc
ome
that
is c
ount
ed fo
r Med
icai
d el
igib
ility
pur
pose
s. F
ive
stat
es (C
onne
ctic
ut, L
ouis
iana
, Mic
higa
n, V
erm
ont,
and
Virg
inia
) hav
e a
med
ical
ly n
eedy
in
com
e st
anda
rd th
at v
arie
s by
loca
tion;
the
high
est i
ncom
e st
anda
rd is
list
ed fo
r eac
h of
thes
e st
ates
.5
Und
er th
e sp
ecia
l inc
ome
leve
l opt
ion,
sta
tes
have
the
optio
n to
pro
vide
Med
icai
d be
nefit
s to
peo
ple
who
requ
ire a
t lea
st 3
0 da
ys o
f nur
sing
hom
e or
oth
er in
stitu
tiona
l car
e an
d ha
ve in
com
es u
p to
300
per
cent
of t
he S
SI b
enef
it ra
te (w
hich
was
abo
ut 2
22 p
erce
nt F
PL in
201
6). T
he in
com
e st
anda
rd li
sted
in th
is c
olum
n m
ay b
e fo
r ins
titut
iona
l se
rvic
es, h
ome
and
com
mun
ity-b
ased
wai
ver s
ervi
ces,
or b
oth.
6 Th
e do
llar a
mou
nt th
at e
qual
s th
e up
per i
ncom
e el
igib
ility
leve
l for
SSI
doe
s no
t var
y by
sta
te; h
owev
er, t
he d
olla
r am
ount
that
equ
als
the
FPL
is h
ighe
r in
Alas
ka, r
esul
ting
in
a lo
wer
per
cent
age.
7 Th
e in
com
e st
anda
rds
in C
onne
ctic
ut v
ary
by g
eogr
aphy
; the
hig
hest
inco
me
stan
dard
for r
egio
n A
is li
sted
. The
inco
me
stan
dard
in re
gion
s B
and
C is
53
perc
ent o
f FPL
.8
Mas
sach
uset
ts p
rovi
des
med
ical
ly n
eedy
cov
erag
e fo
r ind
ivid
uals
age
65
and
olde
r and
thos
e w
ho a
re e
ligib
le o
n th
e ba
sis
of d
isab
ility
, but
the
rule
s fo
r cou
ntin
g in
com
e an
d sp
end-
dow
n ex
pens
es v
ary
for t
hese
gro
ups.
9 O
klah
oma
was
a 2
09(b
) sta
te u
ntil
Oct
ober
1, 2
015,
at w
hich
poi
nt it
bec
ame
an S
SI-c
riter
ia s
tate
. Ohi
o w
as a
209
(b) s
tate
unt
il Au
gust
1, 2
016,
at w
hich
poi
nt it
bec
ame
a 16
34 s
tate
; the
sta
te a
lso
elim
inat
ed it
s m
edic
ally
nee
dy p
rogr
am d
urin
g th
e co
nver
sion
to 1
634
crite
ria.
Sour
ce: M
ACPA
C, 2
016,
ana
lysi
s of
elig
ibili
ty in
form
atio
n fr
om s
tate
web
site
s an
d M
edic
aid
stat
e pl
ans
as o
f Oct
ober
201
6.
EXH
IBIT
36.
(co
ntin
ued)

December 2016100
Section 4: Medicaid and CHIP Eligibility
MAC
Stat
s
Stat
eFP
L
Annu
al a
mou
ntM
onth
ly a
mou
nt
Fam
ily s
ize
Fam
ily s
ize
12
34
Each
ad
ditio
nal
pers
on1
12
34
Each
ad
ditio
nal
pers
on1
Low
er 4
8 st
ates
an
d th
e Di
stric
t of
Col
umbi
a
100%
$11,
880
$16,
020
$20,
160
$24,
300
$4,1
40–
$4,1
60$9
90$1
,335
$1,6
80$2
,025
$345
–$3
47
133
15,8
0021
,307
26,8
1332
,319
5,50
6–5,
533
1,31
71,
776
2,23
42,
693
459-
461
138
16,3
9422
,108
27,8
2133
,534
5,71
3–5,
741
1,36
61,
842
2,31
82,
795
476-
478
150
17,8
2024
,030
30,2
4036
,450
6,21
0–6,
240
1,48
52,
003
2,52
03,
038
518-
520
185
21,9
7829
,637
37,2
9644
,955
7,65
9–7,
696
1,83
22,
470
3,10
83,
746
638-
641
200
23,7
6032
,040
40,3
2048
,600
8,28
0–8,
320
1,98
02,
670
3,36
04,
050
690-
693
250
29,7
0040
,050
50,4
0060
,750
10,3
50–
10,4
002,
475
3,33
84,
200
5,06
386
3-86
7
300
35,6
4048
,060
60,4
8072
,900
12,4
20–
12,4
802,
970
4,00
55,
040
6,07
51,
035-
1,04
0
400
47,5
2064
,080
80,6
4097
,200
16,5
60–
16,6
403,
960
5,34
06,
720
8,10
01,
380-
1,38
7
Alas
ka10
0%$1
4,84
0$2
0,02
0$2
5,20
0$3
0,38
0$5
,180
–$5
,200
$1,2
37$1
,668
$2,1
00$2
,532
$432
-$43
3
133
19,7
3726
,627
33,5
1640
,405
6,88
9–6,
916
1,64
52,
219
2,79
33,
367
574-
576
138
20,4
7927
,628
34,7
7641
,924
7,14
8–7,
176
1,70
72,
302
2,89
83,
494
596-
598
150
22,2
6030
,030
37,8
0045
,570
7,77
0–7,
800
1,85
52,
503
3,15
03,
798
648-
650
185
27,4
5437
,037
46,6
2056
,203
9,58
3–9,
620
2,28
83,
086
3,88
54,
684
799-
802
200
29,6
8040
,040
50,4
0060
,760
10,3
60–
10,4
002,
473
3,33
74,
200
5,06
386
3-86
7
250
37,1
0050
,050
63,0
0075
,950
12,9
50–
13,0
003,
092
4,17
15,
250
6,32
91,
079-
1,08
3
300
44,5
2060
,060
75,6
0091
,140
15,5
40–
15,6
003,
710
5,00
56,
300
7,59
51,
295-
1,30
0
400
59,3
6080
,080
100,
800
121,
520
20,7
20–
20,8
004,
947
6,67
38,
400
10,1
271,
727-
1,73
3
EXH
IBIT
37.
Inc
ome
as a
Per
cent
age
of th
e FP
L fo
r Var
ious
Fam
ily S
izes
, 201
6
Sect
ion
4

MACStats: Medicaid and CHIP Data Book 101
Section 4: Medicaid and CHIP Eligibility
MAC
Stat
s
Stat
eFP
L
Annu
al a
mou
ntM
onth
ly a
mou
nt
Fam
ily s
ize
Fam
ily s
ize
12
34
Each
ad
ditio
nal
pers
on1
12
34
Each
ad
ditio
nal
pers
on1
Haw
aii
100%
$13,
670
$18,
430
$23,
190
$27,
950
$4,7
60–
$4,7
80$1
,139
$1,5
36$1
,933
$2,3
29$3
97-$
398
133
18,1
8124
,512
30,8
4337
,174
6,33
1–6,
357
1,51
52,
043
2,57
03,
098
528-
530
138
18,8
6525
,433
32,0
0238
,571
6,56
9–6,
596
1,57
22,
119
2,66
73,
214
547-
550
150
20,5
0527
,645
34,7
8541
,925
7,14
0–7,
170
1,70
92,
304
2,89
93,
494
595-
598
185
25,2
9034
,096
42,9
0251
,708
8,80
6–8,
843
2,10
72,
841
3,57
54,
309
734-
737
200
27,3
4036
,860
46,3
8055
,900
9,52
0–9,
560
2,27
83,
072
3,86
54,
658
793-
797
250
34,1
7546
,075
57,9
7569
,875
11,9
00–
11,9
502,
848
3,84
04,
831
5,82
399
2-99
6
300
41,0
1055
,290
69,5
7083
,850
14,2
80–
14,3
403,
418
4,60
85,
798
6,98
81,
190-
1,19
5
400
54,6
8073
,720
92,7
6011
1,80
019
,040
–19
,120
4,55
76,
143
7,73
09,
317
1,58
7-1,
593
Not
es: F
PL is
fede
ral p
over
ty le
vel.
The
FPLs
sho
wn
here
are
bas
ed o
n th
e U
.S. D
epar
tmen
t of H
ealth
and
Hum
an S
ervi
ces
2016
fede
ral p
over
ty g
uide
lines
. The
se d
iffer
slig
htly
fr
om th
e U
.S. C
ensu
s Bu
reau
’s fe
dera
l pov
erty
thre
shol
ds, w
hich
are
use
d m
ainl
y fo
r sta
tistic
al p
urpo
ses.
The
sep
arat
e po
vert
y gu
idel
ines
for A
lask
a an
d H
awai
i ref
lect
Off
ice
of E
cono
mic
Opp
ortu
nity
adm
inis
trat
ive
prac
tice
begi
nnin
g in
the
1966
–19
70 p
erio
d.
1 In
rare
circ
umst
ance
s, th
e ro
undi
ng a
nd s
tand
ardi
zing
adj
ustm
ents
in th
e up
date
form
ula
resu
lt in
sm
all d
ecre
ases
in th
e po
vert
y gu
idel
ines
for s
ome
hous
ehol
d si
zes
even
w
hen
the
infla
tion
fact
or is
not
neg
ativ
e. In
ord
er to
pre
vent
a re
duct
ion
in th
e gu
idel
ines
in th
ese
rare
circ
umst
ance
s, a
min
or a
djus
tmen
t was
impl
emen
ted
to th
e fo
rmul
a be
ginn
ing
in 2
016.
In c
ases
whe
re th
e ye
ar-to
-yea
r cha
nge
in in
flatio
n is
not
neg
ativ
e an
d th
e ro
undi
ng a
nd s
tand
ardi
zing
adj
ustm
ents
in th
e fo
rmul
a re
sult
in re
duct
ions
to th
e gu
idel
ines
from
the
prev
ious
yea
r for
som
e ho
useh
old
size
s, th
e gu
idel
ines
for t
he a
ffec
ted
hous
ehol
d si
zes
are
fixed
at t
he p
rior y
ear’s
gui
delin
es. F
or th
e lo
wer
48
stat
es a
nd
DC, t
he in
crea
se p
er p
erso
n is
$4,
140
for a
fam
ily s
ize
of fi
ve o
r six
, $4,
150
for a
fam
ily s
ize
of s
even
, and
$4,
160
for a
fam
ily s
ize
of e
ight
or m
ore.
For
Ala
ska,
the
incr
ease
per
pe
rson
is $
5,18
0 fo
r a fa
mily
siz
e of
five
, six
, or s
even
and
$5,
200
for a
fam
ily s
ize
of e
ight
or m
ore.
For
Haw
aii,
the
incr
ease
per
per
son
is $
4,76
0 fo
r a fa
mily
siz
e of
five
, six
, or
seve
n an
d $4
,780
for a
fam
ily s
ize
of e
ight
or m
ore.
Sour
ce: U
.S. D
epar
tmen
t of H
ealth
and
Hum
an S
ervi
ces
(HH
S), 2
016,
Ann
ual u
pdat
e of
the
HH
S po
vert
y gu
idel
ines
, Fed
eral
Reg
iste
r 81,
no.
15
(Jan
uary
25)
: 403
6–40
37.
EXH
IBIT
37.
(co
ntin
ued)
Sect
ion
4


SECTION 5
Beneficiary Health, Service Use, and Access to Care
December 2016104
Section 5: Beneficiary Health, Service Use, and Access to Care
Section 5: Beneficiary Health, Service Use, and Access to Care
Key Points• Children whose primary coverage source is Medicaid or the State Children's Health
Insurance Program (CHIP) are less likely to be in excellent or very good health than those who have private coverage or are uninsured (Exhibit 38). However, estimates of their use of services relative to other groups vary depending on the type of care and data source. For example, data from both the National Health Interview Survey (NHIS) and the Medical Expenditures Panel Survey (MEPS) indicate that children with Medicaid or CHIP are less likely than those with private coverage and more likely than those who are uninsured to have seen a dentist in the last 12 months. However, the percentage of children with Medicaid or CHIP reported as having seen a dentist differs substantially between the NHIS (80.9 percent in 2015) and MEPS (38.0 percent in 2014), with similar differences observed for children who have private coverage or are uninsured (Exhibits 39 and 40).
• Like children, adults age 19–64 whose primary coverage source is Medicaid or CHIP are less likely to be in excellent or very good health than those who have private coverage or are uninsured, and comparisons of their service use relative to other groups vary by data source. Adults age 19–64 whose primary coverage source is Medicare, who must meet federal disability criteria to receive coverage, report the poorest health and highest service use in this age group (Exhibits 42–44).
• Children whose primary coverage source is Medicaid or CHIP are reported as seeing a general doctor or having a well-child checkup at rates similar to those with private coverage (Exhibit 39). However, they are more likely to have trouble finding a doctor or delayed care than those with private coverage (Exhibit 41).
• Adults age 19–64 whose primary coverage is Medicaid report having a usual source of care at a similar rate as those with private coverage but are more likely to report having difficulties with access to care. Adults age 19–64 whose primary coverage source is Medicare report the highest rates of delayed care and unmet need due to cost when adults who are uninsured are excluded (Exhibit 45).
• Measures of use of care for specific types of services, reported in Exhibits 38–45, should be interpreted with caution due to the limitations of survey data and the characteristics of the populations examined. For example, these results are unadjusted for differences in age, health, income, race and ethnicity, and family and household characteristics that are known to explain some of the differences in access and use observed between individuals with different coverage sources. In addition, Exhibits 38–45 reflect an individual’s primary payer of care—individuals who have multiple coverage sources were assigned to a single source based on a hierarchy. For selected characteristics of individuals without the application of this hierarchy, see Exhibit 2.

MACStats: Medicaid and CHIP Data Book 105
Section 5: Beneficiary Health, Service Use, and Access to Care
MAC
Stat
sSe
ctio
n 5
Char
acte
ristic
sPr
imar
y co
vera
ge s
ourc
e at
tim
e of
inte
rvie
w1
Tota
lPr
ivat
e2M
edic
aid/
CHIP
3U
nins
ured
4
Tota
l (pe
rcen
t dis
trib
utio
n ac
ross
cov
erag
e so
urce
s)5
100.
0%54
.9%
36.5
%4.
7%Co
vera
geLe
ngth
of t
ime
with
any
cov
erag
e du
ring
the
year
Full
year
92.7
*97
.5*
95.5
–Pa
rt y
ear
4.9
2.5*
4.5
41.4
*N
o co
vera
ge d
urin
g ye
ar2.
5*–
–58
.6*
Dem
ogra
phic
sAg
e0–
530
.8*
28.9
*34
.320
.7*
6–11
31.8
*30
.7*
34.0
27.3
*12
–18
37.4
*40
.3*
31.7
51.9
*G
ende
rM
ale
51.1
50.4
51.6
49.7
Fem
ale
48.9
49.6
48.4
50.3
Race
His
pani
c24
.6*
14.7
*37
.243
.1W
hite
, non
-His
pani
c53
.7*
67.4
*34
.942
.9*
Blac
k, n
on-H
ispa
nic
14.6
*9.
9*22
.18.
3*O
ther
non
-whi
te, n
on-H
ispa
nic
7.1
8.0*
5.8
5.7
Pare
nts
pres
ent i
n fa
mily
Mot
her,
no fa
ther
23.2
*13
.3*
37.8
22.2
*Fa
ther
, no
mot
her
3.6
3.4
3.8
4.8
Both
pre
sent
69.9
*82
.1*
52.3
69.0
*N
o pa
rent
s3.
2*1.
2*6.
14.
1Fa
mily
inco
me
Has
inco
me
less
than
138
per
cent
FPL
31.1
*8.
5*63
.938
.9*
Has
inco
me
in ra
nges
sho
wn
belo
wLe
ss th
an 1
00 p
erce
nt F
PL21
.1*
4.2*
46.6
22.9
*10
0–19
9 pe
rcen
t FPL
23.0
*12
.6*
35.7
35.2
200–
399
perc
ent F
PL27
.6*
35.5
*14
.733
.0*
400
perc
ent F
PL o
r hig
her
28.1
*47
.6*
2.9
8.5*
EXH
IBIT
38.
Cov
erag
e, D
emog
raph
ic, a
nd H
ealth
Cha
ract
eris
tics
of N
on-In
stitu
tiona
lized
Indi
vidu
als
Age
0–18
by
Prim
ary
Sour
ce
of H
ealth
Cov
erag
e, 2
015

December 2016106
Section 5: Beneficiary Health, Service Use, and Access to Care
MAC
Stat
sSe
ctio
n 5
EXH
IBIT
38.
(co
ntin
ued)
Char
acte
ristic
sPr
imar
y co
vera
ge s
ourc
e at
tim
e of
inte
rvie
w1
Tota
lPr
ivat
e2M
edic
aid/
CHIP
3U
nins
ured
4
Oth
er d
emog
raph
ic c
hara
cter
istic
sCi
tizen
of U
nite
d St
ates
97.5
%98
.2%
97.7
%86
.9%
*Re
ceiv
es S
SI6
1.0*
0.4*
2.1
†Fa
mily
rece
ives
WIC
6.9*
1.4*
15.5
4.0*
Hea
lthCu
rren
t hea
lth s
tatu
sEx
celle
nt o
r ver
y go
od84
.3*
89.9
*76
.180
.9*
Goo
d14
.0*
9.2*
20.7
17.7
Fair
or p
oor
1.8*
0.9*
3.2
†Bo
dy M
ass
Inde
x (B
MI)7
Hea
lthy
wei
ght (
BMI l
ess
than
25)
75.9
*79
.2*
71.4
66.8
Ove
rwei
ght (
BMI 2
5–29
)16
.214
.4*
17.8
24.0
Obe
se (B
MI 3
0 or
hig
her)
7.9*
6.4*
10.8
9.3
Spec
ial n
eeds
, im
pairm
ents
, and
hea
lth c
ondi
tions
Has
spe
cial
hea
lth c
are
need
s821
.3*
19.0
*24
.815
.4*
Rece
ives
spe
cial
edu
catio
n or
ear
ly in
terv
entio
n se
rvic
es9
8.2
7.4*
9.5
3.6*
Has
impa
irmen
t req
uirin
g sp
ecia
l equ
ipm
ent
1.0
0.9
1.1
†H
as im
pairm
ent l
imiti
ng a
bilit
y to
cra
wl, w
alk,
run,
or p
lay9
1.3
1.1
1.6
†H
as im
pairm
ent l
imiti
ng a
bilit
y to
cra
wl,
wal
k, ru
n, o
r pl
ay th
at is
exp
ecte
d to
last
12+
mon
ths9
1.0
0.9
1.3
†Ev
er b
een
told
he
or s
he h
as s
elec
ted
cond
ition
sAD
HD/
ADD10
9.3*
8.4*
10.9
4.4*
Asth
ma
13.3
*12
.1*
15.2
13.4
Autis
m10
2.3
2.1
2.6
†Ce
rebr
al p
alsy
90.
3†
†–
Cong
enita
l hea
rt d
isea
se9
0.2
††
–Di
abet
es0.
3†
††
Dow
n sy
ndro
me9
0.1
††
†In
telle
ctua
l dis
abili
ty9
1.2
0.7*
1.7
†O
ther
dev
elop
men
tal d
elay
93.
43.
33.
6†

MACStats: Medicaid and CHIP Data Book 107
Section 5: Beneficiary Health, Service Use, and Access to Care
MAC
Stat
sSe
ctio
n 5
EXH
IBIT
38.
(co
ntin
ued)
Not
es: F
PL is
fede
ral p
over
ty le
vel.
SSI i
s Su
pple
men
tal S
ecur
ity In
com
e. W
IC is
Sup
plem
enta
l Nut
ritio
n Pr
ogra
m fo
r Wom
en, I
nfan
ts, a
nd C
hild
ren.
ADH
D is
att
entio
n de
ficit
hype
ract
ivity
dis
orde
r. AD
D is
att
entio
n de
ficit
diso
rder
. Per
cent
age
calc
ulat
ions
for e
ach
item
in th
e ex
hibi
t exc
lude
indi
vidu
als
with
mis
sing
and
unk
now
n va
lues
. The
indi
vidu
al
com
pone
nts
liste
d un
der t
he s
ubca
tego
ries
are
not a
lway
s m
utua
lly e
xclu
sive
and
may
not
add
to 1
00 p
erce
nt. S
tand
ard
erro
rs a
re a
vaila
ble
onlin
e in
the
dow
nloa
dabl
e Ex
cel
vers
ion
of th
is e
xhib
it at
htt
ps://
ww
w.m
acpa
c.go
v/pu
blic
atio
n/co
vera
ge-d
emog
raph
ic-a
nd-h
ealth
-cha
ract
eris
tics-
of-n
on-in
stitu
tiona
lized
-indi
vidu
als-
age-
0-18
-by-
prim
ary-
sour
ce-
of-h
ealth
-cov
erag
e/. D
ue to
diff
eren
ces
in m
etho
dolo
gy (s
uch
as th
e w
ordi
ng o
f que
stio
ns, l
engt
h of
reca
ll pe
riods
, and
pro
mpt
s or
pro
bes
used
to e
licit
resp
onse
s), e
stim
ates
ob
tain
ed fr
om d
iffer
ent s
urve
y da
ta s
ourc
es w
ill v
ary.
For
exa
mpl
e, th
e N
atio
nal H
ealth
Inte
rvie
w S
urve
y (N
HIS
) is
know
n to
pro
duce
hig
her e
stim
ates
of s
ervi
ce u
se th
an th
e M
edic
al E
xpen
ditu
res
Pane
l Sur
vey
(MEP
S). F
or p
urpo
ses
of c
ompa
ring
grou
ps o
f ind
ivid
uals
(as
in th
is e
xhib
it), t
he N
HIS
pro
vide
s th
e m
ost r
ecen
t inf
orm
atio
n av
aila
ble.
For
oth
er
purp
oses
, suc
h as
mea
surin
g le
vels
of u
se re
lativ
e to
a p
artic
ular
ben
chm
ark
or g
oal,
it m
ay b
e ap
prop
riate
to c
onsu
lt es
timat
es fr
om M
EPS
or a
noth
er s
ourc
e.
* Diff
eren
ce fr
om M
edic
aid/
CHIP
is s
tatis
tical
ly s
igni
fican
t at t
he 0
.05
leve
l.
† Es
timat
e is
unr
elia
ble
beca
use
it ha
s a
rela
tive
stan
dard
erro
r gre
ater
than
30
perc
ent.
– D
ash
indi
cate
s ze
ro; 0
.0%
indi
cate
s an
am
ount
less
than
0.0
5% th
at ro
unds
to z
ero.
1 To
tal i
nclu
des
all n
on-in
stitu
tiona
lized
chi
ldre
n un
der a
ge 1
9, re
gard
less
of c
over
age
sour
ce. I
n th
is e
xhib
it, th
e fo
llow
ing
hier
arch
y w
as u
sed
to a
ssig
n in
divi
dual
s w
ith
mul
tiple
cov
erag
e so
urce
s to
a p
rimar
y so
urce
: Med
icar
e, p
rivat
e, M
edic
aid/
CHIP
, oth
er, u
nins
ured
. Not
sep
arat
ely
show
n ar
e th
e es
timat
es fo
r tho
se c
over
ed b
y M
edic
are
(gen
eral
ly c
hild
ren
with
end
-sta
ge re
nal d
isea
se),
any
type
of m
ilita
ry h
ealth
pla
n, o
r oth
er g
over
nmen
t-spo
nsor
ed p
rogr
ams.
Cov
erag
e so
urce
is d
efin
ed a
s of
the
time
of th
e su
rvey
inte
rvie
w. S
ince
an
indi
vidu
al m
ay h
ave
mul
tiple
cov
erag
e so
urce
s or
cha
nges
ove
r tim
e, re
spon
ses
to s
urve
y qu
estio
ns m
ay re
flect
cha
ract
eris
tics
or e
xper
ienc
es
asso
ciat
ed w
ith a
cov
erag
e so
urce
oth
er th
an th
e on
e as
sign
ed in
this
exh
ibit.
2
Priv
ate
heal
th in
sura
nce
cove
rage
exc
lude
s pl
ans
that
pai
d fo
r onl
y on
e ty
pe o
f ser
vice
, suc
h as
acc
iden
ts o
r den
tal c
are.
3 M
edic
aid/
CHIP
als
o in
clud
es p
erso
ns c
over
ed b
y ot
her s
tate
-spo
nsor
ed h
ealth
pla
ns.
4 In
divi
dual
s w
ere
defin
ed a
s un
insu
red
if th
ey d
id n
ot h
ave
any
priv
ate
heal
th in
sura
nce,
Med
icai
d, C
HIP
, Med
icar
e, s
tate
- or o
ther
gov
ernm
ent-s
pons
ored
hea
lth p
lan,
or
mili
tary
pla
n. In
divi
dual
s w
ere
also
def
ined
as
unin
sure
d if
they
had
onl
y In
dian
Hea
lth S
ervi
ce c
over
age
or h
ad o
nly
a pr
ivat
e pl
an th
at p
aid
for o
ne ty
pe o
f ser
vice
, suc
h as
ac
cide
nts
or d
enta
l car
e.5
Due
to th
e fa
ct th
at a
hie
rarc
hy w
as u
sed
in th
is e
xhib
it to
ass
ign
indi
vidu
als
with
mul
tiple
cov
erag
e so
urce
s to
a p
rimar
y so
urce
(see
not
e 1)
, the
Med
icai
d/CH
IP
perc
enta
ges
show
n in
this
row
exc
lude
indi
vidu
als
who
als
o ha
ve M
edic
are
(whi
ch is
rare
for c
hild
ren)
or p
rivat
e co
vera
ge. C
ompo
nent
s do
not
sum
to 1
00 p
erce
nt b
ecau
se
not a
ll co
vera
ge s
ourc
es a
re s
how
n.
6 Ch
arac
teris
tic is
list
ed u
nder
dem
ogra
phic
s be
caus
e lo
w in
com
e is
one
of t
he c
riter
ia fo
r SSI
elig
ibili
ty. H
owev
er, S
SI re
ceip
t is
also
an
indi
cato
r of d
isab
ility
. For
a c
hild
to
be e
ligib
le fo
r SSI
, he
or s
he m
ust h
ave
a m
edic
ally
det
erm
inab
le p
hysi
cal o
r men
tal i
mpa
irmen
t tha
t res
ults
in m
arke
d an
d se
vere
func
tiona
l lim
itatio
ns a
nd th
at is
gen
eral
ly
expe
cted
to la
st a
t lea
st 1
2 m
onth
s or
resu
lt in
dea
th.
7 Su
rvey
info
rmat
ion
is li
mite
d to
chi
ldre
n ag
e 12
or o
lder
.8
Due
in p
art t
o ch
ange
s in
the
2011
NH
IS q
uest
ionn
aire
as
wel
l as
othe
r met
hodo
logi
cal c
hang
es, t
he d
efin
ition
of c
hild
ren
with
spe
cial
hea
lth c
are
need
s di
ffer
s sl
ight
ly
from
the
defin
ition
MAC
PAC
used
in p
rior v
ersi
ons.
Und
er th
e ch
ildre
n w
ith s
peci
al h
ealth
car
e ne
eds
defin
ition
app
lied
here
, a c
hild
mus
t hav
e at
leas
t one
dia
gnos
ed o
r pa
rent
-repo
rted
con
ditio
n ex
pect
ed to
be
an o
ngoi
ng h
ealth
con
ditio
n an
d al
so m
ust m
eet a
t lea
st o
ne o
f the
crit
eria
rela
ted
to e
leva
ted
serv
ice
use
or e
leva
ted
need
, inc
ludi
ng
repo
rted
unm
et n
eed
for c
are.
For
mor
e in
form
atio
n on
the
met
hods
use
d to
iden
tify
child
ren
with
spe
cial
hea
lth c
are
need
s, s
ee h
ttps
://w
ww
.mac
pac.
gov/
mac
stat
s/da
ta-
sour
ces-
and-
met
hods
/.9
Surv
ey in
form
atio
n is
lim
ited
to c
hild
ren
age
0–17
.10
Su
rvey
info
rmat
ion
is li
mite
d to
chi
ldre
n ag
e 2–
17.
Sour
ce: M
ACPA
C, 2
016,
ana
lysi
s of
NH
IS d
ata.

December 2016108
Section 5: Beneficiary Health, Service Use, and Access to Care
MAC
Stat
sSe
ctio
n 5
Char
acte
ristic
sPr
imar
y co
vera
ge s
ourc
e at
tim
e of
inte
rvie
w1
Tota
lPr
ivat
e2M
edic
aid/
CHIP
3U
nins
ured
4
Tota
l (pe
rcen
t dis
trib
utio
n ac
ross
cov
erag
e so
urce
s)5
100.
0%54
.9%
36.5
%4.
7%Co
ntac
t with
hea
lth c
are
prof
essi
onal
s (p
ast 1
2 m
onth
s)
N
umbe
r of t
imes
saw
a d
octo
r or o
ther
hea
lth p
rofe
ssio
nal,
excl
udin
g de
ntal
vis
its a
nd in
patie
nt h
ospi
tal s
tays
Non
e8.
9 7.
7 8.
228
.6*
At le
ast 1
91.1
92
.3
91.8
71.4
*1
23.5
23
.6
22.9
27.5
2–
336
.9
37.5
37
.424
.1*
4 or
mor
e30
.7
31.2
31
.519
.8*
Saw
sel
ecte
d he
alth
pro
fess
iona
lG
ener
al d
octo
r83
.5
85.5
83
.957
.5*
Gen
eral
doc
tor,
nurs
e pr
actit
ione
r, ph
ysic
ian
assi
stan
t, m
idw
ife, o
r ob-
gyn
85.1
87
.3*
85.2
59.9
*M
edic
al s
peci
alis
t14
.4*
16.9
*11
.28.
8 Ey
e do
ctor
25.8
27
.9*
24.3
15.5
*M
enta
l hea
lth p
rofe
ssio
nal6
8.9*
8.0*
10.5
3.7*
Doct
or, f
or e
mot
iona
l or b
ehav
iora
l pro
blem
75.
1*3.
8*7.
1†
Dent
ist8
81.4
83
.9*
80.9
57.7
*An
y he
alth
pro
fess
iona
l, ex
clud
ing
dent
al9
89.1
91
.5*
88.4
67.3
*An
y he
alth
pro
fess
iona
l, in
clud
ing
dent
al96
.5
98.1
*96
.081
.4*
Had
at l
east
1 o
vern
ight
hos
pita
l sta
y105.
0 5.
0 5.
0†
Rece
ived
car
e at
hom
e0.
9 0.
9 1.
0†
Rece
ipt o
f app
ropr
iate
car
e (p
ast 1
2 m
onth
s)H
ad w
ell-c
hild
che
ckup
784
.0
86.1
84
.552
.7H
ad m
ore
than
15
offic
e or
clin
ic v
isits
2.2
2.
2
2.1
†
Num
ber o
f em
erge
ncy
room
vis
itsN
one
83.0
*87
.1*
77.4
86.9
*At
leas
t 117
.0*
12.9
*22
.613
.1*
111
.7*
9.9*
13.8
9.5*
2–3
4.1*
2.5*
6.6
3.1*
4 or
mor
e1.
2*0.
5*2.
1†
Had
at l
east
1 e
mer
genc
y ro
om v
isit,
and
mos
t rec
ent v
isit
was
for a
ser
ious
hea
lth p
robl
em12
.1*
9.7*
14.9
9.0*
EXH
IBIT
39.
Use
of C
are
amon
g N
on-In
stitu
tiona
lized
Indi
vidu
als
Age
0–18
by
Prim
ary
Sour
ce o
f Hea
lth C
over
age,
201
5, D
ata
from
N
atio
nal H
ealth
Inte
rvie
w S
urve
y

MACStats: Medicaid and CHIP Data Book 109
Section 5: Beneficiary Health, Service Use, and Access to Care
MAC
Stat
sSe
ctio
n 5
EXH
IBIT
39.
(co
ntin
ued)
Not
es: O
b-gy
n is
obs
tetr
icia
n-gy
neco
logi
st. P
erce
ntag
e ca
lcul
atio
ns fo
r eac
h ite
m in
the
exhi
bit e
xclu
de in
divi
dual
s w
ith m
issi
ng a
nd u
nkno
wn
valu
es. T
he in
divi
dual
co
mpo
nent
s lis
ted
unde
r the
sub
cate
gorie
s ar
e no
t alw
ays
mut
ually
exc
lusi
ve a
nd m
ay n
ot a
dd to
100
per
cent
. Sta
ndar
d er
rors
are
ava
ilabl
e on
line
in th
e do
wnl
oada
ble
Exce
l ve
rsio
n of
this
exh
ibit
at h
ttps
://w
ww
.mac
pac.
gov/
publ
icat
ion/
use-
of-c
are-
amon
g-no
n-in
stitu
tiona
lized
-indi
vidu
als-
age-
0-18
-by-
prim
ary-
sour
ce-o
f-hea
lth-c
over
age-
data
-fr
om-n
atio
nal-h
ealth
-inte
rvie
w-s
urve
y/. D
ue to
diff
eren
ces
in m
etho
dolo
gy (s
uch
as th
e w
ordi
ng o
f que
stio
ns, l
engt
h of
reca
ll pe
riods
, and
pro
mpt
s or
pro
bes
used
to e
licit
resp
onse
s), e
stim
ates
obt
aine
d fr
om d
iffer
ent s
urve
y da
ta s
ourc
es w
ill v
ary.
For
exa
mpl
e, th
e N
atio
nal H
ealth
Inte
rvie
w S
urve
y (N
HIS
) is
know
n to
pro
duce
hig
her e
stim
ates
of
ser
vice
use
than
the
Med
ical
Exp
endi
ture
s Pa
nel S
urve
y (M
EPS)
. For
pur
pose
s of
com
parin
g gr
oups
of i
ndiv
idua
ls (a
s in
this
exh
ibit)
, the
NH
IS p
rovi
des
the
mos
t rec
ent
info
rmat
ion
avai
labl
e. F
or o
ther
pur
pose
s, s
uch
as m
easu
ring
leve
ls o
f use
rela
tive
to a
par
ticul
ar b
ench
mar
k or
goa
l, it
may
be
appr
opria
te to
con
sult
estim
ates
from
MEP
S or
an
othe
r sou
rce.
* Di
ffer
ence
from
Med
icai
d/CH
IP is
sta
tistic
ally
sig
nific
ant a
t the
0.0
5 le
vel.
† Es
timat
e is
unr
elia
ble
beca
use
it ha
s a
rela
tive
stan
dard
err
or g
reat
er th
an 3
0 pe
rcen
t.
– D
ash
indi
cate
s ze
ro; 0
.0%
indi
cate
s an
am
ount
less
than
0.0
5% th
at ro
unds
to z
ero.
1 To
tal i
nclu
des
all n
on-in
stitu
tiona
lized
chi
ldre
n un
der a
ge 1
9, re
gard
less
of c
over
age
sour
ce. I
n th
is e
xhib
it, th
e fo
llow
ing
hier
arch
y w
as u
sed
to a
ssig
n in
divi
dual
s w
ith
mul
tiple
cov
erag
e so
urce
s to
a p
rimar
y so
urce
: Med
icar
e, p
rivat
e, M
edic
aid/
CHIP
, oth
er, u
nins
ured
. Not
sep
arat
ely
show
n ar
e th
e es
timat
es fo
r tho
se c
over
ed b
y M
edic
are
(gen
eral
ly c
hild
ren
with
end
-sta
ge re
nal d
isea
se),
any
type
of m
ilita
ry h
ealth
pla
n, o
r oth
er g
over
nmen
t-spo
nsor
ed p
rogr
ams.
Cov
erag
e so
urce
is d
efin
ed a
s of
the
time
of th
e su
rvey
inte
rvie
w. S
ince
an
indi
vidu
al m
ay h
ave
mul
tiple
cov
erag
e so
urce
s or
cha
nges
ove
r tim
e, re
spon
ses
to s
urve
y qu
estio
ns m
ay re
flect
cha
ract
eris
tics
or e
xper
ienc
es
asso
ciat
ed w
ith a
cov
erag
e so
urce
oth
er th
an th
e on
e as
sign
ed in
this
exh
ibit.
2 Pr
ivat
e he
alth
insu
ranc
e co
vera
ge e
xclu
des
plan
s th
at p
aid
for o
nly
one
type
of s
ervi
ce, s
uch
as a
ccid
ents
or d
enta
l car
e.3
Med
icai
d/CH
IP a
lso
incl
udes
per
sons
cov
ered
by
othe
r sta
te-s
pons
ored
hea
lth p
lans
. 4
Indi
vidu
als
wer
e de
fined
as
unin
sure
d if
they
did
not
hav
e an
y pr
ivat
e he
alth
insu
ranc
e, M
edic
aid,
CH
IP, M
edic
are,
sta
te- o
r oth
er g
over
nmen
t-spo
nsor
ed h
ealth
pla
n, o
r m
ilita
ry p
lan.
Indi
vidu
als
wer
e al
so d
efin
ed a
s un
insu
red
if th
ey h
ad o
nly
Indi
an H
ealth
Ser
vice
cov
erag
e or
had
onl
y a
priv
ate
plan
that
pai
d fo
r one
type
of s
ervi
ce, s
uch
as
acci
dent
s or
den
tal c
are.
5 Du
e to
the
fact
that
a h
iera
rchy
was
use
d in
this
exh
ibit
to a
ssig
n in
divi
dual
s w
ith m
ultip
le c
over
age
sour
ces
to a
prim
ary
sour
ce (s
ee n
ote
1), t
he M
edic
aid/
CHIP
pe
rcen
tage
s sh
own
in th
is ro
w e
xclu
de in
divi
dual
s w
ho a
lso
have
Med
icar
e (w
hich
is ra
re fo
r chi
ldre
n) o
r priv
ate
cove
rage
. Com
pone
nts
do n
ot s
um to
100
per
cent
bec
ause
no
t all
cove
rage
sou
rces
are
sho
wn.
6 Su
rvey
info
rmat
ion
is li
mite
d to
chi
ldre
n ag
e tw
o or
old
er.
7 Su
rvey
info
rmat
ion
is li
mite
d to
chi
ldre
n ag
e 0
to 1
7.8
Surv
ey in
form
atio
n is
lim
ited
to c
hild
ren
age
one
or o
lder
.9
Any
heal
th p
rofe
ssio
nal i
nclu
des
gene
ral d
octo
r, nu
rse
prac
titio
ner,
phys
icia
n as
sist
ant,
mid
wife
, ob-
gyn,
med
ical
spe
cial
ist,
eye
doct
or, m
enta
l hea
lth p
rofe
ssio
nal,
doct
or fo
r em
otio
nal o
r beh
avio
ral p
robl
em, t
hera
pist
, chi
ropr
acto
r, or
pod
iatr
ist.
10 In
clud
es s
tays
for n
ewbo
rns.
Sour
ce: M
ACPA
C, 2
016,
ana
lysi
s of
NH
IS d
ata.

December 2016110
Section 5: Beneficiary Health, Service Use, and Access to Care
MAC
Stat
sSe
ctio
n 5
Char
acte
ristic
sPr
imar
y co
vera
ge s
ourc
e at
tim
e of
mos
t rec
ent i
nter
view
1
Tota
lPr
ivat
e2M
edic
aid/
CHIP
3U
nins
ured
4
Tota
l (pe
rcen
t dis
trib
utio
n ac
ross
cov
erag
e so
urce
s)5
100.
0%53
.5%
37.5
%7.
3%Co
ntac
t with
hea
lth c
are
prof
essi
onal
s (p
ast 1
2 m
onth
s)
N
umbe
r of o
ffic
e-ba
sed
visi
ts (t
o a
doct
or o
r oth
er h
ealth
pro
fess
iona
l), e
xclu
ding
den
tal v
isits
and
inpa
tient
hos
pita
l sta
ysN
one
25.3
20
.6*
27.2
46.7
*At
leas
t 174
.7
79.4
*72
.853
.3*
123
.5
23.0
24.4
22.0
2–3
26.4
28
.026
.617
.9*
4 or
mor
e24
.8*
28.4
*21
.713
.4*
Had
at l
east
1 o
vern
ight
hos
pita
l sta
y2.
9 1.
9*2.
8†
Rece
ived
car
e at
hom
e1.
3 †
1.4
† Sa
w a
gen
eral
den
tist
43.6
*50
.7*
38.0
29.0
*Sa
w a
n or
thod
ontis
t9.
2*13
.5*
4.1
4.4
Rece
ipt o
f app
ropr
iate
car
e (p
ast 1
2 m
onth
s)H
ad d
enta
l cle
anin
g, p
roph
ylax
is, o
r pol
ishi
ng6
47.8
*46
.0*
53.1
48.5
Had
mor
e th
an 1
5 of
fice-
base
d or
hos
pita
l out
patie
nt v
isits
4.
1 5.
0 *3.
4†
Num
ber o
f em
erge
ncy
room
vis
itsN
one
87.2
*89
.7*
84.4
88.8
*At
leas
t 112
.8*
10.3
*15
.611
.2*
19.
8*8.
4*11
.48.
1*2–
32.
7*1.
9*3.
8†
4 or
mor
e0.
3 †
††
Not
es: P
erce
ntag
e ca
lcul
atio
ns fo
r eac
h ite
m in
the
exhi
bit e
xclu
de in
divi
dual
s w
ith m
issi
ng a
nd u
nkno
wn
valu
es. S
tand
ard
erro
rs a
re a
vaila
ble
onlin
e in
the
dow
nloa
dabl
e Ex
cel v
ersi
on o
f thi
s ex
hibi
t at h
ttps
://w
ww
.mac
pac.
gov/
publ
icat
ion/
use-
of-c
are-
amon
g-no
n-in
stitu
tiona
lized
-indi
vidu
als-
age-
0-18
-by-
prim
ary-
sour
ce-o
f-hea
lth-c
over
age-
data
-fr
om-m
edic
al-e
xpen
ditu
res-
pane
l-sur
vey/
. Due
to d
iffer
ence
s in
met
hodo
logy
(suc
h as
the
wor
ding
of q
uest
ions
, len
gth
of re
call
perio
ds, a
nd p
rom
pts
or p
robe
s us
ed to
elic
it re
spon
ses)
, est
imat
es o
btai
ned
from
diff
eren
t sur
vey
data
sou
rces
will
var
y. F
or e
xam
ple,
the
Nat
iona
l Hea
lth In
terv
iew
Sur
vey
(NH
IS) i
s kn
own
to p
rodu
ce h
ighe
r est
imat
es o
f se
rvic
e us
e th
an th
e M
edic
al E
xpen
ditu
res
Pane
l Sur
vey
(MEP
S). F
or p
urpo
ses
of c
ompa
ring
grou
ps o
f ind
ivid
uals
, the
NH
IS p
rovi
des
the
mos
t rec
ent i
nfor
mat
ion
avai
labl
e.
For o
ther
pur
pose
s, s
uch
as m
easu
ring
leve
ls o
f use
rela
tive
to a
par
ticul
ar b
ench
mar
k or
goa
l, it
may
be
appr
opria
te to
con
sult
estim
ates
from
MEP
S or
ano
ther
sou
rce.
* Di
ffer
ence
from
Med
icai
d/CH
IP is
sta
tistic
ally
sig
nific
ant a
t the
0.0
5 le
vel.
† Es
timat
e is
unr
elia
ble
beca
use
it ha
s a
rela
tive
stan
dard
err
or g
reat
er th
an 3
0 pe
rcen
t.
– D
ash
indi
cate
s ze
ro; 0
.0%
indi
cate
s an
am
ount
less
than
0.0
5% th
at ro
unds
to z
ero.
EXH
IBIT
40.
Use
of C
are
amon
g N
on-In
stitu
tiona
lized
Indi
vidu
als
Age
0–18
by
Prim
ary
Sour
ce o
f Hea
lth C
over
age,
201
4, D
ata
from
M
edic
al E
xpen
ditu
res
Pane
l Sur
vey

MACStats: Medicaid and CHIP Data Book 111
Section 5: Beneficiary Health, Service Use, and Access to Care
MAC
Stat
sSe
ctio
n 5
1 To
tal i
nclu
des
all n
on-in
stitu
tiona
lized
chi
ldre
n un
der a
ge 1
9, re
gard
less
of c
over
age
sour
ce. I
n th
is e
xhib
it, th
e fo
llow
ing
hier
arch
y w
as u
sed
to a
ssig
n in
divi
dual
s w
ith
mul
tiple
cov
erag
e so
urce
s to
a p
rimar
y so
urce
: Med
icar
e, p
rivat
e, M
edic
aid/
CHIP
, oth
er, u
nins
ured
. Not
sep
arat
ely
show
n ar
e th
e es
timat
es fo
r tho
se c
over
ed b
y M
edic
are
(gen
eral
ly c
hild
ren
with
end
-sta
ge re
nal d
isea
se),
any
type
of m
ilita
ry h
ealth
pla
n, o
r oth
er g
over
nmen
t-spo
nsor
ed p
rogr
ams.
Cov
erag
e so
urce
is d
efin
ed a
s of
the
time
of th
e m
ost r
ecen
t sur
vey
inte
rvie
w. S
ince
an
indi
vidu
al m
ay h
ave
mul
tiple
cov
erag
e so
urce
s or
cha
nges
ove
r tim
e, re
spon
ses
to s
urve
y qu
estio
ns m
ay re
flect
cha
ract
eris
tics
or
expe
rienc
es a
ssoc
iate
d w
ith a
cov
erag
e so
urce
oth
er th
an th
e on
e as
sign
ed in
this
exh
ibit.
2 Pr
ivat
e he
alth
insu
ranc
e co
vera
ge e
xclu
des
plan
s th
at p
aid
for o
nly
one
type
of s
ervi
ce, s
uch
as a
ccid
ents
or d
enta
l car
e.3
Med
icai
d/CH
IP a
lso
incl
udes
per
sons
cov
ered
by
othe
r sta
te-s
pons
ored
hea
lth p
lans
.4
Indi
vidu
als
wer
e de
fined
as
unin
sure
d if
they
did
not
hav
e an
y pr
ivat
e he
alth
insu
ranc
e, M
edic
aid,
CH
IP, M
edic
are,
sta
te- o
r oth
er g
over
nmen
t-spo
nsor
ed h
ealth
pla
n, o
r m
ilita
ry p
lan.
Indi
vidu
als
wer
e al
so d
efin
ed a
s un
insu
red
if th
ey h
ad o
nly
Indi
an H
ealth
Ser
vice
cov
erag
e or
had
onl
y a
priv
ate
plan
that
pai
d fo
r one
type
of s
ervi
ce, s
uch
as
acci
dent
s or
den
tal c
are.
5 Du
e to
the
fact
that
a h
iera
rchy
was
use
d in
this
exh
ibit
to a
ssig
n in
divi
dual
s w
ith m
ultip
le c
over
age
sour
ces
to a
prim
ary
sour
ce (s
ee n
ote
1), t
he M
edic
aid/
CHIP
pe
rcen
tage
s sh
own
in th
is ro
w e
xclu
de in
divi
dual
s w
ho a
lso
have
Med
icar
e (w
hich
is ra
re fo
r chi
ldre
n) o
r priv
ate
cove
rage
. Com
pone
nts
do n
ot s
um to
100
per
cent
bec
ause
no
t all
cove
rage
sou
rces
are
sho
wn.
6 Li
mite
d to
peo
ple
who
repo
rted
a d
enta
l eve
nt in
201
4.
Sour
ce: M
ACPA
C, 2
016,
ana
lysi
s of
MEP
S da
ta.
EXH
IBIT
40.
(co
ntin
ued)

December 2016112
Section 5: Beneficiary Health, Service Use, and Access to Care
MAC
Stat
sSe
ctio
n 5
Char
acte
ristic
sPr
imar
y co
vera
ge s
ourc
e at
tim
e of
inte
rvie
w1
Tota
lPr
ivat
e2M
edic
aid/
CHIP
3U
nins
ured
4
Tota
l (pe
rcen
t dis
trib
utio
n ac
ross
cov
erag
e so
urce
s)5
100.
0%54
.9%
36.5
%4.
7%Co
nnec
tion
to th
e he
alth
car
e sy
stem
(pas
t 12
mon
ths)
Has
a u
sual
sou
rce
of c
are6
95.2
97
.3*
95.1
68.9
*H
ad th
e sa
me
usua
l sou
rce
of m
edic
al c
are
12 m
onth
s ag
o88
.2
90.7
*87
.865
.8*
Had
trou
ble
findi
ng a
doc
tor o
r was
told
that
cov
erag
e or
ne
w p
atie
nts
wer
e no
t acc
epte
d73.
4*2.
4*4.
35.
9 Ti
mel
ines
s of
car
e (p
ast 1
2 m
onth
s)De
laye
d m
edic
al c
are
due
to a
ny a
cces
s ba
rrie
r ind
icat
ed
belo
w10
.1*
6.6*
13.4
22.6
*De
laye
d be
caus
e of
cos
ts2.
6 1.
82.
117
.0*
Dela
yed
for p
rovi
der-r
elat
ed re
ason
s87.
2*5.
2*9.
79.
1 De
laye
d du
e to
lack
of t
rans
port
atio
n1.
8*0.
3*3.
6†
Unm
et n
eed
for s
elec
ted
type
s of
car
e du
e to
cos
tM
edic
al c
are
1.4
0.7*
1.2
10.4
*M
enta
l hea
lth c
are
or c
ouns
elin
g90.
7 0.
50.
8†
Dent
al c
are9
4.2
2.6*
4.7
18.6
*Pr
escr
iptio
n dr
ugs
1.6
1.2
1.7
7.1*
Eyeg
lass
es9
1.9*
1.0*
2.6
8.2*
Spec
ialis
t car
e1.
20.
7*1.
36.
1*Fo
llow
-up
care
1.3
0.6*
1.4
8.8*
Not
es: P
erce
ntag
e ca
lcul
atio
ns fo
r eac
h ite
m in
the
tabl
e ex
clud
e in
divi
dual
s w
ith m
issi
ng a
nd u
nkno
wn
valu
es. T
he in
divi
dual
com
pone
nts
liste
d un
der t
he s
ubca
tego
ries
are
not m
utua
lly e
xclu
sive
and
may
not
add
to 1
00 p
erce
nt. S
tand
ard
erro
rs a
re a
vaila
ble
onlin
e in
the
dow
nloa
dabl
e Ex
cel v
ersi
on o
f thi
s ex
hibi
t at h
ttps
://w
ww
.mac
pac.
gov/
publ
icat
ion/
mea
sure
s-of
-acc
ess-
to-c
are-
for-n
on-in
stitu
tiona
lized
-chi
ldre
n-by
-sou
rce-
of-h
ealth
-cov
erag
e/. D
ue to
diff
eren
ces
in m
etho
dolo
gy (s
uch
as th
e w
ordi
ng o
f que
stio
ns,
leng
th o
f rec
all p
erio
ds, a
nd p
rom
pts
or p
robe
s us
ed to
elic
it re
spon
ses)
, est
imat
es o
btai
ned
from
diff
eren
t sur
vey
data
sou
rces
will
var
y. F
or e
xam
ple,
the
Nat
iona
l Hea
lth
Inte
rvie
w S
urve
y (N
HIS
) is
know
n to
pro
duce
hig
her e
stim
ates
of s
ervi
ce u
se th
an th
e M
edic
al E
xpen
ditu
res
Pane
l Sur
vey
(MEP
S). F
or p
urpo
ses
of c
ompa
ring
grou
ps o
f in
divi
dual
s (a
s in
this
exh
ibit)
, the
NH
IS p
rovi
des
the
mos
t rec
ent i
nfor
mat
ion
avai
labl
e. F
or o
ther
pur
pose
s, s
uch
as m
easu
ring
leve
ls o
f use
rela
tive
to a
par
ticul
ar b
ench
mar
k or
goa
l, it
may
be
appr
opria
te to
con
sult
estim
ates
from
MEP
S or
ano
ther
sou
rce.
* Di
ffer
ence
from
Med
icai
d/CH
IP is
sta
tistic
ally
sig
nific
ant a
t the
0.0
5 le
vel.
† Es
timat
e is
unr
elia
ble
beca
use
it ha
s a
rela
tive
stan
dard
err
or g
reat
er th
an 3
0 pe
rcen
t.
– D
ash
indi
cate
s ze
ro; 0
.0%
indi
cate
s an
am
ount
less
than
0.0
5% th
at ro
unds
to z
ero.
EXH
IBIT
41.
Mea
sure
s of
Acc
ess
to C
are
amon
g N
on-In
stitu
tiona
lized
Indi
vidu
als
Age
0–18
by
Prim
ary
Sour
ce o
f Hea
lth C
over
age,
201
5

MACStats: Medicaid and CHIP Data Book 113
Section 5: Beneficiary Health, Service Use, and Access to Care
MAC
Stat
sSe
ctio
n 5
1 To
tal i
nclu
des
all n
on-in
stitu
tiona
lized
chi
ldre
n un
der a
ge 1
9, re
gard
less
of c
over
age
sour
ce. I
n th
is e
xhib
it, th
e fo
llow
ing
hier
arch
y w
as u
sed
to a
ssig
n in
divi
dual
s w
ith
mul
tiple
cov
erag
e so
urce
s to
a p
rimar
y so
urce
: Med
icar
e, p
rivat
e, M
edic
aid/
CHIP
, oth
er, u
nins
ured
. Not
sep
arat
ely
show
n ar
e th
e es
timat
es fo
r tho
se c
over
ed b
y M
edic
are
(gen
eral
ly c
hild
ren
with
end
-sta
ge re
nal d
isea
se),
any
type
of m
ilita
ry h
ealth
pla
n, o
r oth
er g
over
nmen
t-spo
nsor
ed p
rogr
ams.
Cov
erag
e so
urce
is d
efin
ed a
s of
the
time
of th
e su
rvey
inte
rvie
w. S
ince
an
indi
vidu
al m
ay h
ave
mul
tiple
cov
erag
e so
urce
s or
cha
nges
ove
r tim
e, re
spon
ses
to s
urve
y qu
estio
ns m
ay re
flect
cha
ract
eris
tics
or e
xper
ienc
es
asso
ciat
ed w
ith a
cov
erag
e so
urce
oth
er th
an th
e on
e as
sign
ed in
this
exh
ibit.
2 Pr
ivat
e he
alth
insu
ranc
e co
vera
ge e
xclu
des
plan
s th
at p
aid
for o
nly
one
type
of s
ervi
ce, s
uch
as a
ccid
ents
or d
enta
l car
e.3
Med
icai
d/CH
IP a
lso
incl
udes
per
sons
cov
ered
by
othe
r sta
te-s
pons
ored
hea
lth p
lans
.4
Indi
vidu
als
wer
e de
fined
as
unin
sure
d if
they
did
not
hav
e an
y pr
ivat
e he
alth
insu
ranc
e, M
edic
aid,
CH
IP, M
edic
are,
sta
te- o
r oth
er g
over
nmen
t-spo
nsor
ed h
ealth
pla
n, o
r m
ilita
ry p
lan.
Indi
vidu
als
wer
e al
so d
efin
ed a
s un
insu
red
if th
ey h
ad o
nly
Indi
an H
ealth
Ser
vice
cov
erag
e or
had
onl
y a
priv
ate
plan
that
pai
d fo
r one
type
of s
ervi
ce, s
uch
as
acci
dent
s or
den
tal c
are.
5 Du
e to
the
fact
that
a h
iera
rchy
was
use
d in
this
exh
ibit
to a
ssig
n in
divi
dual
s w
ith m
ultip
le c
over
age
sour
ces
to a
prim
ary
sour
ce (s
ee n
ote
1), t
he M
edic
aid/
CHIP
pe
rcen
tage
s sh
own
in th
is ro
w e
xclu
de in
divi
dual
s w
ho a
lso
have
Med
icar
e (w
hich
is ra
re fo
r chi
ldre
n) o
r priv
ate
cove
rage
. Com
pone
nts
do n
ot s
um to
100
per
cent
bec
ause
no
t all
cove
rage
sou
rces
are
sho
wn.
6 Ex
clud
es e
mer
genc
y ro
om.
7 Pa
rent
repo
rted
one
of t
hese
bar
riers
in th
e pa
st 1
2 m
onth
s: tr
oubl
e fin
ding
a d
octo
r or p
rovi
der,
doct
or’s
off
ice/
clin
ic d
id n
ot a
ccep
t chi
ld’s
insu
ranc
e co
vera
ge, o
r off
ice/
clin
ic d
id n
ot a
ccep
t the
chi
ld a
s a
new
pat
ient
.8
Incl
udes
any
of t
he fo
llow
ing:
par
ent c
ould
not
get
an
appo
intm
ent,
had
to w
ait t
oo lo
ng to
see
doc
tor,
coul
d no
t go
whe
n op
en, c
ould
not
get
thro
ugh
on p
hone
, par
ent
spea
ks a
diff
eren
t lan
guag
e.9
Surv
ey in
form
atio
n is
lim
ited
to c
hild
ren
age
two
or o
lder
.
Sour
ce: M
ACPA
C, 2
016,
ana
lysi
s of
NH
IS d
ata.
EXH
IBIT
41.
(co
ntin
ued)

December 2016114
Section 5: Beneficiary Health, Service Use, and Access to Care
MAC
Stat
sSe
ctio
n 5
Char
acte
ristic
Prim
ary
cove
rage
sou
rce
at ti
me
of in
terv
iew
1
Tota
lM
edic
are
Priv
ate2
Med
icai
d/CH
IP3
Uni
nsur
ed4
Tota
l (pe
rcen
t dis
trib
utio
n ac
ross
cov
erag
e so
urce
s)5
100.
0%3.
9%69
.0%
10.8
%12
.8%
Cove
rage
Leng
th o
f tim
e w
ith a
ny c
over
age
durin
g ye
arFu
ll ye
ar 8
2.2*
95.
7* 9
4.6*
85.
8–
Pa
rt y
ear
8.8
* 4
.3*
5.4
* 1
4.2
25.
2*N
o co
vera
ge d
urin
g ye
ar 9
.1–
–
–
74.
8De
mog
raph
ics
Age
19–
25 1
5.6*
2.0
* 1
4.7*
21.
7 1
9.2
26–
44 4
0.9*
16.
1* 4
0.0*
46.
6 5
0.8*
45–
54 2
2.4*
25.
1* 2
3.6*
18.
5 1
7.9
55–
64 2
1.1*
56.
9* 2
1.8*
13.
2 1
2.0
Gen
der
Mal
e 4
9.0*
50.
0* 4
9.4*
36.
6 5
5.7*
Fem
ale
51.
0* 5
0.0*
50.
6* 6
3.4
44.
3*Ra
ceH
ispa
nic
17.
2* 9
.5*
12.
4* 2
7.4
37.
7*W
hite
, non
-His
pani
c 6
2.8*
69.
1* 6
9.3*
43.
3 4
2.7
Blac
k, n
on-H
ispa
nic
12.
6* 1
7.5*
10.
4* 2
1.9
14.
0*O
ther
non
-whi
te, n
on-H
ispa
nic
7.3
3
.9*
7.9
7
.4 5
.5*
Mar
ital s
tatu
s6
Mar
ried
54.
0* 3
6.6
60.
7* 3
3.2
39.
5*W
idow
ed 1
.6*
5.2
* 1
.3
1.9
1.7
Di
vorc
ed o
r sep
arat
ed 1
1.3*
26.
3* 9
.4*
14.
7 1
3.5
Livi
ng w
ith p
artn
er 8
.6*
7.6
* 7
.1*
13.
1 1
3.5
Nev
er m
arrie
d 2
4.5*
24.
3* 2
1.5*
37.
1 3
1.8*
Fam
ily in
com
eLe
ss th
an 1
38 p
erce
nt F
PL 2
0.5*
46.
4* 8
.2*
64.
1 3
9.9*
Has
inco
me
in ra
nges
bel
owLe
ss th
an 1
00 p
erce
nt F
PL 1
3.3*
29.
0* 4
.5*
46.
4 2
6.9*
100–
199
perc
ent F
PL 1
7.6*
34.
1 1
1.1*
34.
3 3
1.1
200–
399
perc
ent F
PL 2
8.1*
25.
2* 2
9.6*
15.
4 3
0.8*
400
perc
ent F
PL o
r hig
her
40.
9* 1
1.7*
54.
7* 3
.7 1
1.1*
EXH
IBIT
42.
Cov
erag
e, D
emog
raph
ic, a
nd H
ealth
Cha
ract
eris
tics
of N
on-In
stitu
tiona
lized
Indi
vidu
als
Age
19–
64 b
y Pr
imar
y So
urce
of
Hea
lth C
over
age,
201
5

MACStats: Medicaid and CHIP Data Book 115
Section 5: Beneficiary Health, Service Use, and Access to Care
MAC
Stat
sSe
ctio
n 5
Char
acte
ristic
Prim
ary
cove
rage
sou
rce
at ti
me
of in
terv
iew
1
Tota
lM
edic
are
Priv
ate2
Med
icai
d/CH
IP3
Uni
nsur
ed4
Educ
atio
nLe
ss th
an h
igh
scho
ol 1
1.0%
* 2
2.8%
5
.1%
* 2
5.5%
27.
7%
Hig
h sc
hool
dip
lom
a/G
ED 2
3.4*
35.
3 1
9.6*
31.
9 3
3.2
Som
e co
llege
32.
5* 3
0.0
33.
0 3
4.1
28.
1*Co
llege
or g
radu
ate
degr
ee 3
3.1*
11.
9* 4
2.4*
8.6
11.
0*O
ther
dem
ogra
phic
cha
ract
eris
tics
Citiz
en o
f Uni
ted
Stat
es 9
0.3*
96.
7* 9
3.6*
88.
3 7
1.7*
Pare
nt o
f a d
epen
dent
chi
ld 3
6.6*
12.
6* 3
6.5*
47.
6 3
6.7*
Curr
ently
wor
king
73.
1* 1
0.0*
83.
6* 4
3.7
64.
9*Ve
tera
n 5
.7*
9.0
* 4
.6*
3.3
2.8
Re
ceiv
es S
SI o
r SSD
I7 5
.6*
74.
7* 1
.0*
16.
6 0
.8*
Rece
ives
SSI
2.6
* 2
2.4*
0.4
* 1
3.0
† Re
ceiv
es S
SDI
3.8
* 6
3.8*
0.7
* 6
.3 0
.6*
Hea
lthCu
rren
t hea
lth s
tatu
sEx
celle
nt o
r ver
y go
od 6
3.4*
11.
9* 7
0.5*
43.
8 5
8.5*
Goo
d 2
5.6*
30.
4 2
3.6*
31.
7 2
9.6
Fair
or p
oor
11.
0* 5
7.8*
5.9
* 2
4.5
11.
9*Bo
dy M
ass
Inde
x (B
MI)
Hea
lthy
wei
ght (
BMI l
ess
than
25)
36.
0* 2
2.6*
37.
4* 3
3.2
36.
0 O
verw
eigh
t (BM
I 25–
29)
33.
3* 2
9.0
33.
4* 3
0.4
36.
4*O
bese
(BM
I 30
or h
ighe
r) 3
0.7*
48.
4* 2
9.3*
36.
4 2
7.7*
Smok
ing
stat
usCu
rren
t sm
oker
16.
9* 2
9.4
12.
0* 3
0.1
27.
8 Fo
rmer
sm
oker
17.
9* 2
7.1*
18.
4* 1
4.3
14.
8 N
ever
sm
oked
65.
1* 4
3.5*
69.
6* 5
5.6
57.
4 Li
mita
tions
and
hea
lth c
ondi
tions
Has
bas
ic a
ctio
n di
fficu
lty o
r com
plex
act
ivity
limita
tion
Any
basi
c ac
tion
diff
icul
ty8
24.
9* 8
6.2*
18.
8* 4
1.8
23.
0*An
y co
mpl
ex a
ctiv
ity li
mita
tion9
12.
5* 8
5.6*
6.1
* 2
9.3
9.1
*Ei
ther
one
26.
6* 9
2.4*
19.
9* 4
5.8
24.
1*H
as fu
nctio
nal l
imita
tion10
11.
5* 6
9.5*
6.6
* 2
3.6
8.6
*
EXH
IBIT
42.
(co
ntin
ued)

December 2016116
Section 5: Beneficiary Health, Service Use, and Access to Care
MAC
Stat
sSe
ctio
n 5
Char
acte
ristic
Prim
ary
cove
rage
sou
rce
at ti
me
of in
terv
iew
1
Tota
lM
edic
are
Priv
ate2
Med
icai
d/CH
IP3
Uni
nsur
ed4
Has
diff
icul
ty w
alki
ng w
ithou
t equ
ipm
ent
3.4
%*
31.
2%*
1.3
%*
8.3
% 1
.5%
*H
as h
ealth
con
ditio
n re
quiri
ng s
peci
al e
quip
men
t 4
.2*
31.
8* 2
.2*
9.0
1.7
*N
eeds
hel
p w
ith a
ny o
f the
follo
win
g AD
LsPe
rson
al c
are
1.4
* 1
3.1*
0.5
* 4
.0†
Bath
ing
0.8
* 8
.4*
0.3
* 2
.2†
Eatin
g 0
.3*
2.3
†
1.1
† Tr
ansf
errin
g 0
.6*
5.1
* 0
.2*
2.1
† To
iletin
g 0
.5*
3.6
*†
1.5
† G
ettin
g ar
ound
in h
ome
0.5
* 5
.4*
0.2
* 1
.6†
Num
ber o
f ADL
s ne
edin
g as
sist
ance
Non
e 9
8.9*
88.
7* 9
9.6*
96.
7 9
9.8*
1–2
0.6
* 6
.7*
0.2
* 1
.7†
3–4
0.4
* 4
.1*
† 1
.0†
5–6
0.1
*†
† 0
.6–
U
nabl
e to
wor
k no
w d
ue to
hea
lth p
robl
em 7
.6*
73.
0* 2
.4*
20.
0 4
.3*
Lim
ited
in a
mou
nt o
r kin
d of
wor
k du
e to
hea
lth 1
0.3*
81.
6* 4
.5*
25.
5 6
.2*
Lost
all
natu
ral t
eeth
4.4
* 2
1.3*
2.9
* 7
.9 4
.1*
Has
dep
ress
ed o
r anx
ious
feel
ings
11 3
.9*
14.
8* 2
.0*
9.3
5.7
*Cu
rren
tly p
regn
ant12
3.9
*†
3.4
* 8
.0 1
.7*
Ever
bee
n to
ld h
e or
she
has
sel
ecte
d co
nditi
ons
Hyp
erte
nsio
n 2
4.1*
58.
3* 2
2.7*
26.
8 1
7.5*
Coro
nary
hea
rt d
isea
se 2
.2*
12.
0* 1
.5*
3.6
1.2
*H
eart
att
ack
1.6
* 1
1.6*
1.0
* 2
.5 0
.9*
Stro
ke 1
.5*
10.
9* 0
.7*
3.2
1.2
*Ca
ncer
4.8
1
4.3*
4.7
5
.3 2
.3*
Diab
etes
6.9
* 2
9.5*
5.6
* 9
.0 4
.9*
Arth
ritis
16.
7* 5
6.4*
15.
0* 1
9.7
9.7
*As
thm
a 1
3.1*
24.
7* 1
2.4*
16.
7 1
0.3*
Chro
nic
bron
chiti
s (p
ast 1
2 m
onth
s) 3
.4*
15.
4* 2
.5*
5.8
2.6
*Li
ver c
ondi
tion
(pas
t 12
mon
ths)
1.6
* 7
.2*
1.0
* 2
.6 1
.4*
Wea
k or
faili
ng k
idne
ys (p
ast 1
2 m
onth
s) 1
.2*
10.
3* 0
.6*
2.1
1.0
*
EXH
IBIT
42.
(co
ntin
ued)

MACStats: Medicaid and CHIP Data Book 117
Section 5: Beneficiary Health, Service Use, and Access to Care
MAC
Stat
sSe
ctio
n 5
Not
es: F
PL is
fede
ral p
over
ty le
vel.
SSI i
s Su
pple
men
tal S
ecur
ity In
com
e. S
SDI i
s So
cial
Sec
urity
Dis
abili
ty In
sura
nce.
ADL
is a
ctiv
ity o
f dai
ly li
ving
. Per
cent
age
calc
ulat
ions
for
each
item
in th
e ex
hibi
t exc
lude
indi
vidu
als
with
mis
sing
and
unk
now
n va
lues
. The
indi
vidu
al c
ompo
nent
s lis
ted
unde
r the
sub
cate
gorie
s ar
e no
t alw
ays
mut
ually
exc
lusi
ve
and
may
not
add
to 1
00 p
erce
nt. S
tand
ard
erro
rs a
re a
vaila
ble
onlin
e in
the
dow
nloa
dabl
e Ex
cel v
ersi
on o
f thi
s ex
hibi
t at h
ttps
://w
ww
.mac
pac.
gov/
publ
icat
ion/
cove
rage
-de
mog
raph
ic-a
nd-h
ealth
-cha
ract
eris
tics-
of-n
on-in
stitu
tiona
lized
-indi
vidu
als-
age-
19-6
4-by
-prim
ary-
sour
ce-o
f-hea
lth-c
over
age/
.
Due
to d
iffer
ence
s in
met
hodo
logy
(suc
h as
the
wor
ding
of q
uest
ions
, len
gth
of re
call
perio
ds, a
nd p
rom
pts
or p
robe
s us
ed to
elic
it re
spon
ses)
, est
imat
es o
btai
ned
from
di
ffer
ent s
urve
y da
ta s
ourc
es w
ill v
ary.
For
exa
mpl
e, th
e N
atio
nal H
ealth
Inte
rvie
w S
urve
y (N
HIS
) is
know
n to
pro
duce
hig
her e
stim
ates
of s
ervi
ce u
se th
an th
e M
edic
al
Expe
nditu
res
Pane
l Sur
vey
(MEP
S). F
or p
urpo
ses
of c
ompa
ring
grou
ps o
f ind
ivid
uals
(as
in th
is e
xhib
it), t
he N
HIS
pro
vide
s th
e m
ost r
ecen
t inf
orm
atio
n av
aila
ble.
For
oth
er
purp
oses
, suc
h as
mea
surin
g le
vels
of u
se re
lativ
e to
a p
artic
ular
ben
chm
ark
or g
oal,
it m
ay b
e ap
prop
riate
to c
onsu
lt es
timat
es fr
om M
EPS
or a
noth
er s
ourc
e.
* Di
ffer
ence
from
Med
icai
d/CH
IP is
sta
tistic
ally
sig
nific
ant a
t the
0.0
5 le
vel.
† Es
timat
e is
unr
elia
ble
beca
use
it ha
s a
rela
tive
stan
dard
err
or g
reat
er th
an 3
0 pe
rcen
t.
– D
ash
indi
cate
s ze
ro; 0
.0%
indi
cate
s an
am
ount
less
than
0.0
5% th
at ro
unds
to z
ero.
1 To
tal i
nclu
des
all n
on-in
stitu
tiona
lized
indi
vidu
als
age
19–
64, r
egar
dles
s of
cov
erag
e so
urce
. In
this
exh
ibit,
the
follo
win
g hi
erar
chy
was
use
d to
ass
ign
indi
vidu
als
with
m
ultip
le c
over
age
sour
ces
to a
prim
ary
sour
ce: M
edic
are,
priv
ate,
Med
icai
d/CH
IP, o
ther
, uni
nsur
ed. N
ot s
epar
atel
y sh
own
are
the
estim
ates
for t
hose
cov
ered
by
any
type
of
mili
tary
hea
lth p
lan
or o
ther
gov
ernm
ent-s
pons
ored
pro
gram
s. C
over
age
sour
ce is
def
ined
as
of th
e tim
e of
the
surv
ey in
terv
iew
. Sin
ce a
n in
divi
dual
may
hav
e m
ultip
le
cove
rage
sou
rces
or c
hang
es o
ver t
ime,
resp
onse
s to
sur
vey
ques
tions
may
refle
ct c
hara
cter
istic
s or
exp
erie
nces
ass
ocia
ted
with
a c
over
age
sour
ce o
ther
than
the
one
assi
gned
in th
is e
xhib
it.2
Priv
ate
heal
th in
sura
nce
cove
rage
exc
lude
s pl
ans
that
pai
d fo
r onl
y on
e ty
pe o
f ser
vice
, suc
h as
acc
iden
ts o
r den
tal c
are.
3 M
edic
aid/
CHIP
als
o in
clud
es p
erso
ns c
over
ed b
y ot
her s
tate
-spo
nsor
ed h
ealth
pla
ns.
4 In
divi
dual
s w
ere
defin
ed a
s un
insu
red
if th
ey d
id n
ot h
ave
any
priv
ate
heal
th in
sura
nce,
Med
icai
d, C
HIP
, Med
icar
e, s
tate
- or o
ther
gov
ernm
ent-s
pons
ored
hea
lth p
lan,
or
mili
tary
pla
n. In
divi
dual
s w
ere
also
def
ined
as
unin
sure
d if
they
had
onl
y In
dian
Hea
lth S
ervi
ce c
over
age
or h
ad o
nly
a pr
ivat
e pl
an th
at p
aid
for o
ne ty
pe o
f ser
vice
, suc
h as
ac
cide
nts
or d
enta
l car
e.5
Due
to th
e fa
ct th
at a
hie
rarc
hy w
as u
sed
in th
is e
xhib
it to
ass
ign
indi
vidu
als
with
mul
tiple
cov
erag
e so
urce
s to
a p
rimar
y so
urce
(see
not
e 1)
, the
Med
icai
d/CH
IP p
erce
ntag
es
show
n in
this
row
exc
lude
indi
vidu
als
who
als
o ha
ve M
edic
are
or p
rivat
e co
vera
ge. C
ompo
nent
s do
not
sum
to 1
00 p
erce
nt b
ecau
se n
ot a
ll co
vera
ge s
ourc
es a
re s
how
n.6
Thes
e es
timat
es s
houl
d no
t be
com
pare
d to
the
2014
est
imat
es p
ublis
hed
in th
e De
cem
ber 2
015
data
boo
k du
e to
err
ors
in la
st’s
yea
r pub
licat
ion.
7 Ch
arac
teris
tic is
list
ed u
nder
dem
ogra
phic
s be
caus
e lo
w in
com
e is
one
of t
he c
riter
ia fo
r SSI
elig
ibili
ty, a
nd th
e in
abili
ty to
eng
age
in a
spe
cifie
d le
vel o
f wor
k ac
tivity
and
ea
rnin
gs (r
efer
red
to a
s su
bsta
ntia
l gai
nful
act
ivity
in fe
dera
l sta
tute
) is
one
of th
e cr
iteria
for S
SDI e
ligib
ility
. How
ever
, SSI
or S
SDI r
ecei
pt is
als
o an
indi
cato
r of d
isab
ility
. For
an
adul
t to
be e
ligib
le fo
r SSI
or S
SDI,
he o
r she
mus
t hav
e a
med
ical
ly d
eter
min
able
phy
sica
l or m
enta
l im
pairm
ent t
hat i
s ex
pect
ed to
last
at l
east
12
mon
ths
or re
sult
in d
eath
.8
Cap
ture
s lim
itatio
ns o
r diff
icul
ties
in m
ovem
ent (
wal
king
, sta
ndin
g, b
endi
ng o
r kne
elin
g, re
achi
ng o
verh
ead,
and
usi
ng th
e ha
nds
and
finge
rs) a
nd s
enso
ry, e
mot
iona
l (i.e
., fe
elin
gs
that
inte
rfere
with
acc
ompl
ishi
ng d
aily
act
iviti
es),
or m
enta
l (i.e
., di
fficu
lties
with
rem
embe
ring
or e
xper
ienc
ing
conf
usio
n) fu
nctio
ning
that
are
ass
ocia
ted
with
som
e he
alth
pro
blem
.9
Refle
cts
a lim
itatio
n in
the
task
s an
d or
gani
zed
activ
ities
that
, whe
n ex
ecut
ed, m
ake
up n
umer
ous
soci
al ro
les,
suc
h as
wor
king
, att
endi
ng s
choo
l, or
mai
ntai
ning
a h
ouse
hold
. Ad
ults
are
def
ined
as
havi
ng a
com
plex
act
ivity
lim
itatio
n if
they
hav
e on
e or
mor
e of
the
follo
win
g ty
pes
of li
mita
tions
: sel
f-car
e lim
itatio
n, s
ocia
l lim
itatio
n, o
r wor
k lim
itatio
n.10
Fu
nctio
nal l
imita
tion
is d
efin
ed a
s “v
ery
diff
icul
t” o
r “ca
nnot
do”
for t
he fo
llow
ing
activ
ities
: gra
sp s
mal
l obj
ects
; rea
ch a
bove
one
’s h
ead;
sit
mor
e th
an 2
hou
rs; l
ift o
r car
ry
10 p
ound
s; c
limb
a fli
ght o
f sta
irs; p
ush
a he
avy
obje
ct; w
alk
a 1/
4 m
ile; s
tand
mor
e th
an 2
hou
rs; s
toop
, ben
d, o
r kne
el. T
hese
est
imat
es s
houl
d no
t be
com
pare
d to
the
2014
es
timat
es p
ublis
hed
in th
e De
cem
ber 2
015
data
boo
k w
hich
als
o in
clud
ed re
spon
ses
of “o
nly
a lit
tle” a
nd “s
omew
hat d
iffic
ult”
.11
Th
ese
estim
ates
sho
uld
not b
e co
mpa
red
to th
e 20
14 e
stim
ates
pub
lishe
d in
the
Dece
mbe
r 201
5 da
ta b
ook
due
to a
cha
nge
in th
e ch
arac
teris
tic’s
def
initi
on.
12 In
form
atio
n is
lim
ited
to w
omen
age
19–
44.
Sour
ce: M
ACPA
C, 2
016,
ana
lysi
s of
NH
IS d
ata.
EXH
IBIT
42.
(co
ntin
ued)

December 2016118
Section 5: Beneficiary Health, Service Use, and Access to Care
MAC
Stat
sSe
ctio
n 5
Char
acte
ristic
sPr
imar
y co
vera
ge s
ourc
e at
tim
e of
inte
rvie
w1
Tota
lM
edic
are
Priv
ate2
Med
icai
d/CH
IP3
Uni
nsur
ed4
Tota
l (pe
rcen
t dis
trib
utio
n ac
ross
cov
erag
e so
urce
s)5
100.
0%3.
9%69
.0%
10.8
%12
.8%
Cont
act w
ith h
ealth
car
e pr
ofes
sion
als
(pas
t 12
mon
ths)
Num
ber o
f tim
es s
aw a
doc
tor o
r oth
er h
ealth
pro
fess
iona
l, ex
clud
ing
dent
al v
isits
and
inpa
tient
hos
pita
l sta
ysN
one
20.7
*6.
0*16
.6*
18.8
51.0
*At
leas
t 179
.3*
94.0
*83
.4*
81.2
49.0
*1
19.2
*4.
8*21
.1*
14.3
17.3
*2–
326
.8*
19.4
*29
.8*
23.3
16.4
*4
or m
ore
33.3
69
.8*
32.5
*43
.615
.3*
Saw
sel
ecte
d he
alth
pro
fess
iona
lG
ener
al d
octo
r65
.2*
85.1
*68
.5
69.0
35.7
*G
ener
al d
octo
r, nu
rse
prac
titio
ner,
phys
icia
n as
sist
ant,
mid
wife
, or o
b-gy
n73
.4*
89.5
*77
.2
77.7
42.5
*M
edic
al s
peci
alis
t23
.4
52.0
*24
.4
22.7
8.4*
Eye
doct
or36
.4*
39.5
*41
.7*
27.5
14.3
*M
enta
l hea
lth p
rofe
ssio
nal
8.7
22.3
*7.
3*14
.34.
6*De
ntis
t63
.7*
42.5
*72
.5*
50.7
33.8
*An
y he
alth
pro
fess
iona
l, ex
clud
ing
dent
al6
81.2
*94
.0*
85.4
*82
.951
.7*
Any
heal
th p
rofe
ssio
nal,
incl
udin
g de
ntal
89.3
*95
.4*
93.4
*89
.164
.4*
Had
at l
east
1 o
vern
ight
hos
pita
l sta
y7.
1 24
.0*
5.5*
13.5
4.8*
Rece
ived
car
e at
hom
e1.
4 10
.9*
0.8*
3.2
† Re
ceip
t of a
ppro
pria
te c
are
(pas
t 12
mon
ths)
Had
cho
lest
erol
che
cked
7
All i
ndiv
idua
ls59
.7*
80.9
*63
.8*
59.7
29.2
*M
en a
ge 3
5–64
66.6
79
.9*
70.7
*65
.032
.1*
Indi
vidu
als
with
ele
vate
d ris
k of
car
diac
dis
ease
7, 8
69.1
*84
.6*
75.7
*65
.135
.3*
Had
flu
shot
All i
ndiv
idua
ls36
.5*
52.6
*40
.4*
31.0
14.7
*In
divi
dual
s ag
e 50
–64
47.9
56
.5*
50.8
*41
.619
.6*
EXH
IBIT
43.
Use
of C
are
amon
g N
on-In
stitu
tiona
lized
Indi
vidu
als
Age
19–
64 b
y Pr
imar
y So
urce
of H
ealth
Cov
erag
e, 2
015,
Dat
a fr
om
Nat
iona
l Hea
lth In
terv
iew
Sur
vey

MACStats: Medicaid and CHIP Data Book 119
Section 5: Beneficiary Health, Service Use, and Access to Care
MAC
Stat
sSe
ctio
n 5
Char
acte
ristic
sPr
imar
y co
vera
ge s
ourc
e at
tim
e of
inte
rvie
w1
Tota
lM
edic
are
Priv
ate2
Med
icai
d/CH
IP3
Uni
nsur
ed4
Had
any
test
for c
olor
ecta
l can
cer (
age
50–
64)
23.8
%30
.8%
*24
.4%
*20
.3%
11.3
%*
Had
Pap
sm
ear o
r tes
t for
cer
vica
l can
cer
(wom
en a
ge 2
1–60
)56
.5*
44.2
*60
.9*
56.4
33.3
*H
ad p
rofe
ssio
nal c
ouns
elin
g ab
out s
mok
ing
(cur
rent
sm
oker
s)53
.9
77.7
*56
.8
60.2
30.9
*H
ad m
ore
than
15
offic
e or
clin
ic v
isits
5.2
18.2
*4.
5*7.
81.
6*N
umbe
r of e
mer
genc
y ro
om v
isits
Non
e82
.0*
56.8
*86
.4*
66.1
81.6
*At
leas
t 118
.0*
43.2
*13
.6*
33.9
18.4
*1
11.4
21
.0*
9.9*
16.6
11.3
*2–
34.
7*15
.3*
2.7*
11.8
5.6*
4 or
mor
e1.
9 6.
9 1.
0*5.
51.
5*H
ad a
t lea
st 1
em
erge
ncy
room
vis
it, a
nd m
ost
rece
nt v
isit
was
for a
ser
ious
hea
lth p
robl
em13
.8*
36.2
*10
.3*
26.1
13.4
*
Not
es: O
b-gy
n is
obs
tetr
icia
n-gy
neco
logi
st. P
erce
ntag
e ca
lcul
atio
ns fo
r eac
h ite
m in
the
exhi
bit e
xclu
de in
divi
dual
s w
ith m
issi
ng a
nd u
nkno
wn
valu
es. T
he in
divi
dual
co
mpo
nent
s lis
ted
unde
r the
sub
cate
gorie
s ar
e no
t alw
ays
mut
ually
exc
lusi
ve a
nd m
ay n
ot a
dd to
100
per
cent
. Sta
ndar
d er
rors
are
ava
ilabl
e on
line
in th
e do
wnl
oada
ble
Exce
l ve
rsio
n of
this
exh
ibit
at h
ttps
://w
ww
.mac
pac.
gov/
publ
icat
ion/
use-
of-c
are-
amon
g-no
n-in
stitu
tiona
lized
-indi
vidu
als-
age-
19-6
4-by
-prim
ary-
sour
ce-o
f-hea
lth-c
over
age-
data
-fr
om-n
atio
nal-h
ealth
-inte
rvie
w-s
urve
y/. D
ue to
diff
eren
ces
in m
etho
dolo
gy (s
uch
as th
e w
ordi
ng o
f que
stio
ns, l
engt
h of
reca
ll pe
riods
, and
pro
mpt
s or
pro
bes
used
to e
licit
resp
onse
s), e
stim
ates
obt
aine
d fr
om d
iffer
ent s
urve
y da
ta s
ourc
es w
ill v
ary.
For
exa
mpl
e, th
e N
atio
nal H
ealth
Inte
rvie
w S
urve
y (N
HIS
) is
know
n to
pro
duce
hig
her e
stim
ates
of
ser
vice
use
than
the
Med
ical
Exp
endi
ture
s Pa
nel S
urve
y (M
EPS)
. For
pur
pose
s of
com
parin
g gr
oups
of i
ndiv
idua
ls (a
s in
this
exh
ibit)
, the
NH
IS p
rovi
des
the
mos
t rec
ent
info
rmat
ion
avai
labl
e. F
or o
ther
pur
pose
s, s
uch
as m
easu
ring
leve
ls o
f use
rela
tive
to a
par
ticul
ar b
ench
mar
k or
goa
l, it
may
be
appr
opria
te to
con
sult
estim
ates
from
MEP
S or
an
othe
r sou
rce.
* Di
ffer
ence
from
Med
icai
d/CH
IP is
sta
tistic
ally
sig
nific
ant a
t the
0.0
5 le
vel.
† Es
timat
e is
unr
elia
ble
beca
use
it ha
s a
rela
tive
stan
dard
err
or g
reat
er th
an 3
0 pe
rcen
t.
– D
ash
indi
cate
s ze
ro; 0
.0%
indi
cate
s an
am
ount
less
than
0.0
5% th
at ro
unds
to z
ero.
1 To
tal i
nclu
des
all n
on-in
stitu
tiona
lized
indi
vidu
als
age
19–
64, r
egar
dles
s of
cov
erag
e so
urce
. In
this
exh
ibit,
the
follo
win
g hi
erar
chy
was
use
d to
ass
ign
indi
vidu
als
with
mul
tiple
co
vera
ge s
ourc
es to
a p
rimar
y so
urce
: Med
icar
e, p
rivat
e, M
edic
aid/
CHIP
, oth
er, u
nins
ured
. Not
sep
arat
ely
show
n ar
e th
e es
timat
es fo
r tho
se c
over
ed b
y an
y ty
pe o
f mili
tary
hea
lth
plan
or o
ther
gov
ernm
ent-s
pons
ored
pro
gram
s. C
over
age
sour
ce is
def
ined
as
of th
e tim
e of
the
surv
ey in
terv
iew
. Sin
ce a
n in
divi
dual
may
hav
e m
ultip
le c
over
age
sour
ces
or
chan
ges
over
tim
e, re
spon
ses
to s
urve
y qu
estio
ns m
ay re
flect
cha
ract
eris
tics
or e
xper
ienc
es a
ssoc
iate
d w
ith a
cov
erag
e so
urce
oth
er th
an th
e on
e as
sign
ed in
this
exh
ibit.
2 Pr
ivat
e he
alth
insu
ranc
e co
vera
ge e
xclu
des
plan
s th
at p
aid
for o
nly
one
type
of s
ervi
ce, s
uch
as a
ccid
ents
or d
enta
l car
e.3
Med
icai
d/CH
IP a
lso
incl
udes
per
sons
cov
ered
by
othe
r sta
te-s
pons
ored
hea
lth p
lans
.
EXH
IBIT
43.
(co
ntin
ued)

December 2016120
Section 5: Beneficiary Health, Service Use, and Access to Care
MAC
Stat
sSe
ctio
n 5
4 In
divi
dual
s w
ere
defin
ed a
s un
insu
red
if th
ey d
id n
ot h
ave
any
priv
ate
heal
th in
sura
nce,
Med
icai
d, C
HIP
, Med
icar
e, s
tate
- or o
ther
gov
ernm
ent-s
pons
ored
hea
lth p
lan,
or
mili
tary
pla
n. In
divi
dual
s w
ere
also
def
ined
as
unin
sure
d if
they
had
onl
y In
dian
Hea
lth S
ervi
ce c
over
age
or h
ad o
nly
a pr
ivat
e pl
an th
at p
aid
for o
ne ty
pe o
f ser
vice
, suc
h as
ac
cide
nts
or d
enta
l car
e.5
Due
to th
e fa
ct th
at a
hie
rarc
hy w
as u
sed
in th
is e
xhib
it to
ass
ign
indi
vidu
als
with
mul
tiple
cov
erag
e so
urce
s to
a p
rimar
y so
urce
(see
not
e 1)
, the
Med
icai
d/CH
IP p
erce
ntag
es
show
n in
this
row
exc
lude
indi
vidu
als
who
als
o ha
ve M
edic
are
or p
rivat
e co
vera
ge. C
ompo
nent
s do
not
sum
to 1
00 p
erce
nt b
ecau
se n
ot a
ll co
vera
ge s
ourc
es a
re s
how
n.6
Any
heal
th p
rofe
ssio
nal i
nclu
des
gene
ral d
octo
r, nu
rse
prac
titio
ner,
phys
icia
n as
sist
ant,
mid
wife
, ob-
gyn,
med
ical
spe
cial
ist,
eye
doct
or, m
enta
l hea
lth p
rofe
ssio
nal,
ther
apis
t, ch
iropr
acto
r, or
pod
iatr
ist.
7 Th
ese
estim
ates
sho
uld
not b
e co
mpa
red
to th
e 20
14 e
stim
ates
pub
lishe
d in
the
Dece
mbe
r 201
5 da
ta b
ook
due
to a
cha
nge
in th
e sc
reen
ing
ques
tions
for c
hole
ster
ol,
bloo
d pr
essu
re, a
nd d
iabe
tes.
In 2
014,
the
NH
IS in
clud
ed a
dditi
onal
blo
od p
ress
ure
and
chol
este
rol s
cree
ning
que
stio
ns a
s pa
rt o
f the
sup
plem
enta
l que
stio
ns p
erta
inin
g to
th
e M
illio
n H
eart
s® In
itiat
ive
that
wer
e on
ly u
sed
in 2
014.
The
201
5 N
HIS
scr
eeni
ng q
uest
ions
reve
rted
bac
k to
the
orig
inal
scr
eeni
ng q
uest
ions
and
sho
uld
be c
ompa
rabl
e w
ith
year
s ea
rlier
than
201
4.8
Indi
vidu
als
of a
ny a
ge o
r sex
who
repo
rt h
yper
tens
ion
or d
iabe
tes,
or w
ho c
urre
ntly
sm
oke.
Sour
ce: M
ACPA
C, 2
016,
ana
lysi
s of
NH
IS d
ata.
EXH
IBIT
43.
(co
ntin
ued)

MACStats: Medicaid and CHIP Data Book 121
Section 5: Beneficiary Health, Service Use, and Access to Care
MAC
Stat
sSe
ctio
n 5
Char
acte
ristic
s
Prim
ary
cove
rage
sou
rce
at ti
me
of m
ost r
ecen
t int
ervi
ew1
Tota
lM
edic
are
Priv
ate2
Med
icai
d/CH
IP3
Uni
nsur
ed4
Tota
l (pe
rcen
t dis
trib
utio
n ac
ross
cov
erag
e so
urce
s)5
100.
0%3.
9%65
.8%
10.0
%18
.6%
Cont
act w
ith h
ealth
car
e pr
ofes
sion
als
(pas
t 12
mon
ths)
Num
ber o
f off
ice-
base
d vi
sits
(to
a do
ctor
or o
ther
hea
lth p
rofe
ssio
nal),
exc
ludi
ng d
enta
l vis
its a
nd in
patie
nt h
ospi
tal s
tays
Non
e30
.3
6.1 *
25.0
*29
.654
.6*
At le
ast 1
69.7
93
.9*
75.0
*70
.445
.4*
115
.6*
4.6*
16.3
*13
.716
.9*
2–3
18.3
*12
.1*
20.8
*15
.811
.7*
4 or
mor
e35
.8*
77.2
*37
.8
41.0
16.8
*H
ad a
t lea
st 1
ove
rnig
ht h
ospi
tal s
tay
5.7*
22.3
*4.
5*10
.93.
4 *Re
ceiv
ed c
are
at h
ome
1.7 *
16.5
*0.
8*3.
40.
9*Sa
w a
gen
eral
den
tist
35.6
*25
.7
43.8
*25
.314
.2*
Saw
an
orth
odon
tist
1.2
† 1.
4 1.
00.
5 *Re
ceip
t of a
ppro
pria
te c
are
(pas
t 12
mon
ths)
Had
den
tal c
lean
ing,
pro
phyl
axis
, or p
olis
hing
655
.0*
33.0
58
.2*
37.7
46.5
*H
ad m
ore
than
15
offic
e-ba
sed
or h
ospi
tal o
utpa
tient
vis
its9.
3*34
.0*
9.0*
12.2
3.4*
Num
ber o
f em
erge
ncy
room
vis
itsN
one
87.1
*65
.3*
90.2
*76
.387
.1*
At le
ast 1
12.9
*34
.7*
9.8*
23.7
12.9
*1
9.3 *
17.9
7.
7 *15
.69.
4 *2–
33.
0*13
.7*
1.9*
6.3
3.2*
4 or
mor
e0.
6*3.
2 0.
3 *1.
8†
Not
es: P
erce
ntag
e ca
lcul
atio
ns fo
r eac
h ite
m in
the
exhi
bit e
xclu
de in
divi
dual
s w
ith m
issi
ng a
nd u
nkno
wn
valu
es. S
tand
ard
erro
rs a
re a
vaila
ble
onlin
e in
the
dow
nloa
dabl
e Ex
cel v
ersi
on o
f thi
s ex
hibi
t at h
ttps
://w
ww
.mac
pac.
gov/
publ
icat
ion/
use-
of-c
are-
amon
g-no
n-in
stitu
tiona
lized
-indi
vidu
als-
age-
19-6
4-by
-prim
ary-
sour
ce-o
f-hea
lth-c
over
age-
data
-fr
om-m
edic
al-e
xpen
ditu
res-
pane
l-sur
vey/
. Due
to d
iffer
ence
s in
met
hodo
logy
(suc
h as
the
wor
ding
of q
uest
ions
, len
gth
of re
call
perio
ds, a
nd p
rom
pts
or p
robe
s us
ed to
elic
it re
spon
ses)
, est
imat
es o
btai
ned
from
diff
eren
t sur
vey
data
sou
rces
will
var
y. F
or e
xam
ple,
the
Nat
iona
l Hea
lth In
terv
iew
Sur
vey
(NH
IS) i
s kn
own
to p
rodu
ce h
ighe
r est
imat
es o
f se
rvic
e us
e th
an th
e M
edic
al E
xpen
ditu
res
Pane
l Sur
vey
(MEP
S). F
or p
urpo
ses
of c
ompa
ring
grou
ps o
f ind
ivid
uals
, the
NH
IS p
rovi
des
the
mos
t rec
ent i
nfor
mat
ion
avai
labl
e.
For o
ther
pur
pose
s, s
uch
as m
easu
ring
leve
ls o
f use
rela
tive
to a
par
ticul
ar b
ench
mar
k or
goa
l, it
may
be
appr
opria
te to
con
sult
estim
ates
from
MEP
S or
ano
ther
sou
rce.
* Di
ffer
ence
from
Med
icai
d/CH
IP is
sta
tistic
ally
sig
nific
ant a
t the
0.0
5 le
vel.
† Es
timat
e is
unr
elia
ble
beca
use
it ha
s a
rela
tive
stan
dard
err
or g
reat
er th
an 3
0 pe
rcen
t.
EXH
IBIT
44.
Use
of C
are
amon
g N
on-In
stitu
tiona
lized
Indi
vidu
als
Age
19–
64 b
y Pr
imar
y So
urce
of H
ealth
Cov
erag
e, 2
014,
Dat
a fro
m
Med
ical
Exp
endi
ture
s Pa
nel S
urve
y

December 2016122
Section 5: Beneficiary Health, Service Use, and Access to Care
MAC
Stat
sSe
ctio
n 5
– D
ash
indi
cate
s ze
ro; 0
.0%
indi
cate
s an
am
ount
less
than
0.0
5% th
at ro
unds
to z
ero.
1 To
tal i
nclu
des
all n
on-in
stitu
tiona
lized
indi
vidu
als
age
19–
64, r
egar
dles
s of
cov
erag
e so
urce
. In
this
exh
ibit,
the
follo
win
g hi
erar
chy
was
use
d to
ass
ign
indi
vidu
als
with
m
ultip
le c
over
age
sour
ces
to a
prim
ary
sour
ce: M
edic
are,
priv
ate,
Med
icai
d/CH
IP, o
ther
, uni
nsur
ed. N
ot s
epar
atel
y sh
own
are
the
estim
ates
for t
hose
cov
ered
by
any
type
of
mili
tary
hea
lth p
lan
or o
ther
gov
ernm
ent-s
pons
ored
pro
gram
s. C
over
age
sour
ce is
def
ined
as
of th
e tim
e of
the
mos
t rec
ent s
urve
y in
terv
iew
. Sin
ce a
n in
divi
dual
may
hav
e m
ultip
le c
over
age
sour
ces
or c
hang
es o
ver t
ime,
resp
onse
s to
sur
vey
ques
tions
may
refle
ct c
hara
cter
istic
s or
exp
erie
nces
ass
ocia
ted
with
a c
over
age
sour
ce o
ther
than
the
one
assi
gned
in th
is e
xhib
it.2
Priv
ate
heal
th in
sura
nce
cove
rage
exc
lude
s pl
ans
that
pai
d fo
r onl
y on
e ty
pe o
f ser
vice
, suc
h as
acc
iden
ts o
r den
tal c
are.
3 M
edic
aid/
CHIP
als
o in
clud
es p
erso
ns c
over
ed b
y ot
her s
tate
-spo
nsor
ed h
ealth
pla
ns.
4 In
divi
dual
s w
ere
defin
ed a
s un
insu
red
if th
ey d
id n
ot h
ave
any
priv
ate
heal
th in
sura
nce,
Med
icai
d, C
HIP
, Med
icar
e, s
tate
- or o
ther
gov
ernm
ent-s
pons
ored
hea
lth p
lan,
or
mili
tary
pla
n. In
divi
dual
s w
ere
also
def
ined
as
unin
sure
d if
they
had
onl
y In
dian
Hea
lth S
ervi
ce c
over
age
or h
ad o
nly
a pr
ivat
e pl
an th
at p
aid
for o
ne ty
pe o
f ser
vice
, suc
h as
ac
cide
nts
or d
enta
l car
e.5
Due
to th
e fa
ct th
at a
hie
rarc
hy w
as u
sed
in th
is e
xhib
it to
ass
ign
indi
vidu
als
with
mul
tiple
cov
erag
e so
urce
s to
a p
rimar
y so
urce
(see
not
e 1)
, the
Med
icai
d/CH
IP
perc
enta
ges
show
n in
this
row
exc
lude
indi
vidu
als
who
als
o ha
ve M
edic
are
or p
rivat
e co
vera
ge. C
ompo
nent
s do
not
sum
to 1
00 p
erce
nt b
ecau
se n
ot a
ll co
vera
ge s
ourc
es a
re
show
n.6
Lim
ited
to p
eopl
e w
ho re
port
ed a
den
tal e
vent
in 2
014.
Sour
ce: M
ACPA
C, 2
016,
ana
lysi
s of
MEP
S da
ta.
EXH
IBIT
44.
(co
ntin
ued)

MACStats: Medicaid and CHIP Data Book 123
Section 5: Beneficiary Health, Service Use, and Access to Care
MAC
Stat
sSe
ctio
n 5
Char
acte
ristic
sPr
imar
y co
vera
ge s
ourc
e at
tim
e of
inte
rvie
w1
Tota
lM
edic
are
Priv
ate2
Med
icai
d/CH
IP3
Uni
nsur
ed4
Tota
l (pe
rcen
t dis
trib
utio
n ac
ross
cov
erag
e so
urce
s)5
100.
0%3.
9%69
.0%
10.8
%12
.8%
Conn
ectio
n to
the
heal
th c
are
syst
em (p
ast 1
2 m
onth
s)H
as a
usu
al s
ourc
e of
car
e682
.7*
93.3
*88
.2*
84.7
46.2
*H
ad th
e sa
me
usua
l sou
rce
of m
edic
al c
are
12
mon
ths
ago
75.4
83
.0*
80.7
*75
.642
.6*
Had
trou
ble
findi
ng a
doc
tor o
r was
told
that
co
vera
ge o
r new
pat
ient
s w
ere
not a
ccep
ted7
6.4*
13.2
*5.
0*9.
89.
1 Ti
mel
ines
s of
car
e (p
ast 1
2 m
onth
s)De
laye
d m
edic
al c
are
due
to a
ny a
cces
s ba
rrie
r ind
icat
ed b
elow
18.1
*31
.7*
13.7
*24
.032
.1*
Dela
yed
beca
use
of c
osts
9.3
15.0
*6.
1*9.
025
.9*
Dela
yed
for p
rovi
der-r
elat
ed re
ason
s810
.1*
17.7
8.
8*14
.99.
0*De
laye
d du
e to
lack
of t
rans
port
atio
n1.
8*9.
6*0.
5*6.
12.
6*U
nmet
nee
d fo
r sel
ecte
d ty
pes
of c
are
due
to c
ost
Med
ical
car
e7.
0 12
.7*
3.8*
7.9
21.9
*M
enta
l hea
lth c
are
or c
ouns
elin
g2.
3*5.
4*1.
3*3.
55.
7*De
ntal
car
e12
.0*
26.2
*6.
9*19
.228
.4*
Pres
crip
tion
drug
s7.
0*19
.2*
3.9*
10.5
17.6
*Ey
egla
sses
7.1*
19.6
*4.
0*12
.315
.8*
Spec
ialis
t car
e4.
7*10
.2*
2.5*
6.5
13.5
*Fo
llow
-up
care
4.0
7.2*
2.0*
5.0
13.7
*
Not
es: P
erce
ntag
e ca
lcul
atio
ns fo
r eac
h ite
m in
the
tabl
e ex
clud
e in
divi
dual
s w
ith m
issi
ng a
nd u
nkno
wn
valu
es. T
he in
divi
dual
com
pone
nts
liste
d un
der t
he s
ubca
tego
ries
are
not m
utua
lly e
xclu
sive
and
may
not
add
to 1
00 p
erce
nt. S
tand
ard
erro
rs a
re a
vaila
ble
onlin
e in
the
dow
nloa
dabl
e Ex
cel v
ersi
on o
f thi
s ex
hibi
t at h
ttps
://w
ww
.mac
pac.
gov/
publ
icat
ion/
mea
sure
s-of
-acc
ess-
to-c
are-
for-n
on-in
stitu
tiona
lized
-indi
vidu
als-
age-
19-6
4-by
-sou
rce-
of-h
ealth
-cov
erag
e/. D
ue to
diff
eren
ces
in m
etho
dolo
gy (s
uch
as th
e w
ordi
ng
of q
uest
ions
, len
gth
of re
call
perio
ds, a
nd p
rom
pts
or p
robe
s us
ed to
elic
it re
spon
ses)
, est
imat
es o
btai
ned
from
diff
eren
t sur
vey
data
sou
rces
will
var
y. F
or e
xam
ple,
the
Nat
iona
l Hea
lth In
terv
iew
Sur
vey
(NH
IS) i
s kn
own
to p
rodu
ce h
ighe
r est
imat
es o
f ser
vice
use
than
the
Med
ical
Exp
endi
ture
s Pa
nel S
urve
y (M
EPS)
. For
pur
pose
s of
com
parin
g gr
oups
of i
ndiv
idua
ls (a
s in
this
exh
ibit)
, the
NH
IS p
rovi
des
the
mos
t rec
ent i
nfor
mat
ion
avai
labl
e. F
or o
ther
pur
pose
s, s
uch
as m
easu
ring
leve
ls o
f use
rela
tive
to a
par
ticul
ar
benc
hmar
k or
goa
l, it
may
be
appr
opria
te to
con
sult
estim
ates
from
MEP
S or
ano
ther
sou
rce.
* Di
ffer
ence
from
Med
icai
d/CH
IP is
sta
tistic
ally
sig
nific
ant a
t the
0.0
5 le
vel.
EXH
IBIT
45.
Mea
sure
s of
Acc
ess
to C
are
amon
g N
on-In
stitu
tiona
lized
Indi
vidu
als
Age
19–
64 b
y Pr
imar
y So
urce
of H
ealth
Co
vera
ge, 2
015

December 2016124
Section 5: Beneficiary Health, Service Use, and Access to Care
MAC
Stat
sSe
ctio
n 5
† Es
timat
e is
unr
elia
ble
beca
use
it ha
s a
rela
tive
stan
dard
err
or g
reat
er th
an 3
0 pe
rcen
t.
– D
ash
indi
cate
s ze
ro; 0
.0%
indi
cate
s an
am
ount
less
than
0.0
5% th
at ro
unds
to z
ero.
1 To
tal i
nclu
des
all n
on-in
stitu
tiona
lized
indi
vidu
als
age
19–
64, r
egar
dles
s of
cov
erag
e so
urce
. In
this
exh
ibit,
the
follo
win
g hi
erar
chy
was
use
d to
ass
ign
indi
vidu
als
with
m
ultip
le c
over
age
sour
ces
to a
prim
ary
sour
ce: M
edic
are,
priv
ate,
Med
icai
d/CH
IP, o
ther
, uni
nsur
ed. N
ot s
epar
atel
y sh
own
are
the
estim
ates
for t
hose
cov
ered
by
any
type
of
mili
tary
hea
lth p
lan
or o
ther
gov
ernm
ent-s
pons
ored
pro
gram
s. C
over
age
sour
ce is
def
ined
as
of th
e tim
e of
the
surv
ey in
terv
iew
. Sin
ce a
n in
divi
dual
may
hav
e m
ultip
le
cove
rage
sou
rces
or c
hang
es o
ver t
ime,
resp
onse
s to
sur
vey
ques
tions
may
refle
ct c
hara
cter
istic
s or
exp
erie
nces
ass
ocia
ted
with
a c
over
age
sour
ce o
ther
than
the
one
assi
gned
in th
is e
xhib
it.2
Priv
ate
heal
th in
sura
nce
cove
rage
exc
lude
s pl
ans
that
pai
d fo
r onl
y on
e ty
pe o
f ser
vice
, suc
h as
acc
iden
ts o
r den
tal c
are.
3 M
edic
aid/
CHIP
als
o in
clud
es p
erso
ns c
over
ed b
y ot
her s
tate
-spo
nsor
ed h
ealth
pla
ns.
4 In
divi
dual
s w
ere
defin
ed a
s un
insu
red
if th
ey d
id n
ot h
ave
any
priv
ate
heal
th in
sura
nce,
Med
icai
d, C
HIP
, Med
icar
e, s
tate
- or o
ther
gov
ernm
ent-s
pons
ored
hea
lth p
lan,
or
mili
tary
pla
n. In
divi
dual
s w
ere
also
def
ined
as
unin
sure
d if
they
had
onl
y In
dian
Hea
lth S
ervi
ce c
over
age
or h
ad o
nly
a pr
ivat
e pl
an th
at p
aid
for o
ne ty
pe o
f ser
vice
, suc
h as
ac
cide
nts
or d
enta
l car
e.5
Due
to th
e fa
ct th
at a
hie
rarc
hy w
as u
sed
in th
is e
xhib
it to
ass
ign
indi
vidu
als
with
mul
tiple
cov
erag
e so
urce
s to
a p
rimar
y so
urce
(see
not
e 1)
, the
Med
icai
d/CH
IP p
erce
ntag
es
show
n in
this
row
exc
lude
indi
vidu
als
who
als
o ha
ve M
edic
are
or p
rivat
e co
vera
ge. C
ompo
nent
s do
not
sum
to 1
00 p
erce
nt b
ecau
se n
ot a
ll co
vera
ge s
ourc
es a
re s
how
n.6
Excl
udes
em
erge
ncy
room
.7
Indi
vidu
al re
port
ed o
ne o
f the
se b
arrie
rs in
the
past
12
mon
ths:
trou
ble
findi
ng a
doc
tor o
r pro
vide
r, do
ctor
’s o
ffic
e/cl
inic
did
not
acc
ept c
hild
’s in
sura
nce
cove
rage
, or o
ffic
e/cl
inic
did
not
acc
ept t
he c
hild
as
a ne
w p
atie
nt.
8 In
clud
es a
ny o
f the
follo
win
g: in
divi
dual
cou
ld n
ot g
et a
n ap
poin
tmen
t, ha
d to
wai
t too
long
to s
ee d
octo
r, co
uld
not g
o w
hen
open
, cou
ld n
ot g
et th
roug
h on
pho
ne, i
ndiv
idua
l sp
eaks
a d
iffer
ent l
angu
age.
Sour
ce: M
ACPA
C, 2
016,
ana
lysi
s of
NH
IS d
ata.
EXH
IBIT
45.
(co
ntin
ued)

SECTION 6
Technical Guide to MACStats


MACStats: Medicaid and CHIP Data Book 127
Section 6: Technical Guide to MACStats
MAC
Stat
sSe
ctio
n 6
This technical guide provides supplementary information to help readers interpret the exhibits in this data book as well as understand the data sources and methods used. In addition, we explain why MACPAC’s statistics, particularly those on enrollment and spending, may differ from each other or from those published elsewhere.1
Interpreting Medicaid and CHIP Enrollment and Spending NumbersPublished numbers for enrollment in Medicaid and the State Children’s Health Insurance Program (CHIP) can vary substantially depending on the source of data, the enrollment period examined, and the individuals included in the data.
Data sourcesMedicaid and CHIP enrollment and spending numbers are available from data compiled by states and the federal government in the course of administering these programs. Program data are updated on different schedules, so the latest year of available data may differ depending on the source. MACPAC commonly uses the following types of administrative data, which are submitted by the states to the Centers for Medicare & Medicaid Services (CMS):
• Form CMS-64 data for state-level Medicaid spending;
• Medicaid Statistical Information System (MSIS) data for person-level detail;
• Medicaid managed care enrollment reports; and
• Statistical Enrollment Data System (SEDS) data for CHIP enrollment.
In addition, CMS recently began compiling two new administrative data sources, referred to here as
performance indicator enrollment data and CMS-64 enrollment data.2 Notable differences between these sources include the timing of the reports and the beneficiaries covered: the performance indicator enrollment data are published monthly by CMS and only include full-benefit Medicaid and CHIP enrollees, while CMS-64 enrollment data are published quarterly and include those with limited benefits but exclude CHIP enrollees. Both sources provide more up-to-date information than the MSIS. Although timelier reporting is expected under a new version of the MSIS, referred to as the transformed MSIS (T-MSIS), full implementation has been delayed and states are still in the process of transitioning to T-MSIS reporting.
MACStats also uses nationally representative surveys based on interviews of individuals including the National Health Interview Survey (NHIS) and the Medical Expenditures Panel Survey (MEPS). Estimates of Medicaid and CHIP enrollment from survey data tend to be lower than estimates generated from administrative data, in part because survey respondents tend to underreport Medicaid and CHIP coverage. However, survey data provide many more details on individual and family circumstances (for example, health status, ease in accessing services, and reasons for delaying care) and can therefore provide a richer picture of the individuals enrolled in Medicaid and CHIP.
Enrollment period examinedCharacterizations of the size of the Medicaid and CHIP populations may vary based on the enrollment period examined. The number of individuals enrolled at a particular point during the year will be lower than the total number enrolled at any point during an entire year. Point-in-time numbers are sometimes referred to as average, full-year equivalent, or person-year enrollment. These statistics are often used for budget analyses (such as those by the CMS Office of the Actuary) and when comparing enrollment and expenditure numbers. Per enrollee spending levels based on

December 2016128
Section 6: Technical Guide to MACStats
MAC
Stat
sSe
ctio
n 6
full-year equivalents ensure that amounts are not biased by individuals’ transitions in and out of Medicaid coverage during the year.
Enrollees versus beneficiariesDepending on the source and the year in question, data may reflect different ways of characterizing individuals in Medicaid. Certain terms commonly used to refer to people with Medicaid have extremely specific definitions in administrative data sources provided by CMS:3
• Enrollees (less commonly referred to as eligibles) are individuals who are eligible for and enrolled in Medicaid or CHIP. Prior to fiscal year (FY) 1990, CMS did not track the number of Medicaid enrollees, and tracked only beneficiaries (see below). In some cases, CMS has estimated the number of enrollees prior to 1990.
• Beneficiaries, or persons served (less commonly referred to as recipients), are enrollees who receive covered services or for whom Medicaid or CHIP payments are made. Prior to FY 1998, individuals were not counted as beneficiaries if managed care payments were the only Medicaid payments made on their behalf. Beginning in FY 1998, however, Medicaid managed care enrollees with no fee-for-service (FFS) spending were also counted as beneficiaries, which increased the number of individuals reflected in enrollment statistics. Generally, the number of beneficiaries will approach the number of enrollees as more of these individuals use Medicaid-covered services or are enrolled in managed care.4 (In common usage outside of statistical publications from CMS, the term beneficiaries typically is synonymous with enrollees.)
Institutionalized and limited-benefit enrollees Administrative Medicaid data include enrollees who are in institutions such as nursing homes, as well as individuals who receive only limited benefits (for example, only coverage for emergency services). Survey data tend to exclude such individuals from counts of coverage. In percentage terms, the difference between estimates from administrative data and estimates from survey data tends to be largest among older beneficiaries, who are more likely to be living in institutions (in which case they are excluded from most surveys) and more likely to be receiving limited Medicaid benefits that pay only for their Medicare premiums and cost sharing (which may not be counted as Medicaid coverage in some surveys).
State Children’s Health Insurance Program enrolleesMedicaid-expansion CHIP enrollees are children who are entitled to the covered services of a state’s Medicaid program, but whose Medicaid coverage is generally funded with CHIP dollars. Depending on the data source, Medicaid enrollment and spending figures may include not only Medicaid enrollees funded with Medicaid dollars, but also Medicaid-expansion CHIP enrollees funded with CHIP dollars. For MACStats, we generally exclude Medicaid-expansion CHIP enrollees from Medicaid analyses, but some data sources do not allow these children to be broken out separately.
Understanding Data on Health and Other Characteristics of Medicaid and CHIP PopulationsMACStats uses data from the federal NHIS and MEPS to describe Medicaid and CHIP enrollees in terms of their self-reported demographic, socioeconomic, and health characteristics as well as their use of care. Background information

MACStats: Medicaid and CHIP Data Book 129
Section 6: Technical Guide to MACStats
MAC
Stat
sSe
ctio
n 6
on these surveys is provided here, along with information on how children with special health care needs are identified using NHIS data.
National Health Interview Survey and Medical Expenditures Panel Survey dataThe NHIS is an annual face-to-face household survey of civilian non-institutionalized persons designed to monitor the health of the U.S. population through the collection of information on a broad range of health topics.5 A subsample of households that participated in the previous year’s NHIS undergo further interviews for the household component of the MEPS, which collects more detailed information on use of health care services and expenditures.6
Although other surveys are available, the NHIS is the main survey data source used in MACStats because it provides relatively timely estimates and because its sample size is large enough to produce reliable subgroup estimates and to detect meaningful differences between them. In addition, it is generally considered to be one of the best surveys for health insurance coverage estimates, and it captures detailed information on individuals’ health status.7
However, the NHIS is known to produce higher estimates of service use than the MEPS.8 As a result, MACStats includes estimates of service use from both sources. For purposes of comparing groups of individuals, the NHIS has the advantage of providing the most recent information available; for other purposes, such as measuring levels of service use relative to a particular benchmark or goal, consulting estimates from the MEPS or another source might be more appropriate.
The NHIS does have some limitations. As in most surveys, respondents in the NHIS do not always accurately report information about participation in programs such as Medicaid, CHIP, Medicare, Supplemental Security Income (SSI), and Social Security Disability Insurance. As a result, survey data may not match estimates of program
participation computed from the programs’ own administrative data. In addition, although the NHIS asks about participation in Medicaid and CHIP in two different questions, program participation estimates from the survey are not reported separately. One reason for this is that many states’ CHIP and Medicaid programs use the same name, so respondents may not necessarily know which program funds their children’s coverage. Even when the programs have different names, it may be difficult for respondents and interviewers to correctly categorize the coverage. As a result, separate survey questions regarding participation in Medicaid and CHIP are generally used to minimize the undercounting of Medicaid and CHIP enrollees, not to produce valid estimates separately for each program. Thus, survey data analyses typically combine Medicaid and CHIP into a single category.
Children with special health care needsThe term children with special health care needs (CSHCN), is defined by the U.S. Department of Health and Human Services’ Maternal and Child Health Bureau as a group of children who “have or are at increased risk for a chronic physical, developmental, behavioral, or emotional condition and who also require health and related services of a type or amount beyond that required by children generally.”9 This definition is used by all states for policy and program planning purposes and encompasses children with disabilities and also children with chronic conditions (e.g., asthma, juvenile diabetes, sickle cell anemia) that range from mild to severe. The category of CSHCN covers a broader range of children than the category of children with conditions severe enough and family incomes low enough to qualify for SSI.10
MACPAC uses responses to several questions on the NHIS to identify such children. This definition includes children with at least one diagnosed or parent-reported condition expected to be an ongoing health condition who also meet at least one of five criteria related to elevated service use or elevated need:11

December 2016130
Section 6: Technical Guide to MACStats
MAC
Stat
sSe
ctio
n 6
• The child is limited in his or her ability or unable to do things most children the same age can do.12
• The child needs or uses medications prescribed by a doctor (other than vitamins).13
• The child needs or uses specialized therapies such as physical, occupational, or speech therapy.14
• The child has above-routine need or use of medical, mental health, home care, or education services.15
• The child needs or receives treatment or counseling for an emotional, behavioral, or developmental problem.16
Estimates for the category of CSHCN in this edition of MACStats are not directly comparable to those in prior years, which used a slightly different definition.17
Methodology for Adjusting Benefit Spending DataThe FY 2013 Medicaid benefit spending amounts presented in this data book were calculated based on MSIS data that have been adjusted to match total benefit spending reported by states in CMS-64 data.18
Although the CMS-64 provides a more complete accounting of spending than the MSIS and is preferred when examining state or federal spending totals, it cannot be used for analysis of benefit spending by eligibility group and other enrollee characteristics.19 Thus, we adjust MSIS amounts for several reasons:
• CMS-64 data provide an official accounting of state spending on Medicaid for purposes of receiving federal matching dollars; in contrast, MSIS data are used primarily for statistical purposes.
• The MSIS generally understates total Medicaid benefit spending because it
excludes disproportionate share hospital (DSH) payments and additional types of supplemental payments made to hospitals and other providers, Medicare premium payments, and certain other amounts.20
• The MSIS generally overstates net spending on prescribed drugs because it excludes rebates from drug manufacturers.
• Even after accounting for differences in their scope and design, the MSIS still tends to produce lower total benefit spending than the CMS-64.21
• The extent to which the MSIS differs from the CMS-64 varies by state, meaning that a cross-state comparison of unadjusted MSIS amounts may not reflect true differences in benefit spending. See Exhibit 46 for unadjusted benefit spending amounts in the MSIS as a percentage of benefit spending in the CMS-64.
The methodology MACPAC uses for adjusting MSIS benefit spending data involves the following steps:
• We aggregate the service types into broad categories that are comparable between the two sources. This is necessary because there is not a one-to-one correspondence of service types in MSIS and CMS-64 data. Even service types that have identical names may still be reported differently in the two sources due to differences in the instructions given to states. Exhibit 47 provides additional detail on the categories used.
• We calculate state-specific adjustment factors for each of the service categories by dividing CMS-64 benefit spending by MSIS benefit spending.
• We then multiply MSIS dollar amounts in each service category by the state-specific factors to obtain adjusted MSIS spending. For example, in a state with an FFS hospital factor of 1.2, each Medicaid enrollee with

MACStats: Medicaid and CHIP Data Book 131
Section 6: Technical Guide to MACStats
MAC
Stat
sSe
ctio
n 6
hospital spending in the MSIS would have that spending multiplied by 1.2; doing so makes the sum of adjusted hospital spending amounts among individual Medicaid enrollees in the MSIS total the aggregate hospital spending reported by states in the CMS-64 (as noted later, MACPAC excludes some amounts from the CMS-64 hospital total).22
These adjustments to MSIS data are meant to provide more complete estimates of Medicaid benefit spending across states that can be analyzed by eligibility group and other enrollee characteristics. Other organizations, including the CMS Office of the Actuary, the Kaiser Commission on Medicaid and the Uninsured, and the Urban Institute, use similar methodologies although these may differ in some ways—for example, by using different service categories or producing estimates for future years based on actual data from earlier years.
Readers should note that due to changes in both methods and data, MSIS figures shown here are not directly comparable to earlier years. Key differences between the current and previous methodologies include the following:
• Beginning with the 2014 edition of MACStats, we excluded DSH payments from CMS-64 totals used to adjust MSIS spending. In earlier editions, DSH payments were included in CMS-64 totals. The rationale for doing so was that DSH payments are used to support hospitals that serve a large number of low-income and Medicaid patients, and could therefore be partially attributed to Medicaid enrollees in the MSIS. However, an examination of annual DSH audit data submitted by states indicates that for some hospitals, Medicaid DSH payments far exceed their uncompensated care costs for Medicaid patients and may therefore be attributed largely to uninsured patients.23 As a result, we now exclude DSH payments from CMS-64 totals when we adjust MSIS spending.
• Also starting with the 2014 edition, we obtained a more precise separation of home- and community-based services (HCBS) waiver spending in the MSIS, due to the use of more detailed MSIS data files than in editions of MACStats prior to 2014.
• Beginning with the 2015 edition, we excluded incentive and uncompensated care pool payments made under Section 1115 waiver expenditure authority from CMS-64 totals used to adjust MSIS spending.24 In earlier editions, these payments were included in CMS-64 totals. Because these payments may be made for purposes other than providing services to Medicaid patients, we now exclude them when we adjust MSIS spending.
• Also starting with the 2015 edition, we shifted a portion of drug rebate amounts in the CMS-64 from fee for service to managed care for a small number of states that, despite reporting drug utilization data for managed care, reported little or no drug rebates for managed care.
With regard to changes in data, complete MSIS Annual Person Summary (APS) files have not been available in a timely manner for use in MACStats since the 2013 edition. Therefore, beginning with the 2014 edition, we calculated spending and enrollment from the full MSIS data files that are used to create APS files. In general, our calculations closely match those used to create the APS. However, our development of enrollment counts is a notable exception. In MACPAC’s analysis of the full MSIS data files, Medicaid enrollees were assigned a unique national identification (ID) number using an algorithm that incorporates state-specific ID numbers and beneficiary characteristics such as date of birth and gender. The state and national enrollment counts were then unduplicated using this national ID, which results in MACPAC reporting slightly lower enrollment counts than would be the case had we used APS files.

December 2016132
Section 6: Technical Guide to MACStats
MAC
Stat
sSe
ctio
n 6
State
Benefit spending totals included in analysis
Amounts excluded from CMS-64 benefit spending totals
Unadjusted MSIS CMS-641
MSIS as a percentage of CMS-64 DSH
Incentive and uncompensated
care pool waivers
Total $375,433 $401,239 93.6% $15,457 $10,799Alabama 4,179 4,568 91.5 471 –Alaska 1,321 1,335 99.0 22 –Arizona 8,229 7,586 108.5 173 679Arkansas 3,497 4,141 84.4 61 5California 41,003 57,297 71.6 2,120 2,487Colorado 4,004 4,898 81.7 194 –Connecticut 6,241 6,453 96.7 273 –Delaware 1,662 1,552 107.1 11 –District of Columbia 2,360 2,232 105.7 56 –Florida 20,301 17,233 117.8 335 994Georgia 9,310 8,530 109.1 430 –Hawaii 1,464 1,524 96.1 25 82Idaho 2 2 2 2 2
Illinois 13,782 15,211 90.6 447 –Indiana 6,603 7,630 86.5 338 –Iowa 3,547 3,649 97.2 55 6Kansas 2,533 2,441 103.7 77 60Kentucky 5,575 5,606 99.4 216 –Louisiana 2 2 2 2 2
Maine 2,041 2,850 71.6 37 –Maryland 7,195 7,647 94.1 134 –Massachusetts 11,144 12,338 90.3 – 828Michigan 11,529 11,998 96.1 388 –Minnesota 8,561 8,873 96.5 46 –Mississippi 3,842 4,518 85.0 218 –Missouri 7,121 8,248 86.3 703 –Montana 864 989 87.3 18 –Nebraska 1,749 1,788 97.8 45 –Nevada 1,477 1,742 84.8 81 –New Hampshire 1,045 1,162 89.9 41 –New Jersey 9,075 9,266 97.9 1,298 42New Mexico 2,615 3,270 80.0 25 –
EXHIBIT 46. Medicaid Benefit Spending in MSIS and CMS-64 Data by State, FY 2013 (millions)

MACStats: Medicaid and CHIP Data Book 133
Section 6: Technical Guide to MACStats
MAC
Stat
sSe
ctio
n 6
State
Benefit spending totals included in analysis
Amounts excluded from CMS-64 benefit spending totals
Unadjusted MSIS CMS-641
MSIS as a percentage of CMS-64 DSH
Incentive and uncompensated
care pool waivers
New York $50,560 $50,354 100.4% $3,423 $644North Carolina 9,932 11,298 87.9 617 –North Dakota 805 783 102.8 1 –Ohio 16,001 16,154 99.0 649 –Oklahoma 3,925 4,754 82.6 42 –Oregon 3,996 4,782 83.6 77 253Pennsylvania 18,749 20,245 92.6 847 –Rhode Island 2 2 2 2 2
South Carolina 4,862 4,449 109.3 457 –South Dakota 757 765 99.0 1 –Tennessee 13,563 7,617 178.1 80 1,020Texas 22,084 24,417 90.4 227 3,695Utah 2,640 2,101 125.6 29 –Vermont 1,136 1,431 79.4 37 5Virginia 6,363 7,105 89.6 186 –Washington 6,684 7,805 85.6 367 –West Virginia 3,216 2,949 109.1 75 –Wisconsin 5,689 7,105 80.1 1 –Wyoming 603 554 108.9 0 –
Notes: MSIS is Medicaid Statistical Information System. FY is fiscal year. DSH is disproportionate share hospital. Includes federal and state funds. MSIS and CMS-64 data reflect unadjusted amounts as reported by states. Both sources exclude spending on administration, the territories, and Medicaid-expansion CHIP enrollees; in addition, CMS-64 amounts exclude $6.8 billion in offsetting collections from third-party liability, estate, and other recoveries. See https://www.macpac.gov/macstats/data-sources-and-methods/ for a discussion of differences between MSIS and CMS-64 data. Beginning with the 2014 edition of MACStats, DSH payments have been excluded from CMS-64 totals used to adjust MSIS spending; beginning with the 2015 edition, incentive and uncompensated care pool payments made under Section 1115 waiver authority have also been excluded. For informational purposes, the DSH and waiver expenditure amounts that were excluded are shown here.
– Dash indicates zero; $0 indicates an amount less than $0.5 million that rounds to zero.1 The total amount reported on the CMS-64 may differ slightly from the state and national totals of our adjusted MSIS spending reported in other exhibits due to rounding when applying certain adjustments.2 Idaho, Louisiana, and Rhode Island were excluded due to data reliability concerns regarding completeness of monthly claims and enrollment data.
Source: MACPAC, 2016, analysis of MSIS data as of December 2015 and CMS-64 Financial Management Report net expenditure data as of June 2016.
EXHIBIT 46. (continued)

December 2016134
Section 6: Technical Guide to MACStats
MAC
Stat
sSe
ctio
n 6
Service category MSIS service types1 CMS-64 service types
Hospital • Inpatient hospital• Outpatient hospital
• Inpatient hospital non-DSH• Inpatient hospital non-DSH supplemental payments• Inpatient hospital GME payments• Outpatient hospital non-DSH• Outpatient hospital non-DSH supplemental payments• Emergency services for aliens2
• Emergency hospital services• Critical access hospitals
Non-hospital acute care
• Physician• Dental• Nurse-midwife• Nurse practitioner• Other practitioner• Non-hospital outpatient
clinic• Lab and X-ray• Sterilizations• Abortions• Hospice• Targeted case management• Physical, occupational,
speech, and hearing therapy• Non-emergency
transportation• Private duty nursing• Rehabilitative services• Other care, excluding HCBS
waiver
• Physician (including primary care physician payment increase)
• Physician services supplemental payments• Preventive services with USPSTF Grade A or B and
ACIP vaccines• Dental• Nurse-midwife• Nurse practitioner• Other practitioner • Other practitioner supplemental payments• Non-hospital clinic• Rural health clinic• Federally qualified health center• Lab and X-ray• Sterilizations• Abortions• Hospice• Targeted case management• Statewide case management• Physical therapy• Occupational therapy• Services for speech, hearing, and language• Non-emergency transportation• Private duty nursing• Rehabilitative services (non-school-based)• School-based services• EPSDT screenings• Diagnostic screening and preventive services• Prosthetic devices, dentures, eyeglasses• Freestanding birth center• Health home with chronic conditions• Tobacco cessation for pregnant women• Care not otherwise categorized
Drugs • Drugs (gross spending) • Drugs (gross spending)• Drug rebates
EXHIBIT 47. Service Categories Used to Adjust FY 2013 Medicaid Benefit Spending in the MSIS to Match CMS-64 Totals

MACStats: Medicaid and CHIP Data Book 135
Section 6: Technical Guide to MACStats
MAC
Stat
sSe
ctio
n 6
Service category MSIS service types1 CMS-64 service typesManaged care and premium assistance
• HMO (i.e., comprehensive risk-based managed care; includes PACE)
• PHP• PCCM
• MCO (i.e., comprehensive risk-based managed care)• MCO drug rebates• PACE• PAHP• PIHP• PCCM• MCO, PAHP, and PIHP payments associated with the
primary care physician payment increase, Community First Choice option, preventive services with USPSTF Grade A or B, and ACIP vaccines
• Premium assistance for private coverageLTSS non-institutional • Home health
• Personal care• HCBS waiver
• Home health• Personal care• Personal care—1915(j)• HCBS waiver• HCBS—1915(i)• HCBS—1915(j)• HCBS–1915(k)
LTSS institutional • Nursing facility• ICF/ID• Inpatient psychiatric for
individuals under age 21• Mental health facility for
individuals age 65 and older
• Nursing facility• Nursing facility supplemental payments• ICF/ID• ICF/ID supplemental payments• Mental health facility for individuals under age 21 or
age 65 and older, non-DSHMedicare3, 4 • Medicare Part A and Part B premiums
• Medicare coinsurance and deductibles for QMBs
Notes: FY is fiscal year. MSIS is Medicaid Statistical Information System. DSH is disproportionate share hospital. GME is graduate medical education. HCBS is home and community-based services. USPSTF is U.S. Preventive Services Task Force. ACIP is Advisory Committee on Immunization Practices. EPSDT is early and periodic screening, diagnostic, and treatment services. HMO is health maintenance organization. PACE is Program of All-Inclusive Care for the Elderly. PHP is prepaid health plan. PCCM is primary care case management. MCO is managed care organization. PAHP is prepaid ambulatory health plan (a type of PHP). PIHP is prepaid inpatient health plan (a type of PHP). LTSS is long-term services and supports. ICF/ID is intermediate care facility for persons with intellectual disabilities. QMB is qualified Medicare beneficiary.Service categories and types reflect fee-for-service spending unless noted otherwise. Service types with identical names in MSIS and CMS-64 data may still be reported differently in the two sources due to differences in the instructions given to states; amounts for those that appear only in the CMS-64 (e.g., drug rebates) are distributed across Medicaid enrollees with MSIS spending in the relevant service categories (e.g., drugs).1 Claims in the MSIS include both a service type (such as inpatient hospital, physician, personal care, etc.) and a program type (including HCBS waiver). When adjusting MSIS data to match CMS-64 totals, we count all claims with an HCBS waiver program type as HCBS waiver, regardless of their specific service type. Among claims with an HCBS waiver program type, the most common service types are other, home health, rehabilitation, and personal care.2 Emergency services for aliens are reported under individual service types throughout the MSIS, but primarily as inpatient and outpatient hospital. As a result, we include this CMS-64 amount in the hospital category.3 Medicare premiums are not reported in the MSIS. We distribute CMS-64 amounts proportionately across dually eligible enrollees identified in the MSIS for each state.4 Medicare coinsurance and deductibles are reported under individual service types throughout the MSIS. We distribute CMS-64 amounts for QMBs across CMS-64 spending in the hospital, non-hospital acute, and LTSS institutional categories prior to calculating state-level adjustment factors based on the distribution of Medicare cost sharing for hospital, Part B, and skilled nursing facility services among QMBs in 2011 Medicare data. See MedPAC and MACPAC, 2016, Data book: Beneficiaries dually eligible for Medicare and Medicaid, Table 4, Fee-for-service Medicare Part A and Part B cost sharing incurred by dually eligible and non-dually eligible Medicare beneficiaries (page 13), https://www.macpac.gov/wp-content/uploads/2015/01/Dually-Eligible-Beneficiares-DataBook.pdf.Sources: MACPAC, 2016, analysis of MSIS and CMS-64 Financial Management Report net expenditure data.
EXHIBIT 47. (continued)

December 2016136
Section 6: Technical Guide to MACStats
MAC
Stat
sSe
ctio
n 6
Understanding Managed Care Enrollment and Spending DataThere are four main sources of data on Medicaid managed care available from Centers for Medicare & Medicaid Services (CMS).
• Medicaid Managed Care Data Collection System (MMCDCS). The MMCDCS provides state-reported aggregate enrollment statistics and other basic information for each managed care plan within a state. CMS uses the MMCDCS to create an annual Medicaid managed care enrollment report, which is the source of information on Medicaid managed care most commonly cited by CMS, as well as by outside analysts and researchers.
• MSIS. The MSIS provides person-level and claims-level information for all Medicaid enrollees. For managed care, MSIS claims include records of each capitated payment made on behalf of an enrollee to a managed care plan (generally referred to as capitated claims), as well as records of each service received by the enrollee from a provider under contract with a managed care plan (which generally do not include payment amounts and may be referred to as encounter or “dummy” claims). All states collect encounter data from their Medicaid managed care plans, but some do not report them in the MSIS. Managed care enrollees may also have FFS claims in the MSIS if they used services beyond those covered by a managed care plan’s contract with the state.
• CMS-64. The CMS-64 Financial Management Report (FMR) provides aggregate spending information for Medicaid by major benefit categories, including managed care. The spending amounts reported by states on the CMS-64 are used to calculate their federal matching dollars.
• SEDS. The SEDS provides aggregate statistics on CHIP enrollment and child Medicaid enrollment that include the number covered under FFS and managed care systems. The SEDS is the only comprehensive source of information on managed care participation among separate CHIP enrollees across states.
Although the annual Medicaid managed care enrollment report generally contains the most recent information available from CMS on Medicaid managed care for all states, it does not provide information on many characteristics of enrollees in managed care (e.g., basis of eligibility and demographics such as age, sex, race, and ethnicity). It does provide information on whether individuals are dually eligible for Medicare. As a result, MACStats also includes statistics based on MSIS and CMS-64 data, such as the percentage of individuals enrolled in managed care by eligibility group and the percentage of Medicaid benefit spending attributable to managed care.
When examining managed care statistics from various sources, the following issues should be noted:
• Figures in the annual Medicaid managed care enrollment report published by CMS include Medicaid-expansion CHIP enrollees. Although we generally exclude these children (between 2 and 5 million, depending on the time period) from Medicaid analyses in MACStats, it is not possible to do so with CMS’s annual Medicaid managed care enrollment report data.25
• The types of managed care reported by states may differ somewhat between the Medicaid managed care enrollment report and the MSIS. For example, some states report a small number of enrollees in comprehensive risk-based managed care in one data source but not the other. Anomalies in MSIS data are documented by CMS as it reviews each

MACStats: Medicaid and CHIP Data Book 137
Section 6: Technical Guide to MACStats
MAC
Stat
sSe
ctio
n 6
state’s quarterly submission, but all issues may not be identified in this process.
• The Medicaid managed care enrollment report provides point-in-time figures. In contrast, MSIS data allow for reporting on the number of enrollees ever enrolled in managed care during a fiscal year or other period of time.
Endnotes1 For technical guides to earlier editions of MACStats, see MACPAC’s June reports to Congress, which are accessible through the publications page of the MACPAC website. https://www.macpac.gov/publication/.2 CMS has been collecting Medicaid and CHIP performance indicator data on key processes related to eligibility and enrollment since late 2013. In part because the new Medicaid and CHIP performance indicator enrollment data do not identify newly eligible individuals for whom there is a higher federal matching rate, CMS is using a separate process to collect monthly Medicaid enrollment by eligibility category when states submit their CMS-64 quarterly expenditures. Specifically, a new CMS-64 enrollment form has been created to accompany the current expenditure forms. Although enrollment is submitted at the same time as expenditures, there is not a direct link between the amount of federal expenditures claimed by states and the number of enrollees reported. Instead, CMS uses CMS-64 enrollment data for monitoring and oversight purposes.3 See, for example, Centers for Medicare & Medicaid Services (CMS), 2010, Medicare & Medicaid statistical supplement, 2010 edition, Brief summaries and glossary, Baltimore, MD: CMS, http://www.cms.gov/Research-Statistics-Data-and-Systems/Statistics-Trends-and-Reports/MedicareMedicaidStatSupp/Downloads/2010SummariesGlossary.zip. 4 States make capitated payments for all individuals enrolled in managed care plans even if no health care services are used. Therefore, all managed care enrollees currently are counted as beneficiaries or persons served, regardless of whether or not they have any health service use.5 Centers for Disease Control and Prevention, U.S. Department of Health and Human Services, 2016, About the National Health Interview Survey, http://www.cdc.gov/nchs/nhis/about_nhis.htm. 6 Agency for Health Care Research and Quality, U.S. Department of Health and Human Services, 2016, Medical Expenditures Panel Survey: Survey background, http://meps.ahrq.gov/mepsweb/about_meps/survey_back.jsp. 7 Kenney, G., and V. Lynch, 2010, Monitoring children’s health insurance coverage under CHIPRA using federal surveys, in Databases for estimating health insurance coverage for children: A workshop summary, Plewes, T.J., ed., Washington, DC: The National Academies Press, http://www.nap.edu/catalog/13024.html.8 Rhoades, J.A., J.W. Cohen, and S.R. Machlin, 2010, Methodological comparison of estimates of ambulatory health care use from the Medical Expenditure Panel Survey and other data sources, in JSM Proceedings, Section on Health Policy, Alexandria, VA: American Statistical Association, 2828–2837, http://ww2.amstat.org/sections/srms/Proceedings/y2010/Files/307444_58577.pdf. 9 McPherson, M., P. Arrango, H. Fox, et al, 1998, A new definition of children with special health care needs, Pediatrics 102: 137–140.

December 2016138
Section 6: Technical Guide to MACStats
MAC
Stat
sSe
ctio
n 6
10 For children under age 18 to be determined disabled under Supplemental Security Income (SSI) rules, the child must have at least one medically determinable physical or mental impairment that causes marked and severe functional limitations and that can be expected to cause death or last at least 12 months (§ 1614(a)(3)(C)(i) of the Social Security Act).11 The following conditions were identified in the most recent NHIS: attention deficit disorder; intellectual disability; other developmental delay or problems that cause difficulty with activity; other mental health condition; Down syndrome; cerebral palsy; muscular dystrophy; cystic fibrosis; sickle cell anemia; autism; diabetes; arthritis; heart disease or condition; cancer; any of the following episodes/attacks in the past 12 months: seizure, asthma, respiratory allergy, eczema or skin allergy, food or digestive allergy, anemia, frequent severe headache or migraines, or frequent diarrhea or colitis; depressed or anxious feelings most or all of the time in the past 30 days, feelings interfered with life a lot in the past 30 days; depression/anxiety/emotional problem causes difficulty with activity, difficulties with emotions/concentration/behavior/getting along; very low birth weight (less than 1500 grams) and under two years old; chronic condition that limits activity; at least one condition that causes functional limitation and is chronic; or reported fair or poor health status. 12 Limitations in ability to do things other children do include the following: any activity limitation, needs help with activities of daily living, has mobility impairment that has lasted or is expected to last more than 12 months, has any functional limitation, is blind, or has a lot of trouble with hearing ability without a hearing aid.13 Need or use of medications includes the following: took a prescription medicine for three or more months or reported unmet need for prescription medications due to cost in the past 12 months. 14 Need or use of specialized therapies includes the following: saw or talked to a therapist in the past 12 months.15 Above-routine need or use or services includes the following: has impairment or health problem that requires use of special equipment, had 10 or more visits to a health professional in the past 12 months, had two or more emergency department visits in the past 12 months, had one or more hospital stays other than for birth in the past 12 months, any homecare visits in the past 12 months, received special education or early intervention services, or reported unmet need for medical care due to cost in the past 12 months. 16 Need or receives counseling includes the following: family member seen/talked to a mental health professional concerning health of the child in the past 12 months or reported unmet need for mental health counseling due to cost in the past 12 months.17 The 2016 estimates may differ from 2015 due to changes in the conditions or criteria used to identify CSHCN. For full details on the definition of CSHCN used in MACStats editions prior to December 2015, see Medicaid and CHIP Payment and Access Commission (MACPAC), 2014, Technical guide to the June 2014 MACStats, in Report to the Congress on Medicaid and CHIP, June 2014, Washington, DC: MACPAC, https://www.macpac.gov/wp-content/uploads/2015/03/June-2014-MACStats.pdf.18 Medicaid benefit spending reported here excludes amounts for Medicaid-expansion CHIP enrollees, the territories, administrative
activities, the Vaccines for Children program (which is authorized by the Medicaid statute but operates as a separate program), and offsetting collections from third-party liability, estate, and other recoveries.19 For a discussion of these data sources, see Medicaid and CHIP Payment and Access Commission (MACPAC), 2011, Improving Medicaid and CHIP data for policy analysis and program accountability, in Report to the Congress on Medicaid and CHIP, March 2011, Washington, DC: MACPAC, –.20 Some of these amounts, including certain supplemental payments to hospitals and drug rebates, are lump sums that are not paid on a claim-by-claim basis for individual Medicaid enrollees. Nonetheless, we refer to these CMS-64 amounts as benefit spending, and the adjustment methodology described here distributes them across Medicaid enrollees with MSIS spending in the relevant service categories.21 U.S. Government Accountability Office (GAO), 2012, Medicaid: Data sets provide inconsistent picture of expenditures, Washington, DC: GAO, http://www.gao.gov/assets/650/649733.pdf; National Research Council, 2010, Administrative databases, in Databases for estimating health insurance coverage for children: A workshop summary, Plewes, T.J., ed., Washington, DC: The National Academies Press, http://www.nap.edu/catalog/13024.html.22 The sum of adjusted MSIS benefit spending amounts for all service categories totals CMS-64 benefit spending, exclusive of offsetting collections from third-party liability, estate, and other recoveries. These collections are not reported by type of service in the CMS-64 and are not reported at all in the MSIS.23 See Medicaid and CHIP Payment and Access Commission (MACPAC), 2016, Improving data as the first step to a more targeted disproportionate share hospital policy, in Report to Congress on Medicaid and CHIP, March 2016, Washington, DC: MACPAC, https://www.macpac.gov/wp-content/uploads/2016/03/Improving-Data-as-the-First-Step-to-a-More-Targeted-Disproportionate-Share-Hospital-Policy.pdf; and Centers for Medicare & Medicaid Services (CMS), 2016, Medicaid disproportionate share hospital payments, http://www.medicaid.gov/Medicaid-CHIP-Program-Information/By-Topics/Financing-and-Reimbursement/Medicaid-Disproportionate-Share-Hospital-DSH-Payments.html.24 For more on these payments, see Medicaid and CHIP Payment and Access Commission (MACPAC), 2015, Using Medicaid supplemental payments to drive delivery system reform, in Report to Congress on Medicaid and CHIP, June 2015, Washington, DC: MACPAC, https://www.macpac.gov/wp-content/uploads/2015/06/Using-Medicaid-Supplemental-Payments-to-Drive-Delivery-System-Reform.pdf.25 We generally exclude children enrolled in Medicaid-expansion CHIP from Medicaid analyses because their funding stream (CHIP, under Title XXI of the Social Security Act) differs from that of other Medicaid enrollees (Medicaid, under Title XIX of the Social Security Act). In addition, spending (and often enrollment) for the Medicaid-expansion CHIP population is reported by CMS in CHIP statistics along with information on separate CHIP enrollees.

