made.com group plc (“ma ”)
TRANSCRIPT

Made.com Group Plc (“MADE”)
Interim Results for the six months to 30 June 2021
MADE delivers record results with 61% revenue growth
£'m
Six months to 30th June
2021
Six months to 30th June
2020
Change Constant Currency Change
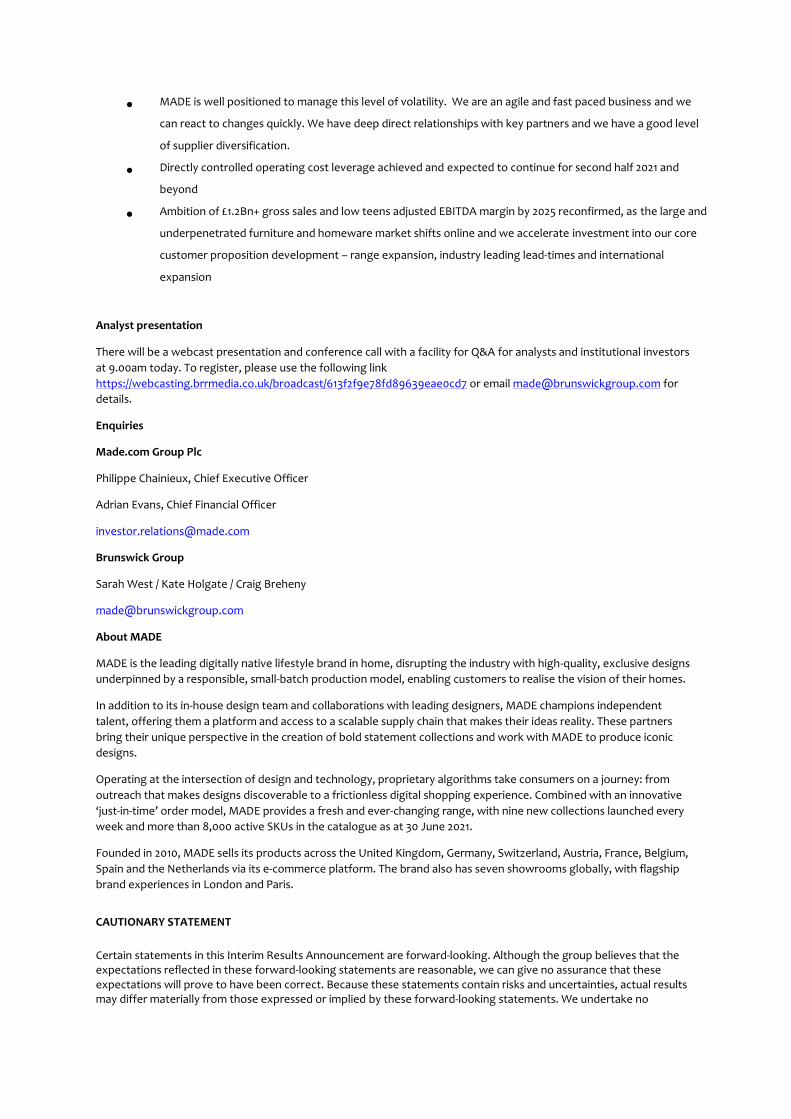
Gross Sales(1) 213.9 138.6 54% 54%
Revenue 171.0 106.3 61% 60%
Gross Margin 48.7% 51.8% (306bps) (192bps)
Adjusted EBITDA(1) 1.1 (11.1) 12.2
Adjusted EBITDA Margin(1) 0.6% (10.4%) 11.0ppt
Loss before tax (10.1) (15.2) 5.1
Net Cash(1) 175.3 43.2 132.1
Basic EPS (2.0p) (5.0p) 3.0p (1) Refer to note below titled ‘’Alternative Performance Measures (APMs)’’ defining alternative performance measures (APMs)
Financial Highlights
• Strong trading performance delivering £214m gross sales for the first half of 2021, 54% year-on-year growth
• Customer metrics underpin gross sales growth, with last twelve month active customers(1) at 1.2m, +34% over
the six-month period, with average order value (AOV)(1) at £244, +12% year-on-year
• Revenue of £171m, +61% year-on-year, with Q2 revenue of £89m, +84% year-on-year
• Deferred revenue closed the period +81% year-on-year at £67m, remaining at elevated levels due to extended
lead-times
• Gross margin was 48.7%, down 306bps year-on-year due to global freight inflationary pressures and foreign
exchange headwind. Gross margin excluding freight costs and foreign exchange differences improved on
better full price sales mix and economies of scale
• Adjusted EBITDA of £1.1m, +£12.2m year-on-year, with cost leverage across all operating cost lines, more than
offsetting industry wide global freight inflationary pressures
• Reported losses before tax were (£10.1m) including one-off IPO related P&L charges of £5.4m, compared to
(£15.2m) for the same period in 2020
• Net cash was £175m at the end of the period, following the IPO raise of £100m of gross proceeds. Free cash
flow(1) of £30m, compared to £25m in the first half of 2020
PHILIPPE CHAINIEUX, CEO OF MADE, COMMENTED:
“I am very pleased with the progress made in the first half of the year, which is in line with the long-term goals set out at
our IPO in June. We have continued to see strong and sustained consumer demand for our exclusive, design-led products
and have gained significant market share with growth in all eight of our markets.

“Thanks to our agile business model and supplier relationships, we are well-positioned to navigate the industry-wide global
supply chain disruption, which is expected to continue into the first half of next year. We have multiple levers to drive
superior growth and will continue to strengthen our model through the ongoing implementation of our strategy: to invest
in our unique customer proposition through further developing our curated, design-led range, enhancing customer
experience, investing in our brand and expanding internationally. I am confident in the outlook for the Full Year and in
MADE’s long-term growth.”
Strategic and operational highlights
• Significant strategic progress in strengthening our position as the leading digitally native lifestyle brand in home,
delivering market share gains
Outlook
• Following a successful first half, visitor volumes remain robust, giving us confidence in maintaining full year
expectation for +40% year-on-year gross sales growth
• Full year revenue expected to be ~£410m (~+65% year on year) with positive adjusted EBITDA, assuming
global supply chain disruptions do not deteriorate further. Our planning assumes industry wide global supply
chain disruptions continue to result in extended shipping times, range availability pressures and increased
freight costs. Later than anticipated intake of goods to our warehouses, could impact revenue recognition
timing and inflate deferred income.
o Further growth of our design led range, with accelerated new product releases, increasing our
range to more than 8,000 SKUs at the end of the first half.
o Making encouraging progress on our ongoing beta testing of curated marketplace. This further
enhances our homeware range, offering third-party artisan brands
o Exceptional growth delivered across all geographies, gaining market share in all regions. UK
delivered gross sales growth of 55% compared to H1 2020. Continental European markets are
already at scale and grew gross sales by 53% compared to H1 2020, with Germany continuing to
outperform the Continental European average
• Significant warehousing and logistics capacity secured at our existing sites to support high growth and lead-time
service improvements
o Nearly doubling our UK large goods warehouse, with the delivery of an additional 172,000 sqft of
space delivered early August 2021. Letter of intent signed to extend warehousing space at our
existing site in Antwerp, servicing our European customers
• Continuing to deliver cost leverage with scale and careful cost management through all cost lines
o Distribution cost efficiency supported by average order value (AOV) growth and negotiated cost
improvements
o Marketing costs remain below pre-pandemic levels, supported by range development, customer
targeting efficiency and increased repeat order mix
o Overhead leverage continues as we scale, with overheads at 10.4% of revenue for the period
compared to 13.3% prior year
• As part of the group’s ESG strategy, we launched our circularity initiative with Geev, a third party platform to
allow customers to give a second life to their products in the UK and France
• MADE is well positioned to manage this level of volatility. We are an agile and fast paced business and we
can react to changes quickly. We have deep direct relationships with key partners and we have a good level
of supplier diversification.
• Directly controlled operating cost leverage achieved and expected to continue for second half 2021 and
beyond
• Ambition of £1.2Bn+ gross sales and low teens adjusted EBITDA margin by 2025 reconfirmed, as the large and
underpenetrated furniture and homeware market shifts online and we accelerate investment into our core
customer proposition development – range expansion, industry leading lead-times and international
expansion
Analyst presentation
There will be a webcast presentation and conference call with a facility for Q&A for analysts and institutional investors
at 9.00am today. To register, please use the following link
https://webcasting.brrmedia.co.uk/broadcast/613f2f9e78fd89639eae0cd7 or email [email protected] for
details.
Enquiries
Made.com Group Plc
Philippe Chainieux, Chief Executive Officer
Adrian Evans, Chief Financial Officer
Brunswick Group
Sarah West / Kate Holgate / Craig Breheny
About MADE
MADE is the leading digitally native lifestyle brand in home, disrupting the industry with high-quality, exclusive designs
underpinned by a responsible, small-batch production model, enabling customers to realise the vision of their homes.
In addition to its in-house design team and collaborations with leading designers, MADE champions independent
talent, offering them a platform and access to a scalable supply chain that makes their ideas reality. These partners
bring their unique perspective in the creation of bold statement collections and work with MADE to produce iconic
designs.
Operating at the intersection of design and technology, proprietary algorithms take consumers on a journey: from
outreach that makes designs discoverable to a frictionless digital shopping experience. Combined with an innovative
‘just-in-time’ order model, MADE provides a fresh and ever-changing range, with nine new collections launched every
week and more than 8,000 active SKUs in the catalogue as at 30 June 2021.
Founded in 2010, MADE sells its products across the United Kingdom, Germany, Switzerland, Austria, France, Belgium,
Spain and the Netherlands via its e-commerce platform. The brand also has seven showrooms globally, with flagship
brand experiences in London and Paris.
CAUTIONARY STATEMENT
Certain statements in this Interim Results Announcement are forward-looking. Although the group believes that the expectations reflected in these forward-looking statements are reasonable, we can give no assurance that these expectations will prove to have been correct. Because these statements contain risks and uncertainties, actual results may differ materially from those expressed or implied by these forward-looking statements. We undertake no

obligation to update any forward-looking statements, whether as a result of new information, future events or otherwise.
CHIEF EXECUTIVE OFFICER REVIEW
Since our foundation 11 years ago we have delivered consistently high growth to become the leading digitally native
lifestyle brand in home, offering customers high-end design at an affordable price. Our historical growth has been
delivered through expanding our range, to become a home destination and lifestyle brand as well as expanding into
the largest Continental European markets. We have been able to deliver consistently high growth because of the
strength of our brand and teams. Throughout the pandemic, this team strength and commitment has shone through
again and again. I would like to thank everyone at MADE for their amazing hard work and efforts in supporting our
success.
During the period, we completed our initial public offering (IPO) on the London Stock Exchange. The group raised
£90m of net proceeds from new and existing shareholders and I want to thank all our shareholders for their support.
The IPO puts the group in a fantastic position to accelerate our ambitious growth plans, building on our market leading
position by investing in even better customer experience, expansion of our beautifully designed product range and
growing brand awareness across our markets. As always, we will do this while maintaining financial discipline. We
have made excellent progress on our strategic plan during the first half.
MADE is a digitally native business and has been at the heart of giving consumers the confidence to shop for their
homes online. Penetration rates for the furniture and homewares market were well below those of many other
consumer verticals, at around one third of the apparel and footwear markets pre-pandemic. The furniture and
homewares addressable markets is over £94bn in the markets in which we currently operate and the market is at an
inflection point in terms of e-commerce adoption following trends that have been seen historically through other
major consumer verticals. MADE is ideally placed to accelerate market share gains.
Our business model is built around five core pillars, giving clear competitive advantage:
1. Vertically integrated business model offering superior margins
We operate a vertically integrated business model through deep relationships with our partners, delivering superior
margins, while offering our customers unique design-led, high quality products at an affordable price. We work directly
with more than 150 of the world’s best designers, creating unique, differentiated designs. Our global network of 200+
product suppliers is set-up for the next stage of growth, with our own people on the ground ensuring compliance in
line with high ESG and quality standards. Our logistics network operates a data-led, flexible, just-in-time test and learn
model which delivers negative working capital and is set for scale.
Just after the period, we finished expansion of our large goods warehousing capacity in the UK moving from 165,000
sq.ft. to 337,000 sq.ft. and have a letter of intent securing a long term expansion of space in at our existing site in
Antwerp. The addition of this space will give us the infrastructure for future rapid growth and demonstrates our ability
to efficiently add capacity through existing partnerships at low levels of capital investment and with limited impact on
day-to-day business operations.
2. Expanding our range to become the leading digitally native lifestyle brand in home
As a design-driven business, range construction is a core differentiator and we have invested heavily in our predictive
models to ensure we always offer products our customers want to buy. We now offer more than 8,000 products.
Building our curated range has driven consistent growth and enhanced the unit economics of our business through
increased frequency of purchase and repeat ordering.
We began as a furniture business, and over the last few years have begun to develop an authoritative homewares
offer. We have proven that homewares is an efficient route to acquire new customers and to build loyalty with
existing customers.
We are accelerating our build of an increasingly comprehensive range for the well designed lifestyle, through
expansion of our vertically integrated range and by investing into the introduction of a carefully curated marketplace
of artisan brands onto our platform.

We ran a successful beta test for our marketplace. It is early days in our marketplace expansion, but we are
encouraged with the results to date and continue with the beta testing. Investments will be made through 2021-22 to
enable us to scale up the curated marketplace proposition.
3. Investing in excellent customer experience – improving lead-times for customers
From our origins as a made to order furniture brand, we have demonstrated a consistent track record of using data to
reduce lead-time to customers while maintaining our highly efficient negative working capital model. We are now at
the right point to accelerate investment into customer experience, reducing the time customers wait to receive their
products, by delivering an industry leading lead-time proposition. Due to our curated range and deep supplier
partnerships, we are well placed to do this with a relatively limited stock investment. Historically, an improvement of
one week in our lead-times has resulted in a c. 5% sales uplift and improved levels of customer satisfaction.
During the period, we placed stock orders and secured logistics capacity to accelerate the first phase of our lead-time
plan towards the end of 2021 and into early 2022.
Further experience enhancements in the period included developing our website functionality with the
implementation of an invoice payment solution in Germany, a new tool for virtual appointment bookings as well as
updating user experience to support marketplace product discovery.
4. Expanding within our core geographies
We serve customers in eight of the largest markets across Europe (including the United Kingdom), with the
Continental Europe market already comprising 47% of the group’s gross sales in the first half of 2021. Today, the group
operates in the UK, Germany, France, Spain, Netherlands, Belgium, Austria and Switzerland. Our markets continue to
demonstrate impressive growth trajectories, with Germany surpassing the United Kingdom’s gross sales relative to the
year of market entry. Our brand has resonated well with a similar customer demographic across all of the markets we
are operating in. Given our successful track record in scaling operations internationally, we remain focused on building
brand awareness through our core markets, leveraging our successful marketing playbook. Historically, we have placed
a lower level of brand awareness investment into the major European markets compared to the United Kingdom. As
we deliver customer experience and range developments, we will take advantage of the opportunity to efficiently
invest in enhancing brand awareness, particularly through France and Germany, via one-off tactical marketing
investments.
During the period we have delivered 53% gross sales growth in our European business. Germany and France continue
to scale at pace. Our active customer base and brand awareness has seen rapid growth across the European markets.
We have created a strong foundation upon which to begin to ramp up marketing spend in the French and German
markets in 2022.
5. ESG embedded into every aspect of MADE’s operations
Our core consumers’ expectations and preferences for goods and products made by value-led organisations are
aligned with our mission and business model. Our ability to control the end to end supply chain, with our own
employees on the ground, enables us to embed sustainability throughout our operations from design, sourcing and
production, to sales and aftersales. We design products with their longevity in mind.
We are committed to numerous responsible targets over the next five years including:
- Reaching 100% recycled or recyclable packaging by 2025
- Reaching 100% sustainably sourced key materials (including velvet, cotton and polyester) by 2025
- Reaching 100% sustainably sourced, fully traceable timber in 2025
- Give Away platform in 2021, with Take Back program in the coming years

We believe our approach aligns strongly with the core values of our predominantly millennial customer base, who are
increasingly focused on transparency, sustainability, and integrity to inform their brand choice and purchasing
decisions. Our prioritisation of sustainability and control of our supply chain distinguishes us from our competitors and
positions us well to handle expected future changes in regulations and environmental standards around sustainability.
FINANCIAL REVIEW
We have continued to deliver strong financial performance through the first half of 2021, with high top line growth,
while delivering adjusted EBITDA profitability and balance sheet efficiency.
Six months to 30th June
2021
Six months to 30th June
2020
Change
Gross Sales (£m)(1) 214 139 54%
United Kingdom 113 73 55%
Continental Europe 101 66 53%
Deferred revenue (£m, at 30th June) 67 37 81%
Revenue (£m) 171 106 61%
United Kingdom 88 54 63%
Continental Europe 83 52 59%
Gross margin 48.7% 51.8% (3.1ppt)
Fulfilment costs (% revenue)(1) 19.8% 24.6% 4.7ppt
Marketing costs (% of revenue)(1) 17.8% 24.4% 6.6ppt
Marketing costs (% of gross sales)(1) 14.3% 18.7% 4.5ppt
United Kingdom 10.3% 14.7% 4.4ppt
Continental Europe 18.7% 23.1% 4.5ppt
Overhead costs (% of revenue)(1) 10.4% 13.3% 2.9ppt
Adjusted EBITDA (£m) (1) 1.1 (11.1) 12.2
Adjusted EBITDA margin(1) 0.6% (10.4%) 11.1ppt
United Kingdom 12.2% 5.4% 6.8ppt
Continental Europe 4.8% (6.5%) 11.3ppt
Reported loss before tax (£m) (10.1) (15.2) 5.1
Capital Expenditure (£m) 3.4 3.0 13%
Net Working Capital (£m)(1) (99) (63) 44% Net Cash (£m, at 30th June 2021)(1) 175 43 132
Free Cash Flow (£m)(1) 30 25 23%
(1) Refer to note below titled ‘’Alternative Performance Measures (APMs)’’ defining alternative performance measures (APMs)
Through the first half of 2021, we have benefited from high levels of customer demand as the large furniture and
homeware market has continued an accelerated shift to online, continued growth of our curated range and strong
growth across all of our territories.
As stock intake began to step up, deliveries to customers increased, resulting in revenue growth of +61% year-on-year.
However, at the end of the period, £67m of deferred revenue was still outstanding, representing a +81% year-on-year
increase.
Gross margin fell year-on-year as we absorbed freight cost inflation and foreign exchange headwinds, which were
partly offset by gains from improved product cost and reduced levels of discounting.
We have continued to deliver accelerated cost leverage, supported by increased average order value, fulfilment rate
benefits, higher marketing returns from improved targeting and overhead efficiency as we scale.

High gross sales growth, funds raised through our IPO and our negative working capital model have supported delivery
of a closing net cash position of £175m, leaving us well capitalised to accelerate market share gains through investment
into our brand proposition.
Customer metrics and gross sales
We have continued to deliver strong year-on-year gross sales growth through the period, supported by high levels of
market demand for our design-led digitally native proposition. Following the same customer proposition and
marketing playbook, gross sales growth has been delivered at consistently high levels across all of our territories.
Last twelve month (LTM) active customer numbers stepped up to 1.2m or +34% year-on-year, with orders growing +37%
year-on-year, with a greater proportion of orders being repeat orders following our continued efforts to build
customer loyalty through range and service development.
Despite sales mix between furniture and homewares product remaining flat on a year-on-year basis, we delivered 12%
average order value (AOV) increase to £244, supporting increased cost base efficiency. AOV gains were driven by a
higher mix of full price sales and by customers trading up to higher price point products.
Six months to 30th
June 2021
Six months to 30th
June 2020
Change
Key performance measures
Gross sales (£'m) 214 139 54%
United Kingdom 113 73 55%
Continental Europe 101 66 53%
LTM Active customers (‘000) 1,226 918 34%
United Kingdom 606 461 32%
Continental Europe 620 457 36%
Orders (’000) 876 638 37%
United Kingdom 453 334 35%
Continental Europe 423 303 39%
Repeat order mix (%) 43% 41% 1.4ppt
United Kingdom 51% 48% 2.7ppt
Continental Europe 34% 34% 0.2ppt
Average order value (AOV, £) 244 217 12%
United Kingdom 249 217 15%
Continental Europe 239 217 10%
Homeware sales mix (% of total gross sales)
28% 28% 0.1ppt
Revenue and deferred revenue
Despite extended freight delivery timing, intake levels have now started to step up, resulting in accelerated revenue
growth as orders are delivered to customers. This supported revenue growth at +61% year-on-year, ahead of gross sales
growth of +54% year-on-year. As high levels of stock intake continue through the remainder of 2021 we expect to
deliver a continuing unwind of deferred revenue which stood at £67m, +81% year-on-year at the end of the period.
Gross Profit
Industry wide global freight costs have risen materially during the year, being the primary driver of a 306bps gross
margin headwind compared to the first half of 2020. Gross margin excluding freight costs and foreign exchange saw an
increase as we delivered a greater full price product mix and improved product costs. Despite much of the market
increasing pricing to offset inflationary pressures through the period, we took the decision to absorb additional mid-

term freight costs. To support partial offset of industry wide freight cost inflation, as we’ve moved into the second half
of 2021 we are beginning to pass an element of higher costs to customers in a way that we believe continues to deliver
improvements in our relative price positioning compared to the market.
Operating expenditure & Adjusted EBITDA
Cost base efficiencies continue to be delivered at pace as we scale and leverage existing investments made in our
logistics network, marketing engine and overhead structure.
Fulfilment costs as a percentage of revenue fell 475bps year-on-year to 19.8%, driven by higher average order values
and underlying efficiency improvements.
Marketing costs remained low throughout the period at 14.3% of gross sales, 447bps lower on a year-on-year basis.
Improved efficiency levels were supported by underlying improvements to customer targeting and increased repeat
order mix.
Overhead costs reduced 286bps to 10.4% of revenue, as we leveraged existing investments and central costs.
Despite freight inflationary pressures, adjusted EBITDA for the half year was positive at +£1.1m, representing a £12.2m
year-on-year improvement.
Loss before tax
For the six months ended 30 June
Six months to
30th June 2021
Six months to
30th June 2020 Change
Loss before tax (10.1) (15.2) 5.1
Depreciation of property, plant and equipment 0.9 1.2 (0.3)
Amortisation of intangible assets 2.3 1.8 0.5
Depreciation of right of use assets 1.8 1.9 (0.1)
Net finance expense 1.1 0.6 0.5
EBITDA (4.0) (9.7) 5.7
Adjustments for:
Depreciation of right of use assets (1.8) (1.9) 0.1
Interest expense on lease liabilities (0.2) (0.3) 0.1
Share based payment expense 1.7 0.5 1.2
Exceptional items
Fundraising 5.4 0.1 5.3
Supply chain transformation 0.0 0.2 (0.2)
Adjusted EBITDA 1.1 (11.1) 12.2
Loss before tax improved £5.1m year-on-year to (£10.1m), including £5.4m of exceptional costs relating to our IPO and
£1.2m of additional share based payment costs.
Depreciation and amortisation excluding right of use assets increased £0.2m year-on-year to £3.2m.

Share based payment expenses of £1.7m in the period included an “all company” share option grant at the start of the
year, accelaerated vesting on options related to our IPO and an award of other option grants on IPO.
Taxation
During the period we recognised a deferred tax asset of £15.3m, increasing £3.1m from 31 December 2020. The
increased deferred tax asset relates to a revaluation following a change to the UK corporation tax rate being
substantively enacted as part of the Finance Bill 2021.
Earning per share
Basic losses per share reduced from (5.0p) to (2.0p).
Cashflow
Net cash inflows through the period were £134.9m, compared to £35.4m prior year. Inflow included £100m of gross
proceeds raised from our IPO and £6.5m relating to the exercise of share options. Free cashflow was +£30m in the
period, predominantly due to our negative working capital position as supply of stock and therefore cash outflow was
phased later than usual.
Capital expenditure during the period was £3.4m, a 13% year-on-year increase. Capital expenditure was primarily
focused on intangible assets as we continued our programme of ongoing investments into our technology platform.
PRINCIPAL RISKS AND UNCERTAINTIES
The group operates in different geographies which are controlled and managed from the UK. As a result, the group has
reduced exposure to business and financial risks because it is able to call on group financial resources and experience.
The directors assess the principal risks and uncertainties facing the group in both the short-term and long-term. The
Board does not consider that principal risks have changed since the publication of the company’s IPO prospectus on 16th
June 2021 (Prospectus). A summary of the key risks is given below with further detail on pages 10-27 of the group’s
Prospectus.
Brand risk
Enhancing, investing in and maintaining the MADE brand is fundamental to the group’s efforts to attract, maintain and
expand the group’s customer base. Brand identity is a critical factor in retaining existing customers and attracting new
customers.
Promotion and enhancement of the MADE brand depends on the group’s ability to provide an attractive product
offering and a positive customer experience. Any failure to evolve the product offering; deliver high quality products
across a range of different designs and price points; offer reasonable lead-times, excellent customer service or efficient
and reliable delivery; or any substantial product recall or product liability claim, could damage the group’s reputation
and brand and result in the loss of customer confidence and a reduction in purchases.
The group has expended and will continue to expend time and resources on developing design led products, marketing,
and customer relations, to help continue strengthening the MADE brand. This includes continually seeking and actioning
customer feedback, building a strong network of designers, maintaining high quality services, building deep
relationships with suppliers, and continuing to develop local sourcing offices.
Supply chain risk
The group works directly with over 200 product suppliers globally. Consequently, the group faces a variety of risks
generally associated with doing business in foreign markets and the ability for suppliers to meet the group’s
expectations. In the event of any of such risks materialising, the group may incur substantial costs in switching to a
different third-party supplier or moving production of its products to another region. The group mitigates product
supplier risks by ensuring diversity of supply and maintenance of regular contact with suppliers via on-the-ground teams
based in key local markets.
The group relies on several logistics suppliers for warehousing and delivery of its products. There is a risk that selected
partners become unable to deliver against agreements with the group. The group has carefully selected warehousing
partners with strong market positions. In terms of delivery partners, the group works with several carefully selected
suppliers to ensure diversity of supplier base.

The group sources product on a global basis, transporting products from country of origin to our markets via freight
forward relationships. The group works to mitigate price and capacity volatility risk by entering into advance pricing and
volume agreements with freight forwarders. Despite this, at times of market volatility such as have been experienced
recently by the market as a whole, the company can face exposure to increased pricing and impacts to scheduling of
product shipping, which can result in delays to customer orders.
Cyber and data security risks
The group relies on the efficient and uninterrupted operation of its website and mobile application. When expanding
and operating its technology platform, the group maintains a constant focus on security and reliability. To this end, the
group undertakes administrative and technical measures to protect its systems and the consumer data that those
systems process and store. The group has developed policies and procedures designed to manage data security risks,
including disaster recovery planning, penetration and security testing; and has implemented various security measures,
including password security, firewalls, automated backup systems and high-quality antivirus software.
The group collects, transmits and stores personal data provided by its customers and faces security risks generally
associated with the transmission of such data. The group seeks to use customer data responsibly and has established
clear guidelines in connection with data collection, storage and processing. Data is stored securely in line with the legal
frameworks of the relevant jurisdiction, with appropriate controls and regular audits. The group is transparent about its
use of data in its privacy policy and other notifications that it provides to customers. It has established processes in place
to ensure that any collection of new data, or the use of data for a new purpose, is done appropriately. The Group
engages in a yearly penetration test, performed by a third party. The group also has incident management procedures
with respect to cyber-attacks and other information technology related incidents.
Macroeconomic risk
Adverse developments in macro-economic conditions, such as the recent global economic impacts related to the Covid-
19 pandemic, could adversely impact the group’s business and operating results. Customer purchases of discretionary
items, including the products that the group offers, may decline during periods of economic uncertainty, when
disposable income is reduced or when there is a reduction in customer confidence.
The group maintains a flexible cost base enabling rapid adjustment in the advent of macroeconomic headwinds.
Additionally, the group operates a regular review of scenario-based forecasts to ensure actions in a period of lower
demand are understood and planned for.
Currency risk
The group is exposed to currency risk by virtue of both the scope of the international business operations, with the
group generating cash in foreign currencies; as well as the proportion of its purchases being invoiced in foreign
currencies. The group’s policy is to match foreign currency exposures where possible. Where appropriate, the group
uses financial instruments in the form of forward foreign exchange contracts to hedge future foreign currency cash
flows.
Liquidity risk
Liquidity risk for the group arises from the management of working capital commitments and meeting its financial
obligations as they fall due. The group’s policy is to review cash flow forecasts and projections regularly as well as
information regarding cash balances to ensure that it has significant cash to allow it to meet its liabilities as they become
due.
The group reviews its long-term funding requirements in parallel with its long-term strategy, with an objective of aligning
both in a timely manner. Ultimately, the group’s business model inherently mitigates significant liquidity risk exposure
by virtue of the timing of cash inflows and outflows.
ALTERNATIVE PERFORMANCE MEASURES (APMs)
We monitor several key metrics to track the financial and operating performance. These measures are derived from the
group’s internal financial and analytics systems. The Directors believe that these measures provide readers with useful
information regarding the group’s financial and operating performance and facilitate an understanding of the underlying
performance of the group. As some of these measures are not determined in accordance with IFRS, and are thus
susceptible to varying calculations, they may not be comparable with other similarly titled measures of performance of
other companies.

To support understanding of APMs presented by the group, definitions are presented below.

Alternative performance
measure Definition Rationale
Gross sales Sales at the point of transaction excluding applicable VAT
Measure of customer demand which, unlike IFRS revenue, does not include cancellations, returns or the timing difference between customer order and delivery
LTM Active customers
Number of customers who have placed at least one order during the last twelve months (LTM)
Indication of customer volume development, providing an understanding of future growth opportunity and ongoing customer engagement
Orders Total number of orders received during the period, inclusive of orders that may eventually be returned or cancelled
Enables a bridge to average order value
Average order value (AOV)
Value of gross sales divided by the number of orders Indication of development of units per basket and average selling price, offering insight into the groups ability to deliver operating leverage
Repeat order mix (%)
Percentage of orders excluding first time customer orders
Indication of groups ability to retain customers once acquired
Homeware sales mix (% of total gross sales)
Percentage of gross product sales relating to homeware products (lighting, textiles, home accessories, kitchen & dining accessories, outdoor & leisure)
Insight into the product types sold
Fulfilment costs
Includes warehousing costs (including own personnel), delivery costs, transaction processing fees and returns processing are the main cost categories. Fulfilment costs are equal to distribution costs (as per statutory account definition) plus the interest expense related to warehousing lease costs less one-off items.
Clear insight into the groups costs directly linked to deliver of product to the point of sale as determined by the customer
Marketing costs
All online and offline advertising expenditure, the cost of public relations, non-working media, in-house influencer teams and showrooms (including showroom lease charges and staff costs). Excludes one-off items.
Clear visibility of costs related to acquiring new customers and retaining existing customers

Overhead costs
Consists of the employment costs of all head office functions (including, legal, finance, human resources, product buying, logistics, IT and sales and marketing), IT maintenance costs, lease charges and other property related costs for the office, general office costs, professional fees, and net foreign exchange differences. Overhead costs exclude depreciation, amortisation and impairment of intangible assets, exceptional items and share based payments.
Clear visibility of overhead costs reconciling to adjusted EBITDA
Adjusted EBITDA
Includes the unwinding of the discount on lease liabilities and depreciation of right-of-use assets (from the date of adoption of IFRS 16) to reflect the fact that lease related costs are key underlying business operating expenses; excludes the impact of any share based payment expenses to reflect the fact that this item is not directly correlated to underlying business performance; and excludes the impact of any items deemed to be exceptional in nature.
The exclusion of certain expenses in calculating Adjusted EBITDA facilitates operating performance comparisons on period-to-period basis See note 12 for a reconciliation to IFRS
Net Cash Cash onhand less interest bearing loans and borrowings Indication of liquidity position of the business
Free Cash Flow Free cash flow is defined as the change in cash and cash equivalents less cash received or utilised relating to financing or share equity issues.
Free cash flow represents the cash generated after accounting for cash outflows to support operations and maintain capital assets. See reconciliation below.
Net working capital
Net working capital relates to the balance of reported inventories, trade and other receivables, rent deposits, trade and other payables, deferred revenue and provisions as per the balance sheet.
A measure of liquidity and the ability to meet short-term obligations, as well as ability to fund operations of the business
Constant currency
Variance when restating 2020 gross sales, revenue or gross margin at effective exchange rate Gross sales at average rate for the period, revenue at average rates accounting for gains and losses on EUR hedges, cost of goods sold at average rates accounting for gains and losses on USD hedges
Offers understanding of financial performance excluding foreign exchange fluctuations

Fulfilment, marketing and overhead cost reconciliation
The following reconciles fulfilment, marketing and overhead costs to the consolidated income statement
Six months to 30th June
2021
Six months to 30th June
2020
Fulfilment costs (33.9) (26.1)
Marketing costs (30.5) (26.0)
Overhead costs (17.8) (14.1)
Total (82.2) (66.1)
Distribution expenses (33.8) (26.2)
Administrative expenses (58.5) (43.4)
Depreciation and amortisation (Excl. right of use assets) 3.2 3.0
Interest expense on lease liabilities (0.2) (0.3)
Share based payment expense 1.7 0.5
Exceptional items 5.4 0.3
Total (82.2) (66.1)
Reconciliation to free cash flow
The following table sets out the reconciliation of free cash flow to change in cash and cash equivalents:
Six months to 30th
June 2021
Six months to 30th
June 2020
Change in cash and cash equivalents 134.9 35.4
Less share issuance costs 2.0 0.0 Less proceeds from IPO share issue and exercise of share options (106.5) (0.6)
Less proceeds and repayment of borrowings 0.0 (9.9)
Free cash flow 30.4 24.9
Unaudited interim condensed consolidated
financial statements for the 6 months ended 30 June 2021
for
Made.com Group Plc
Interim condensed consolidated income statement
for the 6 months ended 30 June 2021
Unaudited Unaudited
30 June 2021 30 June 2020
Notes £m £m
Revenue 3 171.0 106.3
Cost of sales (87.7) (51.3)
Gross profit 83.3 55.0
Distribution expenses (33.8) (26.2)
Administrative expenses (58.5) (43.4)
Operating loss (9.0) (14.6)
Finance costs (1.1) (0.6)
Loss before tax (10.1) (15.2)
Income tax credit 3.7 –
Loss for the year attributed to equity holders of the Company
(6.4) (15.2)
Loss per share (pence per share):
Basic and diluted loss for the year attributable to ordinary equity holders of the Company 8
(2.0)p
(5.0)p
Non-GAAP measures:
Adjusted EBITDA profit/(loss) 12 1.1 (11.1)
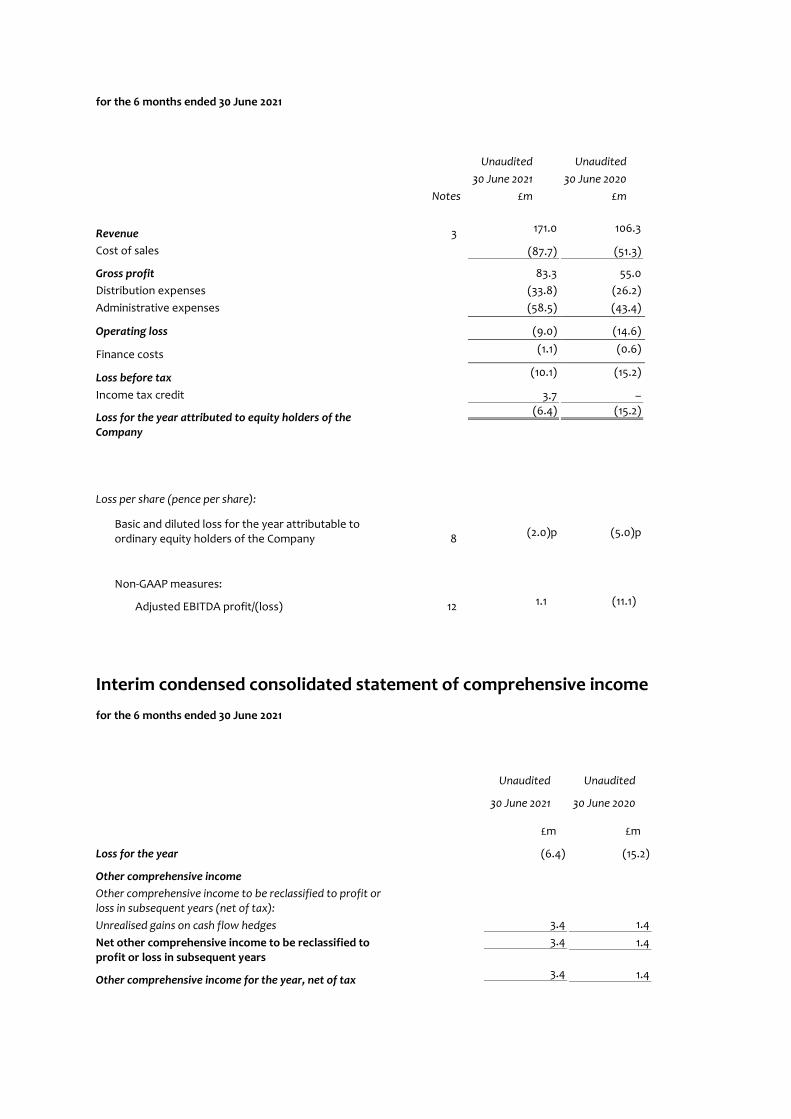
Interim condensed consolidated statement of comprehensive income
for the 6 months ended 30 June 2021
Unaudited Unaudited
30 June 2021 30 June 2020
£m £m
Loss for the year (6.4) (15.2)
Other comprehensive income
Other comprehensive income to be reclassified to profit or loss in subsequent years (net of tax):
Unrealised gains on cash flow hedges 3.4 1.4
Net other comprehensive income to be reclassified to profit or loss in subsequent years
3.4 1.4
Other comprehensive income for the year, net of tax 3.4 1.4

Total comprehensive loss for the year, net of tax, attributable to equity holders of the Company
(3.0) (13.8)
Interim condensed consolidated statement of financial position
as at 30 June 2021
Unaudited Audited
As at
30 June 2021 As at
31 December 2020
Notes £m £m
Non-current assets
Intangible assets 5 9.7 8.9
Property, plant and equipment 5 2.7 3.4
Right of use assets 5 10.0 12.3
Deferred tax asset 15.3 12.2
Rent deposits 0.5 0.5
38.2 37.3
Current assets
Inventories 34.7 21.5
Trade and other receivables 6 12.5 13.2
Derivative asset 6 2.3 1.2
Cash 6 185.3 50.4
234.8 86.3
Total assets 273.0 123.6
Current liabilities
Trade and other payables 6 (77.9) (39.6)
Derivative liability 6 (3.3) (6.0)
Lease liabilities 6 (3.8) (4.5)
Deferred revenue 7 (67.3) (52.8)
Interest bearing loans and borrowings 6 (10.0) –
(162.3) (102.9)
Non-current liabilities
Lease liabilities 6 (8.0) (9.7)
Provisions (1.3) (1.3)
Interest bearing loans and borrowings 6 – (9.7)
(9.3) (20.7)
Total liabilities (171.6) (123.6)
Net assets 101.4 0.0
Capital and reserves
Share capital 9 0.0 0.0
Share premium 9 103.4 62.2
Foreign currency translation reserve 9 –
0.0
Hedging reserve 9 0.0 (3.4)
Merger reserves 9 42.0 (20.2)

Accumulated deficit (44.0) (38.6)
101.4 0.0

Interim condensed consolidated statement of changes in equity
for the 6 months ended 30 June 2021
Share capital Share
premium
Foreign currency translation
reserve Hedging reserve
Merger
reserves Accumulated
deficit Total
£m £m £m £m £m £m £m
At 1 January 2020 0.0 62.5 – (1.3) (20.2) (32.3) 8.7
Loss for the period – – – – – (15.2) (15.2)
Other comprehensive income:
Movements in cashflow hedges
– – – 1.9 – – 1.9
Translation differences – – – – – – –
Tax on other comprehensive income – – – (0.5) – – (0.5)
Total comprehensive profit/(loss) for the year – – – 1.4 – (15.2) (13.8)
Share based payments – – – – – 0.5 0.5
Shares options exercised – 0.6 – – – – 0.6
Warrants issued – – – – – 0.2 0.2
Reclassification of reserves – (0.9) – – – 0.9 –
At 30 June 2020 (unaudited) 0.0 62.2 – 0.1 (20.2) (45.9) (3.8)
At 1 January 2021 0.0 62.2 0.0 (3.4) (20.2) (38.6) 0.0
Loss for the year – – – – – (6.4) (6.4)
Other comprehensive income:
Movements in cashflow hedges
– – – 4.1 – – 4.1
Translation differences – – – – – – –
Tax on other comprehensive income – – – (0.7) – – (0.7)

Total comprehensive income/(loss) for the year – – – 3.4 – (6.4) (3.0)
Share based payments – – – – – 1.0 1.0
Share-for-share exchange – (62.2) – – 62.2 – –
Share capital issued 0.0 96.9 – – – – 96.9
Shares options exercised – 6.5 – – – – 6.5
At 30 June 2021 (unaudited) 0.0 103.4 0.0 0.0 42.0 (44.0) 101.4
All equity disclosed above is attributable to the owners of the parent.

Interim condensed consolidated statement of cash flows
for the 6 months ended 30 June 2021
Unaudited Unaudited
30 June 2021 30 June 2020
Notes £m £m
Operating activities
Loss before tax (10.1) (15.2)
Adjustments to reconcile loss before tax to net cash flows
Depreciation of property, plant and equipment 4 0.9 1.2
Amortisation of intangible assets 4 2.3 1.8
Depreciation of right of use assets 4 1.8 1.9
Share-based payment expense 1.0 0.5
Finance costs 1.1 0.6
Working capital adjustments:
Decrease in trade receivables 0.1 0.4
(Increase)/decrease in inventories (13.0) 11.3
Decrease in other receivables, prepayments and accrued income 0.6 1.3
Increase in trade payables, taxes and social security 14.1 9.5
Increase in accruals and deferred revenue 37.9 16.8
Cash flows from operating activities 36.7 30.1
Interest paid (0.6) (0.4)
Net cash inflow from operating activities 36.1 29.7
Investing activities
Purchase of property, plant and equipment (0.3) (0.5)
Expenditure on intangible assets (3.1) (2.5)
Net cash outflow used in investing activities (3.4) (3.0)
Financing activities
Repayment of lease liabilities (2.3) (1.8)
Proceeds from borrowings – 19.9
Repayment of borrowings – (10.0)
Share issuance costs (2.0) –
Proceeds from IPO share issue 100.0 –
Proceeds from exercise of share options 6.5 0.6
Net cash inflow from financing activities 102.2 8.7
Net increase in cash 134.9 35.4
Cash at 1 January 50.4 17.5
Cash at 30 June 185.3 52.9

Notes to the interim condensed consolidated financial statements
for the 6 months ended 30 June 2021
1. General information
Made.com Group Plc (the ‘Company’) was incorporated in England and Wales on 20 April 2021. The Company is a public company limited by shares. The address of its registered office is 5 Singer Street London EC2A 4BQ. On 21 June 2021, the Company acquired Made.com Limited and its subsidiaries (the Made.com Limited Group). Together they form the Made.com Group Plc group (the Group). The Group is engaged in the online retail of furnishings and homeware. Immediately following the reorganisation, the entire issued share capital of the Company was admitted on to the premium listing segment of the Official List of the Financial Conduct Authority and to trading on the London Stock Exchange’s Main Market for listed securities.
2. Basis of preparation and accounting policies
Group Reorganisation
On 21 June 2021, the Company acquired the entire shareholding of Made.com Limited via a share-for-share exchange. The insertion of the Company on top of the existing Made.com Limited Group does not constitute a business combination under IFRS 3 Business Combinations. This transaction has been deemed to be a reverse acquisition in line with guidance from the Interpretations Committee (IFRIC) and as such the consolidated accounts for the Group are treated as a continuation of the consolidated accounts of the Made.com Limited Group.
Under the principles of continuation accounting the consolidated financial statement of the newly formed Group must reflect:
• The assets and liabilities of the Made.com Limited Group at pre-combination carrying amounts;
• The retained earnings and other equity balances of the Made.com Limited Group at pre-combination carrying amounts;
• The assets and liabilities of the Company at fair value;
• The share capital of the Company;
• The income statement for the current period including the results for the Made.com Limited Group up to 21 June 2021 plus the results for the newly formed Group from 21 June onwards
These interim condensed consolidated financial statements of the Group are the first set of interim financial statements for the newly formed Group. The prior period has been presented as a continuation of the former Made.com Limited Group on a consistent basis as if the group reorganisation had taken place at the start of the earliest period presented, being 1 January 2020. The prior period comparatives are those of the former Made.com Limited Group since no substantive economic changes have occurred. The consolidated reserves of the Group have been adjusted in the current period following the share-for-share exchange to reflect the share capital of the Company with the difference giving rise to a merger reserve.
Basis of preparation
These interim condensed consolidated financial statements (Interim Financial Statements) of Made.com Group Plc comprises the results of the Group for the 6 months ended 30 June 2021. These Interim Financial Statements are unaudited but have been reviewed by the auditors and their report to the Company is set out on page 32, and they were authorised for issue in accordance with a resolution of the Directors on 13 September 2021.
The condensed set of financial statements included in this half-yearly financial report has been prepared in accordance with UK adopted International Accounting Standard 34, “Interim Financial Reporting and the Disclosure and Transparency Rules of the Financial Conduct Authority. The annual financial statements of the Group will be prepared in accordance with UK adopted International Financial Reporting Standards. They do not constitute statutory accounts within the meaning of section 434(3) of the Companies Act 2006 and should be read in conjunction with the financial statements prepared for the Made.com Limited Group for the twelve months ended 31 December 2020, which were prepared in accordance with International Financial Reporting Standards (IFRS) and are filed with the Register of Companies in Gibraltar and are available to shareholders on request. The auditor’s report on these accounts was unqualified and did not contain an emphasis of matter paragraph.

2. Basis of preparation and changes to the Groups accounting policies (continued)
Accounting policies
The accounting policies adopted in the preparation of the Interim Financial Statements are consistent with those followed in the preparation of financial statements for the Made.com Limited Group for the twelve months ended 31 December 2020, as set out in note 2 of those statements, except for the new standards and amendments effective as of 1 January 2021, which have not had an impact on the Interim Financial Statements of the Group.
Critical accounting judgements and key sources of estimation and uncertainty
In the application of the Group’s accounting policies, management is required to make judgements, estimates and assumptions about the carrying amounts of assets and liabilities that are not readily apparent from other sources. The key sources of estimation, uncertainty and judgement applied in the preparation of the Interim Financial Statements are consistent with those applied in the financial statements of the Made.com Limited Group for the year ended 31 December 2020, as disclosed in note 3 of those statements with the exception of two additional sources of estimation:
Share based payments
The One-off IPO Award granted on 21 June 2021 included market performance conditions, which required the use of a Monte-Carlo valuation model. Assumptions and estimates have been used to determine the value of certain inputs into the Monte-Carlo model that would normally be determined with reference to active market data, including share price volatility which has been estimated with reference to comparable companies.
Share issuance costs
As part of the IPO, the Group issued new share capital. In line with the requirements of IAS 32 certain costs that have been deemed to be directly related to the issuance of new share capital have been recognised in equity. In order to determine the value to recognise in equity certain costs have been allocated using a systematic estimation method with reference to the proportion of new share capital issued and total share capital.
Deferred tax asset
During the period, the deferred tax asset has been revalued at 25% (previously 19%) based on the tax rate substantively enacted at the reporting date and the rate at which the recognised tax losses are expected to unwind.
Going concern
The Interim Financial Statements have been prepared on a going concern basis. The Group has reported a loss of £(6.4)m for the 6 months ended 30 June 2021 (2020: loss of £(15.2)m) and is in a net asset position of £101.4m as at 30 June 2021 (31 December 2020: net asset position £0.0m), with a net current asset position of £72.5m (31 December 2020: net current liability position of £(16.6)m). The Group has a cash balance of £185.3m at 30 June 2021 following the successful IPO primary issue which raised £100m. The Group’s loan with Silicon Valley Bank of £10.0m was repaid on 5 July 2021.
Since early 2020, the Group has been exposed to extraordinary market conditions due to the COVID-19 pandemic. During this period, despite temporary disruptions to its supply chain, the Group has delivered ongoing strong sales growth, broadly aligned to levels delivered through previous years. Temporary supply chain disruptions have meant that the Group sold product on extended lead-times for much of 2020 and 2021. This impacted customer conversion which in turn impacted gross sales growth. The supply chain disruptions also impacted revenue recognition timing, resulting in a high level of deferred income at 30 June 2021. As stock levels normalise through 2021, the Group expects to continue delivering strong growth in all of its markets.
The directors have reviewed the Group’s forecast and projections for the period to December 2022 (the ‘Forecast Period’), including their assessment of trading and associated cash flow forecasts, forecast liquidity and covenant compliance, and have a reasonable expectation that the Group has adequate financial resources to continue its operations for the foreseeable future. The Group has continued to trade throughout the COVID-19 pandemic which continues to create significant market uncertainty.
2. Basis of preparation and changes to the Groups accounting policies (continued)
Going concern (continued)
In considering the appropriateness of adopting the going concern basis in preparing the financial statements the directors have assessed the potential cash generation of the Group and considered a range of downside scenarios. The scenarios were informed by a comprehensive review of the macroeconomic environment and the Group’s experience of trading through the pandemic over the last 18 months. The assumptions to which the forecasts are most sensitive are the expected growth in sales and the continued freight cost pressures.
The Group’s base case forecast assumes an increase in stock purchases, and therefore reduction in lead times as high levels of product is delivered to the Group’s warehouses, and a stabilisation and then a gradual improvement in elevated international freight cost levels. Alternative scenarios considered include:

• a severe-but-plausible downside scenario representing a 15% reduction in forecast sales on the base case from July 2021 onwards and a downgrade of gross margin, with no offsetting mitigating cost reduction actions; and
• a reverse stress test scenario that models a gross sales decline of 36% year-on-year in the second half of 2021 followed by a gross sales decline of 57% year-on-year in 2022, which models a level of revenue not experienced since 2017. Additionally, an immediate decline in gross margin from the base case is assumed, without cost mitigation actions. This case is considered remote in the context of the 54% sales growth seen in the half year 2021 and would require an immediate shift in consumer preferences and behaviour.
Following the various plausible scenarios and stress tests performed the Group has demonstrated that it would continue to have sufficient cash headroom throughout the Forecast Period and still have the necessary liquidity to continue trading.
To date, performance has continued to be strong and with the measures that management have put in place the Directors judge that the Group will continue to operate as a going concern and it is well positioned to do so given the online ‘pure-play’ nature of its business model and the flexibility it possesses in its cost base. On the basis of the assessment performed, the directors consider it is appropriate to continue to adopt the going concern basis in preparing the condensed consolidated interim financial statements for the period ended 30 June 2021.
3. Segmental analysis
The Group’s operating segments are reported based on the financial information provided to the Board of Directors. The Board is identified as the Chief Operating Decision Maker for the business and are responsible for making strategic decisions. For strategic management decision making and reporting purposes, the Group is organised into business units based on location of customers. The Group is considered to have two reportable segments: UK operations and Continental Europe operations.
Revenues for both segments are generated from the online sale of furniture and homewares products. Each market is served by separate websites, and there are no inter-segment transactions. The Group operates a direct-to-consumer model and as such there is no reliance on a single customer or group of major customers.
The Board assesses segment performance based on a regional measure of adjusted EBITDA (before the allocation of central costs), which excludes the impact of exceptional costs and share based payment related costs (including associated employment related taxes) but includes an allocation of lease related expenses (depreciation and interest). Total assets and liabilities, as well as other specific disclosures in relation to segment assets and liabilities, are not disclosed as this information is not provided by segment to the Chief Operating Decision Maker on a regular basis.
UK Continental Europe Total
30 June 2021
30 June 2020
30 June 2021
30 June 2020
30 June 2021
30 June 2020
£m £m £m £m £m £m
Revenue from customers in UK 88.0 54.2 – – 88.0 54.2
Revenue from customers in Europe – – 82.8 52.1 82.8 52.1
Total segment revenue 88.0 54.2 82.8 52.1 170.8 106.3
Other revenue 0.2 – – – 0.2 –
Total Revenue 88.2 54.2 82.8 52.1 171.0 106.3
Regional adjusted EBITDA1 10.7 2.9 3.9 (3.4) 14.6 (0.5)
Central administration costs (13.5) (10.6)
Segment profit Adjusted EBITDA 1.1 (11.1)
Share based payment related costs (1.7) (0.5)
Depreciation of property plant and equipment (0.9) (1.2)
Amortisation of intangible assets (2.3) (1.8)
Interest expense (0.9) (0.3)
Exceptional Items (note 12) (5.4) (0.3)
Loss before tax (10.1) (15.2)
[1] Included within regional adjusted EBIDTA is £1.2m of lease depreciation allocated to UK operations (2020: £ 1.2m) and £0.6m of lease depreciation allocated to Continental Europe
operations (2020: £0.7m), as well as £0.1m of lease interest expense allocated to UK operations (2020: £0.2m) and £0.1m of lease interest expense allocated to Continental Europe
operations (2020: £0.1m).

The nature of the Group’s business model is such that there will be some seasonality driving the sales profile linked to promotional activity. Historically there is one key promotion in the first quarter of the year and two in the second half of the year, falling into the third and fourth quarters. The Group’s revenue is therefore generally expected to be higher in the second half of the year.
4. Operating loss
Operating loss includes the following items, classified within distribution and administrative expenses:
2021 2020
£m £m
Depreciation of property, plant and equipment 0.9 1.2
Amortisation of intangible assets 2.3 1.8
Depreciation of right of use assets1 1.8 1.9
Net foreign exchange loss 0.7 0.2 1 £0.7m of depreciation of right of use assets on warehouse leases in classified within distribution expenses (2020: £0.6m). The remaining £1.1m of
depreciation of right of use assets is classified within administrative expenses (2020: £1.3m).
5. Capital expenditure and commitments
During the 6 months ended 30 June 2021, the Group capitalised website development costs of £3.1m (2020: £2.5m) and recorded additions to property, plant and equipment of £0.3m (2020: £0.5m).
There were no disposals of property, plant and equipment during the period (2020: none).
There were no new leases entered in to during the period ended 30 June 2021. In the 6 months ended 3o June 2020, the Group entered into 3 new leases resulting in the recognition of additional right of use assets of £0.8m.
As at 30 June 2021, the Group has capital commitments for expenditure on property, plant and equipment contracted, but not provided for, of £3.8m (2020: £nil).
6. Financial assets and financial liabilities
The carrying value of the Group’s financial assets and liabilities at the period end was:
Unaudited Audited
As at
30 June 2021
As at
31 December 2020
£m £m
Financial assets
Assets held at amortised cost
Cash 185.3 50.4
Trade receivables 0.1 0.1
Other receivables 7.6 10.1
Assets held at fair value
Derivatives 2.3 1.2
Financial liabilities
Liabilities held at amortised cost
Trade payables (28.6) (17.5)
Accruals (35.6) (11.4)
Lease liabilities (11.8) (14.2)
Term loan (10.0) (9.7)
Liabilities held at fair value
Derivatives (3.3) (6.0)
The fair value of the Group’s financial assets and liabilities held at amortised cost approximates their carrying value.

On 22 June 2021, the Group served notice on the Silicon Valley Bank, of the intention to repay the term loan in full on 5 July 2021. As a result of this, the term loan has been reclassified as a current liability at 30 June 2021.
Derivative assets and liabilities held at fair value
The group uses forward foreign exchange contracts to manage its transaction exposures incurred in USD and EUR. The foreign exchange contracts are designated as cash flow hedges and are entered into for periods consistent with foreign currency exposure of the underlying transactions, generally from one to twelve months.
The Group enters into derivative financial instruments with various counterparties, principally financial institutions with investment grade credit ratings. Foreign exchange contracts are valued using valuation techniques, which employs the use of market observable inputs. The most frequently applied valuation techniques include forward pricing and swap models, using present value calculations. The models incorporate various inputs including the credit quality of counterparties, foreign exchange spot and forward rates, yield curves of the respective currencies, currency basis spreads between the respective currencies and forward rate curves of the underlying commodity. All derivative contracts are fully cash collateralised, thereby eliminating both counterparty and the Group’s own non-performance risk. As at 30 June 2021, the marked-to-market value of derivative liability position is net of a credit valuation adjustment attributable to derivative counterparty default risk. Derivative contracts are categorised as level 2 within the fair value hierarchy.
During the 6 months ended 30 June 2021, the Group transferred accumulated losses on USD cashflow hedges of £4.7m from equity to inventory (2020: £0.7m gain) and transferred accumulated gains on EUR cashflow hedges of £0.6m from equity to revenue (2020: £1.0m).
7. Deferred revenue
The Group begins to actively market and sell its products to customers when they are in the manufacturing and shipping phase. This can typically be up to 12 weeks prior to delivery to the customer, although recent short-term supply chain pressures have meant that this can be up to 18 weeks. Customers are entitled to cancel orders free of charge prior to delivery and can return them up to 30 days after delivery. Revenue is recognised at the point that the products are delivered to the customer. The lead time between the customer placing the sale order and the delivery of the order creates a deferred revenue contractual liability. Revenues of £48.2m (net of cancellations) were recognised in the 6 months ended 30 June 2021 that were reported as deferred revenue at the beginning of the year (6 months to 30 June 2020: £17.5m). The carrying balance of customer orders not yet fulfilled at 30 June 2021 is £67.3m (31 Dec 2020: £52.8m) which is expected to be recognised net of cancellations within 1 to 6 months of the period end (31 Dec 2020: 1 to 6 months), in line with the prevailing lead times. Included within this balance is an amount of £1.6m relating to a provision for future returns (31 Dec 2020: £1.4m).
8. Earnings per share
Basic earnings per share is calculated by dividing the net loss for the period attributable to ordinary equity holders of the parent by the weighted average number of ordinary shares in issue during the period. As the condensed consolidated interim financial statements have been presented as a continuation of the existing group, the number of shares taken as being in issue for both the current and preceding periods are deemed to be the number of ordinary shares issued by Made.com Group Plc to acquire Made.com Limited in the share for share exchange (see note 9). The weighted average number of shares is then adjusted to reflect changes in the number of ordinary shares issued in Made.com Limited that occurred during the previous period.
Diluted earnings per share amounts are calculated by dividing the net profit/(loss) attributable to ordinary equity holders of the parent by the weighted average number of shares outstanding during the period plus the weighted average number of shares that would be issued on conversion of any dilutive potential ordinary shares into ordinary shares. The outstanding share options are anti-dilutive for the periods presented.
The following reflects the income and share data used in the basic and diluted earnings per share computations:
2021 2020
Loss attributable to ordinary equity holders of the Company (£m) (6.4) (15.2)
Weighted average number of shares
326,872,127
304,163,577
Basic and diluted loss per share (pence per share)
(2.0)p
(5.0)p
There have been no other transactions involving actual ordinary shares or potential ordinary shares between the reporting date and the date of authorisation of this financial information.

9. Issued share capital and reserves
Share Capital
Authorised, called up and fully paid share capital
30 June 2021 30 June 20201
Nominal value £0.0001 Nominal value £0.001
No. of shares £m No. £m
Ordinary shares 387,660,176 – 7,257,838 –
Series A preference shares – – 3,683,855 –
Series B-1 preference shares – – 4,211,329 –
Series B-2 preference shares – – 1,299,720 –
Series C-1 preferences shares – – 3,865,979 –
Series C-2 preference shares – – 6,060,606 –
Series C-3 preference shares – – 673,651 –
Series C-4 preference shares – – 3,653,955 –
Growth shares – – 1,184,675 –
387,660,176 – 31,891,608 – 1 The share capital presented at 30 June 2020 is Made.com Limited.
No. of shares £m
As at 1 January 2021 31,891,608 –
Warrant options exercised 43,500 –
Conversion of growth shares (221,734) –
Share-for-share exchange
Made.com Limited (31,713,374) –
Made.com Group Plc 31,712,373 –
Issued on incorporation of Made.com Group plc 1,001 –
Capital reorganisation (1:10 split of ordinary shares) 285,420,357 –
Shares issued upon IPO 50,000,000 –
Share options exercised 20,526,446
Preference share redeemed (1) –
As at 30 June 2021 387,660,176 –
On 20 April 2021, Made.com Group Plc was incorporated with an issued share capital of 1,000 ordinary shares with a nominal value of £0.001 and one redeemable preference share with a nominal value of £49,999.
On 10 June 2021, Made.com Limited issued 43,500 ordinary shares following the exercise of the warrant options by the option holders, with an exercise price of £0.001 per share.
9. Issued share capital and reserves (continued)
On 21 June 2021, the Company issued 31,712,373 ordinary shares to the shareholders of Made.com Limited as consideration for the Company’s acquisition of the entire shareholding of Made.com Limited via a share-for-share exchange. Under the terms of the exchange all ordinary shares, preference shares and growth shares in Made.com Limited were exchanged for ordinary shares in Made.com Group Plc. Under the terms of the reorganisation agreement governing the share-for-share exchange, 1,184,675 growth shares were acquired by the Company in exchange for the issue of 962,941 ordinary shares to the growth shareholders. The difference of 221,734 between the number of shares acquired and the number of shares issued reflects the application of the hurdle price for the deemed conversion of the growth shares, in accordance with the reorganisation agreement and the articles of association of Made.com Limited.
Additionally on 21 June 2021, once the share-for-share exchange was completed, the Company carried out a reorganisation of its share capital. Under the capital reorganisation each ordinary share with a nominal value of £0.001 was split into 10 ordinary shares with a nominal value of £0.0001 (a 1:10 split). This was done to facilitate the listing on the Premium Segment of the Official List of the Financial Conduct Authority and to trade on the London Stock Exchange Main Market for listed securities.
Upon listing, the Company raised £100m by issuing 50,000,000 new ordinary shares with a nominal value of £0.0001 and a share price of £2.00 as part of the initial public offering, with £5,000 being recognised in share capital and the remainder in share premium. In addition, 20,526,446 new shares were issued following the exercise of employee share options and

the redeemable preference share was redeemed. Costs of £3.1m deemed to be directly attributable to the issuance of this share capital, including underwriting and professional fees, have been recognised in Share Premium in the six months ended 30 June 2021.
Nature and purpose of reserves
Foreign currency translation reserve
Exchange differences relating to the translation from the functional currencies of the Group’s foreign subsidiaries into Pounds Sterling are accounted for by entries made directly to the foreign currency translation reserve. Note that is reserve arises in the consolidated Group only, not in the Company.
Hedging reserve
The hedging reserve is used to recognise the unrealised gains and losses on cash flow hedges held by the Group that qualify for hedge accounting.
Merger reserve
Included within the Merger Reserve is an amount of £62.2m arising on the share-for-share acquisition of Made.com Limited by Made.com Group plc in June 2021, offset by an existing Merger Reserve of £(20.2)m held in Made.com Limited.
Reallocation of reserves
In the 6 months ended 30 June 2020, an amount of £0.9m of costs previously recognised through the P&L has been reallocated from retained earnings to the Share Premium account to better reflect the nature of these costs.
Dividends
No dividends have been paid or proposed during the 6 months ended 30 June 2021 (2020: nil).
10. Share-based payments
Under the General Employee Share-option Plan (GESP), the Group, at its discretion, may grant share options over ordinary shares of the parent to employees and directors. The options are generally granted as equity-settled. The fair value of share options granted is estimated at the date of grant using an appropriate valuation model. The expense associated with issuing these options is pushed down from the ultimate parent company to the entity in which the employees are employed.
The key inputs used in the Black-Scholes pricing model to determine the fair value include the share price at the date of grant, which is calculated either with reference to the company valuation at the time of grant, adjusted for existing preference rights, and divided by the issued share capital and outstanding options at the time of grant or with reference to the market share price on the date of grant; the exercise price attached to the option; the vesting period of the award; an appropriate risk free rate; the impact of any dividend rights attached to the grant; and an expected share price volatility, estimated with reference to published volatility rates of publicly listed comparable companies.
Current period grants
All Employee Grant
On 1 January 2021, the Group granted 349,200 options over shares in Made.com Limited to employees under a one-off company-wide grant (the ‘’All Employee Grant’’). Under the terms of the grant, all employees were granted 600 options each with an exercise price of £10.56. A small number of these options (36,000) were granted as phantom options and will be accounted for as cash-settled. The remaining options (313,200) are accounted for as equity settled. The options will vest in 3 equal tranches over a 3 year vesting period. No performance conditions other than continued service are attached to the options. On 21 June 2021, following the Group’s successful IPO, an accelerated vesting profile was triggered in line with the terms of the grant. 50% of the options vested on 21 June 2021; of the remaining 50%, one-third will vest at the second anniversary of the grant date and the remainder will vest at the third anniversary of the grant date.
The fair values calculated for the options and the relevant inputs into the Black-Scholes models were:
Exercise price £10.56
Fair value (£) £6.31
Share price at grant date (£) £14.32
Expected volatility (%) 50%
Risk-free interest rate (%) 0.14%
Expected life of share options (periods) 3
Dividend yield (%) N/A

Management grant
In addition to the All Employee Grant, on 1 January 2021, the Group granted 70,000 options over shares in Made.com
Limited to senior management. 46,667 options were granted with an exercise price of £10.16. 23,333 options were
granted with an exercise price of £14.51. The options will vest in 12 equal tranches over a 3 year vesting period. No
performance conditions other than continued service are attached to the options.
The fair values calculated for the options and the relevant inputs into the Black-Scholes models were:
Exercise price £10.16 Exercise price £14.51
Fair value (£) £6.50 £4.76
Share price at grant date (£) £14.32 £14.32
Expected volatility (%) 50% 50%
Risk-free interest rate (%) 0.14% 0.14%
Expected life of share options (periods) 3 3
Dividend yield (%) N/A N/A
10. Share-based payments (continued)
IPO Awards
On 21 June 2021, the Group granted 3,001,000 options over shares in Made.com Group plc to the Executive Leadership
Team with an Award Price of £nil. Subjected to the specific performance conditions, 50% of the awards will vest on the
second anniversary of the grant date and the remaining 50% of the awards will vest on the third anniversary of the grant
date. The awards are subject to performance conditions. Under the plan rules, continued employment over the vesting
period is a requirement. In addition, one third of the award will vest (in line with the vesting schedule) subject to the
achievement of at least 20% Total Shareholder Return (TSR) growth (calculated on a compound annual growth
(“CAGR”) basis), measured at both vesting dates (the TSR Performance Condition); and one third of the award will vest
(in line with the vesting schedule) subject to the achievement of at least 25% Sales growth (calculated on a CAGR basis),
measured at both vesting dates (the Sales Growth Performance Target).
The fair value calculated for the elements of the award subject to TSR Performance Condition is £0.87 for the first tranche and £0.76 for the second tranche. These valuations have been determined using the Monte Carlo valuation method. The fair value calculated for the remaining elements of the award is £2.00 and has been determined using the Black-Scholes model. The inputs into the Black-Scholes and Monte Carlo models were:
Monte Carlo - TSR
Tranche 1
Monte Carlo –
TSR Tranche 2
Black Scholes
Fair value (£) £0.87 £0.76 £2.00
Share price at grant date (£) £2.00 £2.00 £2.00
Expected volatility (%) 50% 45% 45% - 50%
Risk-free interest rate (%) 0.13% 0.22% 0.13% - 0.22%
Expected life of share options (periods) 2 3 2 - 3
Dividend yield (%) 0.0% 0.0% 0.0%
Impact of the Group reorganisation on employee share options
On 21 June 2021, Made.com Group Plc acquired Made.com Limited via a share-for-share exchange. As part of this
exchange, all existing unvested and unexercised options were also transferred across to Made.com Group Plc on a one-
for-one basis. It was assessed that the fair value of the unvested schemes on 21 June 2021 immediately prior to and
immediately after the transfer remained unchanged. Following the transfer, Made.com Group Plc undertook a
reorganisation of their share capital to divide each 1 ordinary share of £0.001 into 10 ordinary shares of £0.0001. Any
unvested and unexercised options were similarly divided, such that each 1 option outstanding was divided into 10
options and any exercise price associated was divided by a factor of 10.
10. Share-based payments (continued)
Movements during the year
The following table shows the movement in the number of equity-settled share options outstanding and the weighted average exercise prices during in the 6 months ended 30 June 2021 and 2020:

The number of options outstanding at the end of 30 June 2021 have the following terms and weighted average exercise prices:
Term of the option Weighted Average
exercise price
2021 Weighted Average
exercise price
2020
8 May 2013 – 8 May 2023 £0.16 – £1.63 191,507
13 May 2014 – 13 May 2024 £0.20 – £2.00 201,274
18 September 2014 – 18 September 2024 £0.20 2,027,714 £1.99 1,050,336
7 November 2014 – 7 November 2024 £0.20 – £2.00 92,500
2 December 2014 – 2 December 2024 – – £3.25 28,500
19 September 2016 – 19 September 2026 £0.50 8,418,668 £4.88 1,260,666
1 August 2017 – 1 August 2027 £0.44 5,625,000 £5.30 690,000
4 September 2017 – 4 September 2027 £0.57 1,000,000 £5.75 100,000
26 February 2018 – 26 February 2028 £0.58 1,305001 £5.75 165,000
4 July 2019 – 4 July 2029 £1.22 93,331 £11.61 190,000
10 June 2020 – 10 June 2030 £1.16 3,000,000 £11.61 300,000
1 January 2021 – 1 January 2031 1.05 3,472,000 – –
22 June 2021 – 20 June 2031 £nil 3,001,000 – –
Total 27,942,714 4,269,783
11. Related party transactions
The Group’s significant related parties are disclosed in the most recent audited financial statements of Made.com Limited for the year ended 31 December 2020. During the six months ended 30 June 2021, two non-executive directors were appointed to the Made.com Group Plc board:
Gwyn Burr (appointed 7 May 2021)
Matthew Price (appointed 14 May 2021)
There were no other material changes to related parties in the period. As part of the IPO amounts totalling £1.0m were paid to directors in the form of one off bonuses, and 1,635,000 shares options were granted to directors and key management personnel as part of IPO Awards (refer to note 10 for further details on share option grants). Other than these specific IPO related transactions and compensation paid to key management personnel, no material related party transactions have taken place in the 6 months to 30 June 2021.
Group and Company 2021 2020
Weighted
Average exercise
price
Number of
options
Weighted
Average exercise
price
Number of
options
£ £
Outstanding at 1 January 4.65 4,243,116 3.99 4,362,464
Granted 10.70 383,200 11.61 300,000
Exercised during the period – – 1.66 (346,014)
Lapsed and forfeited during the year 10.56 (33,600) 5.75 (46,667)
Outstanding at 21 June 2021 (pre-reorg) 5.11 4,592,716 4.71 4,269,783
Capital reorganisation – 41,334,444 – –
Outstanding at 21 June 2021 (post-reorg) 0.51 45,927,160 – –
Granted post-reorg – 3,001,000 – –
Exercised post-reorg 0.32 (20,961,446) – –
Lapsed and forfeited post reorg 1.06 (24,000)
Outstanding at 30 June 0.56 27,942,714 4.71 4,269,783
Exercisable at 30 June 0.55 21,484,381 3.83 3,631,449

12. Adjusted EBITDA
Adjusted EBITDA is a non-IFRS measure. It is used to evaluate the Group’s operating performance, generate future operating plans and make strategic decisions regarding the allocation of capital. The exclusion of certain expenses in calculating Adjusted EBITDA facilitates operating performance comparisons on period-to-period bases. Accordingly, Adjusted EBITDA is presented to provide additional information assist readers to understand and evaluate the Group’s operating performance.
The Group defines Adjusted EBITDA as EBITDA adjusted to include the unwinding of the discount on lease liabilities and depreciation of right-of-use assets (from the date of adoption of IFRS 16) to reflect the fact that lease related costs are key underlying business operating expenses; exclude the impact of any share based payment related expenses (including associated employment related taxes) to reflect the fact that this item is not directly correlated to underlying business performance; and exclude the impact of any items deemed to be exceptional in nature.
Exceptional items are defined as transactions that, in the opinion of the Directors, should be adjusted in order to provide a consistent and comparable view of the underlying business. Generally, this will include those items that are largely one-off or material in nature and which have been incurred outside of the normal business operations, including but not limited to restructuring and business transformation programmes and fund-raising activities.
The following table sets out the reconciliation of Adjusted EBITDA to operating loss before tax:
2021 2020
£m £m
Loss before tax (10.1) (15.2)
Depreciation of property, plant and equipment 0.9 1.2
Amortisation of intangible assets 2.3 1.8
Depreciation of right of use assets 1.8 1.9
Finance costs 1.1 0.6
EBITDA (4.0) (9.7)
Adjustments for:
Depreciation of right of use assets (1.8) (1.9)
Interest expense on lease liabilities (0.2) (0.3)
Share based payment related costs 1.7 0.5
Exceptional items
Fundraising 5.4 0.1
Supply chain transformation – 0.2
Adjusted EBITDA 1.1 (11.1)
Exceptional items
In the 6 months ended 30 June 2021 costs of £5.4m relating to the IPO transaction have been incurred, including professional fees and one-off bonuses.
In the 6 months ended 3o June 2020 £0.2m of additional costs related to the 2019 supply chain transformation activities have been recognised; and £0.1m of costs have been incurred relating to fundraising activities.
13. Post balance sheet events
On 5 July 2021 the Group repaid the £10m term loan outstanding with Silicon Valley Bank.
On 12 July 2021, the Group granted 3,142,915 Performance Share Plan awards (PSP) in the form of nil cost options over ordinary shares of Made.com Group Plc under the Made.com Incentive Plan (MIP). The discretionary awards were granted to a group of senior management. The awards will vest subject to the achievement of certain performance conditions, including relative TSR, sales growth, EPS and ESG targets, as well as the individual’s continued employment over the vesting period and will be subject to a 2-year post-vesting holding period.
Statement of Directors’ Responsibilities
for the 6 months ended 30 June 2021
The directors confirm that the condensed consolidated interim financial statements have been prepared in accordance with IAS 34 Interim Financial Reporting and that the Interim Management Report and condensed consolidated interim financial statements include a fair review of the information required by Disclosure and Transparency Rules 4.2.4, 4.2.7 and 4.2.8, namely:

– the condensed consolidated interim financial statements gives a true and fair view of the assets, liabilities, financial position, cash flows and profit or loss of the issuer, or undertakings included in the consolidation;
– an indication of important events that have occurred during the first 6 months of the financial year and their impact on the condensed consolidated interim financial statements, and a description of the principal risks and uncertainties for the remaining 6 months of the financial year; and
– material related party transactions in the first 6 months of the financial year and any material changes in the related party transactions described in the last Annual Report.
The directors who served Made.com Group plc during the period are:
Susanne Given (appointed 7 May 2021)
Philippe Chainieux (appointed 20 April 2021)
Adrian Evans (appointed 7 May 2021)
Ning Li (appointed 20 April 2021)
Bruno Crémel (appointed 7 May 2021)
George McCulloch (appointed 7 May 2021)
Gwyn Burr (appointed 7 May 2021)
Matthew Price (appointed 14 May 2021)
BY ORDER OF THE BOARD
Philippe Chainieux
Chief Executive Officer
13 September 2021
Independent review report to the members of Made.com Group Plc
for the 6 months ended 30 June 2021
Conclusion
We have been engaged by the Company to review the condensed set of financial statements in the half-yearly financial report for the six months ended 30 June 2021 which comprises the interim condensed consolidated income statement, interim condensed consolidated statement of comprehensive income, interim condensed consolidated statement of financial position, interim condensed consolidated statement of changes in equity, interim condensed consolidated statement of cash flows and the related explanatory notes 1-13. We have read the other information contained in the half yearly financial report and considered whether it contains any apparent misstatements or material inconsistencies with the information in the condensed set of financial statements.
Based on our review, nothing has come to our attention that causes us to believe that the condensed set of financial statements in the half-yearly financial report for the six months ended 30 June 2021 is not prepared, in all material respects, in accordance with UK adopted International Accounting Standard 34 and the Disclosure Guidance and Transparency Rules of the United Kingdom’s Financial Conduct Authority.
Basis for Conclusion
We conducted our review in accordance with International Standard on Review Engagements 2410 (UK and Ireland) "Review of Interim Financial Information Performed by the Independent Auditor of the Entity" issued by the Auditing Practices Board. A review of interim financial information consists of making enquiries, primarily of persons responsible for financial and accounting matters, and applying analytical and other review procedures. A review is substantially less in scope than an audit conducted in accordance with International Standards on Auditing (UK) and consequently does

not enable us to obtain assurance that we would become aware of all significant matters that might be identified in an audit. Accordingly, we do not express an audit opinion.
As disclosed in note 2, the annual financial statements of the Made Plc Group will be prepared in accordance with UK adopted international accounting standards. The condensed set of financial statements included in this half-yearly financial report has been prepared in accordance with UK adopted International Accounting Standard 34, “Interim Financial Reporting.
Responsibilities of the directors
The directors are responsible for preparing the half-yearly financial report in accordance with the Disclosure Guidance and Transparency Rules of the United Kingdom's Financial Conduct Authority.
Auditor’s Responsibilities for the review of the financial information
In reviewing the half-yearly report, we are responsible for expressing to the Company a conclusion on the condensed set of financial statement in the half-yearly financial report. Our conclusion, based on procedures that are less extensive than audit procedures, as described in the Basis for Conclusion paragraph of this report.
Use of our report
This report is made solely to the company in accordance with guidance contained in International Standard on Review Engagements 2410 (UK and Ireland) "Review of Interim Financial Information Performed by the Independent Auditor of the Entity" issued by the Auditing Practices Board. To the fullest extent permitted by law, we do not accept or assume responsibility to anyone other than the company, for our work, for this report, or for the conclusions we have formed.
Ernst & Young LLP
London
14 September 2021