madison giacofci irmar - universit e rennes 2 inria rennes ...jk = 2 j 2.ensure that both xed and...
TRANSCRIPT

Functional data analysis : modelling curves variations
Madison GiacofciIRMAR - Universite Rennes 2
Journees sur les donnees temporellesINRIA Rennes - 25 mars 2019
Madison Giacofci / Univ Rennes Donnees temporelles 25/03/19 1 / 42

Summary
1 Introduction : functional data
2 Nonparametric functional regression
3 Modelling individual variabilityFunctional Mixed-Effects modelEstimation issueModel-based clusteringDeformation models
4 Conclusion and Persectives
Madison Giacofci / Univ Rennes Donnees temporelles 25/03/19 2 / 42

Summary
1 Introduction : functional data
2 Nonparametric functional regression
3 Modelling individual variabilityFunctional Mixed-Effects modelEstimation issueModel-based clusteringDeformation models
4 Conclusion and Persectives
Madison Giacofci / Univ Rennes Donnees temporelles 25/03/19 3 / 42

Context
More and more research fields collect curve-like data. Growth curves, spectrometry data, genomic data, weather data...
The term functional data gathers different types of data
Measured along time or space or any continuumSparse dataDense data (high throughput)With a common or not time grid
Madison Giacofci / Univ Rennes Donnees temporelles 25/03/19 4 / 42
Context
Historically, functional data appears around the 90’s
Their development has been caught between
Time series analysisLongitudinal data analysis
As for time series and longitudinal data, they consist of observations
(y(i)1 , . . . , y
(i)T ) ordered along time for the ith individual
Fundamental particularity :the ideal unit of observations are curves
. Consider the whole curve as a single entity
. To consider functional quantities such as smoothness
Madison Giacofci / Univ Rennes Donnees temporelles 25/03/19 5 / 42

Ovarian cancer dataPetricoin et al, 2002
Mass spectrometry data
Related to the study of the proteome
. To investigate biological processes involved in the development of apathology
Proteomic spectra generated bymass spectrometry(MALDI-TOF technology)
Samples from 253 women under2 conditions
Unaffected (91)Affected by ovarian cancer(162)
Each spectra contains 15154ionised peptides defined by am/z ratio.
010
2030
40
m/z ratio
Inte
nsity
Madison Giacofci / Univ Rennes Donnees temporelles 25/03/19 6 / 42

Breast cancer dataFridlyand et al. 2006
Microarray CGH data
Related to the study of the genome
. To detect possible chromosomal aberrations
Represent genomic profiles of breastcancer tumor cells (compared tohealthy cells)
Samples from 66 women affected
Each spectra contains 2044 ratios ofcopy number measurements
Individual spectra are piecewiseconstant
Madison Giacofci / Univ Rennes Donnees temporelles 25/03/19 7 / 42
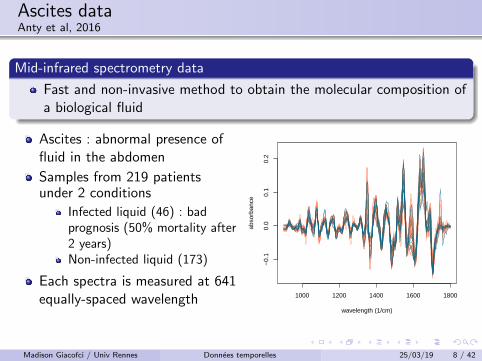
Ascites dataAnty et al, 2016
Mid-infrared spectrometry data
Fast and non-invasive method to obtain the molecular composition ofa biological fluid
Ascites : abnormal presence offluid in the abdomen
Samples from 219 patientsunder 2 conditions
Infected liquid (46) : badprognosis (50% mortality after2 years)Non-infected liquid (173)
Each spectra is measured at 641equally-spaced wavelength 1000 1200 1400 1600 1800
−0.
10.
00.
10.
2
wavelength (1/cm)
abso
rban
ce
Madison Giacofci / Univ Rennes Donnees temporelles 25/03/19 8 / 42

Complex data
Such data are :
Complex
Structured
Possibly dependent
Intrinsically infinite dimensional
But most of the statistical questions are standard :
Uncovering homogeneous subgroup of responses . Clustering
Recover a mean pattern . Estimation/Smoothing
Quantify variations across individuals . Mixed-effects models
Predict a response variable . Supervised learning
And some others specific to the functional nature of data :
Alignment on individual curves . Deformation models
Identify discriminative portion of a signal . Domain selection
and many others...
Madison Giacofci / Univ Rennes Donnees temporelles 25/03/19 9 / 42

Summary
1 Introduction : functional data
2 Nonparametric functional regression
3 Modelling individual variabilityFunctional Mixed-Effects modelEstimation issueModel-based clusteringDeformation models
4 Conclusion and Persectives
Madison Giacofci / Univ Rennes Donnees temporelles 25/03/19 10 / 42
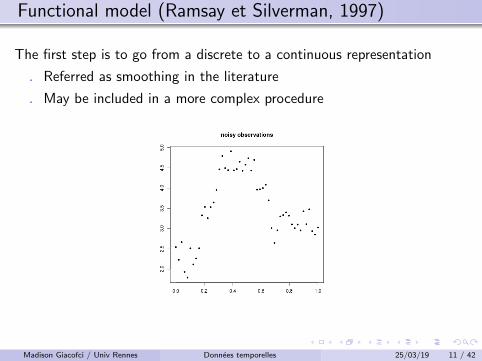
Functional model (Ramsay et Silverman, 1997)
The first step is to go from a discrete to a continuous representation
. Referred as smoothing in the literature
. May be included in a more complex procedure
Madison Giacofci / Univ Rennes Donnees temporelles 25/03/19 11 / 42

Functional model (Ramsay et Silverman, 1997)
Data are seen as curves sampled on a fine grid (t1, . . . , tM) and corruptedby noise, such that :
Y (tm) = µ(tm) + E (tm), E (tm) ∼ N (0, σ2E )
. Goal : Recover function µ from noisy observations
Madison Giacofci / Univ Rennes Donnees temporelles 25/03/19 12 / 42

Nonparametric approach
In a nonparametric framework, no specified forms for involvedfunctions
. The problem lie in infinite dimensional framework
Popular approach
Projection on an adapted functional basis. Set of pre-specified basis functions {φk , k ∈ N}
Examples
. Fourier basis
. Splines basis
. Wavelets basis
Madison Giacofci / Univ Rennes Donnees temporelles 25/03/19 13 / 42
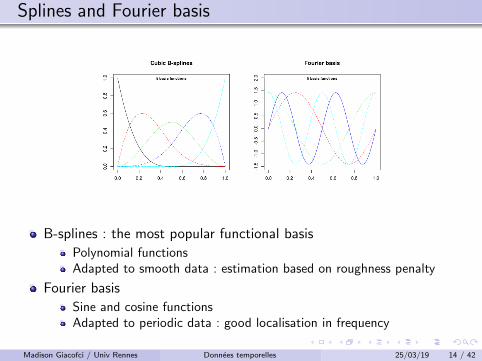
Splines and Fourier basis
B-splines : the most popular functional basis
Polynomial functionsAdapted to smooth data : estimation based on roughness penalty
Fourier basis
Sine and cosine functionsAdapted to periodic data : good localisation in frequency
Madison Giacofci / Univ Rennes Donnees temporelles 25/03/19 14 / 42

Wavelets basis
Orthonormal basis of L2(R) generated by dilatations and translations of ascaling function φ and a mother wavelet ψ such that :{
φj0k(t), k = 0, . . . , 2j0 − 1; ψjk(t), j ≥ j0, k = 0, . . . , 2j − 1}
with φjk(t) = 2j2φ(2j t − k) and ψjk(t) = 2
j2ψ(2j t − k)
Haar basis
0.0 0.2 0.4 0.6 0.8 1.0
0.6
0.8
1.0
1.2
1.4
Scaling function
0.0 0.2 0.4 0.6 0.8 1.0
−1.
0−
0.5
0.0
0.5
1.0
Mother wavelet (Enhanced)
Daubechies extremal phasewavelets (2 vanishing moments)
0.0 0.5 1.0 1.5 2.0 2.5 3.0
0.0
0.5
1.0
Scaling function
−1.0 −0.5 0.0 0.5 1.0 1.5
−1.
00.
00.
51.
01.
5
Mother wavelet (Enhanced)
Madison Giacofci / Univ Rennes Donnees temporelles 25/03/19 15 / 42

Wavelets basis
Decomposition in the basisAny function f ∈ L2(R) is then expressed in the wavelet basis :
f (t) =2j0−1∑k=0
c∗j0kφj0k(t) +∑j≥j0
2j−1∑k=0
d∗jkψjk(t)
where c∗j0k = 〈f , φj0k〉 and d∗jk = 〈f , φjk〉 are theoretical scaling andwavelets coefficients
Madison Giacofci / Univ Rennes Donnees temporelles 25/03/19 16 / 42

Advantages and drawbacks
Strength of wavelets
. Fine modelling of curves with irregularities
. Strong connexion with Besov spaces
. Localisation in time and frequency
. Decorrelating properties
. Computational efficiency
. Sparse representation of regular signals
Drawbacks
. Designed for equally spaced design
. Common time grid for all individuals
. Dyadic number of points
Madison Giacofci / Univ Rennes Donnees temporelles 25/03/19 17 / 42

Discrete Wavelet Transform (DWT)
With discretely sampled signals Y = (Y (t1), . . . ,Y (tM)), we use theDiscrete Wavelet Transform (Mallat, 1989) :
W[M×M]
Y[M×1]
=
[cd
]where W is an orthogonal matrix of filters (wavelet specific)
(c,d) are empirical wavelet coefficients such that :
c '√M × c∗
d '√M × d∗
Madison Giacofci / Univ Rennes Donnees temporelles 25/03/19 18 / 42

Wavelet representation
Functional nonparametric modelIn the coefficient domain, the model is written as
WY = Wµ + WE
⇐⇒[
cd
]=
[αβ
]+ ε
where ε ∼ N (0, σ2I)
Objective
From the linear representation in the wavelet domain, we want to find esti-mates of (α,β)
Madison Giacofci / Univ Rennes Donnees temporelles 25/03/19 19 / 42

Dealing with spatial heterogeneity
Our goal is to reconstruct spatially inhomogeneous functions
General idea : to look at the irregularities at finer scales and stay oncoarser scales for smooth parts
. Requires non-linear estimates for optimal reconstruction
Done with thresholding estimators (Donoho and Johnstone, 1994)
. Shrink, kill or keep coefficients depending on a given threshold λ toproduce sparse estimates of wavelet coefficients
Madison Giacofci / Univ Rennes Donnees temporelles 25/03/19 20 / 42

Thresholding estimators
General idea : Shrink, kill or keep coefficients depending on a giventhreshold λ
Hard thresholding (Keep or kill rule) djk1{|djk |<λ}Soft thresholding (Shrink or kill rule) sign(djk)(|djk | − λ)+
Universal threshold : λ = σ√
2 logM
Robust estimate of σ based on the MAD of the coefficients at thefinest resolution
These estimators achieve a near-minimax rate of convergence(minimax within a logarithmic factor)
Many existing variants depending on the characteristics of data
Madison Giacofci / Univ Rennes Donnees temporelles 25/03/19 21 / 42
Summary
1 Introduction : functional data
2 Nonparametric functional regression
3 Modelling individual variabilityFunctional Mixed-Effects modelEstimation issueModel-based clusteringDeformation models
4 Conclusion and Persectives
Madison Giacofci / Univ Rennes Donnees temporelles 25/03/19 22 / 42

Multisample data
We now consider individual replicates, i.e. we observe n individual curves
Basic nonparametric model
Poor modelling for multisample data that can present strongindividual heterogeneity
CGH data
−1.
0−
0.5
0.0
0.5
1.0
1.5
genome position
CG
H p
rofil
e
Mass Spectrometry data
010
2030
40
m/z ratio
Inte
nsity
Madison Giacofci / Univ Rennes Donnees temporelles 25/03/19 23 / 42

Functional mixed effect model
More appropriate framework : Mixed-effects models
Modelling individuals variations around a main pattern by addingindividual functional random effects
Yi (tm) = µ(tm) + Ui (tm) + Ei (tm)
where Ui ∼ N (0,K (s, t)) is a centered Gaussian process independant of Ei .
Wavelet representation of the model[cidi
]=
[αβ
]+
[ν i
θi
]+ εi
where εi ∼ N (0, σ2ε I) and (ν i ,θi ) ∼ N (0,Γ)
. Resumes to a linear mixed effects model on wavelet coefficients
Madison Giacofci / Univ Rennes Donnees temporelles 25/03/19 24 / 42
Modelling the covariance of the random effects
A wide litterature on functional mixed effects models
Common essential point : modelling the matrix Γ
We want to specify the covariance of the process Ui (t) to :
. have a model with a ”simple” structure
. make fixed and random effects lie in the same functional space(Antoniadis and Sapatinas, 2007)
Modelling choice justified by real data applications
Natural idea : To propose a model for K (s, t) and infer conditions onmatrix Γ. This leads in general to difficulties :
. to control the total number of parameters
. to control trajectories regularity
Madison Giacofci / Univ Rennes Donnees temporelles 25/03/19 25 / 42
Assumptions on matrix Γ
We prefer to specify Γ in the wavelet domain
First assumption Γ is assumed to be diagonal
. justified by the decorrelating property of wavelets (see Johnstone andSilverman, 1997 for discussion)
Second assumption Diagonal terms of Γ decrease exponentially with thescale j
[Γθ]jk = 2−jηγ2
. Ensure that both fixed and random effects lie in the same functionalspace (see theorem of Abramovich et al, 1998)
Note that γ2 may depend on the level of decomposition and location (j , k) as γ2jk
Madison Giacofci / Univ Rennes Donnees temporelles 25/03/19 26 / 42
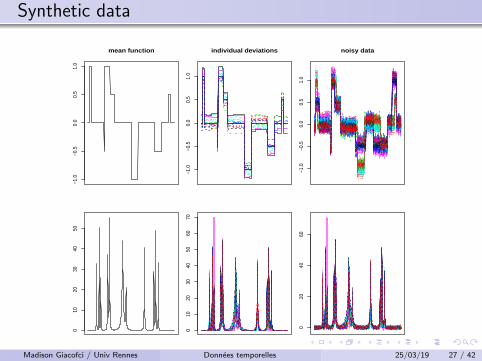
Synthetic data
−1.0
−0.5
0.0
0.5
1.0
mean function
−1.0
−0.5
0.0
0.5
1.0
individual deviations
−1.0
−0.5
0.0
0.5
1.0
noisy data
010
2030
4050
010
2030
4050
6070
020
4060
Madison Giacofci / Univ Rennes Donnees temporelles 25/03/19 27 / 42

Fixed effect estimation - Marginal approach
Model reinterpretation[cidi
]=
[αβ
]+ εi εi ,jk ∼ N (0, γ2
jk2−jη + σ2ε )
individual variability + noise
. Nonparametric regression problem in a heteroscedastic framework withreplicates
Extension of the universal threshold to an heteroscedastic settingλ = σjk
√2 logM (position dependant threshold)
Estimates of parameters σjk are given by empirical estimates thanksto the N individual replicates
The heteroscedastic thresholding enjoys a near-optimal convergencerate in the multisample setting, i .e. optimal within a logarithmicfactor in signal size M (G., Lambert-Lacroix, Picard, 2017)
Madison Giacofci / Univ Rennes Donnees temporelles 25/03/19 28 / 42

Simulation results
N = 100, M = 512
Control of the level of noise and individual deviations
Competed procedures
Usual homoscedastic thresholding with the universal threshold [Ho]Heteroscedastic thresholding with the universal threshold [He]
Reconstruction error criteria : Mean Integrated Square Error (MISE)
Results on 200 repetitions : homoscedastic case
SNR = 1 SNR= 5Ho He Ho He
Blocks 0.189 0.168 1.44e-3 1.43e-3(0.016) (0.017) (2.5e-4) (2.5e-4)
Bumps 0.736 0.726 0.045 0.040(0.024) (0.024) (1.25e-3) (1.25e-3)
Heavisine 1.203 1.204 0.079 0.078(×10−2) (0.097) (0.104) (0.006) (0.006)
Doppler 5.658 5.622 0.201 0.188(×10−4) (0.246) (0.274) (0.011) (0.011)
Madison Giacofci / Univ Rennes Donnees temporelles 25/03/19 29 / 42

Results on 200 repetitions : heteroscedastic case
SNR= 5τ = 0.1 τ = 1
Ho He Ho HeBlocks 0.186 0.001 0.011 0.001
(0.054) (2e-4) (0.006) (2e-4)Bumps 0.220 0.040 0.0573 0.040
(0.029) (0.001) (0.002) (0.001)Heavisine 0.530 0.079 0.129 0.079(×10−2) (0.016) (0.006) (0.008) (0.006)Doppler 1.387 0.187 0.304 0.188(×10−4) (0.136) (0.117) (0.015) (0.010)
Madison Giacofci / Univ Rennes Donnees temporelles 25/03/19 30 / 42

Curve clustering model
Natural extension : in a clustering framework, the N individuals are spreadamong L unknown clusters such as
Yi (tm)|{ζi` = 1} = µ`(tm) + Ui (t) + Ei (tm) E (tm) ∼ N (0, σ2E )
where ζi` = 1 if individual i is in class `
Wavelet representation of the model
Given that ζi` = 1,
[ci
di
] ∣∣∣∣{ζi` = 1} =
[α`
β`
]+
[ν iθi
]+ εi ;
εi ∼ N (0, σ2I)(ν i ,θi )
T ∼ N (0,Γ)
Translate into a Gaussian Mixture Model in the wavelet domain
. Goal : To recover individual labels(ζi`)`=1,...,L
i=1,...,N
Madison Giacofci / Univ Rennes Donnees temporelles 25/03/19 31 / 42

Model inference
Maximum Likelihood estimation is performed via the EM algorithmwith the following unobserved variables
. Label variables ζ
. Random effects (ν,θ)T
Dimension reduction step based on thresholding and aggregationestimators
Model selection done via a BIC criterion
. Individual labels are then deduced by a Maximum A Posteriori (MAP)rule
Madison Giacofci / Univ Rennes Donnees temporelles 25/03/19 32 / 42
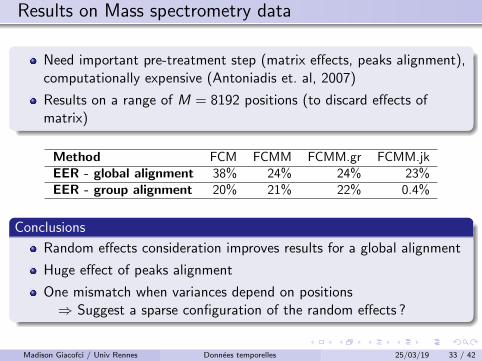
Results on Mass spectrometry data
Need important pre-treatment step (matrix effects, peaks alignment),computationally expensive (Antoniadis et. al, 2007)
Results on a range of M = 8192 positions (to discard effects ofmatrix)
Method FCM FCMM FCMM.gr FCMM.jkEER - global alignment 38% 24% 24% 23%EER - group alignment 20% 21% 22% 0.4%
Conclusions
Random effects consideration improves results for a global alignment
Huge effect of peaks alignment
One mismatch when variances depend on positions⇒ Suggest a sparse configuration of the random effects ?
Madison Giacofci / Univ Rennes Donnees temporelles 25/03/19 33 / 42

Results on CGH data
Existing approaches based on hierarchical clustering of segmentationresults (van Wieringen & van de Wiel (2008))
Inter individual variability has never been quantified on CGH data
On this dataset : existing clustering linked to survival data
Main conclusions
We find more subgroups than the original study (5 vs 3)
We retrieve the cluster associated with the best outcome (onemismatch)
Posterior estimation of SNR and τU shows high level of noise andindividual variability (≈ 10−4)⇒ Find cluster with biological signifiance will require much more
individuals
Madison Giacofci / Univ Rennes Donnees temporelles 25/03/19 34 / 42

Back on mass spectrometry data
Among the objectives : Identifying typical main profiles associated toaffected patients to enable early stage detection of a pathology.
0.0 0.2 0.4 0.6 0.8 1.0
010
2030
40
m/z ratio
Inte
nsity
0.730 0.735 0.740 0.745
02
46
8
0.92 0.93 0.94 0.95
01
23
45
6
Irregular data
Variations in amplitude
Phase variations
Error noise (electricalperturbations)
Difference in timing can have a high impact on statistical results
Alignment as pre-treatment step neglect its variability
Madison Giacofci / Univ Rennes Donnees temporelles 25/03/19 35 / 42

Modelling of phase deviations
Functional warped mixed model
Individual phase deviations modeled by adding nonlinear individualsrandom warping functions
Yi (tij) = µ (wi (tij)) + Ui (wi (tij)) + Eij , Eij ∼ N (0, σ2)
wi (.) = w(.,θi ) are parametrized by individual random variables θi
Modelling of the warping functions wi
Monotonicity constraint : the functions wi are nondecreasingdiffeomorphisms
[Gervini and Carter (2014)] Using Hermite splines that offer a directlink between knots and features
[Bigot (2013)] Using Ordinary Differential Equation based on areference function parametrized by cubic B-splines
Madison Giacofci / Univ Rennes Donnees temporelles 25/03/19 36 / 42

Inference in shape invariant functional mixed models
The model fits in the Non Linear Mixed Effects Models (NLMEM)setting (Lindstrom & Bates (1990))
Nonobserved random effects (amplitude and phase deviationsparameters) considered as hidden data
We use EM algorithm for Maximum Likelihood estimation of theparameters
Computation of the E-step. Untractable because of the nonlinearity of warping functions
Several existing approaches to either
approximate the likelihood function (Lindstrom & Bates (1990))stochastically approximate the expectations of interest (Kuhn &Lavielle (2005))
We first focus on MCEM algorithm based on Monte-Carloapproximations of the desired expectations
Madison Giacofci / Univ Rennes Donnees temporelles 25/03/19 37 / 42
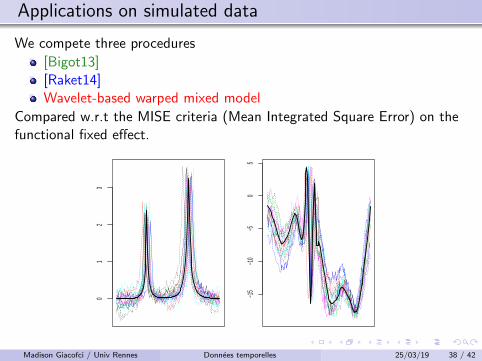
Applications on simulated data
We compete three procedures
[Bigot13][Raket14]Wavelet-based warped mixed model
Compared w.r.t the MISE criteria (Mean Integrated Square Error) on thefunctional fixed effect.
01
23
−15
−10
−50
5
Madison Giacofci / Univ Rennes Donnees temporelles 25/03/19 38 / 42

MISEs results - High deviations in phase and amplitude
●
●
●
●●●
●
●
●
●●
●
●
●
●●
●
●
●
●
●
●
●
●
●
mu.EM mu.LLR mu.JB
0.00
0.04
0.08
0.12
●
●
●
●
●
●
●
●●
●
mu.EM mu.LLR mu.JB
02
46
8
0.0 0.2 0.4 0.6 0.8 1.0
0.0
0.5
1.0
1.5
2.0
2.5
3.0
3.5
0.0 0.2 0.4 0.6 0.8 1.0
−15
−10
−5
05
Madison Giacofci / Univ Rennes Donnees temporelles 25/03/19 39 / 42

Summary
1 Introduction : functional data
2 Nonparametric functional regression
3 Modelling individual variabilityFunctional Mixed-Effects modelEstimation issueModel-based clusteringDeformation models
4 Conclusion and Persectives
Madison Giacofci / Univ Rennes Donnees temporelles 25/03/19 40 / 42

Conclusions
Conclusions
Flexible functional modelling for irregular curves with diverse sourcesof variability
Related to standard models in the coefficient domain
Remaining questions
Supervised learning (PhD Marie Morvan in co-supervision)
Sparse estimation of functional random effects
Clustering in deformation models
Madison Giacofci / Univ Rennes Donnees temporelles 25/03/19 41 / 42

References
Antoniadis, A. and Sapatinas, T. (2007), Estimation and inference in functionalmixed-effects models. CSDA, 51 (10), p4793-4813.
Donoho, D.L. and Johnstone, I.M. (1994), Ideal spatial adaptation by waveletshrinkage. Biometrika, 81 (3), p425-455.
Hardle, W. and Kerkyacharian, G. and Picard, D. and Tsybakov, A. (1998),Wavelets, Approximation and Statistical Applications. Springer.
Morris, J.S. and Carroll, R.J. (2006), Wavelet-based functional mixed models.JRSSB, 68 ; 179-199.
Giacofci, M., Lambert-Lacroix, S., Marot, G., Picard, F. (2013) Wavelet-basedclustering for mixed-effects functional models in high dimension. Biometrics, 69(1) ;31-40.
Giacofci, M., Lambert-Lacroix, S., Picard, F. (2017) Minimax wavelet estimation inheteroscedastic nonparametric regression with repetitions. Journal ofNonparametric Statistics, 30(1) ; 238-261.
Madison Giacofci / Univ Rennes Donnees temporelles 25/03/19 42 / 42