maejo int. j. sci. technol. 2014 8(03), 334-347 maejo international journal of science ... · ·...
TRANSCRIPT
Maejo Int. J. Sci. Technol. 2014, 8(03), 334-347
Maejo International Journal of Science and Technology
ISSN 1905-7873
Available online at www.mijst.mju.ac.th Full Paper
Conceptual design of heterogeneous azeotropic distillation process for ethanol dehydration using 1-butanol as entrainer
Paritta Prayoonyong Department of Chemical Engineering, Faculty of Engineering, Mahidol University, 25/25 Puttamonthon 4 Road, Puttamonthon, Nakornpathom 73170, Thailand E-mail: [email protected]
Received: 2 May 2013 / Accepted: 15 December 2014 / Published: 24 December 2014
Abstract: The synthesis of a heterogeneous azeotropic distillation process for ethanol dehydration using 1-butanol as entrainer is presented. The residue curve map of the ethanol/water/1-butanol mixture is computationally generated using non-random two-liquid thermodynamic model. It is found that 1-butanol leads to a residue curve map topological structure different from that generated by typical entrainers used in ethanol dehydration. Synthesised by residue curve map analysis, the distillation flowsheet for ethanol dehydration by 1-butanol comprises a double-feed column integrated with an overhead decanter and a simple column. The double-feed column is used to recover water as the top product, whereas the simple column is used for recovering ethanol and 1-butanol. The separation feasibility and the economically near-optimal designs of distillation columns in the flowsheet are evaluated and identified by using the boundary value design method. The distillation flowsheet using 1-butanol is compared with the conventional process using benzene as entrainer. Based on their total annualised costs, the ethanol dehydration process using 1-butanol is less economically attractive than the process using benzene. However, 1-butanol is less toxic than benzene. Keywords: ethanol dehydration, heterogeneous azeotropic distillation, 1-butanol, entrainer
________________________________________________________________________________
INTRODUCTION
Bioethanol derived from biomass is gaining significance as a biofuel. However, the process for recovering ethanol from the fermentation product is energy-intensive. Usually, the dilute ethanol-water mixture with an ethanol concentration about 5-12 wt% [1] is firstly dehydrated by an ordinary
Maejo Int. J. Sci. Technol. 2014, 8(03), 334-347
335
distillation to a concentration close to the azeotrope. Then the ethanol mixture is further dehydrated to highly pure ethanol by a separation technique that can break the ethanol/water azeotrope. Conventional technologies, e.g. azeotropic distillation and adsorption, are continuously improved because a demand for anhydrous ethanol has been greatly increased.
The dehydration of ethanol can be accomplished in a heterogeneous azeotropic distillation process using a third component called entrainer that induces the immiscibility of two-liquid phases to facilitate the separation. The additional component alters the thermodynamic property of the original mixture. Examples of entrainers for ethanol dehydration are benzene [2, 3], cyclohexane [4], pentane [5], isooctane [6, 7] and hexane [8]. Most of the entrainers that have been explored were selected such that they form a binary homogeneous azeotrope with ethanol, a binary heterogeneous azeotrope with water and a ternary heterogeneous azeotrope. Thus, those entrainers have similar performance with respect to ethanol dehydration [9].
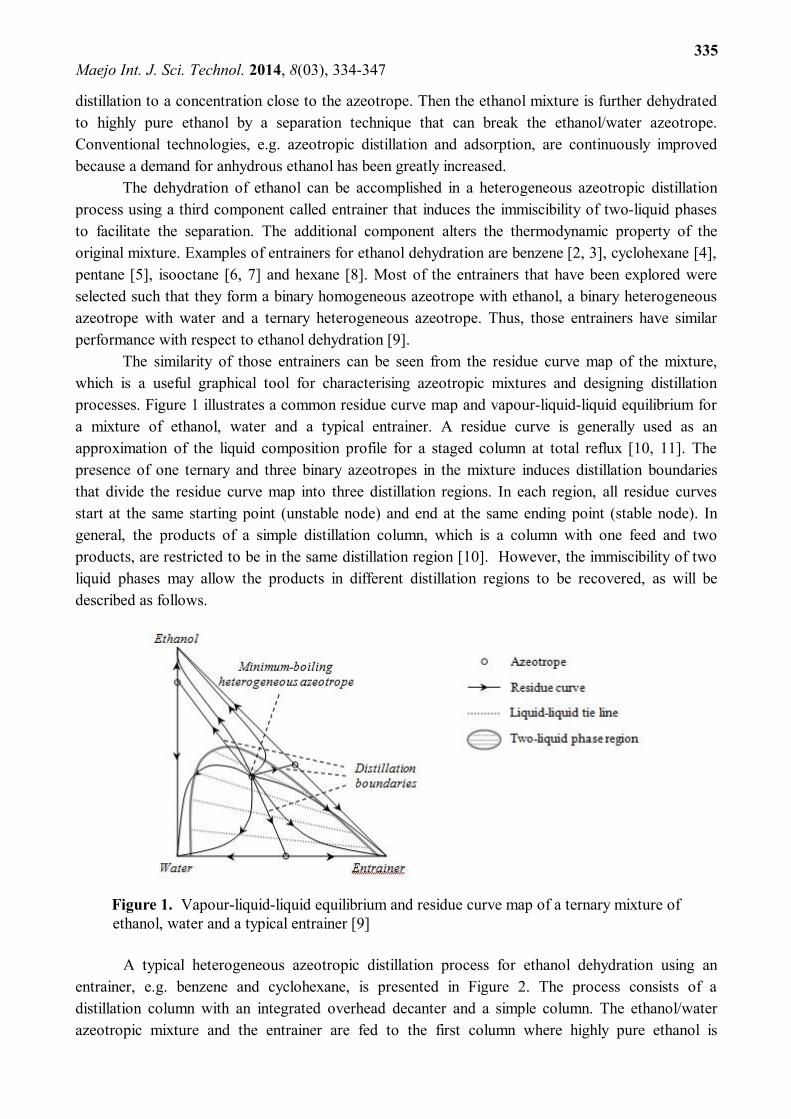
The similarity of those entrainers can be seen from the residue curve map of the mixture, which is a useful graphical tool for characterising azeotropic mixtures and designing distillation processes. Figure 1 illustrates a common residue curve map and vapour-liquid-liquid equilibrium for a mixture of ethanol, water and a typical entrainer. A residue curve is generally used as an approximation of the liquid composition profile for a staged column at total reflux [10, 11]. The presence of one ternary and three binary azeotropes in the mixture induces distillation boundaries that divide the residue curve map into three distillation regions. In each region, all residue curves start at the same starting point (unstable node) and end at the same ending point (stable node). In general, the products of a simple distillation column, which is a column with one feed and two products, are restricted to be in the same distillation region [10]. However, the immiscibility of two liquid phases may allow the products in different distillation regions to be recovered, as will be described as follows.
Figure 1. Vapour-liquid-liquid equilibrium and residue curve map of a ternary mixture of ethanol, water and a typical entrainer [9]
A typical heterogeneous azeotropic distillation process for ethanol dehydration using an
entrainer, e.g. benzene and cyclohexane, is presented in Figure 2. The process consists of a distillation column with an integrated overhead decanter and a simple column. The ethanol/water azeotropic mixture and the entrainer are fed to the first column where highly pure ethanol is
Maejo Int. J. Sci. Technol. 2014, 8(03), 334-347
336
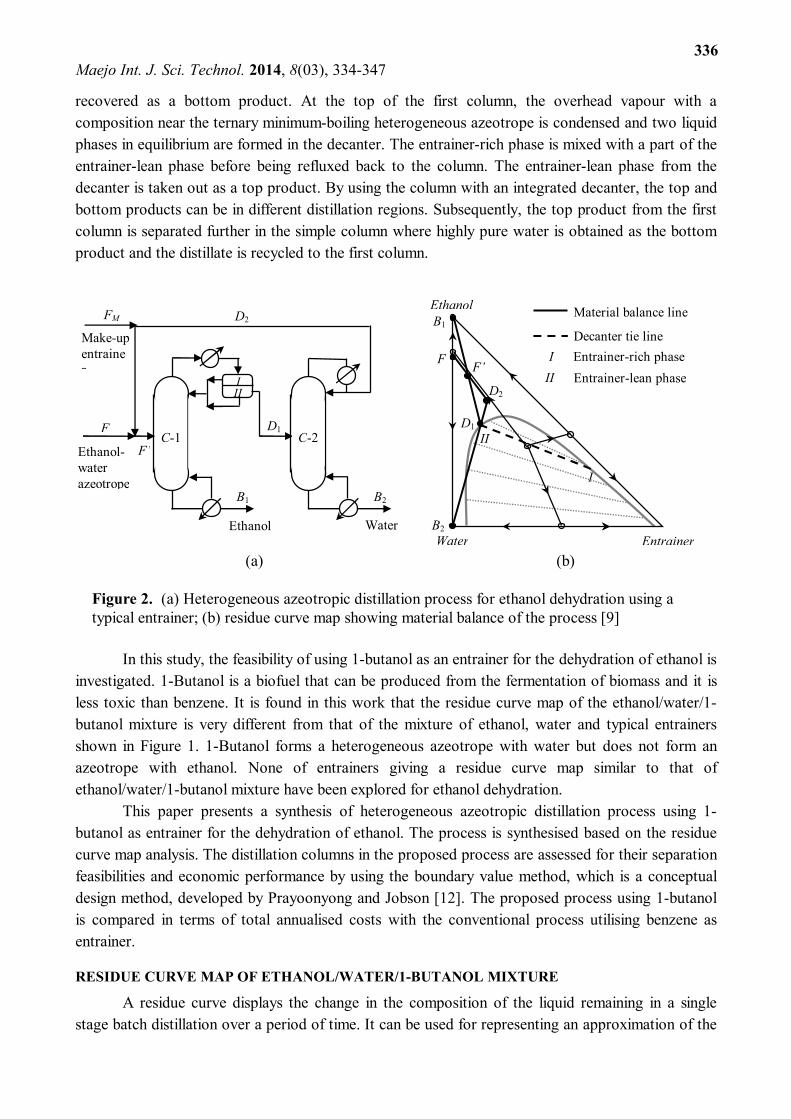
recovered as a bottom product. At the top of the first column, the overhead vapour with a composition near the ternary minimum-boiling heterogeneous azeotrope is condensed and two liquid phases in equilibrium are formed in the decanter. The entrainer-rich phase is mixed with a part of the entrainer-lean phase before being refluxed back to the column. The entrainer-lean phase from the decanter is taken out as a top product. By using the column with an integrated decanter, the top and bottom products can be in different distillation regions. Subsequently, the top product from the first column is separated further in the simple column where highly pure water is obtained as the bottom product and the distillate is recycled to the first column.
(a) (b)
Figure 2. (a) Heterogeneous azeotropic distillation process for ethanol dehydration using a typical entrainer; (b) residue curve map showing material balance of the process [9]
In this study, the feasibility of using 1-butanol as an entrainer for the dehydration of ethanol is investigated. 1-Butanol is a biofuel that can be produced from the fermentation of biomass and it is less toxic than benzene. It is found in this work that the residue curve map of the ethanol/water/1-butanol mixture is very different from that of the mixture of ethanol, water and typical entrainers shown in Figure 1. 1-Butanol forms a heterogeneous azeotrope with water but does not form an azeotrope with ethanol. None of entrainers giving a residue curve map similar to that of ethanol/water/1-butanol mixture have been explored for ethanol dehydration.
This paper presents a synthesis of heterogeneous azeotropic distillation process using 1-butanol as entrainer for the dehydration of ethanol. The process is synthesised based on the residue curve map analysis. The distillation columns in the proposed process are assessed for their separation feasibilities and economic performance by using the boundary value method, which is a conceptual design method, developed by Prayoonyong and Jobson [12]. The proposed process using 1-butanol is compared in terms of total annualised costs with the conventional process utilising benzene as entrainer.
RESIDUE CURVE MAP OF ETHANOL/WATER/1-BUTANOL MIXTURE A residue curve displays the change in the composition of the liquid remaining in a single
stage batch distillation over a period of time. It can be used for representing an approximation of the
Material balance line
Decanter tie line
D1
F
F’
B1
B2
D2
Water
Make-up entrainer
Ethanol-water azeotrope
Ethanol
I II
C-1 C-2
FM
I
II
Entrainer
Ethanol
Water
F F’
B1
B2
D1
D2
Entrainer-rich phase Entrainer-lean phase
I II
Maejo Int. J. Sci. Technol. 2014, 8(03), 334-347
337
liquid composition profile of a staged column operating at total reflux. A residue curve can be calculated from the following differential equation [13]:
iii yx
ddx
(1)
where xi is the mole fraction of component i in the liquid, yi is the mole fraction of component i in the vapour that is in equilibrium with the liquid, and is dimensionless time.
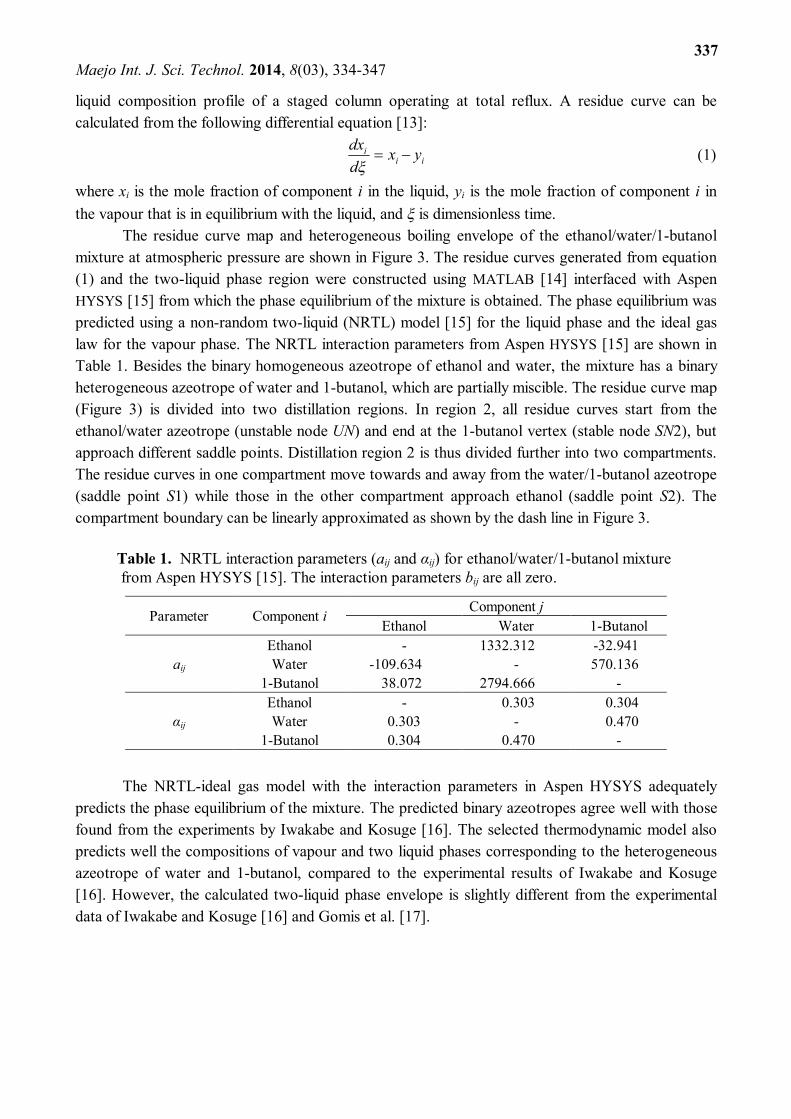
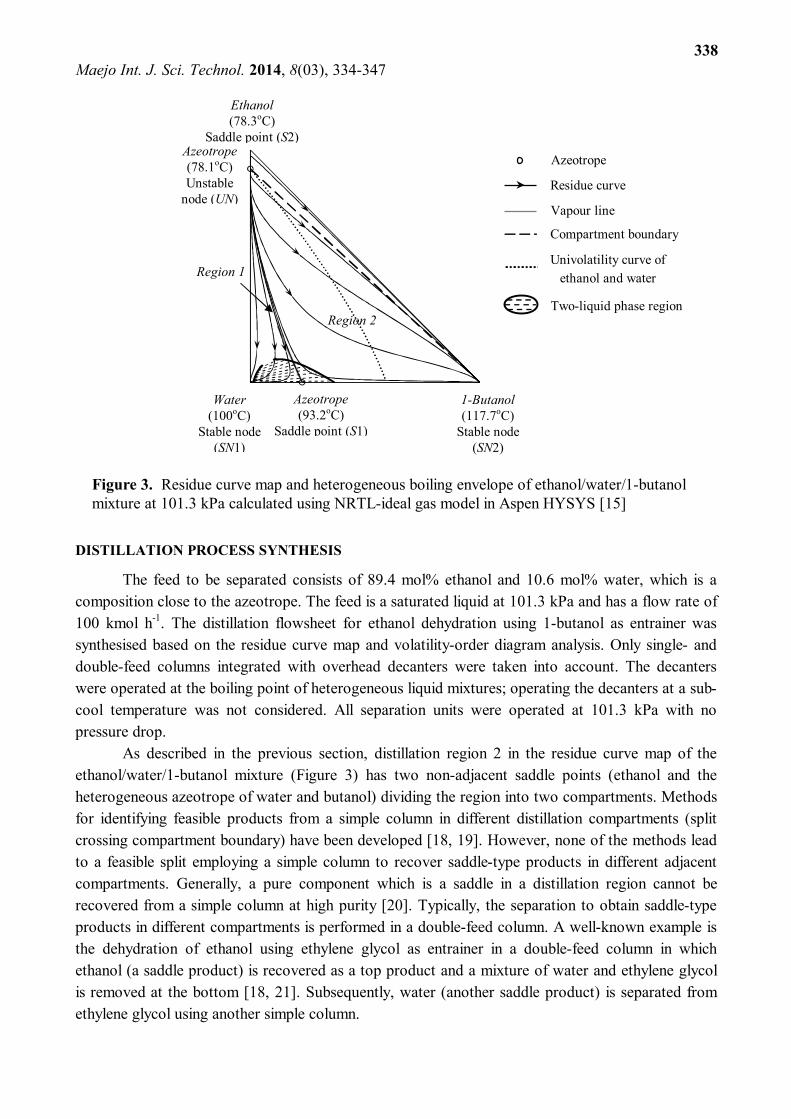
The residue curve map and heterogeneous boiling envelope of the ethanol/water/1-butanol mixture at atmospheric pressure are shown in Figure 3. The residue curves generated from equation (1) and the two-liquid phase region were constructed using MATLAB [14] interfaced with Aspen HYSYS [15] from which the phase equilibrium of the mixture is obtained. The phase equilibrium was predicted using a non-random two-liquid (NRTL) model [15] for the liquid phase and the ideal gas law for the vapour phase. The NRTL interaction parameters from Aspen HYSYS [15] are shown in Table 1. Besides the binary homogeneous azeotrope of ethanol and water, the mixture has a binary heterogeneous azeotrope of water and 1-butanol, which are partially miscible. The residue curve map (Figure 3) is divided into two distillation regions. In region 2, all residue curves start from the ethanol/water azeotrope (unstable node UN) and end at the 1-butanol vertex (stable node SN2), but approach different saddle points. Distillation region 2 is thus divided further into two compartments. The residue curves in one compartment move towards and away from the water/1-butanol azeotrope (saddle point S1) while those in the other compartment approach ethanol (saddle point S2). The compartment boundary can be linearly approximated as shown by the dash line in Figure 3.
Table 1. NRTL interaction parameters (aij and αij) for ethanol/water/1-butanol mixture from Aspen HYSYS [15]. The interaction parameters bij are all zero.
Parameter Component i Component j Ethanol Water 1-Butanol
aij Ethanol - 1332.312 -32.941 Water -109.634 - 570.136
1-Butanol 38.072 2794.666 -
αij Ethanol - 0.303 0.304 Water 0.303 - 0.470
1-Butanol 0.304 0.470 -
The NRTL-ideal gas model with the interaction parameters in Aspen HYSYS adequately predicts the phase equilibrium of the mixture. The predicted binary azeotropes agree well with those found from the experiments by Iwakabe and Kosuge [16]. The selected thermodynamic model also predicts well the compositions of vapour and two liquid phases corresponding to the heterogeneous azeotrope of water and 1-butanol, compared to the experimental results of Iwakabe and Kosuge [16]. However, the calculated two-liquid phase envelope is slightly different from the experimental data of Iwakabe and Kosuge [16] and Gomis et al. [17].
Maejo Int. J. Sci. Technol. 2014, 8(03), 334-347
338
Figure 3. Residue curve map and heterogeneous boiling envelope of ethanol/water/1-butanol mixture at 101.3 kPa calculated using NRTL-ideal gas model in Aspen HYSYS [15]
DISTILLATION PROCESS SYNTHESIS
The feed to be separated consists of 89.4 mol% ethanol and 10.6 mol% water, which is a composition close to the azeotrope. The feed is a saturated liquid at 101.3 kPa and has a flow rate of 100 kmol h-1. The distillation flowsheet for ethanol dehydration using 1-butanol as entrainer was synthesised based on the residue curve map and volatility-order diagram analysis. Only single- and double-feed columns integrated with overhead decanters were taken into account. The decanters were operated at the boiling point of heterogeneous liquid mixtures; operating the decanters at a sub-cool temperature was not considered. All separation units were operated at 101.3 kPa with no pressure drop.
As described in the previous section, distillation region 2 in the residue curve map of the ethanol/water/1-butanol mixture (Figure 3) has two non-adjacent saddle points (ethanol and the heterogeneous azeotrope of water and butanol) dividing the region into two compartments. Methods for identifying feasible products from a simple column in different distillation compartments (split crossing compartment boundary) have been developed [18, 19]. However, none of the methods lead to a feasible split employing a simple column to recover saddle-type products in different adjacent compartments. Generally, a pure component which is a saddle in a distillation region cannot be recovered from a simple column at high purity [20]. Typically, the separation to obtain saddle-type products in different compartments is performed in a double-feed column. A well-known example is the dehydration of ethanol using ethylene glycol as entrainer in a double-feed column in which ethanol (a saddle product) is recovered as a top product and a mixture of water and ethylene glycol is removed at the bottom [18, 21]. Subsequently, water (another saddle product) is separated from ethylene glycol using another simple column.
Two-liquid phase region
Azeotrope
Residue curve
Vapour line
Compartment boundary
Univolatility curve of ethanol and water
Azeotrope (78.1oC) Unstable
node (UN)
Region 1
Region 2
Ethanol (78.3oC)
Saddle point (S2)
Water (100oC)
Stable node (SN1)
Azeotrope (93.2oC)
Saddle point (S1)
1-Butanol (117.7oC)
Stable node (SN2)
Maejo Int. J. Sci. Technol. 2014, 8(03), 334-347
339
The residue curve map of ethanol/water/1-butanol mixture can be classified as Serafimov’s class 2.0-2b [22]. For such topological structure of residue curve map, Moussa and Jiménez [21] proposed a heterogeneous extractive distillation flowsheet to recover two non-adjacent saddles as products. Their flowsheet involved using a double-feed column integrated with an overhead decanter to firstly recover one of the saddle products and using a simple column to recover another one. Moussa and Jiménez [21] assumed that the entrainer and the saddle component consist of similar chemical compounds with high affinity to each other. Thus, the heterogeneous azeotrope is firstly recovered from the double-feed column at the top as the entrainer and the saddle component flow together to the bottom of the double-feed column.
Either the saddle heterogeneous azeotrope or the saddle component to be recovered as the top product of the double-feed column can be evaluated from a univolatility curve, which is the curve showing the locus of points where the relative volatility of one component to that of the other equals unity [22]. The univolatility curve divides the residue curve map or distillation region into two regions. In one region, one component is more volatile than the other, whereas it is less volatile in the other region. For a homogeneous extractive distillation, the heavy entrainer will be a stable node in the residue curve map, whereas the two azeotropic components are saddle points. A univolatility curve of the azeotropic constituents can be generated starting from the azeotrope and ending on one of the other two edges of the residue curve map. Laroche et al. [23] found that the saddle component to be recovered as the top product of the double-feed column must lie on the edge that is intersected by the univolatility curve. This is deduced from the fact that this saddle component must be more volatile than the other saddle components in the middle and stripping sections, whereas it becomes less volatile at least at the top of the rectifying section. The intersection of the univolatility curve and an edge of the residue curve map indicates that the volatility order of the saddle components (two azeotropic components) changes along that edge, whereas there is no change in volatility order along the other edge. The method of Laroche et al. [23] is also valid for the case of heterogeneous extractive batch distillation [24].
For the ethanol/water/1-butanol mixture, the univolatility curve of ethanol and water is shown in Figure 3. The curve starts from the minimum-boiling azeotrope and reaches the edge of water-butanol, illustrating that ethanol is more volatile than water in the region below the univolatility curve and the volatility order is reversed in the region above the curve, whereas 1-butanol is always less volatile than ethanol and water in distillation region 2. Following the method of Laroche et al. [23], the heterogeneous azeotrope of water and 1-butanol (saddle point S1) is recovered as the top product of the double-feed column while ethanol (saddle point S2) is taken down the column by 1-butanol. Since the azeotrope of water and butanol is a heterogeneous one, the condenser at the top of the column allows the two liquid phases to be formed. Thus, a decanter equipped at the top of the double-feed column may be applied such that an aqueous phase can be recovered as a product and an organic-rich phase is refluxed back to the column.
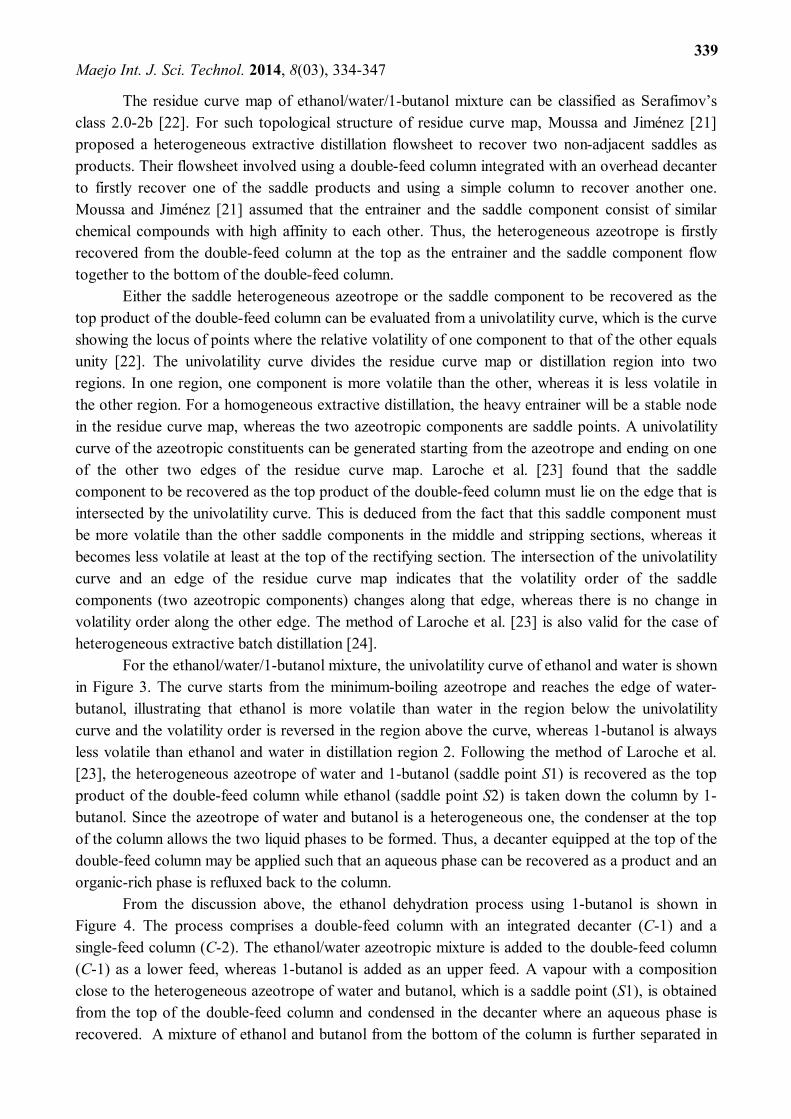
From the discussion above, the ethanol dehydration process using 1-butanol is shown in Figure 4. The process comprises a double-feed column with an integrated decanter (C-1) and a single-feed column (C-2). The ethanol/water azeotropic mixture is added to the double-feed column (C-1) as a lower feed, whereas 1-butanol is added as an upper feed. A vapour with a composition close to the heterogeneous azeotrope of water and butanol, which is a saddle point (S1), is obtained from the top of the double-feed column and condensed in the decanter where an aqueous phase is recovered. A mixture of ethanol and butanol from the bottom of the column is further separated in
Maejo Int. J. Sci. Technol. 2014, 8(03), 334-347
340
the subsequent simple column (C-2) where highly pure ethanol, which is another saddle point (S2), is produced. Nearly pure 1-butanol from the simple column is recycled to the double-feed column together with some of the aqueous phase from the decanter.
(a) (b) Figure 4. Distillation flowsheet for ethanol dehydration using 1-butanol (a) and triangular diagram showing mass balance of the process (b)
DISTILLATION PROCESS EVALUATION
The separation feasibility and economic performance of the proposed distillation process (Figure 4) were evaluated using the boundary value method developed by Prayoonyong and Jobson [12]. The boundary value method is a column design method for establishing separation feasibility and designing columns for separating ternary ideal and azeotropic mixtures [13]. The method requires the column product composition to be fully specified. Then the liquid composition profiles for each column section are calculated using the material and energy balance over each column section, along with the phase equilibrium at a given reflux (or reboil) ratio. A given set of column specifications is identified as feasible if the intersection of the composition profiles of each column section is found. The number of theoretical stages can then be counted from the composition profiles and the feed location is identified from the intersection of the two profiles. By applying the boundary value design method, a feasible and economically near-optimal column design can be identified systematically. The results from the design method also make possible a comparison of column designs and of distillation processes in terms of an indicator, e.g. total annualised cost. A recent development of the design method allows its application to single- and double-feed columns with integrated decanters in which the presence of two liquid phases is not limited to the decanter [12].
A process simulation software was not applied for evaluating the processes because the simulation of a heterogeneous azeotropic distillation column requires an iterative and exhaustive change in the column design parameters until a converging and/or optimal solution is found [25]. Furthermore, a multiplicity of solutions is commonly encountered in the simulation of heterogeneous azeotropic distillation columns [25, 26].
Material balance line
Decanter tie line FL
FU
B1 B2
D2
Ethanol (S2)
Water (SN1)
1-Butanol (SN2)
FM D1
Azeotrope (S1)
Azeotrope (UN)
FL
B2
B1
D1
D2
Water
Make-up butanol
Ethanol-water azeotrope
Ethanol I II
C-1 C-2
1-Butanol
FU
FM
D1R
Maejo Int. J. Sci. Technol. 2014, 8(03), 334-347
341
Before designing the columns in the process (Figure 4) by the boundary value method, the material balance of the process must be completed. In this step, the mole fractions of some components in the product streams of both columns were specified. Then the material balance of the process was solved using Excel to determine the compositions and flow rates of all streams in the process.
Once the material balance of the process is completed, each column in the process can then be designed individually using the boundary value method. The calculation required in applying the boundary value method was performed using MATLAB interfaced with Aspen HYSYS for enthalpy calculation and for retrieving the phase equilibrium properties of the mixture [27]. To design a column, the liquid composition profiles for each column section were calculated stage by stage starting from the specified product compositions using material and energy balances along with phase equilibrium. The composition profiles were generated for a range of key design variables, e.g. reflux ratio, reboil ratio and feed condition. The choice of design variables depends on the type of column. For a column with an overhead integrated decanter, the ratio of the molar flow rate of heavy liquid to that of total liquid in the reflux stream, called reflux phase split ratio, is also a degree of freedom. For the double-feed column, the upper-to-lower feed rate ratio and the location of the lower feed are additional design variables. The proposed separation is feasible if a rectifying profile intersects a stripping profile (for the single-feed column) or a middle section profile (for the double-feed column) in the composition space.
When a feasible column design was found from an intersection of the profiles, its column design parameters at a set of design variables, e.g. number of stages, feed location and heat duties, were obtained. The column designs were searched from a range of key design variables and a number of feasible designs for each column were generated. Those feasible designs were evaluated on the basis of their total annualised costs estimated from their column design parameters. As a result, the most attractive design with the lowest cost was identified. However, the most attractive design found from the boundary value method is the design with economically near-optimal performance because the feasible designs are generated iteratively from a range of design variables.
After the near-optimal designs for all columns have been identified, the total annualised cost of the distillation process can be estimated. The total annualised cost is the sum of operating and annualised capital costs. The capital cost includes the installed costs of the main equipment, i.e. columns, decanters and heat exchangers. They are estimated using cost models [28, 29] based on the sizes of column and decanter vessel, heat transfer area, and materials. The capital cost is annualised over a three-year period with an interest rate of 5%. The operating cost includes the costs of steam and cooling water estimated using cost models [30, 31].
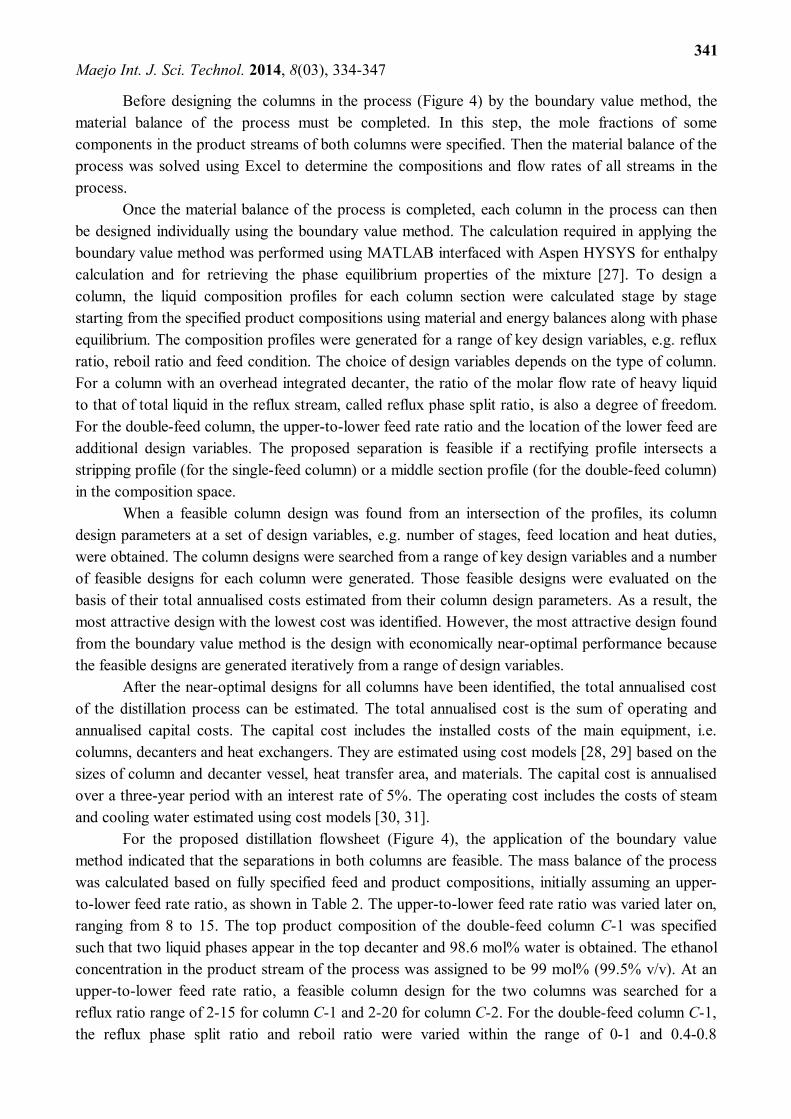
For the proposed distillation flowsheet (Figure 4), the application of the boundary value method indicated that the separations in both columns are feasible. The mass balance of the process was calculated based on fully specified feed and product compositions, initially assuming an upper-to-lower feed rate ratio, as shown in Table 2. The upper-to-lower feed rate ratio was varied later on, ranging from 8 to 15. The top product composition of the double-feed column C-1 was specified such that two liquid phases appear in the top decanter and 98.6 mol% water is obtained. The ethanol concentration in the product stream of the process was assigned to be 99 mol% (99.5% v/v). At an upper-to-lower feed rate ratio, a feasible column design for the two columns was searched for a reflux ratio range of 2-15 for column C-1 and 2-20 for column C-2. For the double-feed column C-1, the reflux phase split ratio and reboil ratio were varied within the range of 0-1 and 0.4-0.8

Maejo Int. J. Sci. Technol. 2014, 8(03), 334-347
342
respectively. The location of the lower feed was also changed. Note that some of the aqueous phase from the integrated decanter has to be recycled to mix with 1-butanol from the recovery column and the make-up stream so as to make the separation in the double-feed column feasible. The temperature of the upper feed was determined from the energy balance of the column and only designs that need the upper feed temperature ranging between 35-180o C were accepted.
Table 2. Mass balance of distillation process for ethanol dehydration using 1-butanol in Figure 4 (upper-to-lower feed rate ratio = 8)
FL FM FU D1 D1
R B1 D2 B2
Composition (mole fraction) Ethanol Water 1-Butanol Flow rate (kmol h-1)
0.8940a
0.1060a
0.0000 100.00a
0.0000 0.0000 1.0000a
0.15
0.0001 0.0121 0.9878 800.00
0.0010a 0.9860 0.0130a
9.86
0.0010 0.9860 0.0130 9.78
0.1016 0.0010a 0.8974
880.36
0.99000a 0.00975 0.00025a
90.29
0.0001a 0.0000 0.9999
790.07
Feed condition Saturated liquid
Saturated liquid
a Specified value
All feasible designs of each column in Figure 4 were evaluated in terms of total annualised
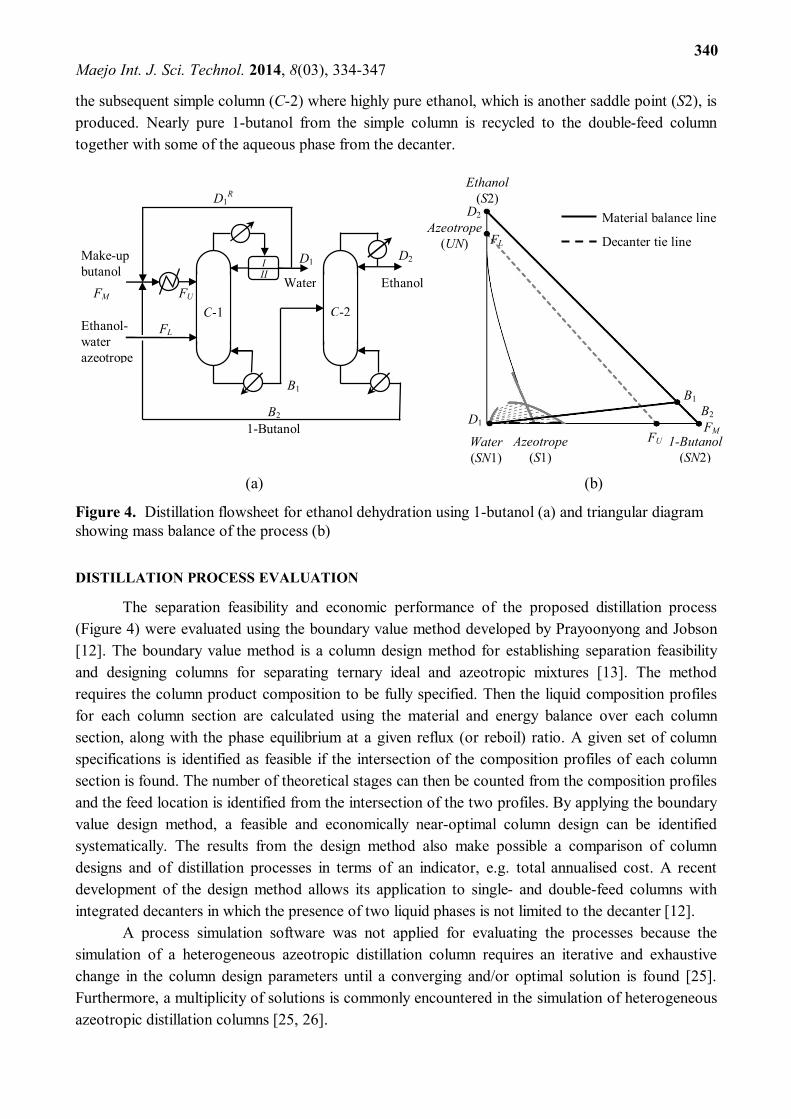
costs and the economically near-optimal design was identified. The details of the near-optimal design of the two columns and the total annualised cost of the distillation process are summarised in Table 3. The corresponding composition profiles of the columns are shown in Figure 5. The near-optimal designs were found at the upper-to-lower feed rate ratio of 8. With an upper-to-lower feed rate ratio less than 8, the separation in the double-feed column is infeasible.
Table 3. Summary of near-optimal designs and total annualised costs of columns in ethanol dehydration process using 1-butanol (Figure 4)
C-1 C-2 Upper-to-lower feed ratio 8 - Reflux ratio 8 8 Reflux phase split ratio 0 - Reboil ratio 0.5 0.95 Temperature of the upper feed, oC 43.5 - Total number of stages 46.2 19.3 Number of stages in the rectifying section 2.7 10.3 Number of stages in the stripping section 16 - Number of stages in the middle section 29.5 - Condenser duty, kW 2094 8696 Reboiler duty, kW 5406 8954 Heating duty of the heat exchanger HX-1, kW 3567 - Total annualised cost, million bahts per year 61 104 Total annualised cost, million bahts per year 165
Maejo Int. J. Sci. Technol. 2014, 8(03), 334-347
343
D2
B1 B2
(a) (b)
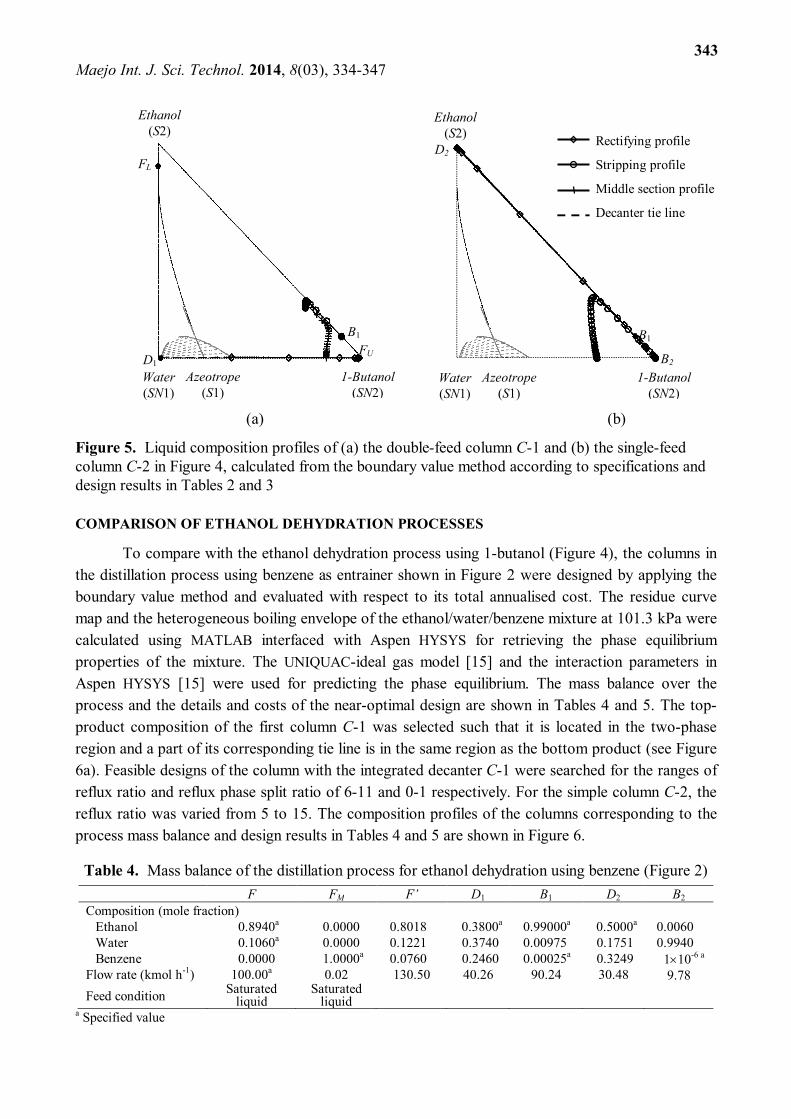
Figure 5. Liquid composition profiles of (a) the double-feed column C-1 and (b) the single-feed column C-2 in Figure 4, calculated from the boundary value method according to specifications and design results in Tables 2 and 3
COMPARISON OF ETHANOL DEHYDRATION PROCESSES
To compare with the ethanol dehydration process using 1-butanol (Figure 4), the columns in the distillation process using benzene as entrainer shown in Figure 2 were designed by applying the boundary value method and evaluated with respect to its total annualised cost. The residue curve map and the heterogeneous boiling envelope of the ethanol/water/benzene mixture at 101.3 kPa were calculated using MATLAB interfaced with Aspen HYSYS for retrieving the phase equilibrium properties of the mixture. The UNIQUAC-ideal gas model [15] and the interaction parameters in Aspen HYSYS [15] were used for predicting the phase equilibrium. The mass balance over the process and the details and costs of the near-optimal design are shown in Tables 4 and 5. The top-product composition of the first column C-1 was selected such that it is located in the two-phase region and a part of its corresponding tie line is in the same region as the bottom product (see Figure 6a). Feasible designs of the column with the integrated decanter C-1 were searched for the ranges of reflux ratio and reflux phase split ratio of 6-11 and 0-1 respectively. For the simple column C-2, the reflux ratio was varied from 5 to 15. The composition profiles of the columns corresponding to the process mass balance and design results in Tables 4 and 5 are shown in Figure 6.
Table 4. Mass balance of the distillation process for ethanol dehydration using benzene (Figure 2)
F FM F’ D1 B1 D2 B2
Composition (mole fraction) Ethanol Water Benzene Flow rate (kmol h-1)
0.8940a
0.1060a
0.0000 100.00a
0.0000 0.0000 1.0000a
0.02
0.8018 0.1221 0.0760 130.50
0.3800a 0.3740 0.2460
40.26
0.99000a 0.00975 0.00025a
90.24
0.5000a 0.1751 0.3249
30.48
0.0060 0.9940
110-6 a 9.78
Feed condition Saturated liquid
Saturated liquid
a Specified value
Rectifying profile
Stripping profile
Middle section profile
Decanter tie line
FL
B1 FU D1
Ethanol (S2)
Water (SN1)
1-Butanol (SN2)
Azeotrope (S1)
Ethanol (S2)
Water (SN1)
1-Butanol (SN2)
Azeotrope (S1)
Maejo Int. J. Sci. Technol. 2014, 8(03), 334-347
344
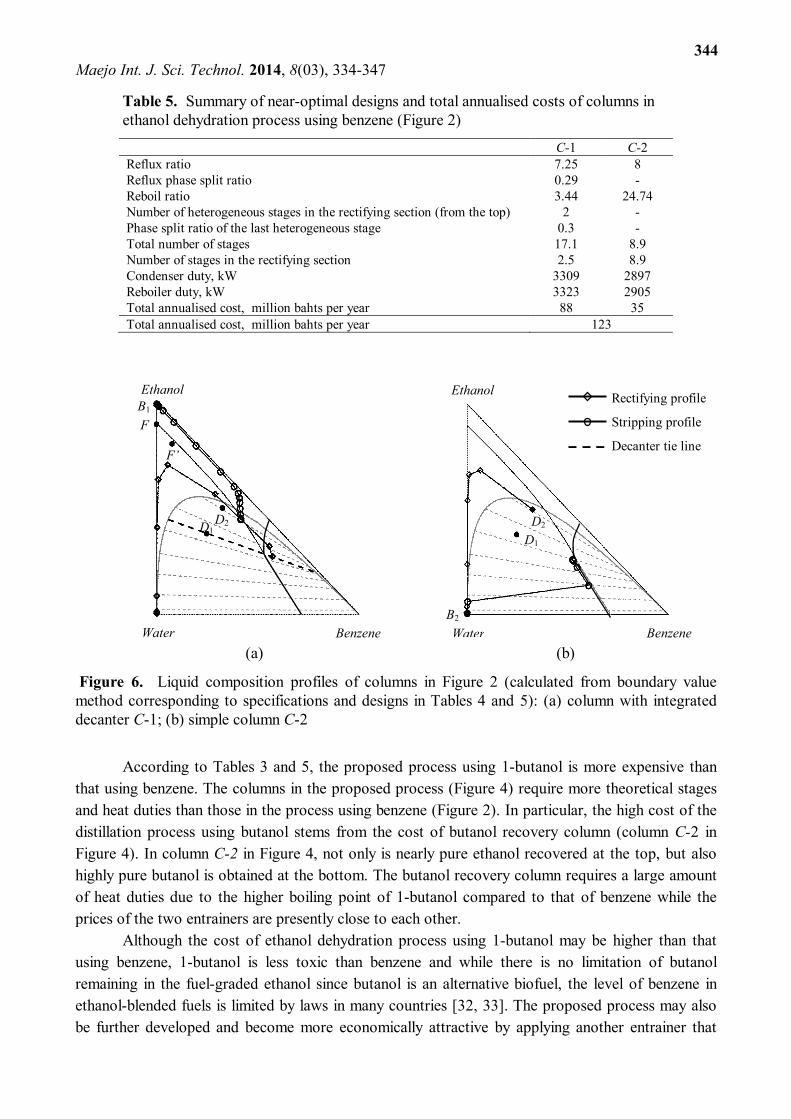
Table 5. Summary of near-optimal designs and total annualised costs of columns in ethanol dehydration process using benzene (Figure 2)
C-1 C-2 Reflux ratio 7.25 8 Reflux phase split ratio 0.29 - Reboil ratio 3.44 24.74 Number of heterogeneous stages in the rectifying section (from the top) 2 - Phase split ratio of the last heterogeneous stage 0.3 - Total number of stages 17.1 8.9 Number of stages in the rectifying section 2.5 8.9 Condenser duty, kW 3309 2897 Reboiler duty, kW 3323 2905 Total annualised cost, million bahts per year 88 35 Total annualised cost, million bahts per year 123
(a) (b)
Figure 6. Liquid composition profiles of columns in Figure 2 (calculated from boundary value method corresponding to specifications and designs in Tables 4 and 5): (a) column with integrated decanter C-1; (b) simple column C-2
According to Tables 3 and 5, the proposed process using 1-butanol is more expensive than that using benzene. The columns in the proposed process (Figure 4) require more theoretical stages and heat duties than those in the process using benzene (Figure 2). In particular, the high cost of the distillation process using butanol stems from the cost of butanol recovery column (column C-2 in Figure 4). In column C-2 in Figure 4, not only is nearly pure ethanol recovered at the top, but also highly pure butanol is obtained at the bottom. The butanol recovery column requires a large amount of heat duties due to the higher boiling point of 1-butanol compared to that of benzene while the prices of the two entrainers are presently close to each other.
Although the cost of ethanol dehydration process using 1-butanol may be higher than that using benzene, 1-butanol is less toxic than benzene and while there is no limitation of butanol remaining in the fuel-graded ethanol since butanol is an alternative biofuel, the level of benzene in ethanol-blended fuels is limited by laws in many countries [32, 33]. The proposed process may also be further developed and become more economically attractive by applying another entrainer that
B2
Ethanol
Water Benzene
D1
D2
B1
F’
Ethanol
Water Benzene
D1
Rectifying profile
Stripping profile
Decanter tie line F
D2
Maejo Int. J. Sci. Technol. 2014, 8(03), 334-347
345
leads to the same residue curve map topological structure as that for butanol but with a lower price. Also, in this study only single- and double-feed columns integrated with overhead decanters were considered in process design. By synthesising the process taking into account other design options, e.g. types of columns and splits, ethanol dehydration using butanol may turn out to be competitive with the conventional method. CONCLUSIONS
From the distillation flowsheet for ethanol dehydration generated based on residue curve map analysis and assessed using the boundary value design method, the results show that 1-butanol can be used as an entrainer for ethanol dehydration, in which a double-feed column with an integrated decanter and a simple column are used. However, although environmentally favourable, the process using 1-butanol may not be as yet economically attractive compared to that using benzene. ACKNOWLEDGEMENTS
The author gratefully acknowledges financial support from the Energy Policy and Planning Office, Ministry of Energy, Royal Thai Government. The author is grateful for the kind assistance from Assoc. Prof. Dr. Anawat Sungpet at King Mongkut’s University of Technology Thonburi, where Aspen HYSYS was available. The author also thanks Warumporn Pejpichestakul, Parichat Laothong, Nakarin Chamnanpaisont and Darika Bhatia for their assistance. REFERENCES 1. H. J. Huang, S. Ramaswamy, U. W. Tschirner and B. V. Ramarao, “A review of separation
technologies in current and future biorefineries”, Sep. Purif. Technol., 2008, 62, 1-21. 2. K. Kubierschky, “Verfahren zur Gewinnung von hochprozentigen, bezw. absoluten Alkohol-
Wassergemischen in unterbrochenem Betriebe”, German Patent, 287,897 (1915). 3. S. Young, “LXXIII. - The preparation of absolute alcohol from strong spirit”, J. Chem. Soc.
Trans., 1902, 81, 707-717. 4. I. A. Furzer, “Synthesis of entrainers in heteroazeotropic distillation systems”, Can. J. Chem.
Eng., 1994, 72, 358-364. 5. C. Black, “Distillation modeling of ethanol recovery and dehydration processes for ethanol and
gasohol”, Chem. Eng. Prog., 1980, 76, 78-85. 6. A. Font, J. C. Asensi, F. Ruiz and V. Gomis, “Application of isooctane to the dehydration of
ethanol. Design of a column sequence to obtain absolute ethanol by heterogeneous azeotropic distillation”, Ind. Eng. Chem. Res., 2003, 42, 140-144.
7. V. Gomis, R. Pedraza, O. Francés, A. Font and J. C. Asensi, “Dehydration of ethanol using azeotropic distillation with isooctane”, Ind. Eng. Chem. Res., 2007, 46, 4572-4576.
8. V. Gomis, A. Font, R. Pedraza and M. D. Saquete, “Isobaric vapor-liquid and vapor-liquid-liquid equilibrium data for the water-ethanol-hexane system”, Fluid Phase Equilibr., 2007, 259, 66-70.
9. H. N. Pham and M. F. Doherty, “Design and synthesis of heterogeneous azeotropic distillations-III. Column sequences”, Chem. Eng. Sci., 1990, 45, 1845-1854.
Maejo Int. J. Sci. Technol. 2014, 8(03), 334-347
346
10. D. B. Van Dongen and M. F. Doherty, “Design and synthesis of homogeneous azeotropic distillations. 1. Problem formulation for a single column”, Ind. Eng. Chem. Fundamen., 1985, 24, 454-463.
11. S. Widagdo and W. D. Seider, “Azeotropic Distillation”, AIChE J., 1996, 42, 96-130. 12. P. Prayoonyong and M. Jobson, “Flowsheet synthesis and complex distillation column design for
separating ternary heterogeneous azeotropic mixtures”, Chem. Eng. Res. Des., 2011, 89, 1362-1376.
13. M. F. Doherty and M. F. Malone, “Conceptual Design of Distillation Systems”, International Edn., McGraw-Hill, Singapore, 2001.
14. MATLAB Release 2011, The MathWorks, Inc., Natick (MA), USA. 15. “Aspen HYSYS Simulation Basis Guide”, Aspen Technology Inc., Burlington (MA), 2011. 16. K. Iwakabe and H. Kosuge, “Isobaric vapor-liquid-liquid equilibria with a newly developed
still”, Fluid Phase Equilibr., 2001, 192, 171-186. 17. V. Gomis, F. Ruiz and J. C. Asensi, “The application of ultrasound in the determination of
isobaric vapour-liquid-liquid equilibrium data”, Fluid Phase Equilibr., 2000, 172, 245-259. 18. D. Y. C. Thong and M. Jobson, “Multicomponent homogeneous azeotropic distillation 1.
Assessing product feasibility”, Chem. Eng. Sci., 2001, 56, 4369-4391. 19. G. Ji and G. Liu, “Study on the feasibility of split crossing distillation compartment boundary”,
Chem. Eng. Process.: Process Intensificat., 2007, 46, 52-62. 20. J. J. Siirola, “Strategic process synthesis: Advances in the hierarchical approach”, Comput.
Chem. Eng., 1996, 20, S1637-S1643. 21. A. S. Moussa and L. Jiménez, “Entrainer selection and systematic design of heterogeneous
azeotropic distillation flowsheets”, Ind. Eng. Chem. Res., 2006, 45, 4304-4315. 22. V. N. Kiva, E. K. Hilmen and S. Skogestad, “Azeotropic phase equilibrium diagrams: A
survey”, Chem. Eng. Sci., 2003, 58, 1903-1953. 23. L. Laroche, H. W. Andersen, M. Morari and N. Bekiaris, “Homogeneous azeotropic distillation:
Comparing entrainers”, Can. J. Chem. Eng., 1991, 69, 1302-1319. 24. I. R. Donis, J. A. Esquijarosa, V. Gerbaud and X. Joulia, “Heterogeneous batch-extractive
distillation of minimum boiling azeotropic mixtures”, AIChE J., 2003, 49, 3074-3083. 25. S. K. Wasylkiewicz, L. C. Kobylka and F. J. L. Castillo, “Optimal design of complex azeotropic
distillation columns”, Chem. Eng. J., 2000, 79, 219-227. 26. R. Gani and S. B. Jørgensen, “Multiplicity in numerical solution of non-linear models:
Separation processes”, Comput. Chem. Eng., 1994, 18, S55-S61. 27. P. Prayoonyong, “Synthesis and design of ternary heterogeneous azeotropic distillation
processes including advanced complex column configurations”, PhD Thesis, 2009, University of Manchester, UK.
28. A. M. Gerrard, “Guide to Capital Cost Estimating”, 4th Edn., Institution of Chemical Engineers, Rugby (UK), 2000.
29. M. S. Peters, K. D. Timmerhaus and R. E. West, “Plant Design and Economics for Chemical Engineers”, 5th Edn., McGraw-Hill, New York, 2002.
30. R. Smith, “Chemical Process Design and Integration”, John Wiley and Sons, Chichester, 2005. 31. G. D. Ulrich and P. T. Vasudevan, “How to estimate utility costs”, Chem. Eng., 2006, 113, 66-
69.
Maejo Int. J. Sci. Technol. 2014, 8(03), 334-347
347
32. Department of Environment, Australian Government, “Ethanol E85 fuel quality and fuel quality information standards”, 2012, http://www.environment.gov.au/topics/environment-protection/ fuel-quality/standards/ethanol-e85 (Accessed: October 2014).
33. Renewable Fuels Association, “Fuel ethanol: Industry guidelines, specifications and procedures”, 2011, http://www.ethanolrfa.org/pages/industry-resources-guidelines (Accessed: October 2014).
© 2014 by Maejo University, San Sai, Chiang Mai, 50290 Thailand. Reproduction is permitted for
noncommercial purposes.