magic formula investing in the benelux bachelor thesis be · pdf filemagic formula investing...
TRANSCRIPT

Magic Formula investing in the Benelux
Bachelor thesis BE
ABSTRACT
Joel Greenblatt’s Magic Formula trading strategy was able to generate market beating returns without
taking additional risk in the United States stock market during the period of 1988 until 2004, and
therefore clearly violates the Efficient Market Hypothesis. This strategy is a simple stock selection
method where Return on Invested Capital and Earnings Yield are the key metrics for determining the
best common stock investments. This paper takes this specific Magic Formula trading strategy to the
Benelux stock market and performs a backtest to see whether this strategy also shows market
outperformance in the Benelux stock market. The answer to this question is clearly a yes. The Magic
Formula trading strategy was able to realize an average 7,70% annual market premium in the Benelux
stock market without taking additional risk during 1995 until 2014. This signalizes a market anomaly
and also violates the Efficient Market Hypothesis.
Author: P.P.M. Postma
Student Nr: 817087
Supervisor: MSc. F. Horváth
Date: March 30, 2015

1
Table of Contents
Table of Contents .................................................................................................................................. 1
1: Introduction ................................................................................................................................... 2
2: Literature ....................................................................................................................................... 4
2.1 Market beating stock trading strategies ......................................................................................... 4
2.2 Efficient Market Hypothesis ......................................................................................................... 6
2.3 Value Investing.............................................................................................................................. 9
2.4 The Magic Formula ....................................................................................................................... 9
3: Data & Methodology ................................................................................................................... 12
3.1 Data ............................................................................................................................................. 12
3.2 Methodology ............................................................................................................................... 14
4: Results .......................................................................................................................................... 17
4.1 Magic Formula Trading Strategy ................................................................................................ 17
4.2 The individual investor ................................................................................................................ 21
5: Conclusion .................................................................................................................................... 22
Bibliography ........................................................................................................................................ 23
Appendix A: MF Portfolios from 1995 until 2014 ............................................................................ 25
Appendix B: Risk Free Rates and Excess Returns ........................................................................... 32
2
1: Introduction
Most investors are dreaming of a way to continuously beat the average returns of the stock
market. The Efficient Market Hypothesis (EMH) however shattered these dream by stating that
it is impossible to realize abnormal returns without taking additional risk because the stock
market is very efficient and anomalies from which investors can take advantage are therefore
eliminated. The only way investors could achieve above average returns is to take above
average risks according to the EMH.
But what if there was a so called ‘Magic Formula’ which investors could use to achieve market
beating returns in the stock market without taking additional risk? Well, there might be one.
Joel Greenblatt, an American hedge fund manager and founder of Gotham Capital, wrote about
a trading strategy based on a ‘Magic Formula’ in his New York Times bestseller ‘The little book
that beats the market’ (Greenblatt, 2006). In his book, Greenblatt states that beating the returns
of a broad stock market like the S&P 500 can be very simple when you have a trading strategy
based on his so called ‘Magic Formula’. This formula consists of a combination of return on
invested capital and earnings yield. Greenblatt described that by using this combination of
factors, each investor is able to buy above average companies (measured by the return on
invested capital ratio) for below average prices (measured by the earnings yield ratio).
Greenblatt backtested his ‘Magic Formula’ (MF) trading strategy over the period of 1988 until
2004 in the United States stock market and shows that this effective strategy indeed achieved
market beating returns. Over this particular time period, the MF trading strategy realized an
average annual return of 30,8%, while the S&P 500 index realized an average annual return of
12,4% during that same time period. That is a huge historical outperformance and Greenblatt
even states that the MF trading strategy achieved those returns while taking on lower risk than
the overall market (no matter how that risk was measured). So this strategy might signalize a
market anomaly and therefore violates the EMH. In an efficient market, such abnormal returns
could only be reached by taking huge amounts of risk. But there is some more research that
supports the assumption that there are market anomalies in the stock markets. Research by Keim
(1983) showed us that stock prices tend to have higher returns in January and that stock prices
are affected by seasonal effects. Also value investing, which is put into practice by a lot of
successful investors, is a famous anomaly in recent literature so it might be possible to
continuously achieve returns above market averages.

3
Then let us have a quick look on how Greenblatt realized such high average annual returns with
his so called MF trading strategy. He simply made two rankings of all the United States listed
stocks with a market capitalization above $50 million. One ranking is based on the companies’
return on invested capital, and the other ranking is based on their earnings yield. He then
combines these rankings into one compounded ranking so it becomes clear which companies
have the best combination of return on invested capital and earning yield. This combination of
rankings is important because in the end the MF trading strategy wants to select above average
companies but only for below average prices and this shows us that this strategy has very close
connection with value investing principles. According to Greenblatt, value investing is simply
figuring out what something is worth and paying a lot less for it.
Once this compounded ranking is made, Greenblatt buys the top 30 stocks and holds them for
a full year. Once the year has ended, he ranks all the stocks again and rebalances the portfolio
to the top 30 stocks. So each year a new portfolio of 30 stocks will be formed and held for an
entire year. With this simple MF trading strategy, your average return as an investor would be
higher than the average return of the broad S&P 500 index. The magnitude of the transaction
costs involved with this MF trading strategy is rather low according to Greenblatt as this
strategy only trades about 30 stocks once a year. With a good priced broker, the negative effect
of the transaction costs will be very small.
As it now is clear that the MF trading strategy is able to generate historical market beating
returns in the United States stock market, it becomes interesting to research whether the MF
trading strategy also works in other regions. That is why I am going to research if this particular
trading strategy shows market outperformance in the Benelux (Belgium, Netherlands and
Luxembourg) stock market. The main research question to which this paper delivers an answer
is:
Does the ‘Magic Formula’ trading strategy of Joel Greenblatt show market outperformance in
the Benelux stock market?
When the results of this research paper are showing us that that this simple but effective trading
strategy historically outperformed the broad Benelux stock market, this might signalize a
market anomaly outside the United States. Then investors can choose to put this strategy into
practice and try to reach market beating returns in this particular market as well. We can also
use the results to partly confirm or dismiss that the MF trading strategy works outside the United
States.

4
2: Literature
The MF trading strategy looks like a market anomaly as it was historically consistently able to
beat average market returns. In this literature section of the paper we take a look at other market
beating stock strategies and their close connections with the old principles of value investing.
There will be a deeper look into the mechanism of the MF trading strategy as well.
2.1 Market beating stock trading strategies
There are many different factor trading strategies which are pretty similar to the MF trading
strategy. The MF trading strategy is using return on invested capital and earnings yield as his
main factors, but there are many more possible combinations of factors. Even simple one-factor
trading strategies tend to show historical market beating returns. Work of Basu (1977) and
Reinganum (1981) reports that stock trading strategies based on price to earnings ratios or other
earnings’ yield related factors are giving excess returns on common stocks. Stocks with low
price to earnings ratios are showing market beating returns and are outperforming stocks with
high price to earnings ratio over almost every time scope. A simple quantitative factor trading
strategy of only buying stocks with low price to earnings ratios can be easily formed by using
this market anomaly. Litzenberger and Ramaswamy (1982) confirmed that common stocks with
certain factors are showing historical market outperformance. Their research is showing us that
stocks of companies which are paying high amount of dividend tend to have higher returns than
stocks of companies with low or none dividend payments. Earlier work of Charest (1978)
already signalized this anomaly by showing us that a well formed trading strategy based on the
change of dividend payments in the common stock market, could realize significant market
outperformance.
Most of these kind of quantitative factor trading strategies are backtested within the United
States stock market. James Patrick O'Shaughnessy, an American investor and founder of
O’Shaughnessy Asset Management, wrote about the returns of quantitative factor trading
strategies in his book ‘What works on Wall Street’ (O'Shaughnessy, 2005). This book tries to
be a guide to the best performing investment strategies of all time. Stock factors as price to
earnings, price to book, price to cashflow, price to sales, dividend yield, earnings per share,
return on equity and so on are individually back tested over the period from 1963 until 2003 to
see whether a positive score on these factors achieved market beating returns. The book shows
that most of these one-factor trading strategies actually did historically beat the broad United
States stock market, but these strategies do have a relative high risk profile. So O’Shaughnessy

5
advises investors to use multi-factor models (like the MF trading strategy), as single-factor
models show that certain market characteristics are giving investors market rewards but are
carrying higher risk. Multi-factor trading strategies on the other hand, have a lower risk profile
and are able to deliver even higher returns than single factor trading strategies. Investors should
always make a stock pass several hurdles before deciding to invest in it.
Earlier work of Fama and French (1992) also showed that a multifactor model including a price
to book ratio is able to achieve market beating returns. Their model considers the anomaly that
stocks with a low price to book ratio tend to outperform the markets on a regular basis. Work
by Lakonishok, Shleifer and Vishny (1994) confirmed the statement that low price to book ratio
companies historically outperformed high price to book ratio companies. But they do not really
focus on multi-factor strategies. Stanford University professor Joseph D. Piotroski extended
this former research and also found that it is better to make a stock pass several hurdles before
investing in it, and that using a multi-factor model is a better way to analyze stocks in an
effective way. He therefore developed a so called Piotroski F-Score, which measures the
financial strength of a company (Piotroski, 2000). The F-Score scans the historical financial
statements of a company and ranks them from 0 (lowest F-Score) to 9 (highest F-Score). He
did this because he also noticed that low price to book ratio companies historically
outperformed high price to book ratio companies, but some of these relative ‘cheap’ companies
tend to go bankrupt very quickly. That’s where the F-Score comes in. First select low price to
book ratio companies, and then only buy those with high Piotroski F-Scores. By using this
multifactor trading strategy, Piotroski shows that winners can be separated from losers and a
market premium of 7,5% can be realized annually.
So there are market anomalies out there in the stock markets. Many researchers claim to have
found different kinds of market anomalies of which investors could take advantage by using a
particular factor trading strategy. But apart from the price related factors I discussed before,
there is evidence that other remarkable non-price related factors are showing excess returns in
common stocks. The work of Ariel (1987) shows us that there is a ‘monthly effect’ in the stock
market. Over a 19 year back tested period stocks seem to have higher returns during the first
half of each month. So e.g. investors could choose to only buy stocks during these times of
higher returns or form another trading strategy based on this particular market anomaly.
Another remarkable market anomaly is found by Banz (1981) as he researched the relationship
of total market value of the common stock of a company and its return. He found that on
average, stocks of the small New York Stock Exchange (NYSE) firms have larger risk adjusted

6
returns than the stocks of large NYSE firms. A possible explanation of this effect can possibly
be found in work of Klein and Bawa (1977). They came to the conclusion that investors are
risk-averse when it comes to investing in stocks with limited information. Investors choose to
invest more in stocks about which they have the most information, which are mostly the stocks
of larger firms. Lack of information about small firms leads to limited diversification and
therefore to higher returns of the less desirable stocks of the smaller firms. But still, good
theoretical foundation for this ‘size related effect’ is hard to find. There might even be a market
anomaly around the turn of the year. Roll (1983) shows us that there is a remarkable pattern in
stock returns during the turn of the year. During this period, average returns of stocks are high
in general. He also concluded that returns of stocks from smaller firms are higher during this
period than stocks of larger firms, so there might be a relation with the earlier described ‘size
effect’.
There are many possible market anomalies which are found by researchers around the world
which are implying that the financial markets are inefficient. Investors could choose to take
advantage of these kinds of anomalies by creating a suitable trading strategy. Former literature
found that anomalies arise in all kinds of areas. There are anomalies which are size related,
price related, period related and so on. The MF trading strategy tries to combine a price related
anomaly with the ability of a firm to create a return on its investments, but in general there are
many more possible combinations of factors.
2.2 Efficient Market Hypothesis
But does it really make sense that there are trading strategies which are able to deliver market
outperforming returns over a long period of time? According to the Efficient Market Hypothesis
(EMH), it is impossible to continuously beat the market as equity prices reflect all available
information in the market (Fama, 1970). And when new information arises, investors are quick
to react and equity prices will follow just as fast.
In general, there are three levels of market efficiency. The weak form EMH implies that
historical price information and trading volume information have no effect on future rates of
returns. So investors cannot build market beating strategies based on this historical information.
The semi-strong form EMH states that the market is reflecting all publicly available information
as well. Investors are using the new available information immediately after it is released so
investors cannot benefit by trading on new information. In the strong form EMH, hidden or
insider information will also be reflected in equity prices. In such an investing world investors

7
cannot achieve risk-adjusted returns in excess of market averages. So when a market is that
strongly efficient, it becomes impossible for investors to realize abnormal returns
This EMH has led to a lot of criticism. Many market participants and researchers claim that it
is possible to reach market beating returns. But most of the time, the market is remarkably
efficient in its utilization of information (Malkiel, 2003). There are times that investors will act
less rationally what leads to pricing irregularities and in those cases there are patterns to be
found in stock returns but those periods are often short of existence. These periods are more the
exception than the rule. According to another work of Malkiel (2005) most of the time the EMH
holds it ground, so switching from security to security realizes nothing but only increases
transactions costs and harm the general performance of a portfolio. This is confirmed by Ellis
(1975), who called this phenomenon of changing from security to security to try to outperform
the average returns of the market the ‘Loser’s Game’. Ellis stated that there are so many
professionals in the investment management world that it is no longer feasible for any of them
to profit from the errors of other investors. He stated that active management will not realize
market outperforming returns, so it is better for these investors to admit to the EMH.
Many of the researchers who claim that the stock markets are efficient and therefore unable to
beat without taking additional risk, were fully focused on the efficiency of the United States
stock market. But there is also evidence that other stock markets are becoming more and more
efficient. The European stock market is becoming more efficient according to Borges (2010).
But also emerging markets like Latin America (Ojah & Karemera, 1999) have a form of
efficiency and international investors cannot use historical price information to create a
profitable trading strategy. The same counts for the African stock markets (Magnusson &
Wydick, 2002) and the Middle East stock markets (Abraham, Seyyed, & Alsakran, 2002).
These stock markets still have a weak form of efficiency and do not pass the high efficiency
hurdles as the United Stock markets does, but even this weak form of efficiency should make it
impossible to create a market outperforming trading strategy based on historical price changes
without taking additional risk.
The EMH claims that from the moment that information is available in the market, equity prices
will react immediately to that particular information. So when Joel Greenblatt informed the
market about his MF trading strategy, the strategy should have immediately stopped working
as all investors would jump on it and try to reach market outperformance with this trading
strategy. Luckily for us, this MF trading strategy was found in 2006 and we are now living circa

8
9 years later. This criticism of EMH that market beating strategies will stop working once they
are made publicly available to market participants and the main assumption that it is impossible
to achieve risk adjusted returns above market averages inspired Joel Greenblatt to rewrite his
book. Four years after he wrote his first book on his MF trading strategy, he wrote ‘The little
book that Still beats the market’ (Greenblatt, 2010). In this updated version of his previous
book, Greenblatt shows that his MF trading strategy kept generating market beating returns
after he published his first book in 2006. So there might be some continuous anomalies in the
stock markets. Greenblatt explains this phenomenon by describing the psychological mind of
an investor as psychological biases can affect market prices substantially.
The work of Fama (1998) confirmed that psychological biases affect prices because investors
tend to overreact or underreact several times and that seems to produce many long-term return
anomalies. But Fama also stated when these situations occur, they disappear very quickly.
However, a study of Shiller (2003) concludes that the mere fact that anomalies sometimes
disappear is not strong evidence that markets are fully rational. Shiller says that we have to
distance ourselves from the presumption that financial markets are always efficient and that
equity prices always reflect all the information. Some market reactions, like the stock market
boom and crash after 2000, had its origins in human foibles and generated a real misallocation
of resources. The work of Daniel, Hirshleifer and Hong Teoh (2002) also shows that
psychological biases affect market prices substantially and that mispricing of stock prices can
be a result of such an event.
Greenblatt agrees with this statement. He states that investors often choose to leave the MF
strategy because in some of the years, the MF trading strategy actually underperformed the
market. According to Greenblatt, many investors have a short term time horizon or do not have
the discipline to keep loyal to the MF trading strategy in bad times and are therefore
continuously psychologically overreacting or underreacting based on the positive or negative
returns of the MF trading strategy. They want quick rewards and change from investing
strategies multiple times during their investing careers. Those are some reasons why the MF
trading strategy will keep working. It is very hard to stay with a strategy that underperforms the
market multiple times a year.
9
2.3 Value Investing
What becomes obvious when looking at the particular outperforming factor trading strategies
founded by many different researchers is that a lot of factor strategies have a tight connection
with the value investing principles. E.g. stocks with low price to earnings ratios historically
achieved higher returns than stocks with high price to earnings ratios. The same counts for the
price to book, price to sales, price to cashflow and so on. These factors are specifically looked
at by value investors who try to buy a dollar for fifty cents. Value investors claim that the market
sometimes is very inefficient and that securities are often mispriced. Benjamin Graham, who is
widely seen as the father of value investing, noticed this phenomenon a long time ago. In his
book ‘The Intelligent Investor’ which was first published in 1949, he stated that stock investors
shouldn’t buy stocks with high price related ratios (Graham & Zweig, 2006). Do not pay too
much for your stocks is his advice. Many of the market outperforming factor strategies consist
of such principles. Most of them try to signalize stocks of good companies which are relative
cheap, and try to take advantage of the inefficiency and mispricing of securities.
A lot of successful value investors are stating that it is possible to outperform the average returns
of the general stock markets and Joel Greenblatt is clearly one of them. The EMH would say
that it is impossible that these value investors are generating abnormal market returns over a
long period of time without taking a large amount of risk. Work of Bartov and Kim (2004)
however shows us that value investors who like to use price related ratios like the price to book
ratio, are not taking above average risk to generate these abnormal returns. They formulate
value investing as buying stocks when their price is low relative to some fundamental
benchmarks such as earning, cash from operations, dividends, or accounting book value. This
should increase your returns and decrease your risk. A study of Chan and Lakonishok (2004)
also confirmed that stock trading strategies based on value investing do not carry a high risk
profile. The volatility of these value investing strategies is also relative low.
2.4 The Magic Formula
The MF trading strategy clearly has a lot of similarities with value investing as the strategy tries
to buy above average companies for below average prices. The MF trading strategy uses the
earnings yield (EY) and return on invested capital (ROIC) as their metrics to realize continuous
market beating returns. The EY is a price related ratio and is best compared to the reversed
price to earnings ratio. According to Greenblatt however, his EY ratio is an improved reversed
price to earnings ratio as it is calculated in a slightly different way. The EY is calculated as
follows:

10
𝐸𝑎𝑟𝑛𝑖𝑛𝑔𝑠 𝑌𝑖𝑒𝑙𝑑𝑡 =
𝐸𝐵𝐼𝑇𝑡
𝐸𝑛𝑡𝑒𝑟𝑝𝑟𝑖𝑠𝑒 𝑣𝑎𝑙𝑢𝑒𝑡−1
(1)
𝐸𝐵𝐼𝑇𝑡 = 𝑃𝑟𝑒𝑡𝑎𝑥 𝐼𝑛𝑐𝑜𝑚𝑒𝑡 + 𝐼𝑛𝑡𝑒𝑟𝑒𝑠𝑡 𝐸𝑥𝑝𝑒𝑛𝑠𝑒𝑡 (2)
𝐸𝑛𝑡𝑒𝑟𝑝𝑟𝑖𝑠𝑒 𝑉𝑎𝑙𝑢𝑒𝑡 = 𝑀𝑎𝑟𝑘𝑒𝑡 𝑣𝑎𝑙𝑢𝑒 𝑜𝑓 𝑒𝑞𝑢𝑖𝑡𝑦𝑡
+𝐼𝑛𝑡𝑒𝑟𝑒𝑠𝑡 𝑏𝑒𝑎𝑟𝑖𝑛𝑔 𝑑𝑒𝑏𝑡𝑡 − 𝐸𝑥𝑐𝑒𝑠𝑠 𝑐𝑎𝑠ℎ𝑡
(3)
The most powerful part of this equation is the calculation of the Enterprise Value, while the
reversed price to earnings ratio is using simple Market Capitalization as its denominator.
Greenblatt states that “Enterprise value takes into account both the price paid for an equity stake
in a business as well as the debt financing used by a company to help generate operating
earnings”. By using this calculation of Enterprise Value, companies with a lot of debt are
penalized, and companies with a lot of cash on hand are being rewarded. By using this EY ratio,
the MF trading strategy measures how ‘cheap’ a companies’ stock is.
The second ratio, the ROIC, is calculated as follows:
𝑅𝑒𝑡𝑢𝑟𝑛 𝑜𝑛 𝐼𝑛𝑣𝑒𝑠𝑡𝑒𝑑 𝐶𝑎𝑝𝑖𝑡𝑎𝑙𝑡 =
𝐸𝐵𝐼𝑇𝑡
𝑁𝑒𝑡 𝑇𝑎𝑛𝑔𝑖𝑏𝑙𝑒 𝐴𝑠𝑠𝑒𝑡𝑠𝑡−1
(4)
𝑁𝑒𝑡 𝑇𝑎𝑛𝑔𝑖𝑏𝑙𝑒 𝐴𝑠𝑠𝑒𝑡𝑠𝑡 = 𝐴𝑐𝑐𝑜𝑢𝑛𝑡𝑠 𝑟𝑒𝑐𝑒𝑖𝑣𝑎𝑏𝑙𝑒𝑡
+𝐼𝑛𝑣𝑒𝑛𝑡𝑜𝑟𝑦𝑡 + 𝐶𝑎𝑠ℎ𝑡 − 𝐴𝑐𝑐𝑜𝑢𝑛𝑡𝑠 𝑝𝑎𝑦𝑎𝑏𝑙𝑒𝑡 + 𝑁𝑒𝑡 𝑓𝑖𝑥𝑒𝑑 𝑎𝑠𝑠𝑒𝑡𝑠𝑡
(5)
In general, the ROIC ratio has some similarities with the Return on Assets (ROA) and Return
on Equity (ROE) ratios, but Greenblatt prefers the ROIC ratio instead of the ROA and ROE
ratios. The main reason behind this is the fact that the ROIC ratio figures out how much capital
the company actually needed to realize its profits. So the ROIC ratio measures how efficiently
a company performs. A simple combination of the EY and ROIC can signalize companies
which are cheap (those with high EY values) and which are good (those with high ROIC
values), and that’s exactly what the MF trading strategy wants.
Step by step, the MF trading strategy as used by Greenblatt to realize market beating returns is
as follows:

11
Step 1: Screen common stocks based on their ROIC and rank them from high to low.
Step 2: Screen common stocks based on their EY and rank them from high to low.
Step 3: Combine these rankings into one compounded ranking.
Step 4: Eliminate Utilities and Financial stocks, and also eliminate foreign companies
which in the original MF trading strategy were American Depository Receipts
(ADR’s). Also eliminate companies with a market cap below $50 million.
Step 5: Buy the top 5-8 stocks out of the combined ranking each two to three months
until you hold a portfolio of 30 stocks.
Step 6: Sell each stock after holding it an entire year.
Step 7: Continue to use this strategy for multiple years.
With this simple but effective trading strategy, your returns would be a lot higher than the
average returns of the S&P 500 index. As mentioned before, according to the back test of
Greenblatt this MF trading strategy would give you average annual returns of 30,8% over the
period from 1988 until 2004. By using multiple factors (the ROIC and EY), the risk profile of
the MF trading strategy should be lower than simply using a single factor trading strategy.

12
3: Data & Methodology
In this section, there is a description of the used dataset as well as the methodology by which
the backtest of the MF trading strategy is constructed within the Benelux stock market.
3.1 Data
For backtesting the MF trading strategy in the Benelux stock market, specific historical
financial information from 1994 until 2014 of stocks out of the Benelux-DataStream Market
(Mnemomic TOTMKBX) is retrieved from the Thompson Reuters DataStream database. This
Benelux-DataStream index covers the three selected regions (Belgium, Luxembourg and the
Netherlands), and includes stocks of large cap-, middle cap- and small cap-companies. In total,
this Benelux-DataStream Market index has 237 constituents. Based on the original strategy of
Joel Greenblatt, stocks from Financials and Utilities are eliminated from the universe because
they tend to have very high leverage and/or some form of state intervention which could make
the calculations of their EY and ROIC very unreliable. This high leverage might signalize
distress for a lot of industrial firms, but it has a different meaning for Financials and that makes
it difficult to compare these kinds of sectors (Fama & French, 1992).
Because the selected Benelux region is clearly smaller than the United States region, I decided
to lower the market capitalization threshold and only eliminate stocks with a market
capitalization below €10 million from the universe instead of using the original $50 million
limit. This market capitalization limit is set to select stocks which are liquid enough for trading
once a year. Companies with a market capitalization below the €10 million are excluded
because their stocks might be illiquid and therefore untradeable in the MF trading strategy. The
capitalization limit is lower than the original capitalization limit of Greenblatt because
otherwise the Benelux backtest stock universe will become too small. Still, stocks of companies
with a market capitalization above €10 million are liquid enough for small individual investors
to use the MF trading strategy. Market capitalization is calculated as the Market Stock Price-
Year End times the Common Shares Outstanding during that same year. Finally, stocks of
which the DataStream database does not have any data available will also be eliminated.
Once these stocks are all eliminated from the backtest universe, a list of 136 stocks is left for
backtesting the MF trading strategy. The Benelux-DataStream Market index will be used as a
benchmark for the backtest. This is the most reliable benchmark as it covers all the stocks in
the backtest universe.

13
The accounting variables which are needed to create the rankings based on ROIC and EY are
also retrieved from the Thompson Reuters DataStream database. The DataStream database
offers a predefined ROIC ratio for the backtest universe so I decided to use this ratio instead of
using the original ROIC equation of Joel Greenblatt. The predefined ROIC has a lot of
similarities with Joel Greenblatt’s calculation of the ROIC, so this should not make a lot of
difference in the results. The biggest difference between these two equations is the fact that the
predefined ROIC ratio takes a tax rate into account. The pre-defined ROIC ratio in the
DataStream database which is being used in this backtest is calculated as follows:
𝑅𝑒𝑡𝑢𝑟𝑛 𝑜𝑛 𝐼𝑛𝑣𝑒𝑠𝑡𝑒𝑑 𝐶𝑎𝑝𝑖𝑡𝑎𝑙𝑡 =
(𝑁𝑒𝑡 𝐼𝑛𝑐𝑜𝑚𝑒𝑡 +
𝐼𝑛𝑡𝑒𝑟𝑒𝑠𝑡 𝐸𝑥𝑝𝑒𝑛𝑠𝑒𝑡 ∗ (1 − 𝑇𝑎𝑥 𝑅𝑎𝑡𝑒)𝑡)
𝑇𝑜𝑡𝑎𝑙 𝐶𝑎𝑝𝑖𝑡𝑎𝑙𝑡 + 𝑇𝑜𝑡𝑎𝑙 𝐷𝑒𝑏𝑡𝑡∗ 100
(6)
As the DataStream database does not offer a predefined EY variable, the accounting variables
of the EY formula will be calculated manually. Just like Joel Greenblatt’s original EY formula,
a company’s EBIT is being divided by the Enterprise Value of the particular company to create
an EY ratio. In this research, a slightly different calculation of the Enterprise Value is being
used because the DataStream database does not offer accurate data about interest bearing debt.
In the end, the EY calculation used in this research is close to identical to Joel Greenblatt’s
original approximation, so this should not lead to significant differences in the results. The EY
variable is calculated as follows:
𝐸𝑎𝑟𝑛𝑖𝑛𝑔𝑠 𝑌𝑖𝑒𝑙𝑑𝑡 =
𝐸𝐵𝐼𝑇𝑡
𝐸𝑛𝑡𝑒𝑟𝑝𝑟𝑖𝑠𝑒 𝑣𝑎𝑙𝑢𝑒𝑡−1
(7)
𝐸𝐵𝐼𝑇𝑡 = 𝑃𝑟𝑒𝑡𝑎𝑥 𝐼𝑛𝑐𝑜𝑚𝑒𝑡 + 𝐼𝑛𝑡𝑒𝑟𝑒𝑠𝑡 𝐸𝑥𝑝𝑒𝑛𝑠𝑒𝑡 − 𝐼𝑛𝑡𝑒𝑟𝑒𝑠𝑡 𝐶𝑎𝑝𝑖𝑡𝑎𝑙𝑖𝑧𝑒𝑑𝑡 (8)
𝐸𝑛𝑡𝑒𝑟𝑝𝑟𝑖𝑠𝑒 𝑉𝑎𝑙𝑢𝑒𝑡 = 𝑀𝑎𝑟𝑘𝑒𝑡 𝑣𝑎𝑙𝑢𝑒𝑡 + 𝑁𝑒𝑡 𝑑𝑒𝑏𝑡𝑡 (9)
In this particular calculation of the Enterprise Value, the Market Value is the share price
multiplied by the number of ordinary shares outstanding. The amount outstanding is updated
whenever new tranches of stock are issued or after a capital change. Net Debt represents the
Total Debt minus Cash. Cash represents Cash & Short Term Investments. By using this
calculation of EY, companies with low levels of cash and high levels of debt will be punished

14
with a lower EY ratio, and companies with high levels of cash and low levels of debt will be
rewarded with a higher EY ratio.
For calculating the annual returns of the MF trading strategy and the Benelux-DataStream
index, the Total Return Index (RI) is used because this index includes dividend payments. The
RI immediately reinvests company’s dividend payments into the same stock. The RI is using
an ex-dividend date method and is calculated as follows:
𝑅𝐼𝑡 = 𝑅𝐼𝑡−1
∗(𝑃𝑡 + 𝐷𝑡)
𝑃𝑡−1
(10)
Where:
Pt = price on ex-date
Pt-1 = price on previous day
Dt = dividend payment associated with ex-date t
3.2Methodology
Joel Greenblatt took a very large stock universe of United States listed stocks. Out of this
universe, he annually formed a portfolio of the top 30 stocks based on their ROIC and EY
rankings and rebalanced this portfolio to the top 30 stocks annually. The Benelux universe is
clearly a lot smaller than the universe of Joel Greenblatt, so instead of creating a portfolio of 30
stocks, a portfolio of only 10 stocks will be formed as the Magic Formula (MF) Portfolio. This
MF Portfolio will be rebalanced annually just like the MF Portfolio in Joel Greenblatt’s original
MF trading strategy and the 10 constituents of the MF Portfolio will be selected based on the
compounded ranking of ROIC and EY.
As described before, slightly different equations of ROIC and EY are used in comparison to the
original equations used by Joel Greenblatt. These equations however are close to identical and
therefore should not lead to significantly different results. For the annual formation of the MF
Portfolio, the top 10 stocks of the compounded ranking of ROIC and EY are used. So first, the
individual rankings based on ROIC and EY are made and the scores out of these rankings are
the input for the compounded ranking. The ROIC and EY scores are calculated on data from
the 31th of March of a particular year, to the 31th March of one year later. This is done because
nearly all companies hand in their financial statements a few months after the turn of the year.
These financial statements include the necessary inputs for the ROIC and EY calculations. So

15
the annual MF portfolio rebalance date is 31 March each year. This date is also chosen to make
the MF trading strategy more useful for individual investors as they are only able to calculate
the ROIC and EY scores after the listed companies handed in their financial statements. So for
example, the compounded ROIC and EY ranking which is based on historical financial
information of 1995 is linked to the MF Portfolio of 1996 which is held from 31 March 1996
until 31 March 1997.
Once the compounded ranking is made, an equal amount of money will be invested in each of
the top 10 stocks. This is done due to simplicity of the backtest and is in line with the original
approximation of Joel Greenblatt’s MF trading strategy. There is no distinction between the
amounts of money invested in the top 10 stocks. So the weight of each stock in the MF portfolio
is exactly 10% after it is rebalanced. Then, after a full year, the RI of the 10 individual stocks
in the MF portfolio are measured. The averages of those measured annual returns represent the
annual returns of the MF portfolio.
The first MF portfolio is formed in 1995 and is annually rebalanced to the top 10 stocks until
2014. This is a 20 year period which should be long enough to signalize a possible market
anomaly and to claim whether the MF trading strategy outperformed the Benelux-DataStream
market. For this 20 year period, sufficient reliable data was available through the Thompson
Reuters DataStream database. It would be a better choice to backtest the MF trading strategy
over a longer period of time, but the available historical data in the Thompson Reuters database
before 1995 is highly unreliable so I chose to use the reliable 20 year period. Further, this 20
year period contains two market crashes, the so called internet bubble during the beginning of
the 21th century, and the United States credit crunch in 2008. It is interesting to see whether the
MF trading strategy outperformed the markets during these stressful times.
In the end, this backtest methodology is using a slightly different approach from the original
approach of Joel Greenblatt, but again, it is close to identical and should not lead to significant
differences in the results. Step by step, the methodology used for the MF backtest in the Benelux
stock market is:
Step 1: Eliminate Utilities and Financial stocks. Also eliminate companies with a market
cap below €10 million and companies of which no data is available.
Step 2: Screen the stock universe based on the ROIC and rank stocks from high to low.
Step 3: Screen the stock universe based on the EY and rank stocks from high to low.

16
Step 4: Combine these rankings into one compounded ranking.
Step 5: Buy the top 10 stocks out of the compounded ranking each year on 31th of
March.
Step 6: Sell each stock after holding it an entire year on the 31th of March. When a top
10 stock of the former year is again in the top 10 stocks of the following
particular year, you simply keep the stock in portfolio without selling and
rebuying it (to reduce transaction costs).
Step 7: Continue to use this strategy from 1995 until 2014.

17
4: Results
Once the MF Portfolios are formed based on the description in the Data & Methodology section
and held for an entire year, it becomes clear that the MF trading strategy beats the average
annual returns of the Benelux market.
4.1 Magic Formula Trading Strategy
For the period of 1995 until 2014, each year a MF Portfolio consisting out of the top 10 ROIC
and EY stocks are formed and their annual returns are calculated. Table 1 shows the annual
returns of the MF trading strategy and the Benelux market from 1995 until 2014. Note that these
returns are from 31th March1995 until 31th March 2015 as described in the Data &
Methodology section. So for example, the 1995 annual return is the annual return from 31
March 1995 until 31 March 1996 and so on. In Appendix A, the exact formations of the MF
Portfolios for each year can be found.
Table 1:
Annual returns of the MF Portfolio and the Benelux market
MF Portfolio (1) Benelux market (2) (1) – (2)
1995 31,72% 20,16% 11,56%
1996 40,10% 23,43% 16,67%
1997 45,43% 30,78% 14,65%
1998 -18,92% 4,90% -23,82%
1999 10,93% 4,54% 6,39%
2000 3,11% -18,30% 21,41%
2001 14,74% -5,35% 20,10%
2002 -38,15% -30,52% -7,63%
2003 44,15% 48,71% -4,56%
2004 31,29% 24,23% 7,06%
2005 44,94% 21,34% 23,60%
2006 39,07% 25,08% 13,99%
2007 -8,34% 1,78% -10,13%
2008 -46,56% -60,51% 13,95%
2009 59,94% 67,11% -7,18%
2010 17,71% 8,57% 9,14%
2011 2,30% -13,51% 15,81%
2012 6,52% 10,67% -4,15%
2013 31,01% 21,42% 9,59%
2014 27,66% 0,07% 27,58%
Mean 16,93% 9,23% 7,70%

18
As Table 1 shows, the MF Portfolio containing the top 10 stocks with the best combination of
ROIC and EY out of constituents of the Benelux market clearly outperforms the average annual
returns of the complete Benelux market. Over the 20 year period from 1995 to 2014, the MF
Portfolio annually outperformed the Benelux market by 7,70% on average. So it becomes clear
that the MF trading strategy works in the Benelux region as well as in the United States region.
The 16,93% average annual return of the MF Portfolio in the Benelux is not near the 30,8%
average annual return of the MF Portfolio in the United States as shown by Joel Greenblatt, but
it still is a remarkable outperformance.
In 14 out of the 20 backtested years (70%) the MF trading strategy outperformed the Benelux
market which is pretty similar to the average annual outperformance of the MF trading strategy
in the United States measured by Joel Greenblatt where the MF trading strategy outperforms
the S&P 500 in 19 out of 25 years (76%).
Now that it is clear that the MF trading strategy historically outperformed the Benelux market,
it becomes interesting to see whether this outperformance comes with additional risk. Table 2
shows the descriptive statistics of the MF Portfolio and the Benelux market over the backtested
period from 1995 until 2014.
Table 2:
Descriptive statistics of the MF Portfolio and the Benelux market
MF Portfolio BeNeLux market
Mean 0.1693 0.0923
Median 0.2268 0.0962
Standard deviation 0.2856 0.2770
Min -0.4656 -0.6051
Max 0.5994 0.6711
The MF Portfolio has a higher standard deviation compared to the Benelux market. So the
higher returns from the MF Portfolio come with some additional risk, which is in line with the
Efficient Market Hypothesis where it is impossible to reach market outperformance by using
historical information without taking additional to the market risk. Still the additional risk looks
rather small as the standard deviation of the MF Portfolio is only a bit higher than the standard
deviation of the Benelux market. A Sharpe (1994) ratio is therefore calculated to measure the
risk-adjusted returns using the following equation:

19
𝑆ℎ𝑎𝑟𝑝𝑒 𝑅𝑎𝑡𝑖𝑜 =
𝐸(𝑅𝑝 − 𝑅𝑓)
𝜎𝑝
(11)
Where:
E(Rp) = Expected Return of the Portfolio
Rf = Risk Free Rate
σp = Portfolio standard deviation
With the use of this equation, a Sharpe ratio for the MF Portfolio and the Benelux market is
calculated. For a risk free rate, the three month yield on a US Treasury bill is used for each
particular date. The used risk free rates for each year can be found in Appendix B. The average
of the portfolio returns minus the risk free rates represent the expected return of the portfolio in
excess of the risk free rates. Table 3 shows the Sharpe ratios of both portfolios.
Table 3:
Sharpe Ratio of the MF Portfolio and the Benelux market
MF Portfolio Benelux market
Expected excess Return 0.1410 0.0640
Standard deviation 0.2856 0.2770
Sharpe Ratio 0.4936 0.2309
The MF trading strategy has a higher Sharpe ratio in comparison with the Benelux market,
meaning that the MF Portfolio generates a more attractive risk-adjusted return than the Benelux
market. This might signalize a market anomaly and violates the Efficient Market Hypothesis.
Another well-known risk measure is the market beta. A beta of 1 indicates that the MF Portfolio
will move in line with the Benelux market. A beta of less than 1 indicates that the MF Portfolio
is less volatile then the Benelux market, meaning that the MF Portfolio is less risky. A beta of
greater than 1 indicates that the MF Portfolio is more volatile and therefore riskier than the
Benelux market. The market beta is estimated using a simple linear regression model:
𝑅𝑀𝐹𝑡− 𝑅𝑓𝑡
= 𝛽(𝑅𝐵𝑁𝐿𝑡− 𝑅𝑓𝑡
) + 𝜀𝑡 (12)
Where:
RMF = Return of MF Portfolio
RBNL = Return of Benelux market
Rf = Risk free rate

20
Graph 1 shows the annual returns of the MF Portfolio and the Benelux market, and inserts a
regression line.
Graph 1:
Simple linear regression model. Regression of MF Portfolio returns on Benelux returns
As can be seen in Table 4, the MF Portfolio has a market beta of 0.9836 meaning that the MF
Portfolio is less volatile and therefore less risky than the Benelux market. The p-value of the
market beta is zero to four decimals, meaning that this market beta is high significant. The R2
value of 0.7729 shows that this model explains 77.29% of the variation. So according to this
risk measure statistic, the MF Portfolio is able to generate market beating returns without taking
additional risk. Again, this clearly violates the Efficient Market Hypothesis and strengthens
Greenblatt’s statement that the MF trading strategy is able to generate market beating returns,
even with a lower risk profile.
Table 4:
Summary statistics of the linear regression model. Regression of MF Portfolio returns on Benelux returns
MF Portfolio
Market �̂� 0.9836***
p-value 𝛽 0.0000
R2 0.7729
RMF - RF = 0,9836 (RBNL - Rf)
-80%
-60%
-40%
-20%
0%
20%
40%
60%
80%
-80% -60% -40% -20% 0% 20% 40% 60% 80%
MF
Ret
urn
s %
Benelux market returns %

21
4.2 The individual investor
Let us put these results in the perspective of an individual investor. An individual investor X
was confident in the way the Magic Formula trading strategy works and decided to invest
€10.000 in this MF trading strategy in 1995. Another individual investor Y stated that it was
impossible to reach market outperformance and was more confident in the Efficient Market
Hypothesis. He decided to follow a strategy which completely matched the results of the
Benelux market and also invested €10.000 in 1995. Graph 2 shows the virtual values of their
portfolios from 1995 until 2014. Of course, transaction costs and other forms of brokerage costs
are eliminated from this graph. Dividend payments however are immediately reinvested as this
graph is using the Total Return Index (RI).
Graph 2:
Virtual values of an initial €10.000,- investment in the MF trading strategy and in the Benelux market
The terminal value of the portfolio of investor X on 31 March 2015 would be € 113.238 and
the terminal value of the portfolio of investor Y would be € 27.182 on that same date. Graph 2
brings the results of Table 1 in a clear view. This graph however, shows the power of selecting
a successful trading strategy and holding onto it for a long period of time. As described before,
the holding on to a strategy part is one of the main difficulties according to Joel Greenblatt as
the MF trading strategy often underperforms the market in one particular year. In the Benelux
market backtest, this was the case in 30% of the time. Greenblatt states that it is very difficult
to hold onto an underperforming strategy. Just like Ellis (1975) concluded that changing from
security to security is playing the ‘Losers game’, changing from strategy to strategy could even
be a bigger ‘Losers game’.
€ 0
€ 20.000
€ 40.000
€ 60.000
€ 80.000
€ 100.000
€ 120.000
19
95
19
96
19
97
19
98
19
99
20
00
20
01
20
02
20
03
20
04
20
05
20
06
20
07
20
08
20
09
20
10
20
11
20
12
20
13
20
14
Year
Investor X
Investor Y

22
5: Conclusion
Joel Greenblatt opened up a lot of investors eyes when he wrote ‘The little book that beats the
market’ by making former scientific work of many researchers easily readable for the general
public. In a very simple way, he described that the United States stock market can be inefficient
and that even small individual investors could take advantage of such an event by using his
Magic Formula trading strategy. He showed that by buying a simple portfolio of 30 companies
with a high Earnings Yield ratio and a high Return on Invested Capital ratio significantly
outperformed the S&P 500 index. He therefore signalized a market anomaly which violates the
Efficient Market Hypothesis.
This research takes this same Magic Formula trading strategy to the Benelux region by
answering the following question:
Does the ‘Magic Formula’ trading strategy of Joel Greenblatt show market outperformance in
the Benelux stock market?
The results show that the answer to this question is clearly a yes. This simple but effective
Magic Formula trading strategy works outside the United States as well. The results of the 20
year-period backtest from 1995 until 2014 shows that the Magic Formula trading strategy on
average realized an annual 7,70% market premium in the Benelux stock market without taking
additional risk. So this might signalize a market anomaly outside the United States. This
outperformance is not that big as the outperformance in the United States stock market, but the
result still shows a relative high outperformance. Individual investors can choose to put this
Magic Formula trading strategy into practice by simply buying a portfolio consisting of 10
stocks with the best combination of EY and ROIC.
This market outperformance of the Magic Formula is a remarkable event. Of course, historical
returns do not guarantee the same returns for the future, but many researchers around the world
showed that buying companies with particular accounting variables can be a very effective way
of investing. The biggest question is why these kinds of strategies tend to keep on working over
long periods of times. Many researchers believe the answer can be found in field of behavioral
finance. The behavioral finance aspects of trading strategies like the Magic Formula trading
strategy are interesting areas for further research.

23
Bibliography Abraham, A., Seyyed, F., & Alsakran, S. (2002). Testing the random behavior and efficiency
of the Gulf stock markets. The Financial Review, 37(3), 469-480.
Ariel, R. A. (1987). A Monthly Effect In Stock Returns. Journal of Financial Economics, 18,
161-174.
Banz, R. W. (1981). The relationship between return and market value of common stocks.
Journal of Financial Economics(9), 3-18.
Bartov, E., & Kim, M. (2004). Risk, Mispricing, and Value Investing. Review of Quantitative
Finance and Accounting(23), 353-376.
Basu, S. (1977). Investment performance of common stocks in relation to their price earnings
ratios: A test of the efficient market hypothesis. Journal of Finance, 32, 663-682.
Borges, M. R. (2010). Efficient market hypothesis in European stock markets. The European
Journal of Finance, 16(7), 711-726.
Chan, L. K., & Lakonishok, J. (2004). Value and Growth Investing: Review and Update.
Financial Analysts Journal, 60(1), 71-86.
Charest, G. (1978). Dividend Information, Stock Returns and Market Efficiency. Journal of
Financial Economics(6), 297-330.
Daniel, K., Hirshleifer, D., & Hong Teoh, S. (2002). Investor psychology in capital markets:
evidence and policy implications. Journal of Monetary Eonomics, 49, 139-209.
Ellis, C. D. (1975). The Loser's Game. The Financial Analysts Journal, 31(4), 19-26.
Fama, E. F. (1970). Efficient Capital Markets: A Review of Theory and Empirical Work.
Journal of Finance, 25(2), 383-417.
Fama, E. F. (1998). Market efficiency, long-term returns, and behavioral finance. Journal of
Financial Economics(49), 283-306.
Fama, E. F., & French, K. R. (1992). The Cross-Section of Expected Stock Returns. Journal of
Finance, 47(2), 427-465.
Graham, B., & Zweig, J. (2006). The Intelligent Investor. New York: HarperCollins Publishers
Inc.
Greenblatt, J. (2006). The little book that beats the market. Hoboken, New Jersey: John Wiley
and Sons Ltd.
Greenblatt, J. (2010). The little book that Still beats the market. Hoboken, New Jersey: John
Wiley and Sons Ltd.

24
Keim, D. B. (1983). Size-Related Anomalies and Stock Return Seasonality. Journal of
Financial Economics, 12, 13-32.
Klein, R. W., & Bawa, V. S. (1977). The effect of limited information and estimation risk on
optimal portfolio diversification. Journal of Financial Economics(5), 89-111.
Lakoninshok, J., Shleifer, A., & Vishny, R. W. (1994). Contrarian Investment, Extrapolation,
and Risk. Journal of Finance, 49(5), 1541-1578.
Litzenberger, R. H., & Ramaswamy. (1982). The Effects of Dividends on Common Stock
Prices Tax Effects or Information Effects. Journal of Finance, 37(2), 429-443.
Magnusson, M. A., & Wydick, B. (2002). How efficient are Africa's Emerging Stock Markets?
Journal of Development Studies, 4(38), 141-156.
Malkiel, B. G. (2003). The Efficient Market Hypothesis and Its Critics. Journal of Economic
Perspectives, 17(1), 59-82.
Malkiel, B. G. (2005). Reflections on the Efficient Market Hypothesis: 30 Years Later. The
Financial Review(40), 1-9.
Ojah, K., & Karemera, D. (1999). Random Walks and Market Efficiency Tests of Latin
American Emerging Equity Markets: A Revisit. The Financial Review(34), 57-72.
O'Shaughnessy, J. P. (2005). What works on Wall Street (3rd ed.). New York: McGraw-Hill.
Piotroski, J. D. (2000). Value Investing: The Use of Historical Financial Statement Information
to Seperate Winners from Losers. Journal of Accounting Research, 38, 1-41.
Reinganum, M. (1981). Misspecification of capital asset pricing: Empirical anomalies based on
earnings' yields and market values. Journal of Financial Economics, 9, 19-46.
Roll, R. (1983). Vas ist das? The turn of the year effect and the teturn premium of small firms.
Journal of Portfolio Management(9), 18-28.
Sharpe, W. F. (1994). The Sharpe Ratio. The Journal of Portfolio Management, 21(1), 49-58.
Shiller, R. J. (2003). From Efficient Markets Theory to Behavioral Finance. Journal of
Economic Perspectives, 17(1), 83-104.

25
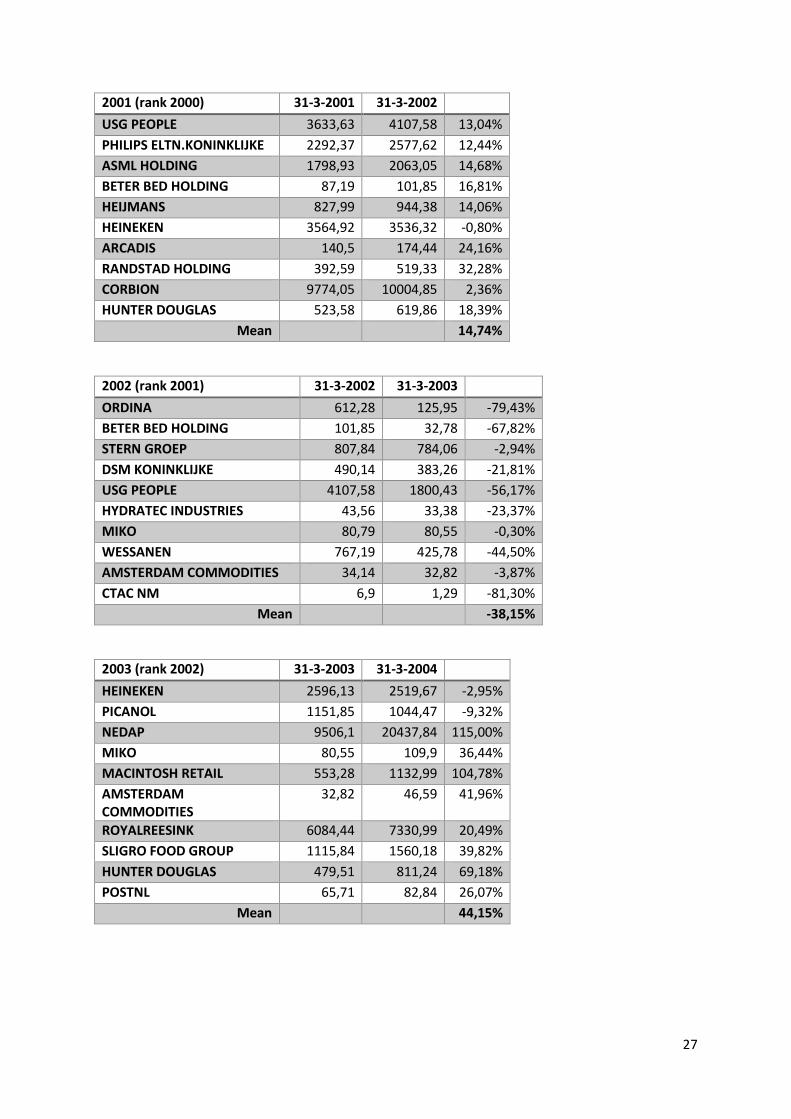
Appendix A: MF Portfolios from 1995 until 2014
1995 (rank 1994) 31-3-1995 31-3-1996
REED ELSEVIER (AMS) 3073,31 4950,37 61,08%
NEDAP 3881,71 6839,82 76,21%
UNILEVER CERTS. 2098,26 2413,93 15,04%
WESSANEN 732,47 829,8 13,29%
BARCO NEW 266,03 474,17 78,24%
SLIGRO FOOD GROUP 225,89 395,74 75,19%
FUGRO 78,74 58,05 -26,28%
BEKAERT (D) 1756,35 2340,22 33,24%
RTL GROUP (LUX) 221,36 225,38 1,82%
STERN GROEP 263,09 235,07 -10,65%
Mean 31,72%
1996 (rank 1995) 31-3-1996 31-3-1997
REED ELSEVIER (AMS) 4950,37 6105,74 23,34%
NEDAP 6839,82 12177,8 78,04%
HEIJMANS 314,17 590,53 87,97%
BARCO NEW 474,17 680,1 43,43%
UNILEVER CERTS. 2413,93 4038,33 67,29%
TESSENDERLO 1705,42 2361,32 38,46%
SLIGRO FOOD GROUP 395,74 550,13 39,01%
NEWAYS ELEC.INTL. 121,5 117,21 -3,53%
WESSANEN 829,8 957,99 15,45%
KPN KON 136,99 152,86 11,58%
Mean 40,10%
1997 (rank 1996) 31-3-1997 31-3-1998
REED ELSEVIER (AMS) 6105,74 7193,43 17,81%
NEDAP 12177,8 17301,72 42,08%
ROYAL IMTECH 983,86 1305,89 32,73%
HEIJMANS 590,53 924,24 56,51%
UNILEVER CERTS. 4038,33 6317,11 56,43%
SLIGRO FOOD GROUP 550,13 799,96 45,41%
ARCADIS 129,55 170,87 31,90%
FUGRO 118,73 251,32 111,67%
WOLTERS KLUWER 9121,21 12161,59 33,33%
HUNTER DOUGLAS 575 726,88 26,41%
Mean 45,43%

26
1998 (rank 1997) 31-3-1998 31-3-1999
CORBION 9022,73 9311,89 3,20%
BETER BED HOLDING 194,81 211,59 8,61%
FUGRO 251,32 148,79 -40,80%
ROYAL IMTECH 1305,89 751,76 -42,43%
NEDAP 17301,72 12403,04 -28,31%
HEIJMANS 924,24 598,15 -35,28%
PHILIPS ELTN.KONINKLIJKE 1318,99 1453,16 10,17%
ARCADIS 170,87 112,09 -34,40%
BALLAST NEDAM 158,6 98,03 -38,19%
SLIGRO FOOD GROUP 799,96 866,02 8,26%
Mean -18,92%
1999 (rank 1998) 31-3-1999 31-3-2000
REED ELSEVIER (AMS) 6444,64 5106,22 -20,77%
RANDSTAD HOLDING 1155,82 1094,38 -5,32%
CORBION 9311,89 7586,07 -18,53%
FUGRO 148,79 360,91 142,56%
HEIJMANS 598,15 564,33 -5,65%
ROYAL IMTECH 751,76 908,59 20,86%
NUTRECO 202,91 195,79 -3,51%
BAM GROEP KON. 2187,83 2453,03 12,12%
WESSANEN 800,3 671,59 -16,08%
BETER BED HOLDING 211,59 219,2 3,60%
Mean 10,93%
2000 (rank 1999) 31-3-2000 31-3-2001
USG PEOPLE 3553,36 3633,63 2,26%
BETER BED HOLDING 219,2 87,19 -60,22%
ROYAL IMTECH 908,59 1093,78 20,38%
RANDSTAD HOLDING 1094,38 392,59 -64,13%
HEIJMANS 564,33 827,99 46,72%
BAM GROEP KON. 2453,03 3589,69 46,34%
POSTNL 105,48 108,02 2,41%
FUGRO 360,91 499,14 38,30%
NEDAP 15542,47 10460,3 -32,70%
NUTRECO 195,79 257,87 31,71%
Mean 3,11%
27
2001 (rank 2000) 31-3-2001 31-3-2002
USG PEOPLE 3633,63 4107,58 13,04%
PHILIPS ELTN.KONINKLIJKE 2292,37 2577,62 12,44%
ASML HOLDING 1798,93 2063,05 14,68%
BETER BED HOLDING 87,19 101,85 16,81%
HEIJMANS 827,99 944,38 14,06%
HEINEKEN 3564,92 3536,32 -0,80%
ARCADIS 140,5 174,44 24,16%
RANDSTAD HOLDING 392,59 519,33 32,28%
CORBION 9774,05 10004,85 2,36%
HUNTER DOUGLAS 523,58 619,86 18,39%
Mean 14,74%
2002 (rank 2001) 31-3-2002 31-3-2003
ORDINA 612,28 125,95 -79,43%
BETER BED HOLDING 101,85 32,78 -67,82%
STERN GROEP 807,84 784,06 -2,94%
DSM KONINKLIJKE 490,14 383,26 -21,81%
USG PEOPLE 4107,58 1800,43 -56,17%
HYDRATEC INDUSTRIES 43,56 33,38 -23,37%
MIKO 80,79 80,55 -0,30%
WESSANEN 767,19 425,78 -44,50%
AMSTERDAM COMMODITIES 34,14 32,82 -3,87%
CTAC NM 6,9 1,29 -81,30%
Mean -38,15%
2003 (rank 2002) 31-3-2003 31-3-2004
HEINEKEN 2596,13 2519,67 -2,95%
PICANOL 1151,85 1044,47 -9,32%
NEDAP 9506,1 20437,84 115,00%
MIKO 80,55 109,9 36,44%
MACINTOSH RETAIL 553,28 1132,99 104,78%
AMSTERDAM COMMODITIES
32,82 46,59 41,96%
ROYALREESINK 6084,44 7330,99 20,49%
SLIGRO FOOD GROUP 1115,84 1560,18 39,82%
HUNTER DOUGLAS 479,51 811,24 69,18%
POSTNL 65,71 82,84 26,07%
Mean 44,15%

28
2004 (rank 2003) 31-3-2004 31-3-2005
MELEXIS 145,45 158,63 9,06%
UCB 11237,56 13631 21,30%
AGFA-GEVAERT 96,31 134,45 39,60%
AMSTERDAM COMMODITIES 46,59 65,59 40,78%
MIKO 109,9 140 27,39%
ARCADIS 184,99 296,83 60,46%
RANDSTAD HOLDING 663,32 1062,83 60,23%
NEDAP 20437,84 26423,3 29,29%
MOBISTAR 174,43 221,3 26,87%
HUNTER DOUGLAS 811,24 794,76 -2,03%
Mean 31,29%
2005 (rank 2004) 31-3-2005 31-3-2006
MOBISTAR 221,3 200,08 -9,59%
CMB 51847,04 46672,28 -9,98%
BETER BED HOLDING 165,38 415,43 151,20%
MIKO 140 177,55 26,82%
POSTNL 109,21 146,05 33,73%
SIPEF 148,11 200,25 35,20%
MELEXIS 158,63 229,86 44,90%
AKZO NOBEL 1622,85 2091,4 28,87%
MACINTOSH RETAIL 2026,22 4799,79 136,88%
AMSTERDAM COMMODITIES
65,59 73,03 11,34%
Mean 44,94%
2006 (rank 2005) 31-3-2006 31-3-2007
CMB 46672,28 103435 121,62%
MELEXIS 229,86 251,66 9,48%
ARCELORMITTAL 117,76 150,67 27,95%
UCB 15071,93 16440,89 9,08%
LOTUS BAKERIES 546,51 852,61 56,01%
AKZO NOBEL 2091,4 2787,25 33,27%
POSTNL 146,05 179,62 22,99%
TKH GROUP 6859,47 9912,36 44,51%
ARCADIS 684,62 945,34 38,08%
BRILL (KON.) 185,69 237,15 27,71%
Mean 39,07%

29
2007 (rank 2006) 31-3-2007 31-3-2008
MELEXIS 251,66 193,86 -22,97%
NEWAYS ELEC.INTL. 160,71 152,38 -5,18%
ROYAL IMTECH 3097,54 2957,25 -4,53%
JENSEN-GROUP 34,27 52,45 53,05%
BELGACOM 149,48 132,16 -11,59%
AKZO NOBEL 2787,25 2547,76 -8,59%
POSTNL 179,62 126,05 -29,82%
UNILEVER CERTS. 8326,39 8384,23 0,69%
MACINTOSH RETAIL 5836 3769,5 -35,41%
ARCADIS 945,34 764,94 -19,08%
Mean -8,34%
2008 (rank 2007) 31-3-2008 31-3-2009
REED ELSEVIER (AMS) 7148,87 4948,95 -30,77%
MOBISTAR 213,1 197,95 -7,11%
BETER BED HOLDING 346,08 196,99 -43,08%
UMICORE 406,83 174,07 -57,21%
CMB 92900,5 38969,02 -58,05%
RANDSTAD HOLDING 975,86 439,54 -54,96%
NEWAYS ELEC.INTL. 152,38 38,76 -74,56%
HAMON & CIE 57,82 38,85 -32,81%
SIPEF 500,62 286,43 -42,78%
MELEXIS 193,86 69,31 -64,25%
Mean -46,56%
2009 (rank 2008) 31-3-2009 31-3-2010
BETER BED HOLDING 196,99 564,22 186,42%
MOBISTAR 197,95 204,75 3,44%
ATENOR GROUP 2211,61 2517,27 13,82%
HAMON & CIE 38,85 60,91 56,78%
UNILEVER CERTS. 6072,99 9633,32 58,63%
CMB 38969,02 59357,83 52,32%
NEDAP 16275,76 19379,54 19,07%
FUGRO 839,52 1787,83 112,96%
AMSTERDAM COMMODITIES
91,95 159,73 73,71%
AHOLD KON. 1775,01 2169,43 22,22%
Mean 59,94%

30
2010 (rank 2009) 31-3-2010 31-3-2011
REED ELSEVIER (AMS) 5794,46 6100,85 5,29%
MOBISTAR 204,75 237,8 16,14%
AMSTERDAM COMMODITIES
159,73 316,52 98,16%
BELGACOM 154,34 154,83 0,32%
LOTUS BAKERIES 1435,09 1564,33 9,01%
MIKO 170,99 175,27 2,50%
UNILEVER CERTS. 9633,32 9883,12 2,59%
AHOLD KON. 2169,43 2128,7 -1,88%
FUGRO 1787,83 2371,65 32,66%
ARCADIS 1010,37 1134,94 12,33%
Mean 17,71%
2011 (rank 2010) 31-3-2011 31-3-2012
MELEXIS 253,53 278,13 9,70%
MOBISTAR 237,8 193,93 -18,45%
BELGACOM 154,83 145,47 -6,05%
KENDRION 255,39 288,39 12,92%
UNILEVER CERTS. 9883,12 11839,45 19,79%
BEKAERT (D) 13126,27 4040,08 -69,22%
LOTUS BAKERIES 1564,33 1995,07 27,54%
MIKO 175,27 169,5 -3,29%
BRILL (KON.) 167,13 228,78 36,89%
AHOLD KON. 2128,7 2408,31 13,14%
Mean 2,30%
2012 (rank 2011) 31-3-2012 31-3-2013
MELEXIS 278,13 319,59 14,91%
MOBISTAR 193,93 100,61 -48,12%
UMICORE 557,73 505,23 -9,41%
LOTUS BAKERIES 1995,07 2731,75 36,93%
AHOLD KON. 2408,31 2883,37 19,73%
MACINTOSH RETAIL 2614,37 2300,01 -12,02%
UNILEVER CERTS. 11839,45 15353,37 29,68%
BELGACOM 145,47 127,16 -12,59%
TKH GROUP 14064,66 14564,56 3,55%
KINEPOLIS GROUP 198,54 283,09 42,59%
Mean 6,52%

31
2013 (rank 2012) 31-3-2013 31-3-2014
MELEXIS 319,59 630,33 97,23%
BETER BED HOLDING 477,61 557,27 16,68%
ECONOCOM GROUP 1653,99 2214,88 33,91%
POSTNL 23,17 49,2 112,34%
JENSEN-GROUP 83,82 106,35 26,88%
MOBISTAR 100,61 84,75 -15,76%
UNILEVER CERTS. 15353,37 14868,22 -3,16%
INTERCULTURES 3728,77 3127,29 -16,13%
KENDRION 288,02 388,95 35,04%
LOTUS BAKERIES 2731,75 3361,85 23,07%
Mean 31,01%
2014 (rank 2013) 31-3-2014 31-3-2015
UNILEVER CERTS. 14868,22 20092,74 35,14%
ECONOCOM GROUP 2214,88 1985,94 -10,34%
KINEPOLIS GROUP 417,32 533,6 27,86%
LOTUS BAKERIES 3361,85 5019,51 49,31%
ANHEUSER-BUSCH INBEV 437,07 668,47 52,94%
SIPEF 767,73 689,3 -10,22%
AMSTERDAM COMMODITIES
594,25 893,24 50,31%
ARCADIS 2017,51 2210,91 9,59%
BOSKALIS WESTMINSTER 1272,39 1504,47 18,24%
BELGACOM 162,59 249,93 53,72%
Mean 27,66%

32
Appendix B: Risk Free Rates and Excess Returns
Risk Free Rates (1)
MF Returns (2)
Benelux Returns (3)
(2) - (1) (3) - (1)
1995 5,95% 31,72% 20,16% 25,77% 14,21%
1996 5,20% 40,10% 23,43% 34,90% 18,23%
1997 5,19% 45,43% 30,78% 40,24% 25,59%
1998 5,32% -18,92% 4,90% -24,24% -0,42%
1999 4,49% 10,93% 4,54% 6,44% 0,05%
2000 5,48% 3,11% -18,30% -2,37% -23,78%
2001 5,87% 14,74% -5,35% 8,87% -11,22%
2002 1,74% -38,15% -30,52% -39,89% -32,26%
2003 1,22% 44,15% 48,71% 42,93% 47,49%
2004 0,93% 31,29% 24,23% 30,36% 23,30%
2005 2,32% 44,94% 21,34% 42,62% 19,02%
2006 4,16% 39,07% 25,08% 34,91% 20,92%
2007 5,07% -8,34% 1,78% -13,41% -3,29%
2008 3,26% -46,56% -60,51% -49,82% -63,77%
2009 0,08% 59,94% 67,11% 59,86% 67,03%
2010 0,08% 17,71% 8,57% 17,63% 8,49%
2011 0,15% 2,30% -13,51% 2,15% -13,66%
2012 0,02% 6,52% 10,67% 6,50% 10,65%
2013 0,08% 31,01% 21,42% 30,93% 21,34%
2014 0,07% 27,66% 0,07% 27,59% 0,00%
Mean 2,83% 16,93% 9,23% 14,10% 6,40%