magnetic field sensors applied to electropolishing of superconducting rf tesla-type cavities
TRANSCRIPT
www.elsevier.com/locate/physc
Physica C 441 (2006) 243–248
Magnetic field sensors applied to electropolishingof superconducting RF TESLA-type cavities q
C. Bonavolonta a,b,c,*, M. Valentino c, V. Palmieri b, V. Rampazzo c
a Department of Materials and Production Engineering, University of Naples, ‘‘Federico II’’, Italyb Istituto Nazionale Fisica Nucleare, Legnaro National Laboratories, Legnaro (PD), Italy
c Coherentia CNR – INFM, Naples, Italy
Available online 3 May 2006
Abstract
In this work an electromagnetic non-invasive and contact-less technique using Flux-Gate first-order gradiometer is proposed to detectthe magnetic field distribution during electropolishing of copper surface. The electropolishing of the copper surface employed in super-conducting RF TESLA-type cavities has been monitored using magnetic field sensors. Local information regarding the dissolved coppersurface during the electropolishing process has been obtained. An electromagnetic inversion of the magnetic field imaging have beenimplemented to better understand the effect of the cathode geometry on the electropolishing process.� 2006 Elsevier B.V. All rights reserved.
Keywords: First-order electronic gradiometer; Flux Gate; Electropolishing; Magnetic inversion
1. Introduction
To improve the technology of superconducting RF cav-ities increasing the accelerating energies and saving thepower dissipation, niobium thin film is sputtered on theinner cavity copper surface. This approach offers a consid-erably higher stability against quenching, insensitivity tosmall magnetic fields and a higher quality factor than thatof bulk niobium at working temperature (4.2–4.5 K). Inorder to obtain the required performance in a supercon-ducting RF cavity, such as high acceleration gradient withlow power losses, an extremely high quality Nb supercon-ducting surface is required.
The Nb surface quality plays an important role in theRF cavities performance. In fact, some limitations couldbe rise from defects or scratches on the Nb surface. The lat-ter could produce thermal instability due to a niobium par-
0921-4534/$ - see front matter � 2006 Elsevier B.V. All rights reserved.
doi:10.1016/j.physc.2006.03.058
q Work supported by CARE project, number RII3-CT-2003-506395.* Corresponding author. Address: Istituto Nazionale Fisica Nucleare,
Legnaro National Laboratories, Legnaro (PD), Italy.E-mail address: [email protected] (C. Bonavolonta).
ticle with bad thermal contact to the copper surface or aniobium tip, where the field enhancement leads to a break-down of superconductivity. Moreover, field emissionscould take place because the high surface electric fields leadto electron emission from scratches or particles located onthe surface via electron tunneling. This process dissipatespower and therefore can cause an exponential decrease ofthe quality factor with the accelerating field. Since the Nbthin film is deposited by using a magnetron sputtering toavoid any contaminations and defects of the Nb film, thecopper surface preparation before Nb coating representsa crucial step in the fabrication process of RF cavities.For this reason the quality control of the copper surfacerequires an ongoing monitoring of the process by a suitabletechnique. Most conventional electrochemical tests needsthat reference or standard electrodes can be introduced inthe solution to obtain a measurements of the potentials,but this necessarily perturbs the system. An alternativetechnique is represented by the measurements of the I–V
characteristic of the electrochemical cell. This methodallows to control the process of not easily accessible cav-ity shape, but does not give spatial information on the
244 C. Bonavolonta et al. / Physica C 441 (2006) 243–248
electropolishing copper surface. To overcome this limita-tion electromagnetic technique based on magnetic sensorscould be considered. The advantage due to the applicationof the magnetic field monitoring respect to the current–voltage technique concerns the possibility to obtain a localinformation, in a non-invasive way, of the ongoing polish-ing process over the copper surface even when its shapecould be very complex.
In order to achieve the ongoing monitoring of the qual-ity control of the copper surface, it is necessary to choosethe most suitable sensor considering its magnetic field sen-sitivity, spatial resolution and the frequency bandwidth.Examples of magnetic sensors that can be applied in elec-tromagnetic inspections are Flux Gate, Hall probe, GMR(Giant-Magneto Resistance), and low and high tempera-ture SQUIDs (Superconducting QUantum InterferenceDevices) that represent the most sensitive but also the mostexpensive sensors. Instead the other mentioned deviceworks at room temperature and are cheaper than SQUIDs.The Flux-Gate magnetometers have a higher magnetic fieldsensitivity (10 pT=
ffiffiffiffiffiffiffiHzp
at 1 Hz) than the Hall probes andthe GMR. The latter is a emerging magnetic sensor thatpotentially could be more sensitive than Flux Gate [1].The last two type of sensors generally are characterizedby a sensitivity less than 1 T, a good spatial resolution lessthan 100 lm, and a wide frequency bandwidth (300–400 kHz).
The aim of this work is to show how the magnetometrycan be a suitable and useful diagnostic technique to per-form the quality control of the materials employed in theRF cavities fabrication. In this paper the electromagnetic
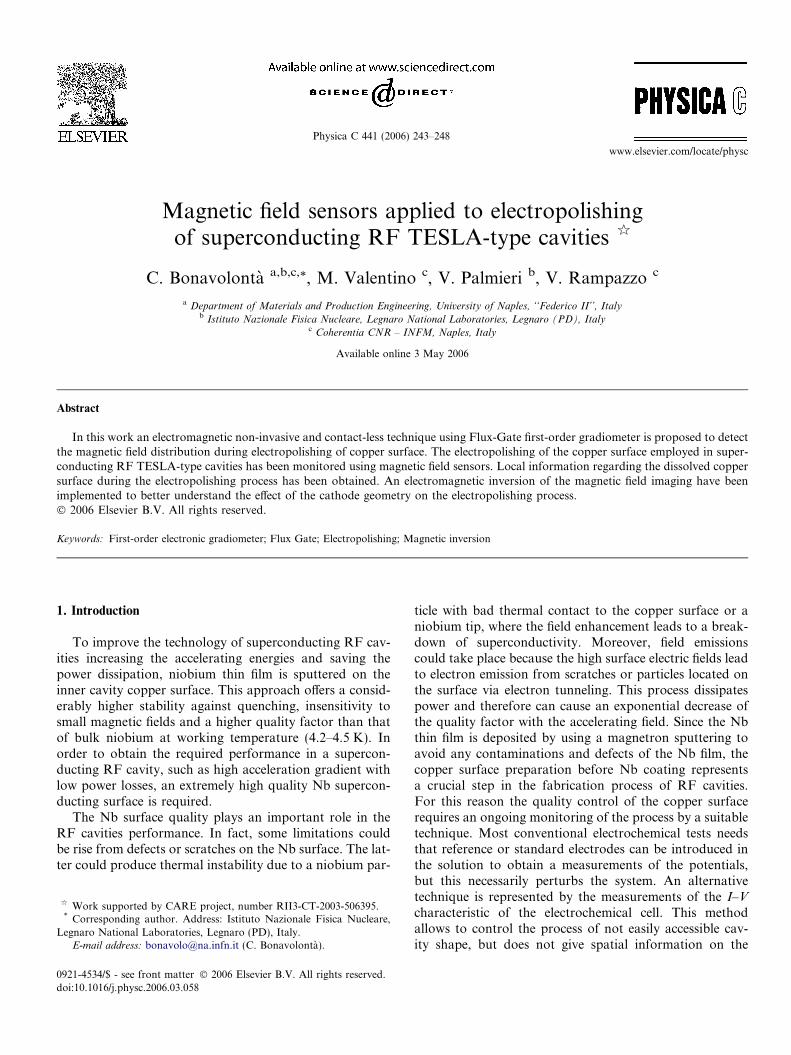
Fig. 1. The electrolytic cells monitored: (a) rectangular cell, (b) and
techniques based on magnetic sensors used for the qualitycontrol of RF cavities have been reported. The experimen-tal results has been obtained using a simple mock-up of theRF cavity. Static and dynamic measurement of the in planemagnetic field component during the electropolishing ofthe copper surface, using a Flux-Gate first-order electronicgradiometer, has been carried out. Moreover, an electro-magnetic inversion of the magnetic field distribution basedon fast Fourier transform (FFT) has been performed tocalculate the current density distribution due to the electro-polishing process. The knowledge of the current densitydistribution allows to obtain information about the electro-chemical activity respect to the cathode geometry.
2. Experimental
In this work the electropolishing of copper surface withdifferent geometries has been monitored. The electrolyticcells are shown in Fig. 1.
Cells with rectangular electrodes (Fig. 1(a)) of differentwidth: 8 mm, 16 mm and 24 mm, and cells characterizedby iris-like anode and flat or shaped cathodes (Fig. 1(b)and (c), respectively) have been tested. The electrolyticsolution was 55% phosphoric acid and 45% n-butanol.During the electropolishing process that was driving involtage, the Flux-Gate first-order electronic gradiometermeasured the in-plane component of the magnetic field gra-dient, Gx, due to the current distribution between the twoelectrodes.
A magnetic imaging of ongoing electropolishing processhave been carried out moving the sensors over the cells area
(c) cavity-like shape with flat and shaped cathode, respectively.
C. Bonavolonta et al. / Physica C 441 (2006) 243–248 245
(within the electrodes), with a speed of 3 mm/s and a contin-uous acquisition mode with 6 data points/mm. In both cellsgeometry (rectangular and cavities shape) the magnetic fieldimaging is represented by a matrix in which the columns arethe line scans obtained moving the Flux-Gate first-orderelectronic gradiometer from the anode to the cathode.The Flux-Gate sensor is a solid state device based on thenon-linearity of the magnetic characteristic of its sensingferromagnetic core. It can measure the dc or the low fre-quency ac magnetic field component, with a field sensitivityranging from 10�11 to 10�4 T. A Flux-Gate sensor is madeof Fe–Ni high permeability cylindrical core around whichthere are two coaxial coils: bias coil and sensing coil. Thissensor detect directly variation of the magnetic field gener-ally using a phase sensitive detection (PSD), in this way itworks in a bandwidth ranging from dc to 5 kHz.
3. Flux-Gate magnetometry applied to the electropolishing
of copper
It was already demonstrated [2] that it is possible to con-trol the electrolytic polishing of metal, following the mag-netic polarization curve. The experimental measurementswere carried out driving the cell in voltage and positioningthe Flux-Gate sensors above the electrodes (cathode oranode).
Increasing the current value, the magnetic field versusthe voltage is monitored. In this way the H–V polarizationcurve can be obtained.
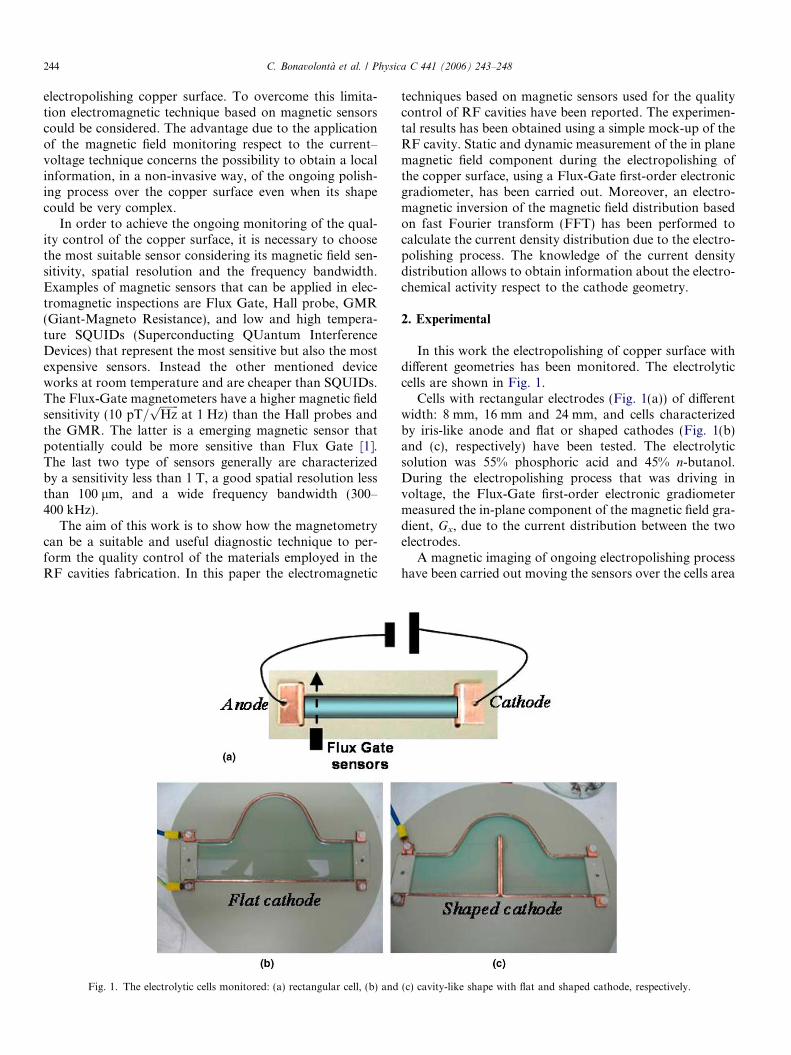
Comparing the H–V and I–V polarization curves(Fig. 2) it is possible to identify the three different regionsthat characterize the process: pitting (a), polishing (b)and the gas evolution (c).
This result means that to have information about theelectropolishing process, magnetic measurements with con-tactless sensors are reliable as such as the current measure-ment. The advantage of magnetic measurements is due tothe possibility to control the electropolishing process with-out intrusive probes, independently of the shape anddimension of the cell surface. Moreover, using the magnetic
Fig. 2. H–V and I–V polarization curve.
field the best working point and polishing condition can beachieved.
During the electrolytic process there is a flow of ionsfrom the anode to the cathode that produce a correspond-ing magnetic field, which can be monitored by the Flux-Gate sensors. Using the magnetic field produced by theions a very simple model can be applied to evaluate theanode oxidation. If every ion is approximated by a chargeq with a speed v, the produced magnetic field at distance r
can be represented as follow:
~B ¼ l0
4pq~v�~r~r3
ð1Þ
where l0 (4p · 10�7 T m/A) is the permeability of the freespace. Since the Flux-Gate sensors measure the in-planecomponent of the field Bx, produced by the current jyorthogonal to the electrode, the module of magnetic fieldbecomes
Bx ¼l0
4pq
vr2
ð2Þ
the speed v can be obtained considering that the currentdensity j is j = Nqv, where N is the number of ions per vol-ume N = n/V (m�3). Then the magnetic field can be writtenas
Bx ¼l0
4pjSlnr2
ð3Þ
from this equation it is possible to obtain the number ofions n, that start from the anode and go in the solution:
n ¼ l0
4pjSlBxr2
ð4Þ
Using the Faraday law,
w ¼ jStMnF
ð5Þ
where w is the dissolved copper at the anode, S is the crosssection of the cell, t is the time during the measurement, M
(63.456 g/mole) is the copper atomic mass and F
(96500 A s/mole) is the Faraday constant. ConsideringEq. (4) the Faraday law can be written as
w ¼ 4pBxMr2tl0lF
ð6Þ
which can be used to calculate the corrosion rate w/t.This simplified model has been used to estimate the dis-
solved copper of the anode, for cells with length of 50 mmand different width (8 mm, 16 mm, 24 mm) using a staticmeasurement of the magnetic field across the anode.
The data reported in Tables 1 and 2 indicates the dis-solved copper (w) at the anode in correspondence of theplateau (4 V) and at 7 V, respectively, during 5 min of cor-rosion process.
The data calculated using the simple model previouslydescribed has been compared with the results obtainedweighing the electrode after the magnetic measurementby means of a balance with a sensitivity of 10�4 g. It could
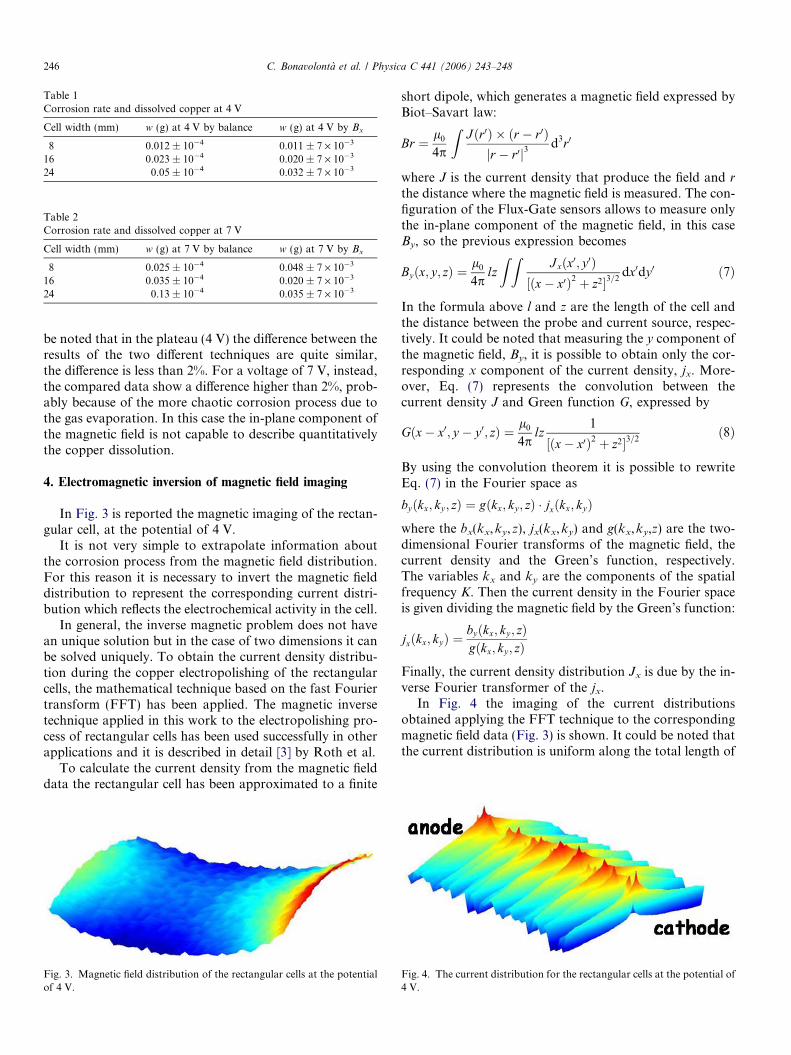
Table 1Corrosion rate and dissolved copper at 4 V
Cell width (mm) w (g) at 4 V by balance w (g) at 4 V by Bx
8 0.012 ± 10�4 0.011 ± 7 · 10�3
16 0.023 ± 10�4 0.020 ± 7 · 10�3
24 0.05 ± 10�4 0.032 ± 7 · 10�3
Table 2Corrosion rate and dissolved copper at 7 V
Cell width (mm) w (g) at 7 V by balance w (g) at 7 V by Bx
8 0.025 ± 10�4 0.048 ± 7 · 10�3
16 0.035 ± 10�4 0.020 ± 7 · 10�3
24 0.13 ± 10�4 0.035 ± 7 · 10�3
246 C. Bonavolonta et al. / Physica C 441 (2006) 243–248
be noted that in the plateau (4 V) the difference between theresults of the two different techniques are quite similar,the difference is less than 2%. For a voltage of 7 V, instead,the compared data show a difference higher than 2%, prob-ably because of the more chaotic corrosion process due tothe gas evaporation. In this case the in-plane component ofthe magnetic field is not capable to describe quantitativelythe copper dissolution.
4. Electromagnetic inversion of magnetic field imaging
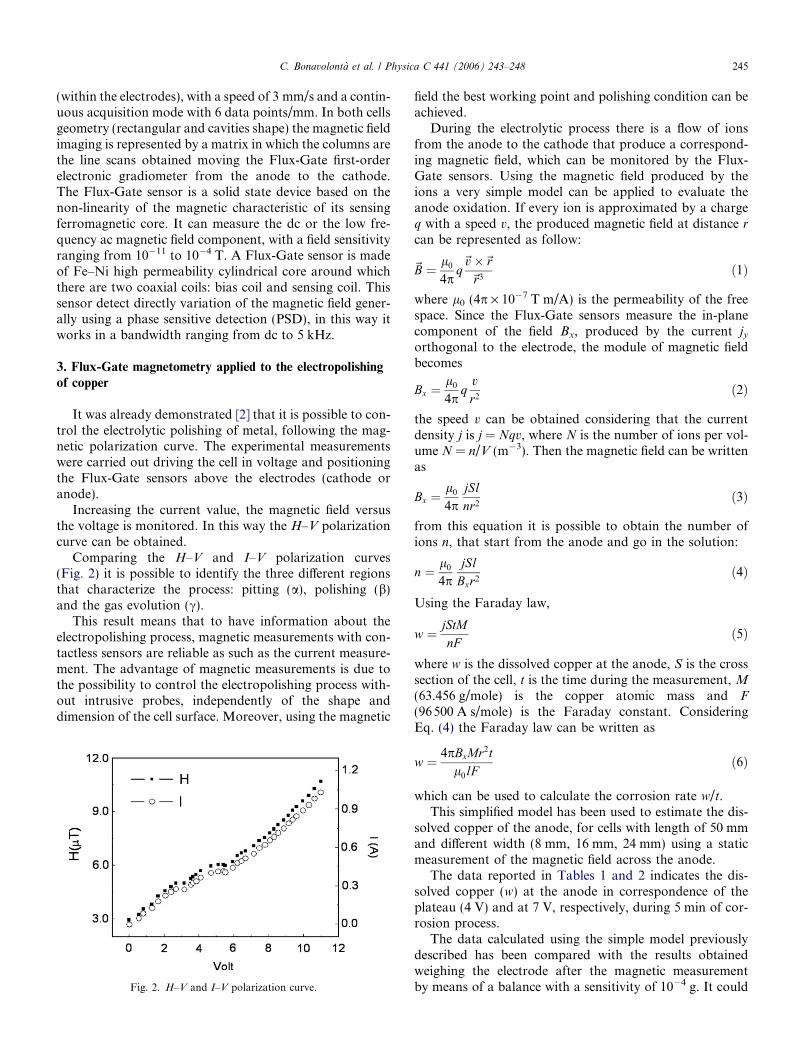
In Fig. 3 is reported the magnetic imaging of the rectan-gular cell, at the potential of 4 V.
It is not very simple to extrapolate information aboutthe corrosion process from the magnetic field distribution.For this reason it is necessary to invert the magnetic fielddistribution to represent the corresponding current distri-bution which reflects the electrochemical activity in the cell.
In general, the inverse magnetic problem does not havean unique solution but in the case of two dimensions it canbe solved uniquely. To obtain the current density distribu-tion during the copper electropolishing of the rectangularcells, the mathematical technique based on the fast Fouriertransform (FFT) has been applied. The magnetic inversetechnique applied in this work to the electropolishing pro-cess of rectangular cells has been used successfully in otherapplications and it is described in detail [3] by Roth et al.
To calculate the current density from the magnetic fielddata the rectangular cell has been approximated to a finite
Fig. 3. Magnetic field distribution of the rectangular cells at the potentialof 4 V.
short dipole, which generates a magnetic field expressed byBiot–Savart law:
Br ¼ l0
4p
ZJðr0Þ � ðr � r0Þjr � r0j3
d3r0
where J is the current density that produce the field and r
the distance where the magnetic field is measured. The con-figuration of the Flux-Gate sensors allows to measure onlythe in-plane component of the magnetic field, in this caseBy, so the previous expression becomes
Byðx; y; zÞ ¼l0
4plzZ Z
J xðx0; y0Þ½ðx� x0Þ2 þ z2�3=2
dx0dy0 ð7Þ
In the formula above l and z are the length of the cell andthe distance between the probe and current source, respec-tively. It could be noted that measuring the y component ofthe magnetic field, By, it is possible to obtain only the cor-responding x component of the current density, jx. More-over, Eq. (7) represents the convolution between thecurrent density J and Green function G, expressed by
Gðx� x0; y � y 0; zÞ ¼ l0
4plz
1
½ðx� x0Þ2 þ z2�3=2ð8Þ
By using the convolution theorem it is possible to rewriteEq. (7) in the Fourier space as
byðkx; ky ; zÞ ¼ gðkx; ky ; zÞ � jxðkx; kyÞwhere the bx(kx,ky,z), jx(kx,ky) and g(kx,ky,z) are the two-dimensional Fourier transforms of the magnetic field, thecurrent density and the Green’s function, respectively.The variables kx and ky are the components of the spatialfrequency K. Then the current density in the Fourier spaceis given dividing the magnetic field by the Green’s function:
jxðkx; kyÞ ¼byðkx; ky ; zÞgðkx; ky ; zÞ
Finally, the current density distribution Jx is due by the in-verse Fourier transformer of the jx.
In Fig. 4 the imaging of the current distributionsobtained applying the FFT technique to the correspondingmagnetic field data (Fig. 3) is shown. It could be noted thatthe current distribution is uniform along the total length of
Fig. 4. The current distribution for the rectangular cells at the potential of4 V.
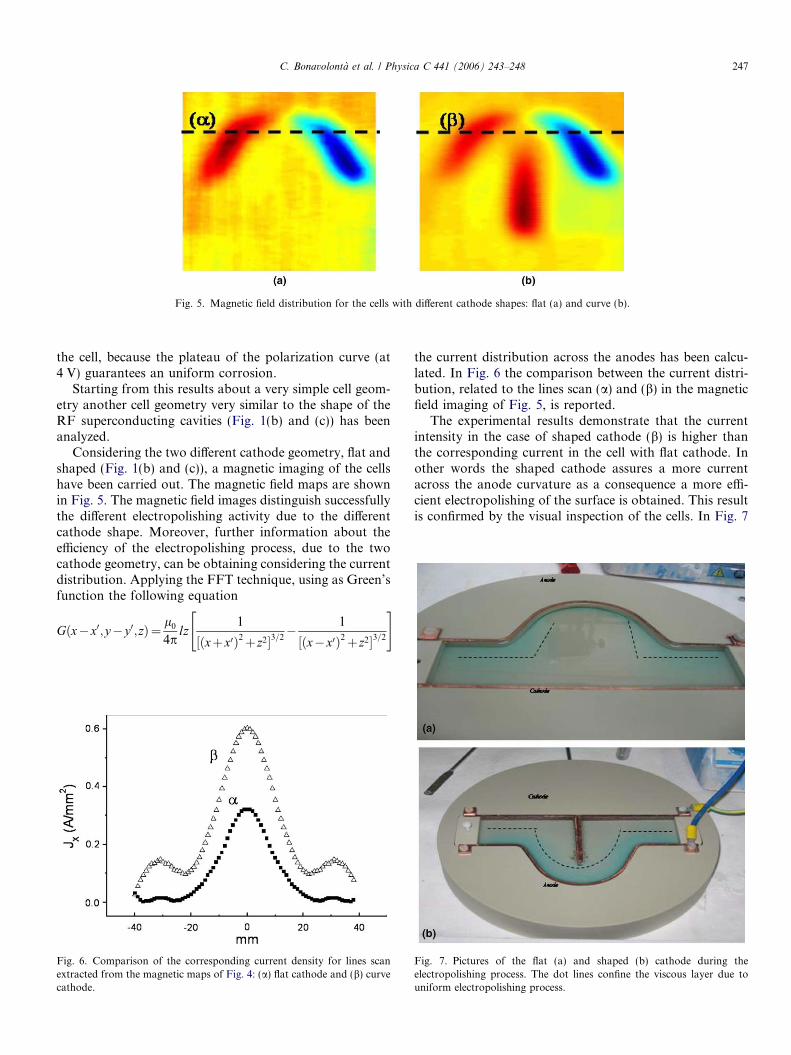
Fig. 5. Magnetic field distribution for the cells with different cathode shapes: flat (a) and curve (b).
C. Bonavolonta et al. / Physica C 441 (2006) 243–248 247
the cell, because the plateau of the polarization curve (at4 V) guarantees an uniform corrosion.
Starting from this results about a very simple cell geom-etry another cell geometry very similar to the shape of theRF superconducting cavities (Fig. 1(b) and (c)) has beenanalyzed.
Considering the two different cathode geometry, flat andshaped (Fig. 1(b) and (c)), a magnetic imaging of the cellshave been carried out. The magnetic field maps are shownin Fig. 5. The magnetic field images distinguish successfullythe different electropolishing activity due to the differentcathode shape. Moreover, further information about theefficiency of the electropolishing process, due to the twocathode geometry, can be obtaining considering the currentdistribution. Applying the FFT technique, using as Green’sfunction the following equation
Gðx�x0;y� y0;zÞ¼ l0
4plz
1
½ðxþx0Þ2þ z2�3=2� 1
½ðx�x0Þ2þ z2�3=2
" #
Fig. 6. Comparison of the corresponding current density for lines scanextracted from the magnetic maps of Fig. 4: (a) flat cathode and (b) curvecathode.
the current distribution across the anodes has been calcu-lated. In Fig. 6 the comparison between the current distri-bution, related to the lines scan (a) and (b) in the magneticfield imaging of Fig. 5, is reported.
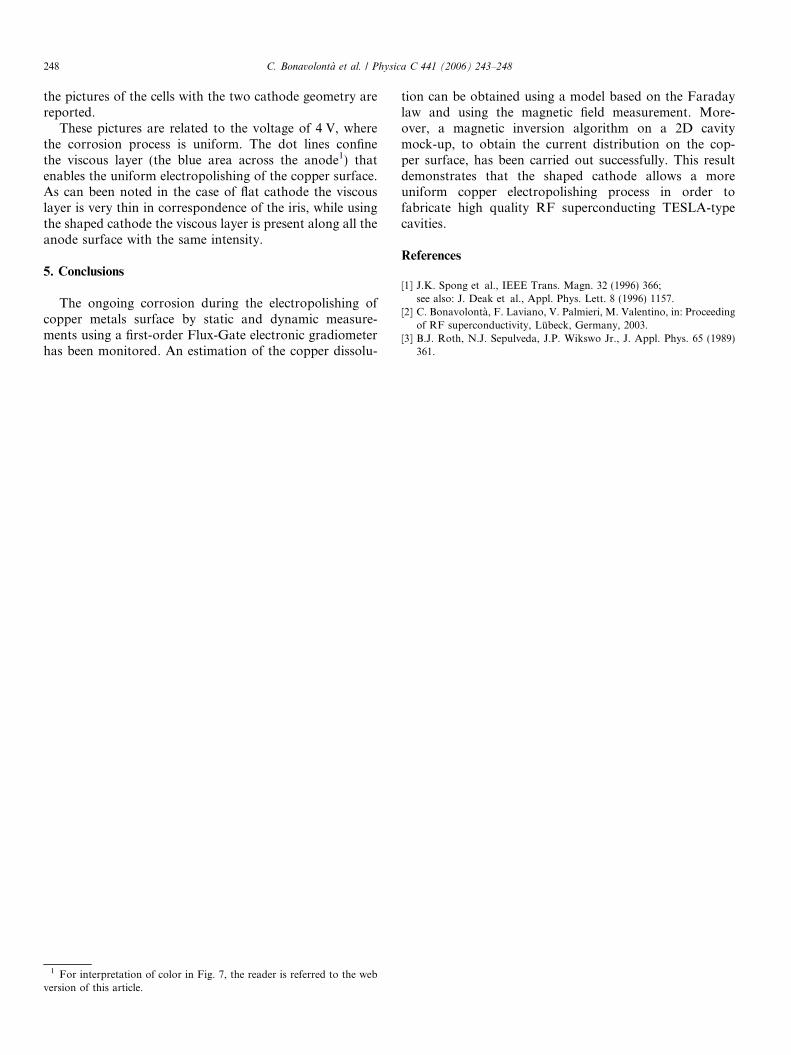
The experimental results demonstrate that the currentintensity in the case of shaped cathode (b) is higher thanthe corresponding current in the cell with flat cathode. Inother words the shaped cathode assures a more currentacross the anode curvature as a consequence a more effi-cient electropolishing of the surface is obtained. This resultis confirmed by the visual inspection of the cells. In Fig. 7
Fig. 7. Pictures of the flat (a) and shaped (b) cathode during theelectropolishing process. The dot lines confine the viscous layer due touniform electropolishing process.
248 C. Bonavolonta et al. / Physica C 441 (2006) 243–248
the pictures of the cells with the two cathode geometry arereported.
These pictures are related to the voltage of 4 V, wherethe corrosion process is uniform. The dot lines confinethe viscous layer (the blue area across the anode1) thatenables the uniform electropolishing of the copper surface.As can been noted in the case of flat cathode the viscouslayer is very thin in correspondence of the iris, while usingthe shaped cathode the viscous layer is present along all theanode surface with the same intensity.
5. Conclusions
The ongoing corrosion during the electropolishing ofcopper metals surface by static and dynamic measure-ments using a first-order Flux-Gate electronic gradiometerhas been monitored. An estimation of the copper dissolu-
1 For interpretation of color in Fig. 7, the reader is referred to the webversion of this article.
tion can be obtained using a model based on the Faradaylaw and using the magnetic field measurement. More-over, a magnetic inversion algorithm on a 2D cavitymock-up, to obtain the current distribution on the cop-per surface, has been carried out successfully. This resultdemonstrates that the shaped cathode allows a moreuniform copper electropolishing process in order tofabricate high quality RF superconducting TESLA-typecavities.
References
[1] J.K. Spong et al., IEEE Trans. Magn. 32 (1996) 366;see also: J. Deak et al., Appl. Phys. Lett. 8 (1996) 1157.
[2] C. Bonavolonta, F. Laviano, V. Palmieri, M. Valentino, in: Proceedingof RF superconductivity, Lubeck, Germany, 2003.
[3] B.J. Roth, N.J. Sepulveda, J.P. Wikswo Jr., J. Appl. Phys. 65 (1989)361.