magnetic resonance imaging and nuclear magnetic resonance
TRANSCRIPT

Svensk Kärnbränslehantering ABSwedish Nuclear Fueland Waste Management Co
Box 250, SE-101 24 Stockholm Phone +46 8 459 84 00
Technical Report
TR-09-27
ISSN 1404-0344CM Gruppen AB, Bromma, 2009
Magnetic resonance imaging and nuclear magnetic resonance investigations of bentonite systems
Sergey V Dvinskikh, István Furó
Industrial NMR Centre and Division of Physical Chemistry
Department of Chemistry, Royal Institute of Technology
September 2009

Tänd ett lager:
P, R eller TR.
Magnetic resonance imaging and nuclear magnetic resonance investigations of bentonite systems
Sergey V Dvinskikh, István Furó
Industrial NMR Centre and Division of Physical Chemistry
Department of Chemistry, Royal Institute of Technology
September 2009
This report concerns a study which was conducted for SKB. The conclusions and viewpoints presented in the report are those of the authors and do not necessarily coincide with those of the client.
A pdf version of this document can be downloaded from www.skb.se.
3
Summary
This report summarizes results from a set of magnetic resonance imaging (MRI) and nuclear magnetic resonance (NMR) experiments performed on Ca and Na montmorillonite samples interacting with water. The primary goal with these studies was to provide, in a non-invasive manner, a quantitative measure of bentonite distribution in extended samples during and after different physical processes such as swelling and sedimentation and on the time scale from minutes to years. Additionally, we also studied the distribution of foreign particles (such as native minerals as well as magnetic model particles) within bentonite systems and performed some diffusion NMR experiments with the aim of characterizing the state of colloids that form after clay dissolution. Both natural montmorillonites and purified and ion-exchanged montmorillonite clays were investigated. The primary variables were clay composition and water ionic strength. Bulk samples confined in a vertical tube and in a horizontal channel were investigated.
A critical issue for the stability of clay buffer layer in deep underground repository is to prevent or minimize the release of clay particles into the water phase. In our experiments, the most significant particle losses were found for Na-MX80 clay exposed to water with low ionic strength. With increas-ing the concentration of CaCl2 in the water phase both swelling and particle release are slowed down but not completely eliminated due probably to gradual change of water ion content via ion exchange with the clay itself. For natural MX80 samples, in spite of significant swelling expansion, no clay particle release above the sensitivity limit of 0.001 volume% was observed. Ca-MX80 exhibited the smallest expansion and no trace of clay particle released into the aqueous phase.
4
Sammanfattning
Här sammanfattas resultat från en serie experiment via spektroskopisk och avbildande NMR på prover av Ca- och Na-montmorillonitleror i växelverkan med vatten. Huvudmålet för dessa studier har varit att genom icke-störande NMR-tekniker kvantitativt karakterisera bentonitfördelningen över provvolymen efter och under processer såsom svällning och sedimentering och över tidskalor som sträcker sig från minuter till år. Dessutom studerades också fördelningen av partiklar (mineraler i leran men också magnetiska modellpartiklar som blandades in i proverna) inom bentoniten. NMR-baserade diffusionsmätningar genomfördes också för att karaktärisera de kolloidala partiklar som bildas efter lerans upplösning. Härvid studerades båda naturlig montmorillonit och renade och jonbytta montmorillonitleror med avseende på lerans samansättning och vattnets jonstyrka. Såväl inneslutning inom vertikalt orienterade rör och horisontellt orienterade kanaler studerades.
En viktig fråga för stabiliteten av lerbuffertlager i en konstruktion för slutförvaring av kärnavfall är förebyggandet eller förminskandet av förlust av lerpartiklar från bufferten till vattenfasen. I våra experiment detekterades signifikant sådan förlust för Na-MX80 lera som utsattes för svällning i vatten vid låg jonstryka. Med ökande koncentration av CaCl2 i vattenfasen minskade här hastigheter för både svällning och partikelförlust. Dock kunde dessa processer inte elimineras helt, antagligen på grund av den konstanta förändringen av jonstyrkan via jonbyte med leran själv. I naturliga MX80-prover, kunde ingen förlust av lerpartiklar uppmätas (ovanför känslighetsgränsen på 0,001 volym % lera) trots betydande svällning. Ca-MX80 uppvisade de minsta expansionstendenserna, utan märkbart spår av partikelförlust till vattenfasen.
5
Contents
1 Introduction 71.1 Summary of basic experimental principles 71.2 Summary of practical and experimental considerations 71.3 Principles of quantitative imaging of bentonite content 8
2 Samplepreparation 92.1 Compacted pellets for vertical swelling experiments 92.2 Clay mixed with superparamagnetic particles 102.3 Clay suspensions 10
3 One-dimensionalverticalswelling 113.1 Conventional MR imaging and visual observation 113.2 Clay composition effects in swelling 133.3 Detecting dispersion 153.4 Solvent composition effects in swelling 153.5 Water exchange and diffusion in the evolving gel: swelling experiments
with D2O 163.6 23Na imaging and release: demonstration 18
4 Swellinginhorizontalslit 19
5 Sedimentation 21
6 Detectingforeignparticles 236.1 Direct imaging of natural foreign particles in MX80 236.2 Direct imaging of superparamagnetic foreign particles
in Na-MX80. 24
7 Diffusion 27
References 28
7
1 Introduction
1.1 SummaryofbasicexperimentalprinciplesMRI and NMR experiments are closely related. MRI is actually NMR spectroscopy performed on a spatially resolved manner. In NMR, we detect the signal arising from nuclear spins. This signal appears at a characteristic frequency (called Larmor frequency) that is defined on one hand by the atom and isotope type and on the other hand by the magnetic field used in the NMR/MRI instrumentation. It is the field dependence of the Larmor frequency that is exploited for acquiring MR images. During MRI, the signal is recorded in the presence of a linearly varying magnetic field, typically called magnetic field gradient, and from the resulting distribution of Larmor frequencies one can reconstruct the distribution of the atomic/isotopic species in question with a typical resolu-tion of 100 µm. Additionally, with suitably chosen MRI experiments one can measure not only the distribution of the material density but also the spatial distribution of any parameter accessible by NMR spectroscopy. Hence, one can obtain images of spin relaxation rates/times or diffusion coef-ficients. It is an important feature of MRI/NMR that the detected signal is linearly proportional to the concentration of the atoms that bear the detected nuclear spins. Hence, MR images are inherently quantitative.
The atom and isotope specificity of the Larmor frequency additionally provides that NMR can, in principle, detect signal on an element and isotope selective manner. In other words and with bentonite as example, we can obtain the distribution of water (by 1H MRI) in a swelling system but can also measure in the same system the distribution of sodium ions (by 23Na MRI). While with standard MRI approaches it is only free ions that can be imaged, by employing advanced solid state MRI methods one could also image the distribution of the bound sodium ions albeit at the expense of measurement time and spatial resolution.
NMR/MRI experiments exploit the nuclear spins and involve excitations at very low (several order of magnitude below thermal excitations at room temperature) energy. Hence, NMR/MRI experi-ments do not in any measurable way disturb the physical/chemical state of the sample. Moreover, the experiments do not involve any mechanical disturbance, such as taking small portions out of the investigated material. Hence, the same undisturbed sample can be investigated over and over again which means that its time evolution can be followed on a convenient and straightforward manner.
1.2 SummaryofpracticalandexperimentalconsiderationsFamiliar medical MRI scanners operate with magnets where the measurement region inside the magnet is sufficiently extensive to include patients. Medical MRI scanners, however, suffer from poor signal if applied to samples of significantly smaller size than human body or body parts. In our laboratory, we specialize in material investigations by MRI/NMR and therefore we have magnet systems that can investigate smaller samples only but on a more sensitive manner. The geometry of those magnets and the attached probes is such that samples of cylindrical-like form and with max a few cm diameter can be easily accommodated. Hence, we performed most experiments on such samples. Considering studies of bentonite swelling, this has defined a geometry where the samples were stored in cylindrical tubes of ca 1 cm diameter and where the bentonite pellets were swelling upward from the bottom of the tube into the overlying aqueous region. In contrast, sedimentation experiments detected the collection of bentonite from homogeneous dispersions at the bottom of the sample tubes. Since in all these experiments the sample and sample holder were cylindrically symmetrical and there was one preferred direction of swelling, most experiments we performed used 1D imaging along the vertical direction with the resolution of 156 µm.
On the other hand, the Industrial NMR Center has, during the past years, also acquired another type of MRI/NMR tool, a so-called ex situ magnet system. In this instrument, the magnetic field of sufficient quality and the corresponding NMR/MRI experimental conditions are not created inside a magnet system but outside one. In other words, such ex situ instruments can perform measurements while residing beside extended objects. In our case, this instrument, called the NMR MOUSE, was used to study bentonite swelling in horizontal direction and in large flat sample geometries.
8
1.3 PrinciplesofquantitativeimagingofbentonitecontentIn principle, there exist two ways to measure bentonite concentration in a sample. In the first way, one can exploit some atoms which reside within or electrostatically attached to the oxide sheets. The other possibility is to measure the distribution of water content from which the bentonite content can be obtained by subtraction. We adhered to this second path for two reasons and, therefore, most of the experiments presented below were performed by 1H MRI/NMR with signal arising from water. First, in comparison to the nuclei of other atoms, 1H nuclei provide a larger and more easily measurable signal. The signal from oxygen (the 17O isotope), silicon (the 29Si isotope), calcium (the 43Ca isotope) and magnesium (the 25Mg isotope) are far too weak and cannot be used for MRI-type experiments. Beside water, the only other options allowed by signal strength are experiments performed on 23Na and 27Al. Of these, the 27Al signal from particularly bentonite is difficult to detect. Hence, the only other realistic option is 23Na MRI. We performed such experiments (see below) but since signal from mobile atoms/molecules is far easier to detect than that from systems with less mobility, 23Na images have suffered from effects caused by varying ion hydration/mobility over the swelling clay. Additionally, 23Na images suffer from possible effects of ion exchange and diffusion.
Hence, our quantitative imaging experiments were performed using the water signal to obtain the bentonite content as a difference image. Because of this latter feature, this type of experiments was not suitable to follow bentonite swelling below a certain threshold of a few % of bentonite content. To access that region, we had to rely on imaging the longitudinal relaxation rate where the latter parameter is, according to reference experiments, linearly proportional to the bentonite content. The detailed description of the resulting complete experimental procedure with all experimental details are provided by our paper published in Journal of Magnetic Resonance /1/. In summary, our com-bined approach of direct water imaging and spin relaxation imaging was proved to yield bentonite distribution profiles over almost five orders of magnitude of concentration variation.
9
2 Samplepreparation
We investigated four different sorts of bentonite: the natural type MX80, its sodium and calcium exchanged forms denoted here Na-MX80 and Ca-MX80, respectively, and the 20/80 mixture of the latter ones, denoted here Ca80/Na20-MX80.
2.1 CompactedpelletsforverticalswellingexperimentsClay powders were equilibrated in air at 95% relative humidity over saturated KNO3 solution. The total water content, including water originally present in samples at ambient humidity, was estimated to 22–25 w% by gravimetric measurements. We note that the water content in samples at ambient condition was in the range 4–10 w% depending on sample. This was estimated by drying the powders in an oven at 110°C and by comparing the mass data to the observed 1H NMR intensities. From that procedure, we also obtain that the dried clays typically contained 3 (± 1) w% of residual moisture.
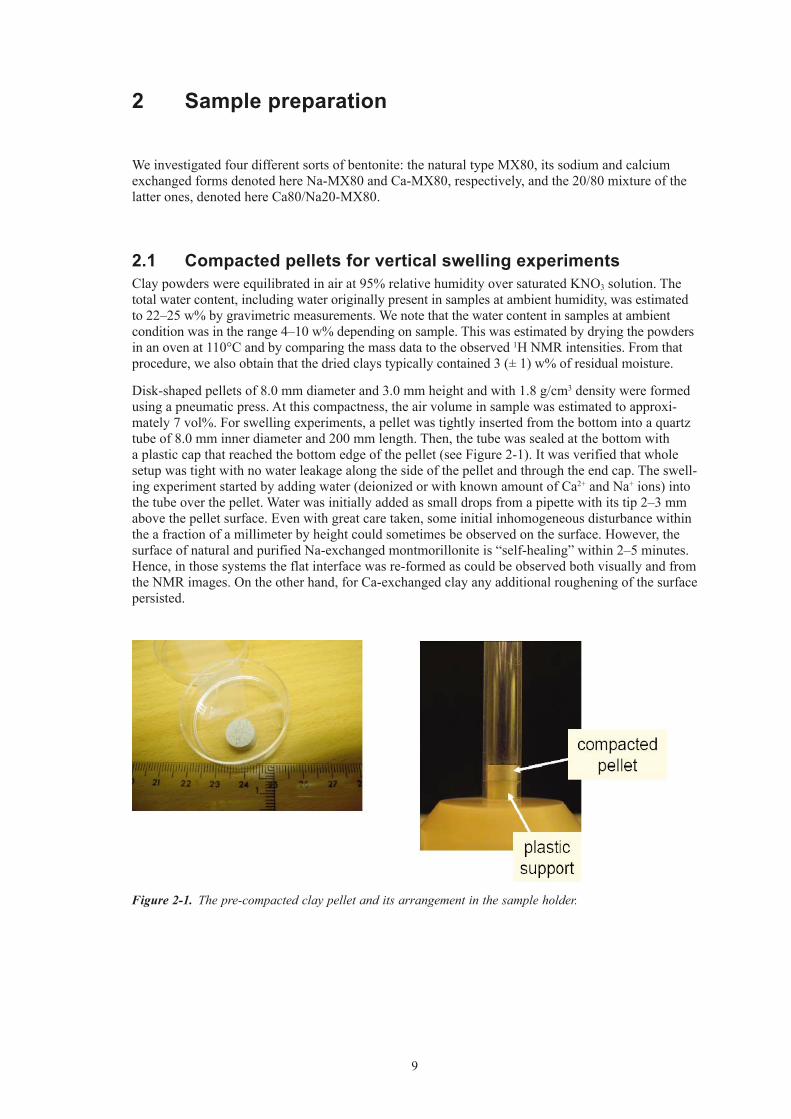
Disk-shaped pellets of 8.0 mm diameter and 3.0 mm height and with 1.8 g/cm3 density were formed using a pneumatic press. At this compactness, the air volume in sample was estimated to approxi-mately 7 vol%. For swelling experiments, a pellet was tightly inserted from the bottom into a quartz tube of 8.0 mm inner diameter and 200 mm length. Then, the tube was sealed at the bottom with a plastic cap that reached the bottom edge of the pellet (see Figure 2-1). It was verified that whole setup was tight with no water leakage along the side of the pellet and through the end cap. The swell-ing experiment started by adding water (deionized or with known amount of Ca2+ and Na+ ions) into the tube over the pellet. Water was initially added as small drops from a pipette with its tip 2–3 mm above the pellet surface. Even with great care taken, some initial inhomogeneous disturbance within the a fraction of a millimeter by height could sometimes be observed on the surface. However, the surface of natural and purified Na-exchanged montmorillonite is “self-healing” within 2–5 minutes. Hence, in those systems the flat interface was re-formed as could be observed both visually and from the NMR images. On the other hand, for Ca-exchanged clay any additional roughening of the surface persisted.
Figure 2-1. The pre-compacted clay pellet and its arrangement in the sample holder.
10
2.2 ClaymixedwithsuperparamagneticparticlesTo investigate the behavior of foreign particles in swelling/sedimenting clays, we prepared a model material that contained BioMag® superparamagnetic iron oxide particles of 10 μm average size. The particles were obtained as suspension in distilled water which was subsequently and at set proportions mixed into suitable clay suspensions prepared with distilled water. These mixtures were then dried in oven at +50°C and the obtained dry films were ground to powder in a mortar. Finally, the clay/particles powder was equilibrated at 95% relative humidity, reaching an equilibrium water content of approximately 24 w%. Two sets of samples with either 3 or 9 w% of iron oxide with respect to dry clay mass were prepared.
2.3 ClaysuspensionsClay suspensions were prepared by dispersing dry bentonite powder in water and subsequent thorough stirring 4–5 times for 2–3 minutes over a period of about 24 hours.
11
3 One-dimensionalverticalswelling
The main body of our observations consists of experiments performed on upward swelling of pre-compacted bentonite tablets. Experimental conditions and instrumentation were as described in /1/.
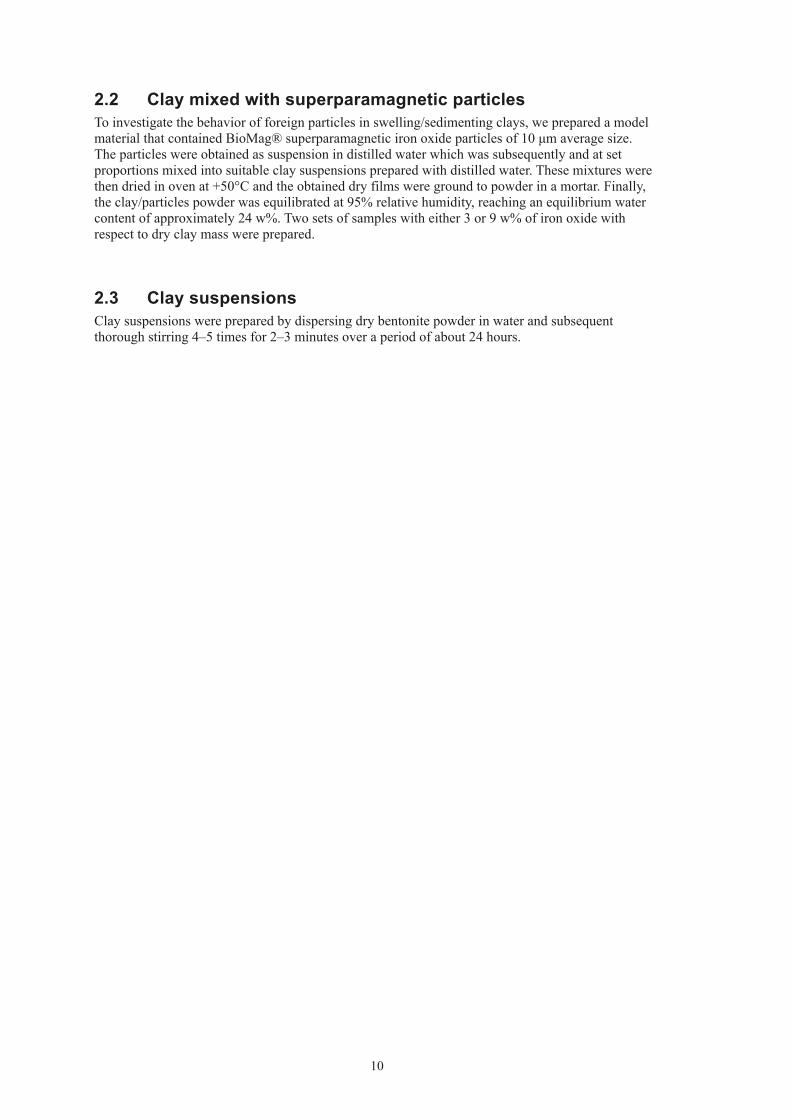
3.1 ConventionalMRimagingandvisualobservationAs described in more detail in /1/, conventional MRI experiments were not capable to provide infor-mation about bentonite distribution. On the other hand, they could quickly and con veniently locate the position of the swelling front. This was exploited for comparative studies the results from which are presented below in this sub-section.
Figure 3-1. (a) 2D image (sagittal cross-section) obtained by a conventional spin-echo-based imaging sequence of the Na-MX80 clay swelling in water. The image is dominantly contributed by free water, while the signal intensity of the water interacting with the clay is strongly attenuated by spin relaxation. For comparison, a photo of the swelling clay is also shown. (b) 1D vertical profiles acquired at different times after adding water to the clay sample. The shaded area indicates the initial position of clay pellet. (c) The propagation of the swelling front (the gel/water interface) defined by the position of the half-intensity point in (b) (dots) compared to the position of the visually observable interface (squares) between transparent pure water part and the opaque yellowish gel phase.
a)
0 4 8 12 16 20
0.0
0.2
0.4
0.6
0.8
1.0
1.2
b)
3 min
30 min
2 h
8 h
Ssi
gnal
inte
nsity
, a. u
.
z, mm0 10 20 30
0
20
40
60
80
time1/2 , hours1/2
Sw
ellin
g fr
ont l
ocat
ion,
mm
c)
12
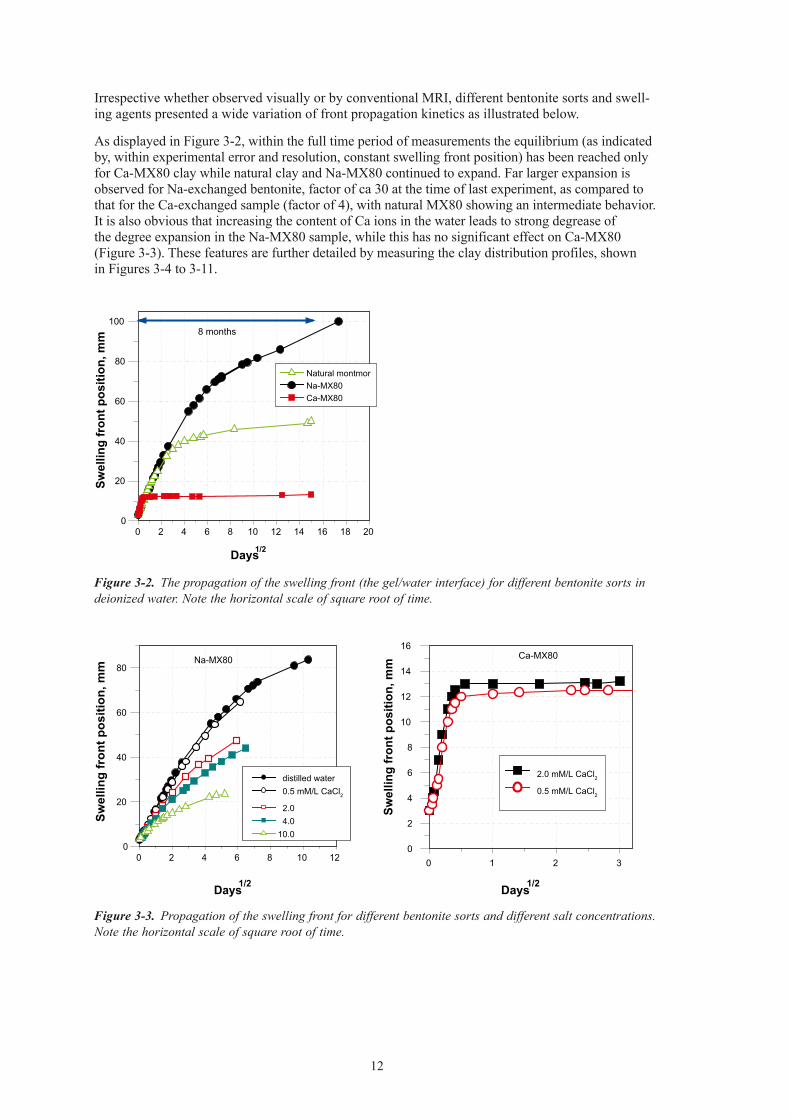
Irrespective whether observed visually or by conventional MRI, different bentonite sorts and swell-ing agents presented a wide variation of front propagation kinetics as illustrated below.
As displayed in Figure 3-2, within the full time period of measurements the equilibrium (as indicated by, within experimental error and resolution, constant swelling front position) has been reached only for Ca-MX80 clay while natural clay and Na-MX80 continued to expand. Far larger expansion is observed for Na-exchanged bentonite, factor of ca 30 at the time of last experiment, as compared to that for the Ca-exchanged sample (factor of 4), with natural MX80 showing an intermediate behavior. It is also obvious that increasing the content of Ca ions in the water leads to strong degrease of the degree expansion in the Na-MX80 sample, while this has no significant effect on Ca-MX80 (Figure 3-3). These features are further detailed by measuring the clay distribution profiles, shown in Figures 3-4 to 3-11.
Figure 3-2. The propagation of the swelling front (the gel/water interface) for different bentonite sorts in deionized water. Note the horizontal scale of square root of time.
Figure 3-3. Propagation of the swelling front for different bentonite sorts and different salt concentrations. Note the horizontal scale of square root of time.
0 2 4 6 8 10 12 14 16 18 200
20
40
60
80
100
Natural montmor Na-MX80 Ca-MX80
Days1/2
Swel
ling
fron
t pos
ition
, mm 8 months
0 2 4 6 8 10 120
20
40
60
80
Days1/2
Swel
ling
fron
t pos
ition
, mm
Na-MX80
0 1 2 30
2
4
6
8
10
12
14
16
Days1/2
Swel
ling
fron
t pos
ition
, mm
Ca-MX80
distilled water 0.5 mM/L CaCl2 2.0 4.0 10.0
2.0 mM/L CaCl2 0.5 mM/L CaCl2
13
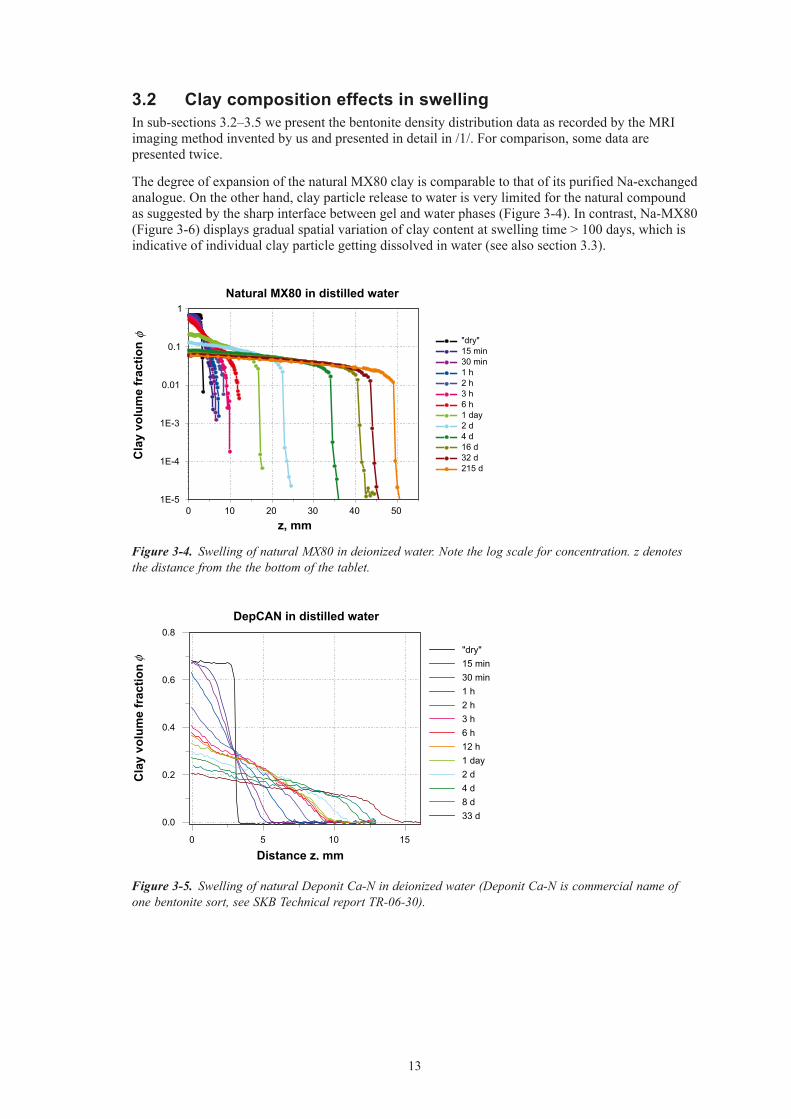
Figure 3-4. Swelling of natural MX80 in deionized water. Note the log scale for concentration. z denotes the distance from the the bottom of the tablet.
Figure 3-5. Swelling of natural Deponit Ca-N in deionized water (Deponit Ca-N is commercial name of one bentonite sort, see SKB Technical report TR-06-30).
0 10 20 30 40 501E-5
1E-4
1E-3
0.01
0.1
1
"dry" 15 min 30 min 1 h 2 h 3 h 6 h 1 day 2 d 4 d 16 d 32 d 215 d
Cla
y vo
lum
e fr
actio
n
z, mm
Natural MX80 in distilled water
φ
0 5 10 15
0.0
0.2
0.4
0.6
0.8
"dry" 15 min 30 min 1 h 2 h 3 h 6 h 12 h 1 day 2 d 4 d 8 d 33 d
DepCAN in distilled water
Cla
y vo
lum
e fr
actio
n φ
Distance z, mm
3.2 ClaycompositioneffectsinswellingIn sub-sections 3.2–3.5 we present the bentonite density distribution data as recorded by the MRI imaging method invented by us and presented in detail in /1/. For comparison, some data are presented twice.
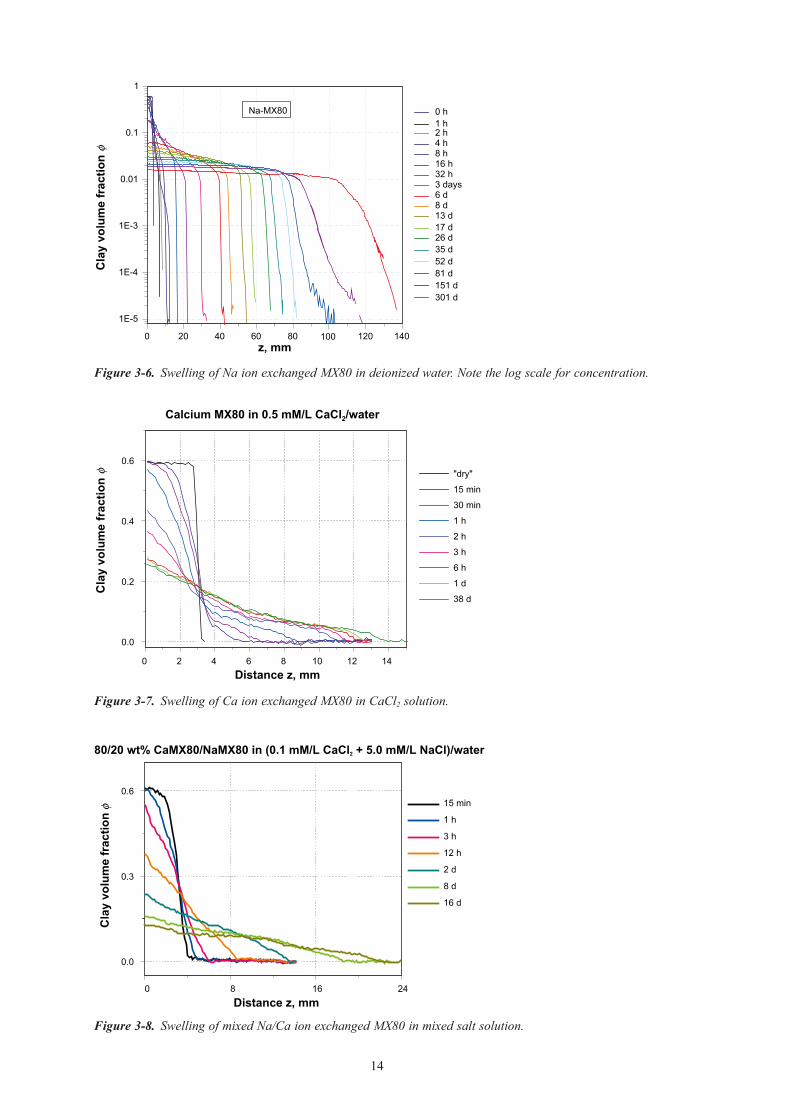
The degree of expansion of the natural MX80 clay is comparable to that of its purified Na-exchanged analogue. On the other hand, clay particle release to water is very limited for the natural compound as suggested by the sharp interface between gel and water phases (Figure 3-4). In contrast, Na-MX80 (Figure 3-6) displays gradual spatial variation of clay content at swelling time > 100 days, which is indicative of individual clay particle getting dissolved in water (see also section 3.3).
14
Figure 3-7. Swelling of Ca ion exchanged MX80 in CaCl2 solution.
Figure 3-8. Swelling of mixed Na/Ca ion exchanged MX80 in mixed salt solution.
0 2 4 6 8 10 12 14
0.0
0.2
0.4
0.6 "dry"
15 min
30 min
1 h
2 h
3 h
6 h
1 d
38 d
Calcium MX80 in 0.5 mM/L CaCl2/water
Cla
y vo
lum
e fr
actio
n φ
Distance z, mm
0 8 16 24
0.0
0.3
0.6 15 min
1 h
3 h
12 h
2 d
8 d
16 d
80/20 wt% CaMX80/NaMX80 in (0.1 mM/L CaCl2 + 5.0 mM/L NaCl)/water
Cla
y vo
lum
e fr
actio
n φ
Distance z, mm
Figure 3-6. Swelling of Na ion exchanged MX80 in deionized water. Note the log scale for concentration.
0 20 40 60 80 120 140
1E-5
1E-4
1E-3
0.01
0.1
1
0 h 1 h 2 h 4 h 8 h 16 h 32 h 3 days 6 d 8 d 13 d 17 d 26 d 35 d 52 d 81 d 151 d 301 d
Na-MX80C
lay
volu
me
frac
tion
φ
z, mm100
15
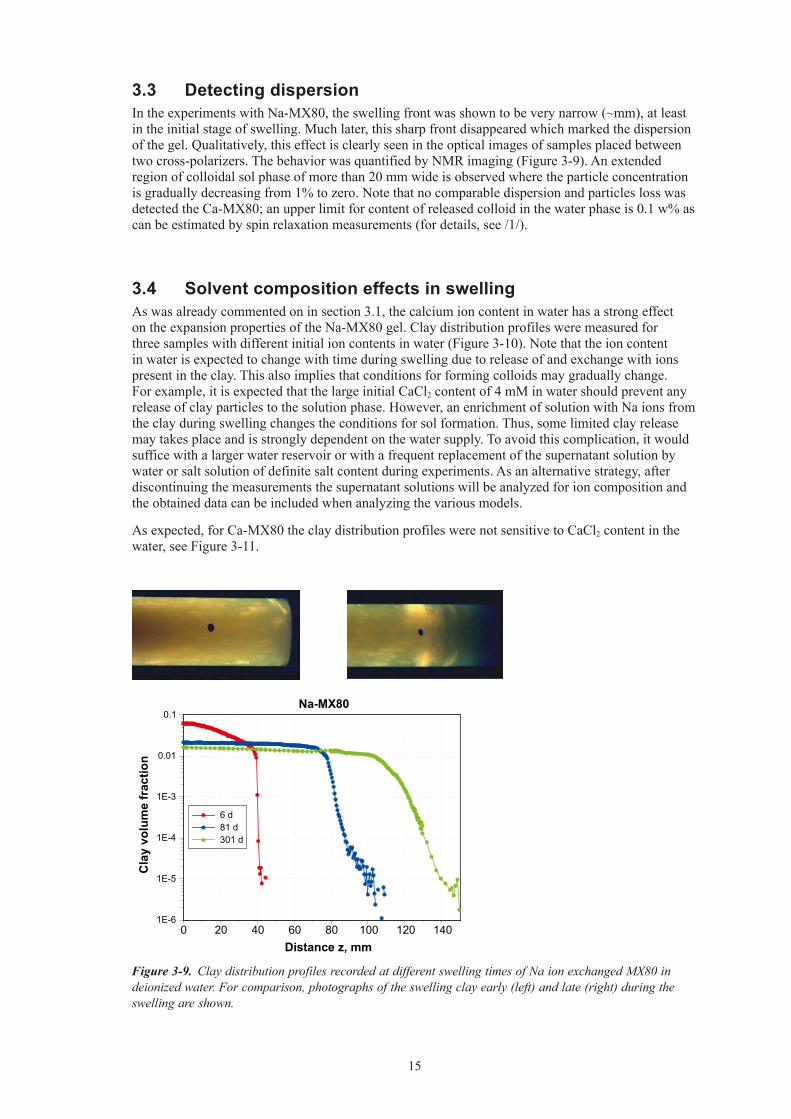
Figure 3-9. Clay distribution profiles recorded at different swelling times of Na ion exchanged MX80 in deionized water. For comparison, photographs of the swelling clay early (left) and late (right) during the swelling are shown.
0 20 40 60 80 100 120 1401E-6
1E-5
1E-4
1E-3
0.01
0.1
6 d 81 d 301 d
Na-MX80
Cla
y vo
lum
e fr
actio
n
Distance z, mm
3.3 DetectingdispersionIn the experiments with Na-MX80, the swelling front was shown to be very narrow (~mm), at least in the initial stage of swelling. Much later, this sharp front disappeared which marked the dispersion of the gel. Qualitatively, this effect is clearly seen in the optical images of samples placed between two cross-polarizers. The behavior was quantified by NMR imaging (Figure 3-9). An extended region of colloidal sol phase of more than 20 mm wide is observed where the particle concentration is gradually decreasing from 1% to zero. Note that no comparable dispersion and particles loss was detected the Ca-MX80; an upper limit for content of released colloid in the water phase is 0.1 w% as can be estimated by spin relaxation measurements (for details, see /1/).
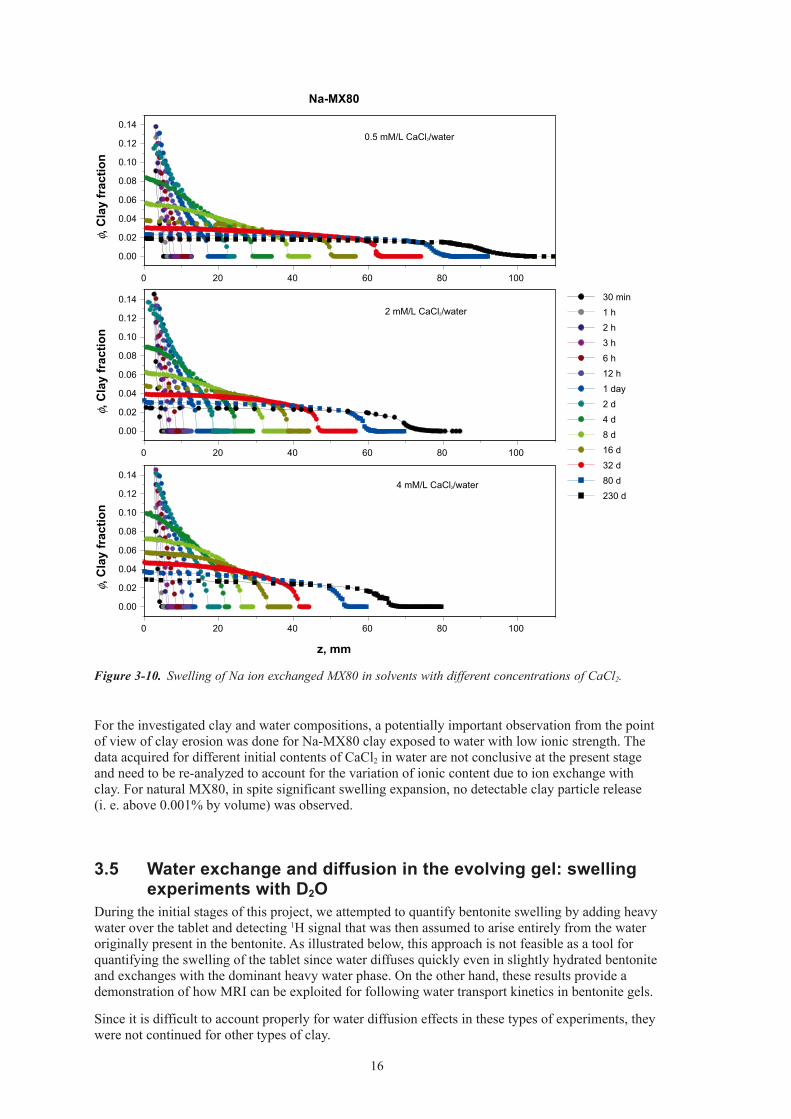
3.4 SolventcompositioneffectsinswellingAs was already commented on in section 3.1, the calcium ion content in water has a strong effect on the expansion properties of the Na-MX80 gel. Clay distribution profiles were measured for three samples with different initial ion contents in water (Figure 3-10). Note that the ion content in water is expected to change with time during swelling due to release of and exchange with ions present in the clay. This also implies that conditions for forming colloids may gradually change. For example, it is expected that the large initial CaCl2 content of 4 mM in water should prevent any release of clay particles to the solution phase. However, an enrichment of solution with Na ions from the clay during swelling changes the conditions for sol formation. Thus, some limited clay release may takes place and is strongly dependent on the water supply. To avoid this complication, it would suffice with a larger water reservoir or with a frequent replacement of the supernatant solution by water or salt solution of definite salt content during experiments. As an alternative strategy, after discontinuing the measurements the supernatant solutions will be analyzed for ion composition and the obtained data can be included when analyzing the various models.
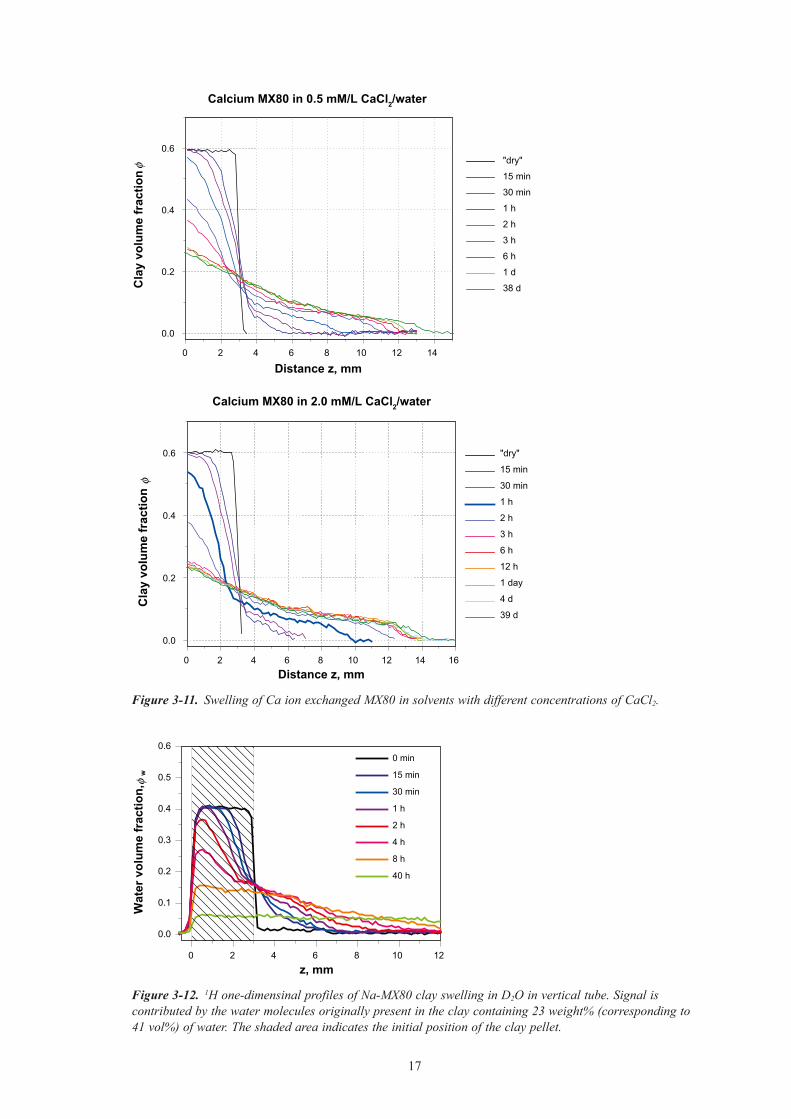
As expected, for Ca-MX80 the clay distribution profiles were not sensitive to CaCl2 content in the water, see Figure 3-11.
16
Figure 3-10. Swelling of Na ion exchanged MX80 in solvents with different concentrations of CaCl2.
0 20 40 60 80 100
0.00
0.02
0.04
0.06
0.08
0.10
0.12
0.14
0 20 40 60 80 100
0.00
0.02
0.04
0.06
0.08
0.10
0.12
0.14
0 20 40 60 80 100
0.00
0.02
0.04
0.06
0.08
0.10
0.12
0.14
Na-MX80
30 min 1 h 2 h 3 h 6 h 12 h 1 day 2 d 4 d 8 d 16 d 32 d 80 d 230 d
φ , C
lay
frac
tion
0.5 mM/L CaCl2/water
φ , C
lay
frac
tion
2 mM/L CaCl2/water
φ , C
lay
frac
tion
z, mm
4 mM/L CaCl2/water
For the investigated clay and water compositions, a potentially important observation from the point of view of clay erosion was done for Na-MX80 clay exposed to water with low ionic strength. The data acquired for different initial contents of CaCl2 in water are not conclusive at the present stage and need to be re-analyzed to account for the variation of ionic content due to ion exchange with clay. For natural MX80, in spite significant swelling expansion, no detectable clay particle release (i. e. above 0.001% by volume) was observed.
3.5 Waterexchangeanddiffusionintheevolvinggel:swellingexperimentswithD2O
During the initial stages of this project, we attempted to quantify bentonite swelling by adding heavy water over the tablet and detecting 1H signal that was then assumed to arise entirely from the water originally present in the bentonite. As illustrated below, this approach is not feasible as a tool for quantifying the swelling of the tablet since water diffuses quickly even in slightly hydrated bentonite and exchanges with the dominant heavy water phase. On the other hand, these results provide a demonstration of how MRI can be exploited for following water transport kinetics in bentonite gels.
Since it is difficult to account properly for water diffusion effects in these types of experiments, they were not continued for other types of clay.
17
Figure 3-11. Swelling of Ca ion exchanged MX80 in solvents with different concentrations of CaCl2.
0 2 4 6 8 10 12 14
0.0
0.2
0.4
0.6 "dry"
15 min
30 min
1 h
2 h
3 h
6 h
1 d
38 d
Calcium MX80 in 0.5 mM/L CaCl2/water
Cla
y vo
lum
e fr
actio
n φ
Distance z, mm
0 2 4 6 8 10 12 14 16
0.0
0.2
0.4
0.6 "dry"
15 min
30 min
1 h
2 h
3 h
6 h
12 h
1 day
4 d
39 d
Calcium MX80 in 2.0 mM/L CaCl2/water
Cla
y vo
lum
e fr
actio
n φ
Distance z, mm
Figure 3-12. 1H one-dimensinal profiles of Na-MX80 clay swelling in D2O in vertical tube. Signal is contributed by the water molecules originally present in the clay containing 23 weight% (corresponding to 41 vol%) of water. The shaded area indicates the initial position of the clay pellet.
0 2 4 6 8 10 12
0.0
0.1
0.2
0.3
0.4
0.5
0.6 0 min
15 min
30 min
1 h
2 h
4 h
8 h
40 h
Wat
er v
olum
e fr
actio
n,
w
z, mm
φ
18
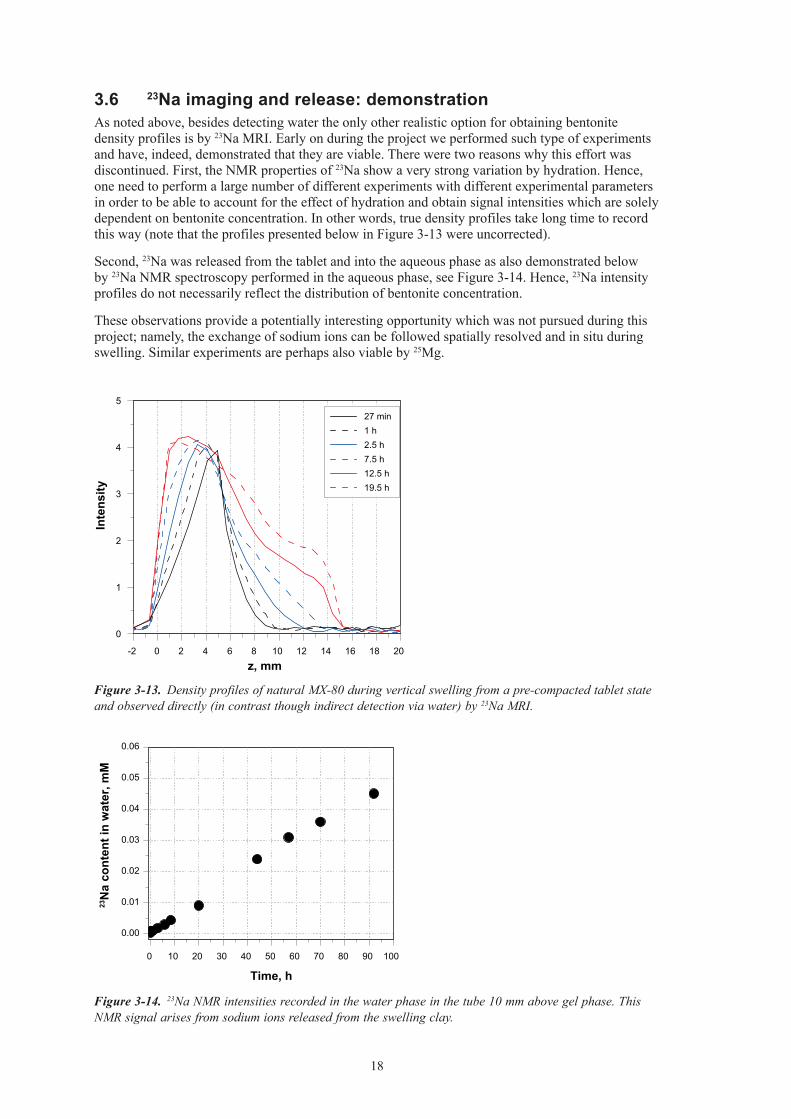
Figure 3-13. Density profiles of natural MX-80 during vertical swelling from a pre-compacted tablet state and observed directly (in contrast though indirect detection via water) by 23Na MRI.
-2 0 2 4 6 8 10 12 14 16 18 20
0
1
2
3
4
5 27 min 1 h 2.5 h 7.5 h 12.5 h 19.5 h
Inte
nsity
z, mm
Figure 3-14. 23Na NMR intensities recorded in the water phase in the tube 10 mm above gel phase. This NMR signal arises from sodium ions released from the swelling clay.
0 10 20 30 40 50 60 70 80 90 100
0.00
0.01
0.02
0.03
0.04
0.05
0.06
23N
a co
nten
t in
wat
er, m
M
Time, h
3.6 23Naimagingandrelease:demonstrationAs noted above, besides detecting water the only other realistic option for obtaining bentonite density profiles is by 23Na MRI. Early on during the project we performed such type of experiments and have, indeed, demonstrated that they are viable. There were two reasons why this effort was discontinued. First, the NMR properties of 23Na show a very strong variation by hydration. Hence, one need to perform a large number of different experiments with different experimental parameters in order to be able to account for the effect of hydration and obtain signal intensities which are solely dependent on bentonite concentration. In other words, true density profiles take long time to record this way (note that the profiles presented below in Figure 3-13 were uncorrected).
Second, 23Na was released from the tablet and into the aqueous phase as also demonstrated below by 23Na NMR spectroscopy performed in the aqueous phase, see Figure 3-14. Hence, 23Na intensity profiles do not necessarily reflect the distribution of bentonite concentration.
These observations provide a potentially interesting opportunity which was not pursued during this project; namely, the exchange of sodium ions can be followed spatially resolved and in situ during swelling. Similar experiments are perhaps also viable by 25Mg.
19
4 Swellinginhorizontalslit
Our experiments presented above concerned swelling upward and, hence, affected by gravity. To investigate swelling unaffected by gravity, we had to perform experiments where bentonite was exposed to water on a way that it could swell horizontally. To achieve this, initially we constructed a swelling chamber that had fit into our conventional MRI probe of 3 cm diameter and where the horizontal swelling of 3 mm or 5 mm initial diameter tablets could have been studied. However, such tablets were too small to present a sufficiently robust sampling of bentonite behavior. Hence, these initial experiments were discontinued (results not shown).
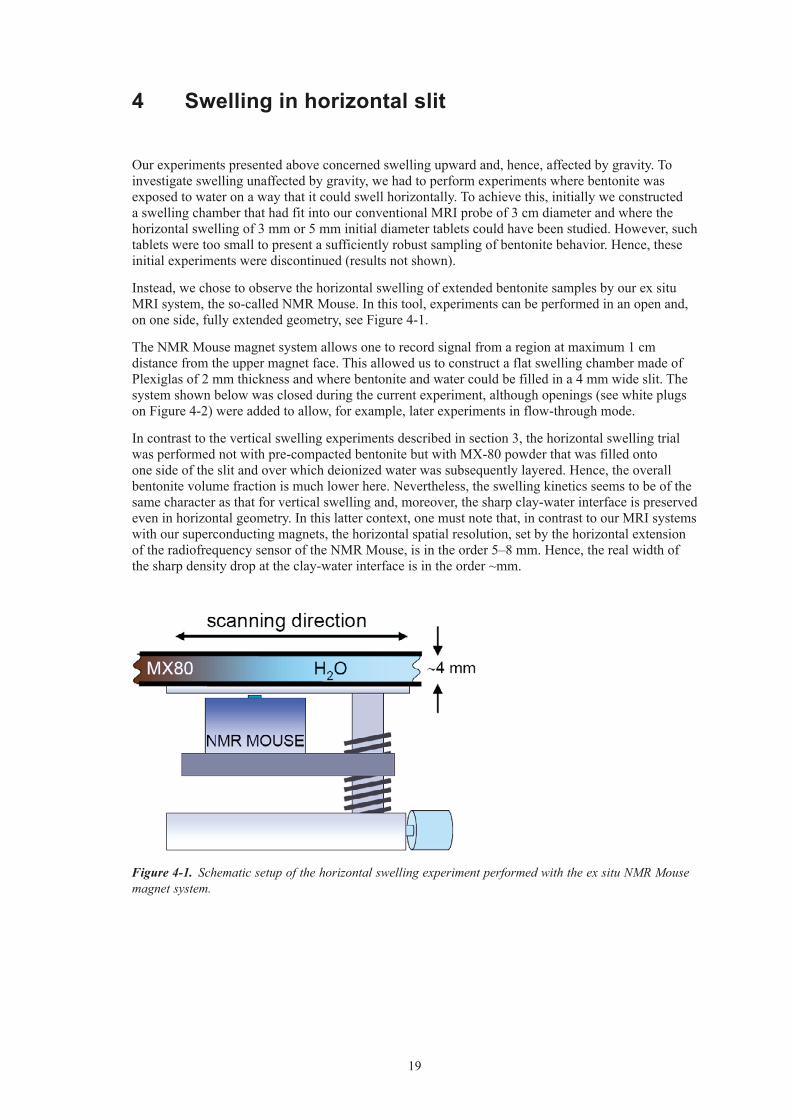
Instead, we chose to observe the horizontal swelling of extended bentonite samples by our ex situ MRI system, the so-called NMR Mouse. In this tool, experiments can be performed in an open and, on one side, fully extended geometry, see Figure 4-1.
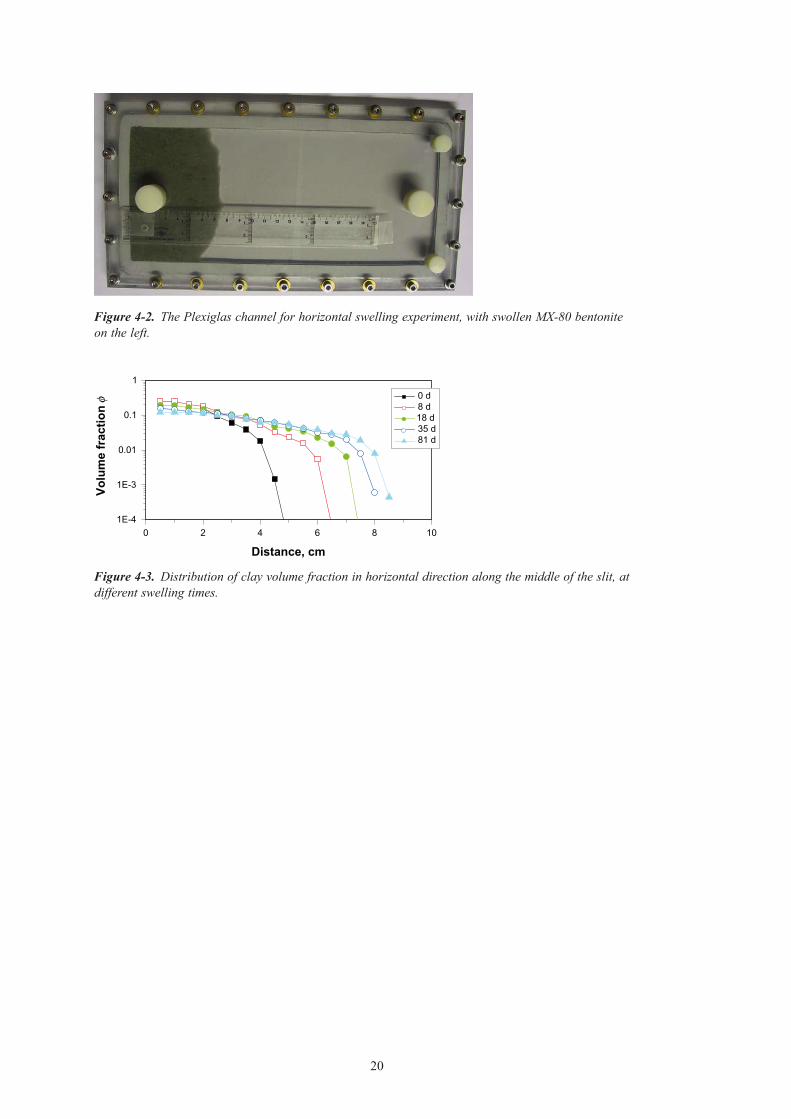
The NMR Mouse magnet system allows one to record signal from a region at maximum 1 cm distance from the upper magnet face. This allowed us to construct a flat swelling chamber made of Plexiglas of 2 mm thickness and where bentonite and water could be filled in a 4 mm wide slit. The system shown below was closed during the current experiment, although openings (see white plugs on Figure 4-2) were added to allow, for example, later experiments in flow-through mode.
In contrast to the vertical swelling experiments described in section 3, the horizontal swelling trial was performed not with pre-compacted bentonite but with MX-80 powder that was filled onto one side of the slit and over which deionized water was subsequently layered. Hence, the overall bentonite volume fraction is much lower here. Nevertheless, the swelling kinetics seems to be of the same character as that for vertical swelling and, moreover, the sharp clay-water interface is preserved even in horizontal geometry. In this latter context, one must note that, in contrast to our MRI systems with our superconducting magnets, the horizontal spatial resolution, set by the horizontal extension of the radiofrequency sensor of the NMR Mouse, is in the order 5–8 mm. Hence, the real width of the sharp density drop at the clay-water interface is in the order ~mm.
Figure 4-1. Schematic setup of the horizontal swelling experiment performed with the ex situ NMR Mouse magnet system.
20
Figure 4-2. The Plexiglas channel for horizontal swelling experiment, with swollen MX-80 bentonite on the left.
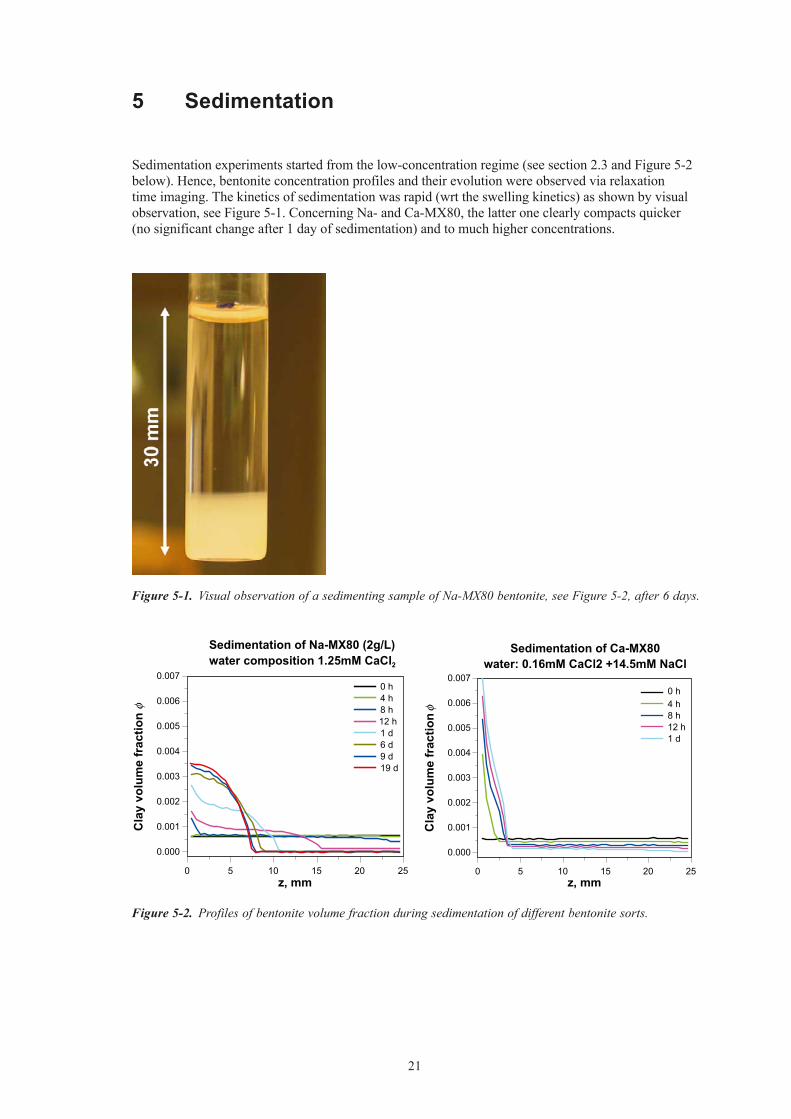
0 2 4 6 8 101E-4
1E-3
0.01
0.1
10 d8 d18 d35 d81 d
Volu
me
frac
tion
φ
Distance, cm
Figure 4-3. Distribution of clay volume fraction in horizontal direction along the middle of the slit, at different swelling times.
21
5 Sedimentation
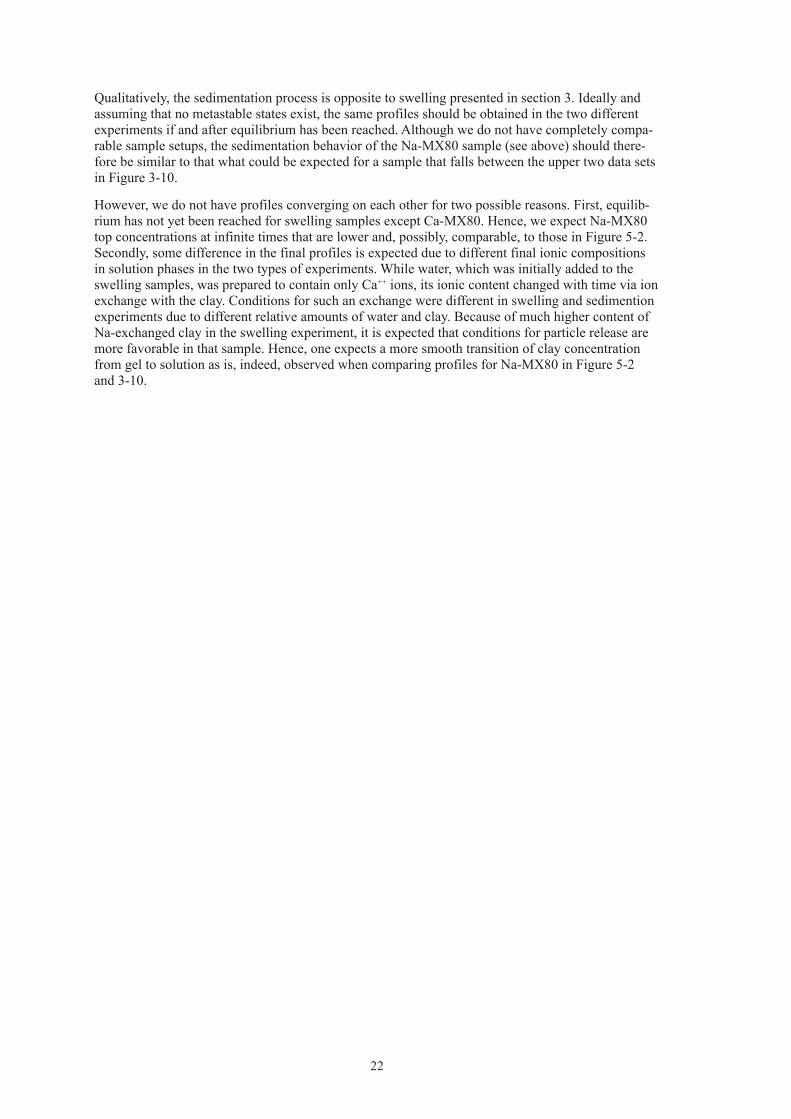
Sedimentation experiments started from the low-concentration regime (see section 2.3 and Figure 5-2 below). Hence, bentonite concentration profiles and their evolution were observed via relaxation time imaging. The kinetics of sedimentation was rapid (wrt the swelling kinetics) as shown by visual observation, see Figure 5-1. Concerning Na- and Ca-MX80, the latter one clearly compacts quicker (no significant change after 1 day of sedimentation) and to much higher concentrations.
Figure 5-1. Visual observation of a sedimenting sample of Na-MX80 bentonite, see Figure 5-2, after 6 days.
0 5 10 15 20 25
0.000
0.001
0.002
0.003
0.004
0.005
0.006
0.007 0 h 4 h 8 h 12 h 1 d 6 d 9 d 19 d
Sedimentation of Na-MX80 (2g/L)water composition 1.25mM CaCl2
Cla
y vo
lum
e fr
actio
n φ
z, mm0 5 10 15 20 25
0.000
0.001
0.002
0.003
0.004
0.005
0.006
0.007 0 h 4 h 8 h 12 h 1 d
Sedimentation of Ca-MX80 water: 0.16mM CaCl2 +14.5mM NaCl
Cla
y vo
lum
e fr
actio
n φ
z, mm Figure 5-2. Profiles of bentonite volume fraction during sedimentation of different bentonite sorts.
22
Qualitatively, the sedimentation process is opposite to swelling presented in section 3. Ideally and assuming that no metastable states exist, the same profiles should be obtained in the two different experiments if and after equilibrium has been reached. Although we do not have completely compa-rable sample setups, the sedimentation behavior of the Na-MX80 sample (see above) should there-fore be similar to that what could be expected for a sample that falls between the upper two data sets in Figure 3-10.
However, we do not have profiles converging on each other for two possible reasons. First, equilib-rium has not yet been reached for swelling samples except Ca-MX80. Hence, we expect Na-MX80 top concentrations at infinite times that are lower and, possibly, comparable, to those in Figure 5-2. Secondly, some difference in the final profiles is expected due to different final ionic compositions in solution phases in the two types of experiments. While water, which was initially added to the swelling samples, was prepared to contain only Ca++ ions, its ionic content changed with time via ion exchange with the clay. Conditions for such an exchange were different in swelling and sedimention experiments due to different relative amounts of water and clay. Because of much higher content of Na-exchanged clay in the swelling experiment, it is expected that conditions for particle release are more favorable in that sample. Hence, one expects a more smooth transition of clay concentration from gel to solution as is, indeed, observed when comparing profiles for Na-MX80 in Figure 5-2 and 3-10.
23
6 Detectingforeignparticles
Foreign particles present in clay can collect and form barriers in, for example, cracks. Hence, their motion, distribution, and, in particular, enrichment in particular regions is potentially interesting to follow during swelling or sedimentation.
6.1 DirectimagingofnaturalforeignparticlesinMX80
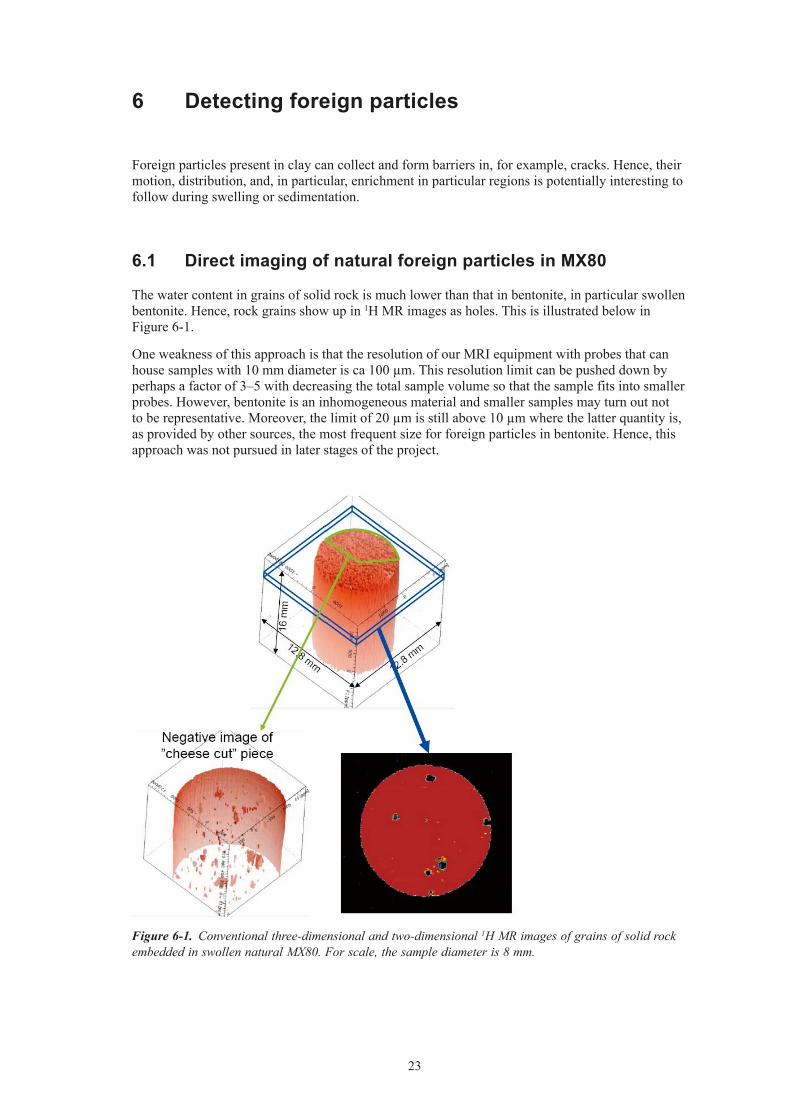
The water content in grains of solid rock is much lower than that in bentonite, in particular swollen bentonite. Hence, rock grains show up in 1H MR images as holes. This is illustrated below in Figure 6-1.
One weakness of this approach is that the resolution of our MRI equipment with probes that can house samples with 10 mm diameter is ca 100 µm. This resolution limit can be pushed down by perhaps a factor of 3–5 with decreasing the total sample volume so that the sample fits into smaller probes. However, bentonite is an inhomogeneous material and smaller samples may turn out not to be representative. Moreover, the limit of 20 µm is still above 10 µm where the latter quantity is, as provided by other sources, the most frequent size for foreign particles in bentonite. Hence, this approach was not pursued in later stages of the project.
Figure 6-1. Conventional three-dimensional and two-dimensional 1H MR images of grains of solid rock embedded in swollen natural MX80. For scale, the sample diameter is 8 mm.
24
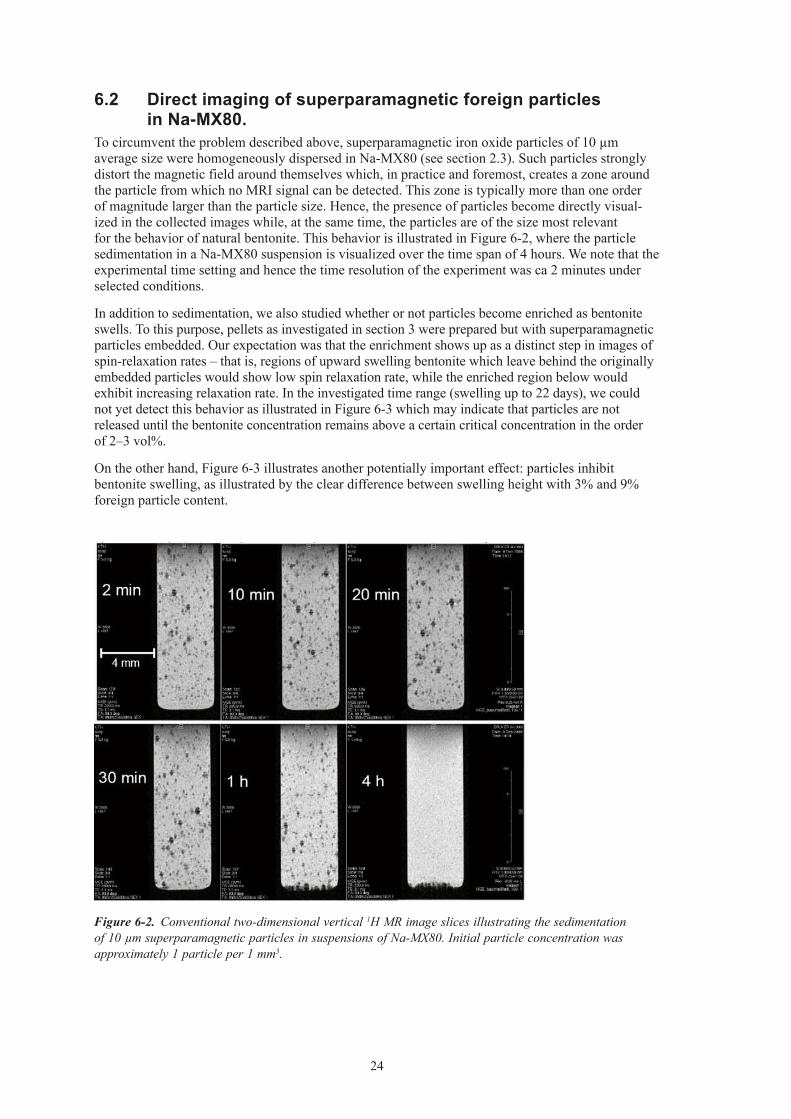
6.2 DirectimagingofsuperparamagneticforeignparticlesinNa-MX80.
To circumvent the problem described above, superparamagnetic iron oxide particles of 10 µm average size were homogeneously dispersed in Na-MX80 (see section 2.3). Such particles strongly distort the magnetic field around themselves which, in practice and foremost, creates a zone around the particle from which no MRI signal can be detected. This zone is typically more than one order of magnitude larger than the particle size. Hence, the presence of particles become directly visual-ized in the collected images while, at the same time, the particles are of the size most relevant for the behavior of natural bentonite. This behavior is illustrated in Figure 6-2, where the particle sedimentation in a Na-MX80 suspension is visualized over the time span of 4 hours. We note that the experimental time setting and hence the time resolution of the experiment was ca 2 minutes under selected conditions.
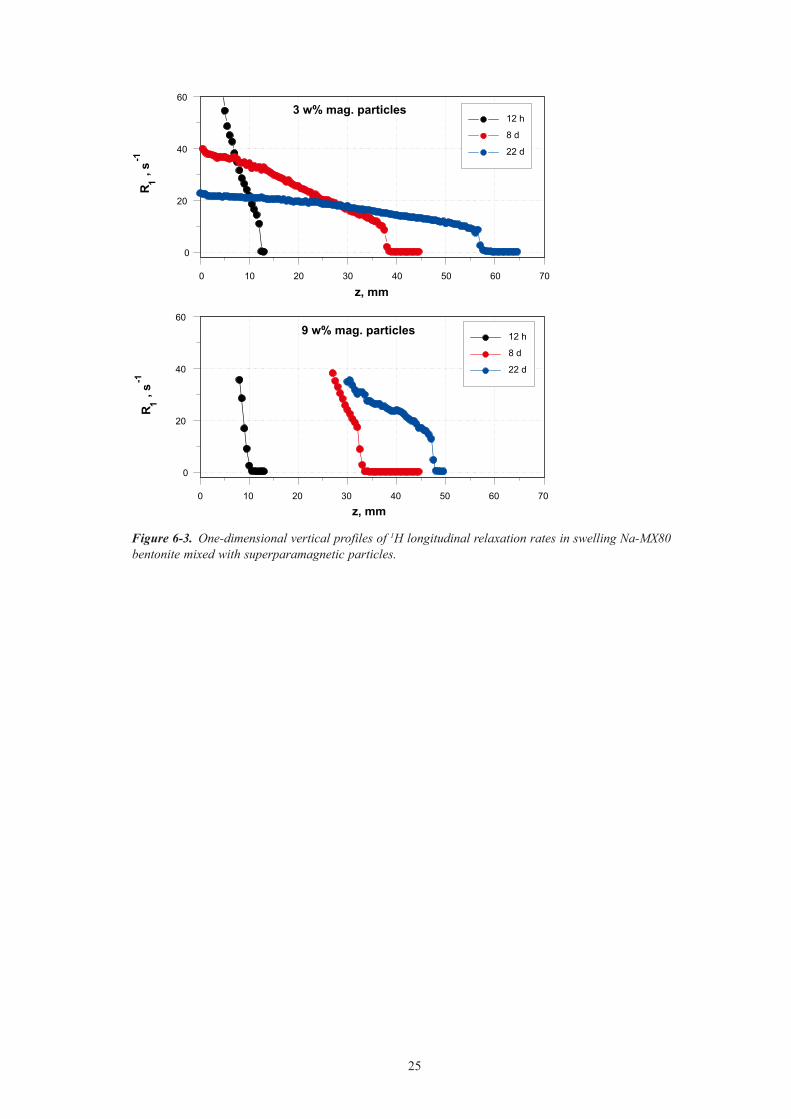
In addition to sedimentation, we also studied whether or not particles become enriched as bentonite swells. To this purpose, pellets as investigated in section 3 were prepared but with superparamagnetic particles embedded. Our expectation was that the enrichment shows up as a distinct step in images of spin-relaxation rates – that is, regions of upward swelling bentonite which leave behind the originally embedded particles would show low spin relaxation rate, while the enriched region below would exhibit increasing relaxation rate. In the investigated time range (swelling up to 22 days), we could not yet detect this behavior as illustrated in Figure 6-3 which may indicate that particles are not released until the bentonite concentration remains above a certain critical concentration in the order of 2–3 vol%.
On the other hand, Figure 6-3 illustrates another potentially important effect: particles inhibit bentonite swelling, as illustrated by the clear difference between swelling height with 3% and 9% foreign particle content.
Figure 6-2. Conventional two-dimensional vertical 1H MR image slices illustrating the sedimentation of 10 µm superparamagnetic particles in suspensions of Na-MX80. Initial particle concentration was approximately 1 particle per 1 mm3.
25
Figure 6-3. One-dimensional vertical profiles of 1H longitudinal relaxation rates in swelling Na-MX80 bentonite mixed with superparamagnetic particles.
0 10 20 30 40 50 60 70
0
20
40
60
0 10 20 30 40 50 60 70
0
20
40
60
12 h
8 d
22 dR 1
, s-1
z, mm
3 w% mag. particles
9 w% mag. particles 12 h
8 d
22 d
z, mm
R 1, s
-1
27
7 Diffusion
While investigating the spin relaxation properties of bentonite suspensions in order to obtain a quantitative relation between them and the bentonite content (see above and in /1/, required to obtain bentonite profiles in the low concentration region), we also made some observations of water diffusion in those samples. These observations were, on one hand, in contrast to results in previous related investigations and, on other hand, they seem to have some potential to reveal the structure of gels/sols that appear in low-concentration bentonite solutions.
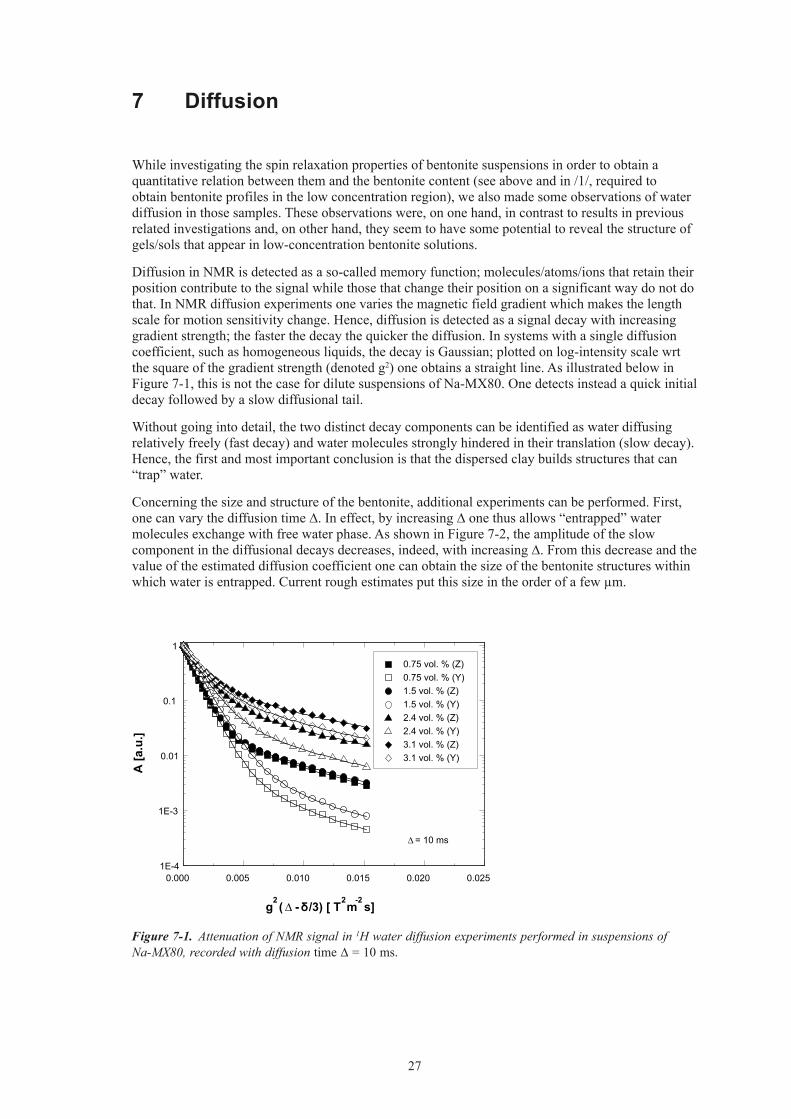
Diffusion in NMR is detected as a so-called memory function; molecules/atoms/ions that retain their position contribute to the signal while those that change their position on a significant way do not do that. In NMR diffusion experiments one varies the magnetic field gradient which makes the length scale for motion sensitivity change. Hence, diffusion is detected as a signal decay with increasing gradient strength; the faster the decay the quicker the diffusion. In systems with a single diffusion coefficient, such as homogeneous liquids, the decay is Gaussian; plotted on log-intensity scale wrt the square of the gradient strength (denoted g2) one obtains a straight line. As illustrated below in Figure 7-1, this is not the case for dilute suspensions of Na-MX80. One detects instead a quick initial decay followed by a slow diffusional tail.
Without going into detail, the two distinct decay components can be identified as water diffusing relatively freely (fast decay) and water molecules strongly hindered in their translation (slow decay). Hence, the first and most important conclusion is that the dispersed clay builds structures that can “trap” water.
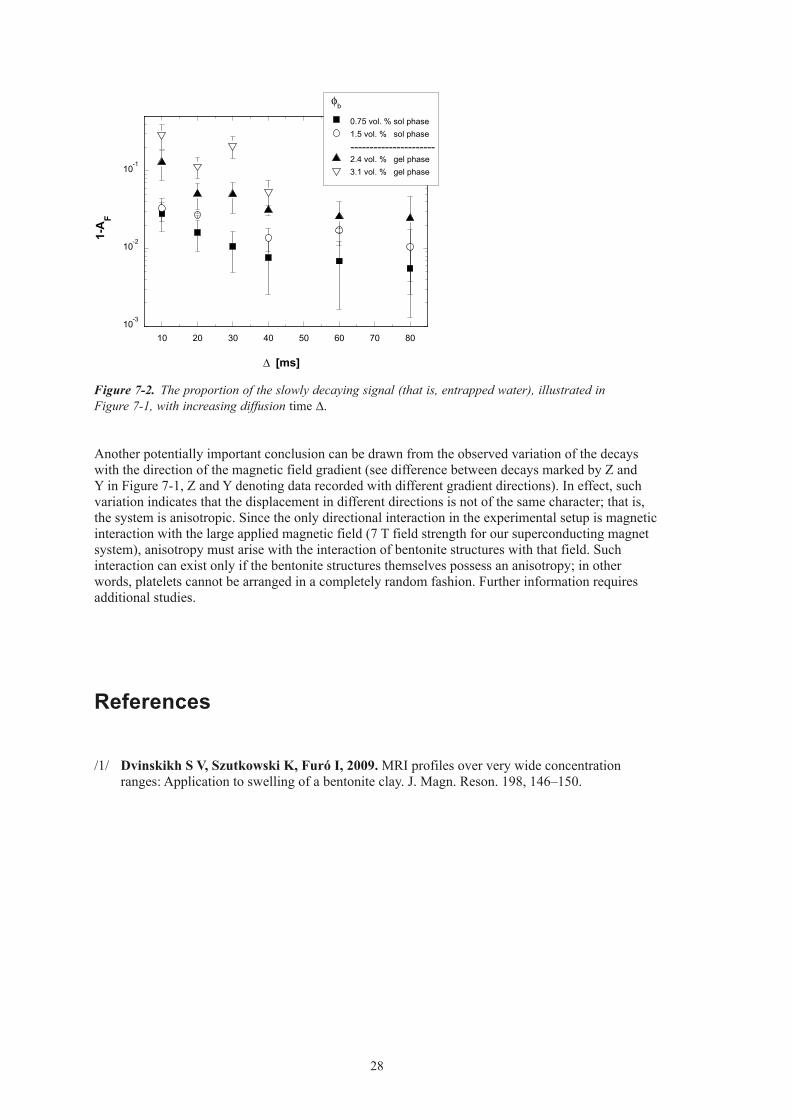
Concerning the size and structure of the bentonite, additional experiments can be performed. First, one can vary the diffusion time ∆. In effect, by increasing ∆ one thus allows “entrapped” water molecules exchange with free water phase. As shown in Figure 7-2, the amplitude of the slow component in the diffusional decays decreases, indeed, with increasing ∆. From this decrease and the value of the estimated diffusion coefficient one can obtain the size of the bentonite structures within which water is entrapped. Current rough estimates put this size in the order of a few µm.
Figure 7-1. Attenuation of NMR signal in 1H water diffusion experiments performed in suspensions of Na-MX80, recorded with diffusion time ∆ = 10 ms.
0.000 0.005 0.010 0.015 0.020 0.0251E-4
1E-3
0.01
0.1
1
0.75 vol. % (Z) 0.75 vol. % (Y) 1.5 vol. % (Z) 1.5 vol. % (Y) 2.4 vol. % (Z) 2.4 vol. % (Y) 3.1 vol. % (Z) 3.1 vol. % (Y)
A [a
.u.]
g2( ∆ - δ/3) [ T
2 m
-2 s]
∆ = 10 ms
28
Another potentially important conclusion can be drawn from the observed variation of the decays with the direction of the magnetic field gradient (see difference between decays marked by Z and Y in Figure 7-1, Z and Y denoting data recorded with different gradient directions). In effect, such variation indicates that the displacement in different directions is not of the same character; that is, the system is anisotropic. Since the only directional interaction in the experimental setup is magnetic interaction with the large applied magnetic field (7 T field strength for our superconducting magnet system), anisotropy must arise with the interaction of bentonite structures with that field. Such interaction can exist only if the bentonite structures themselves possess an anisotropy; in other words, platelets cannot be arranged in a completely random fashion. Further information requires additional studies.
References
/1/ DvinskikhSV,SzutkowskiK,FuróI,2009.MRI profiles over very wide concentration ranges: Application to swelling of a bentonite clay. J. Magn. Reson. 198, 146–150.
10 20 30 40 50 60 70 8010
-3
10-2
10-1
1-A
F
∆ [ms]
φb
0.75 vol. % sol phase 1.5 vol. % sol phase
---------------------- 2.4 vol. % gel phase 3.1 vol. % gel phase
Figure 7-2. The proportion of the slowly decaying signal (that is, entrapped water), illustrated in Figure 7-1, with increasing diffusion time ∆.

Svensk Kärnbränslehantering ABSwedish Nuclear Fueland Waste Management Co
Box 250, SE-101 24 Stockholm Phone +46 8 459 84 00
Technical Report
TR-09-27
ISSN 1404-0344CM Gruppen AB, Bromma, 2009
Magnetic resonance imaging and nuclear magnetic resonance investigations of bentonite systems
Sergey V Dvinskikh, István Furó
Industrial NMR Centre and Division of Physical Chemistry
Department of Chemistry, Royal Institute of Technology
September 2009