magnitude and pattern of cesarian section deliveries …
TRANSCRIPT
Private Health Sector Project
MAGNITUDE AND PATTERN OF
CESARIAN SECTION DELIVERIES IN
PRIVATE FACILITIES IN ADDIS
ABABA

2
The Private Health Sector Project (PHSP) is a technical assistance project to support the Government of Ethiopia.
PHSP is managed by Abt Associates Inc. and is funded by the United States Agency for International Development
(USAID), under Contract No. AID-663-LA-16-00001.
Recommended Citation: Dereje N., Mesfin E., Asfawesen G/Y., Mesfin T. 2019. Magnitude and pattern of
caesarian section deliveries in private facilities in Addis Ababa. Abt Associates. Maryland, USA
Submitted to: Dr. Mesfin Tilaye
Agreement Officer’s Representative
Strategic Information Advisor
USAID| Ethiopia
Addis Ababa, Ethiopia
Submitted by: Dr. Mesfin Teferi,
Chief of Party
USAID| Private Health Sector Project
Abt Associates Inc. 1 6130 Executive Blvd.
1 Rockville, Maryland 20852 1 T. 301.347.5000 1 F. 301.913.9061
1 www.abtassociates.com

DISCLAIMER The authors’ views expressed in this publication do not necessarily reflect the views of the United States Agency
for International Development (USAID) or the United States Government
MAGNITUDE AND PATTERN OF
CESARIAN SECTION DELIVERIES IN
PRIVATE FACILITIES IN ADDIS ABABA


i
CONTENTS
Acronyms ........................................................................................................................................ iv
1. Introduction .............................................................................................................................. 1
2. Problem Statement .................................................................................................................... 1
3. Literature Review ..................................................................................................................... 3
4. Objectives ................................................................................................................................. 4
5. Methodology............................................................................................................................. 5
5.1 Study Area .................................................................................................................................... 5
5.2 Operational Definitions ................................................................................................................. 5
5.3 Facility selection ........................................................................................................................... 6
5.4 Data collection .............................................................................................................................. 6
5.5 Data entry and analysis ................................................................................................................. 6
5.6 Ethical issues ................................................................................................................................. 6
5.7 Limitations .................................................................................................................................... 7
6. Results ...................................................................................................................................... 7
6.1 Cost of spontaneous vaginal delivery (SVD), CS procedure, and post-operative hospital stay .....
7
6.2 Caesarian section rates .................................................................................................................. 8
7. Mode of delivery ...................................................................................................................... 9
8. Age at delivery ........................................................................................................................10
9. Fetal outcomes .........................................................................................................................10
10. Charts review for Caesarian Section .....................................................................................12
11. Facility contribution to Addis Ababa CS rates......................................................................12
12. Age of the mothers’ who underwent CS ...............................................................................13
13. Reproductive history of mothers ..........................................................................................13

ii
14. Gestational age at delivery ...................................................................................................14
15. Type of previous deliveries ..................................................................................................14
16. Number of previous CS operations .......................................................................................15
17. History of medical, surgical and obstetric illnesses in the past .............................................15
18. ANC, birth preparedness counseling and partograph use ......................................................16
19. CS types (primary / secondary, elective / emergency) ..........................................................17
20. Reason for current CS ..........................................................................................................17
21. Fetal and maternal health outcomes ......................................................................................18
22. Discussion ............................................................................................................................18
23. Conclusion ...........................................................................................................................22
24. Recommendations ................................................................................................................22
Annex I. List of facilities selected for the study ..............................................................................24
Annex II. Data collection instrument ...............................................................................................25
Annex III. Selected Studies Conducted on magnitude of CS delivery and indications .....................29
References ......................................................................................................................................30
LIST OF TABLES
Table 1: General type of information of the private facilities selected for determinants of caesarian section
January – December 2018. ............................................................................................................................ 8
Table 2: CS rate by facility Jan. 2018-Dec. 2018 ......................................................................................... 9
Table 3: Mode of deliveries at the private health facilities for selected months of studies, January –
December 2018 ............................................................................................................................................. 9
Table 4: Maternal age at the time of delivery, Addis Ababa, January - December 2018 ........................... 10
Table 5. Maternal Health Outcomes, January - December 2018. ............................................................... 10
Table 6: The fetal outcome by the time of delivery from delivery registers at the private health facilities,
Addis Ababa, January-December 2018. ..................................................................................................... 11
Table 7: CS rate chart review contribution from private health facilities, Addis Ababa, December – January
2018. ........................................................................................................................................................... 12

iii
Table 8: Age of mothers delivering via CS at the private health facilities, Addis Ababa, January - December
2018. ........................................................................................................................................................... 13
Table 9: Reproductive history of the mothers having CS for the current pregnancy at the private facilities.
.................................................................................................................................................................... 14
Table 10: The gestational age in weeks of CS births in private facilities, Addis Ababa, January - December
2018. ........................................................................................................................................................... 14
Table 11: The mode of deliveries of the mothers for the previous pregnancies at the private health facilities,
January - December 2018. .......................................................................................................................... 15
Table 12: Total number of CS done for mothers in their previous pregnancies at the private facilities,
January - December 2018. .......................................................................................................................... 15
Table 13: History of medical, surgical and other Obstetric conditions of the mothers with Caesarian section,
January - December 2018. .......................................................................................................................... 16
Table 14: ANC follow up, birth preparedness counselling and use of partograph at the facilities for CS
Clients, January - December 2018. ............................................................................................................. 16
Table 15: Caesarian section schedule and pattern for clients having CS, January - December 2018. ........ 17
Table 16: Reasons for the CS at the private health facilities, January - December 2018. .......................... 17
Table 17: Fetus weight CS delivery at private facilities, Jan. Dec. 2018.................................................... 18
iv
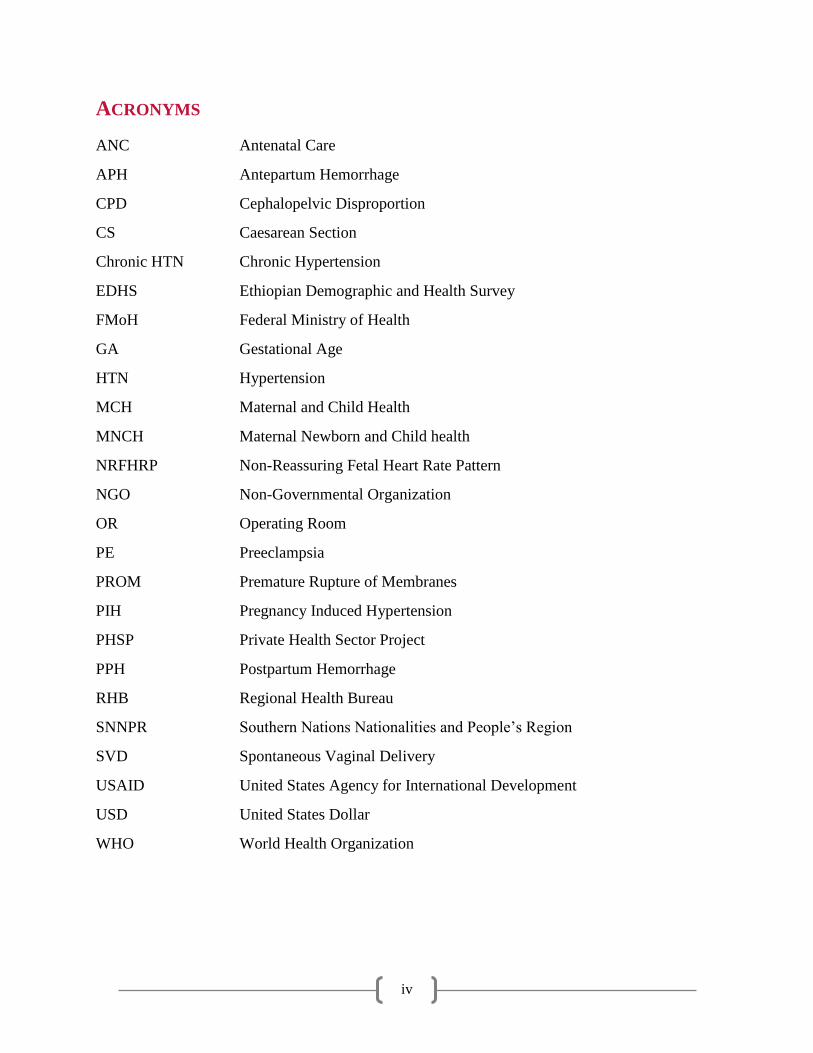
ACRONYMS
ANC Antenatal Care
APH Antepartum Hemorrhage
CPD Cephalopelvic Disproportion
CS Caesarean Section
Chronic HTN Chronic Hypertension
EDHS Ethiopian Demographic and Health Survey
FMoH Federal Ministry of Health
GA Gestational Age
HTN Hypertension
MCH Maternal and Child Health
MNCH Maternal Newborn and Child health
NRFHRP Non-Reassuring Fetal Heart Rate Pattern
NGO Non-Governmental Organization
OR Operating Room
PE Preeclampsia
PROM Premature Rupture of Membranes
PIH Pregnancy Induced Hypertension
PHSP Private Health Sector Project
PPH Postpartum Hemorrhage
RHB Regional Health Bureau
SNNPR Southern Nations Nationalities and People’s Region
SVD Spontaneous Vaginal Delivery
USAID United States Agency for International Development
USD United States Dollar
WHO World Health Organization

1
1. INTRODUCTION
The Private Health Sector Project (PHSP), funded by the United States Agency for International
Development (USAID), works with private health facilities in Ethiopia to contribute towards the mitigation
of impact of diseases of public health importance through the engagement of the private health sector. PHSP
works closely with 341 private health facilities in Ethiopia (52 with maternal, newborn, and child health
(MNCH) service provision capabilities), including 51 in Addis Ababa (27 of which provide MNCH
services) providing technical support to increase the provision and quality of health services, including
MNCH services.
As part of routine data collection in project-supported facilities, PHSP observed high rates of caesarian
section (CS) deliveries, especially in Addis Ababa facilities. The project conducted a study to better
understand the magnitude and pattern of CS deliveries in private facilities in Addis Ababa.
2. PROBLEM STATEMENT
CS deliveries can be life-saving for both the mother and child when it is medically required. However, there
is a growing concern regarding the increasing rate of selective CS deliveries globally where there is not an
immediate medical need. The risks and costs associated with CS deliveries are significant, and evidence
shows that caesarean delivery and maternal death are positively associated largely due to bleeding, infection
and anesthesia related complications. Cesarean delivery is a marker of access to, and availability and
utilization of obstetric services but, where rates are extremely high, it may also indicate a mismatch between
evidence and practice in obstetrics.
According to the 2010 Ethiopian Federal Ministry of Health (FMoH) annual report, the CS rate in Addis
Ababa was 36%. A study investigating caesarean delivery practices in teaching public and non-
government/private maternal and child health (MCH) hospitals in Addis Ababa, found that the CS rate
documented in public hospitals was 31.1%, and in private hospitals 48.3% (Hussen, Shiferaw, and Lukman
2014)). Additionally, according to the PHSP project data collected from the 52 PHSP-supported MNCH
facilities, the CS rate increased by nearly doubled between April 2017 and December 2018 from 25%
(1066/4234) to 47% ( 3318/ 6849).
The World Health Organization (WHO) recommends an ideal CS rate between 10-15%, which has recently
been supported by study results from a review of 137 countries. According to this guidance, when rates fall
below 10%, it indicates mothers are not able to access what can be a lifesaving procedure (Yibeltal 2016).
Further research shows that CS rates beyond 15% are considered medically unjustified or unnecessary, with

2
negligible benefits for most mothers, and are costly and often unequally distributed amongst the population.
In Ethiopia, the national CS rate stands at 3.79%, which is significantly below the WHO recommended
rate, signifying barriers in access. There are also significant regional variations, ranging as low as 0.76% in
Somali region to a high of 41 % in Addis Ababa (Ethiopian FMoH 2011), which may indicate unequal
access across different groups.
The contrast between the extremely low cesarean rates for most of the population of the country and the
high institutional rates in Addis Ababa and the private for-profit hospitals is a dramatic indicator of a
country in transition; struggling to ensure equitable and appropriate access to comprehensive obstetric and
newborn care.
The Ethiopian FMoH states that every pregnant woman in Ethiopia has the right to information about her
health, to discuss her concerns with a provider, to know in advance about any planned procedure to be
performed, privacy, confidentiality, and to express her views about the services she receives. To fulfil these
rights, in 2010 the Government of Ethiopia developed an Obstetrics Management Protocol (the only
available protocol to date) based on the WHO’s goal-oriented model. The protocol focuses on a limited set
of essential antenatal, delivery, postnatal and newborn care services, and prescribed statements about
indications in the use of procedures such as CS (Ethiopian FMoH 2010).
Moreover, in the above mentioned document, it was established that “caesarean section is performed when
safe vaginal delivery is either not feasible (absolute) or would impose undue risks to the mother and/or fetus
(relative)” (Ethiopian FMoH 2010). The protocol further states that appropriate indications, and the
presence of a trained provider and appropriate equipment and facilities are the prerequisites for CS
(Ethiopian FMoH 2010). It also requires that providers explain the procedure to the client or relatives to
seek informed consent. The protocol has details of the possible complications of the procedure and it states
that maternal mortality is higher after CS than after vaginal delivery. Although the protocol does not discuss
high rates of inappropriate CS that can be due to maternal requests, provider misjudgment, or an overall
failure to properly counsel on birth preparedness during ANC, the protocol does caution about the possible
inappropriate and excessive reliance on technology or procedures that can ultimately increase complications
and cost (Ethiopian FMoH 2010).
Moreover, a WHO survey on maternal and perinatal health carried out in 24 countries and 373 facilities
(using data from 289,635 deliveries), added to the growing body of evidence regarding the harmful effects
of excessive cesarean rates on maternal and newborn health outcomes. These studies showed higher
cesarean rates associated with increased maternal mortality and morbidity in Latin America and Asia, but
did not reveal this association in Africa, where rates were lower (Souza et al. 2010).

3
More alarming is that the increased cesarean rates were associated with poor newborn health outcomes in
all three regions, after controlling for many factors. In Africa, increasing emergency cesarean rates were
associated with increased intrapartum stillbirths, neonatal deaths, and severe neonatal morbidity (Souza et
al. 2010).
Therefore, the decision to perform CS should be based on clear, compelling, and well-supported medical
justifications. Clients/patients should be clearly informed about the benefits and the risks of the procedure
and be guided ethically for either informed consent or informed refusal for the procedure.
CS rates in private Addis Ababa facilities currently stand unacceptably high (47 % according PHSP data of
the last quarter, Oct-Dec. 2018) indicating a likely discrepancy in access when compared to the extremely
low rates of CS in more rural areas, and the overall national average. This statistic raises alarms of likely
high rates of the performance of the procedure without justifiable medical indications. This study aims to
explore the magnitude and the pattern of CS deliveries in private facilities in the city.
3. LITERATURE REVIEW
A literature review was conducted on both published and unpublished documents through an online search
with key words (“caesarean section”, “magnitude of caesarean section”, and “factors affecting caesarean
section delivery”) using the google search engine. The goal of the review was to review studies that have
been conducted to understand the CS rates, indications, fetal and maternal outcomes, rates at public versus
private health facilities in Ethiopia, and comparisons across African settings and globally to compare our
study findings and to reach plausible conclusions and establish a reasonable recommendation.
A study conducted at Felegehiwot Referral Hospital in Amhara regional state found that among the 2,967
eligible mothers, 25.3% had CS delivery (Abebe, Ashebir, and Gizachew 2018). An institutional-based
cross sectional study at Mizan-Aman General Hospital in Southern Nations Nationalities and People’s
Region (SNNPR) documented a prevalence of CS of 21.1% (Daniel and Singh 2018). Another cross-
sectional study was conducted in private and government hospitals in Harar town and showed an overall
prevalence of CS 34.3% (Linn and Siril 2018). Moreover, a cross-sectional retrospective study in Attat
Hospital, Gurage zone of SNNPR, registered a CS rate of 27.6% (Moges, Ade, and Akessa 2018).
When looking at clients’ demographics related to CS delivery, a cross-sectional survey conducted in Addis
Ababa in 2017 by Tsegaye Hiwot found that women older than 30 years are more likely to have CS delivery
when compared to younger age group mothers. However, contrary to that, another study based on the three
Ethiopia Demographic and Health Survey (EDHS) data (2000, 2005 and 2011), the national CS rate did not

4
show significant variation across the categories of maternal age groups (Central Statistical Agency and ICF
International 2012).
When it comes to maternal educational level, according to the study based on the three EDHS, the CS rate
increases with rise in maternal education and household wealth index (Central Statistical Agency and ICF
International 2012).
When looking at indications for CS delivery, a study conducted at Felegehiwot Referral Hospital found that
women having a history of CS deliveries and fetal weight of 4,000g were 3.93 and 13.68 times more likely
to give birth by CS (Abebe, Ashebir, and Gizachew 2015).
Further, a study conducted in Addis Ababa teaching public and non-governmental (NGO) MCH hospitals,
the leading indications in the NGO hospitals were: history of CS delivery (29.7%), Non-Reassuring Fetal
Heart Rate Pattern (17.8%), and cephalopelvic disproportion (CPD) (12.5%) (Yibeltal 2016).
When it comes to the differences in CS rates between the teaching government hospitals and the NGO
MCH hospitals, the difference was found to be statistically significant; 31.1% and 48.3% (P<0.05)
respectively (Yibeltal 2016). And according to the study based on the three EDHS, women who delivered
in private health facilities were twice as likely to have a CS as women who gave birth in the public health
facilities (20.6%) (Central Statistical Agency and ICF International 2012).
In conclusion, different studies in different parts of Ethiopia have identified relatively higher rates of CS in
private facilities when compared to public facilities, and certain medical histories and age were found to be
other factors related to a woman’s likelihood of delivering via CS (see Annex III for more information on
CS studies conducted worldwide and regionally.). However, the literature review found that when it comes
to other factors including ANC attendance, preexisting medical conditions, labor follow up, CS outcomes,
counselling, and average cost of the procedure, limited studies were available. Therefore, this study on the
magnitude and pattern of CS in private facilities in Addis Ababa will be a valuable addition to the evidence
base on this subject.
4. OBJECTIVES
General Objective:
1. To assess the number of CS deliveries and the associated determining factors in private health
facilities in Addis Ababa
Specific Objectives:
5
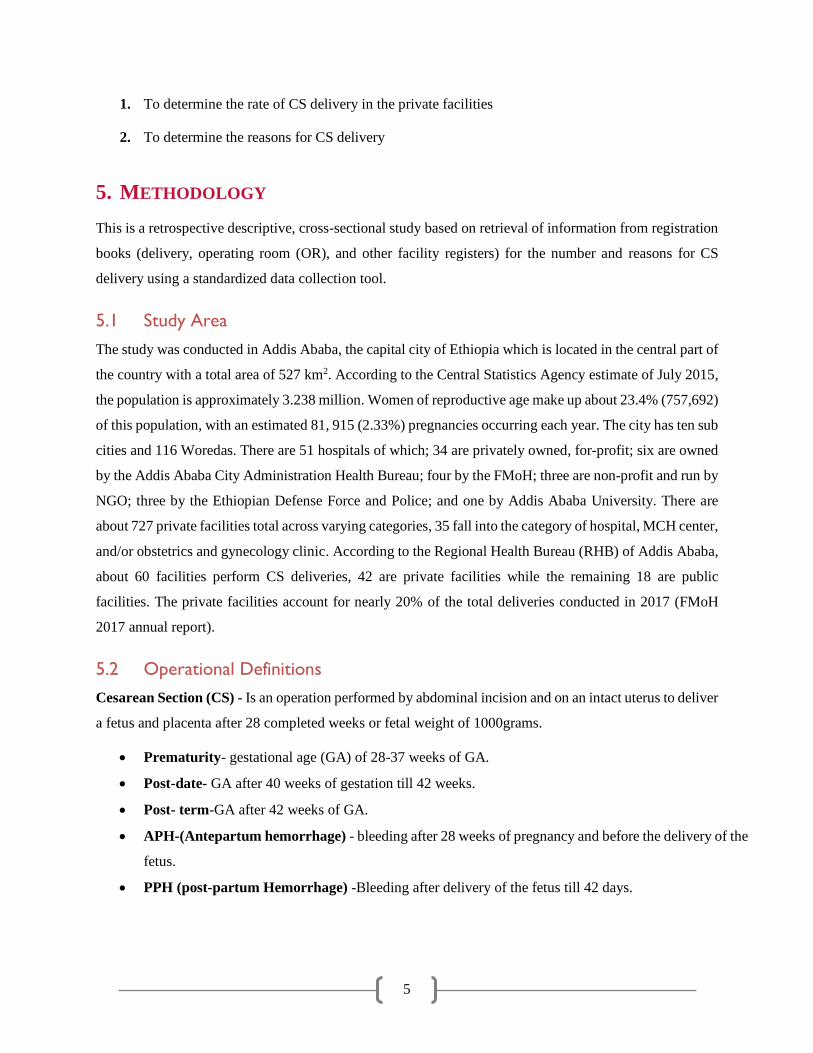
1. To determine the rate of CS delivery in the private facilities
2. To determine the reasons for CS delivery
5. METHODOLOGY
This is a retrospective descriptive, cross-sectional study based on retrieval of information from registration
books (delivery, operating room (OR), and other facility registers) for the number and reasons for CS
delivery using a standardized data collection tool.
5.1 Study Area
The study was conducted in Addis Ababa, the capital city of Ethiopia which is located in the central part of
the country with a total area of 527 km2. According to the Central Statistics Agency estimate of July 2015,
the population is approximately 3.238 million. Women of reproductive age make up about 23.4% (757,692)
of this population, with an estimated 81, 915 (2.33%) pregnancies occurring each year. The city has ten sub
cities and 116 Woredas. There are 51 hospitals of which; 34 are privately owned, for-profit; six are owned
by the Addis Ababa City Administration Health Bureau; four by the FMoH; three are non-profit and run by
NGO; three by the Ethiopian Defense Force and Police; and one by Addis Ababa University. There are
about 727 private facilities total across varying categories, 35 fall into the category of hospital, MCH center,
and/or obstetrics and gynecology clinic. According to the Regional Health Bureau (RHB) of Addis Ababa,
about 60 facilities perform CS deliveries, 42 are private facilities while the remaining 18 are public
facilities. The private facilities account for nearly 20% of the total deliveries conducted in 2017 (FMoH
2017 annual report).
5.2 Operational Definitions
Cesarean Section (CS) - Is an operation performed by abdominal incision and on an intact uterus to deliver
a fetus and placenta after 28 completed weeks or fetal weight of 1000grams.
Prematurity- gestational age (GA) of 28-37 weeks of GA.
Post-date- GA after 40 weeks of gestation till 42 weeks.
Post- term-GA after 42 weeks of GA.
APH-(Antepartum hemorrhage) - bleeding after 28 weeks of pregnancy and before the delivery of the
fetus.
PPH (post-partum Hemorrhage) -Bleeding after delivery of the fetus till 42 days.

6
PIH (Pregnancy induced hypertension) a hypertensive disorder related to pregnancy including
preeclampsia (PE), eclampsia, chronic hypertension (Chronic HTN), and gestational HTN.
5.3 Facility selection
To select facilities for this study, PHSP obtained facility profiles from the Addis Ababa City Administration
Health Bureau. Based on this information, a total of 60 facilities were found to be capable of CS deliveries
(36 private for-profit, 20 government, and 4 non-profit NGO facilities). All government facilities were
excluded from the study. To ensure included facilities had sufficient numbers of CS deliveries for study,
all private facilities (including NGO’s) reporting less than 100 CS deliveries per 6 months, between July
and December 2018 were eliminated from study inclusion. Based on this inclusion criteria, 24 facilities
were selected for the study (see Annex 1).
5.4 Data collection
To collect all information related to deliveries and ANC visits within the study time period (January 2018-
December 2018), one month from each quarter in 2018 was randomly selected, assuming there could be
seasonal variation in the number of deliveries and, hence CS deliveries. Accordingly, the months of March,
May, August, and November 2018 were selected (source document is the delivery and ANC registration
books).
All deliveries conducted in the above months were reviewed from the 24 selected facilities from Addis
Ababa (based on those with more than 100 CS per 6 month). From each month, 10% of the CS deliveries
charts were randomly selected, and data was abstracted at the facilities using a standardized tool (see Annex
2).
5.5 Data entry and analysis
Data entry and analysis was conducted at PHSP offices using the latest version of SPSS (25.0). Data
abstracted at the facilities using the standardized tool was entered into SPSS. The CS rate in the sample
facilities was determined, and analysis conducted to identify major determinants and reasons for CS.
5.6 Ethical issues
Confidentiality of information: collected data was kept confidential, the data collection tool did
not abstract patient names or any other individual identifiers.
Ethical clearance: Ethical clearance was obtained from Abt’s Internal Review Board and was
submitted to the Addis Ababa Health Bureau, together with data collection instruments for review
7
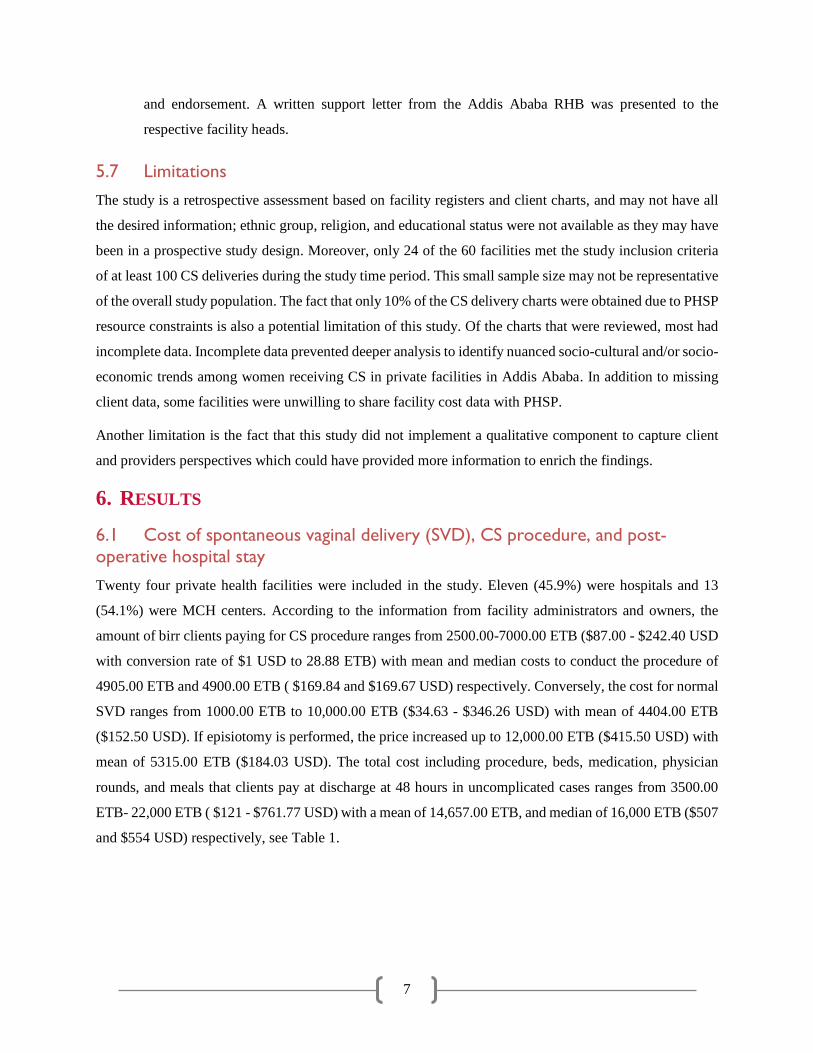
and endorsement. A written support letter from the Addis Ababa RHB was presented to the
respective facility heads.
5.7 Limitations
The study is a retrospective assessment based on facility registers and client charts, and may not have all
the desired information; ethnic group, religion, and educational status were not available as they may have
been in a prospective study design. Moreover, only 24 of the 60 facilities met the study inclusion criteria
of at least 100 CS deliveries during the study time period. This small sample size may not be representative
of the overall study population. The fact that only 10% of the CS delivery charts were obtained due to PHSP
resource constraints is also a potential limitation of this study. Of the charts that were reviewed, most had
incomplete data. Incomplete data prevented deeper analysis to identify nuanced socio-cultural and/or socio-
economic trends among women receiving CS in private facilities in Addis Ababa. In addition to missing
client data, some facilities were unwilling to share facility cost data with PHSP.
Another limitation is the fact that this study did not implement a qualitative component to capture client
and providers perspectives which could have provided more information to enrich the findings.
6. RESULTS
6.1 Cost of spontaneous vaginal delivery (SVD), CS procedure, and post-
operative hospital stay
Twenty four private health facilities were included in the study. Eleven (45.9%) were hospitals and 13
(54.1%) were MCH centers. According to the information from facility administrators and owners, the
amount of birr clients paying for CS procedure ranges from 2500.00-7000.00 ETB ($87.00 - $242.40 USD
with conversion rate of $1 USD to 28.88 ETB) with mean and median costs to conduct the procedure of
4905.00 ETB and 4900.00 ETB ( $169.84 and $169.67 USD) respectively. Conversely, the cost for normal
SVD ranges from 1000.00 ETB to 10,000.00 ETB ($34.63 - $346.26 USD) with mean of 4404.00 ETB
($152.50 USD). If episiotomy is performed, the price increased up to 12,000.00 ETB ($415.50 USD) with
mean of 5315.00 ETB ($184.03 USD). The total cost including procedure, beds, medication, physician
rounds, and meals that clients pay at discharge at 48 hours in uncomplicated cases ranges from 3500.00
ETB- 22,000 ETB ( $121 - $761.77 USD) with a mean of 14,657.00 ETB, and median of 16,000 ETB ($507
and $554 USD) respectively, see Table 1.

8
6.2 Caesarian section rates
One year’s worth of retrospective data on the pattern of deliveries at the 24 facilities were collected from
January I, 2018-December 31, 2018. The results showed that from all the 24 facilities, a total of 22,781
deliveries occurred with a CS rate of 57.8% (13,703), while 34.9 %( 8,223) were SVDs, and 3.9% (855)
instrumental assisted vaginal deliveries.
The CS rates during the one year study period in individual facilities ranged from as low as 41.0 % to as
high as 99.0 % with a mean rate of 64.0 .0%. The very high rate was likely due to the fact that this specific
facility was involved in CS deliveries referred from other obstetrics and gynecology specialty clinics
nearby.
The CS rates for the months of March, May, August and November 2018 had a similar pattern which was
as low as 40.0 % in one facility to as high as 98.0 % with mean of 64.0 .0% . The CS rates from one year
data and the selected months is depicted in Table 2.
Table 1: General type of information of the private facilities selected for determinants of
caesarian section January – December 2018.
Characteristic measured Number
(n=24)
Percent
1 Type of facility
Hospital 11 45 %
MCH Specialty center 13 54 %
2 Payment for C/S procedure only
2500-4000 birr 3 13 %
4001-5500 birr 13 54 %
5501-7000 birr 4 17%
No data 4 17%
3 Payment for all services related to C/S including procedure, bed,
medications, meal, physician rounds, etc.)
3550 birr 1 4%
7500-10,000 birr 4 17%
10,001-17,000 birr 9 38 %
Above 17,000 birr 7 29%
No data 3 13%
4 Payments for SVD
Mean =4404 birr
1000-3000 birr 10 42 %
3001-6000 birr 9 38 %
Greater than 6000 birr 5 21%
5 Payments for SVD with Episiotomy
Mean =5315 birr
1000-3000 birr 5 21 %
3001-6000 birr 11 46 %
Greater than 6000 birr 7 29%
No data 1 4%
9
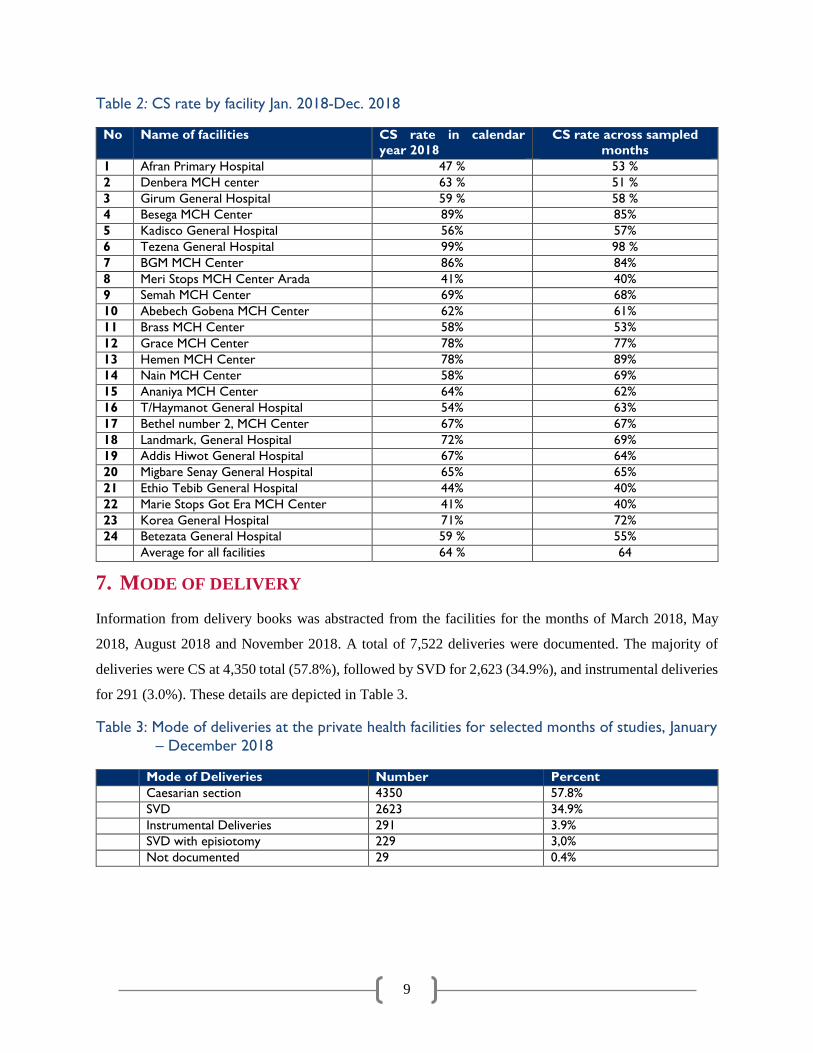
Table 2: CS rate by facility Jan. 2018-Dec. 2018
No Name of facilities CS rate in calendar
year 2018
CS rate across sampled
months
1 Afran Primary Hospital 47 % 53 %
2 Denbera MCH center 63 % 51 %
3 Girum General Hospital 59 % 58 %
4 Besega MCH Center 89% 85%
5 Kadisco General Hospital 56% 57%
6 Tezena General Hospital 99% 98 %
7 BGM MCH Center 86% 84%
8 Meri Stops MCH Center Arada 41% 40%
9 Semah MCH Center 69% 68%
10 Abebech Gobena MCH Center 62% 61%
11 Brass MCH Center 58% 53%
12 Grace MCH Center 78% 77%
13 Hemen MCH Center 78% 89%
14 Nain MCH Center 58% 69%
15 Ananiya MCH Center 64% 62%
16 T/Haymanot General Hospital 54% 63%
17 Bethel number 2, MCH Center 67% 67%
18 Landmark, General Hospital 72% 69%
19 Addis Hiwot General Hospital 67% 64%
20 Migbare Senay General Hospital 65% 65%
21 Ethio Tebib General Hospital 44% 40%
22 Marie Stops Got Era MCH Center 41% 40%
23 Korea General Hospital 71% 72%
24 Betezata General Hospital 59 % 55%
Average for all facilities 64 % 64
7. MODE OF DELIVERY
Information from delivery books was abstracted from the facilities for the months of March 2018, May
2018, August 2018 and November 2018. A total of 7,522 deliveries were documented. The majority of
deliveries were CS at 4,350 total (57.8%), followed by SVD for 2,623 (34.9%), and instrumental deliveries
for 291 (3.0%). These details are depicted in Table 3.
Table 3: Mode of deliveries at the private health facilities for selected months of studies, January
– December 2018
Mode of Deliveries Number Percent
Caesarian section 4350 57.8%
SVD 2623 34.9%
Instrumental Deliveries 291 3.9%
SVD with episiotomy 229 3,0%
Not documented 29 0.4%

10
AGE AT DELIVERY
From the total of 7,522 deliveries recorded in the registers, age was documented for 98.0 % of clients. The
average age of the mothers was 28.2 years and the majority of them (56.0 %) were in the age range of 21-
29 years, followed by 30-39 years of age which was 39.0 %. The details are in Table 4. See section 6.3 for
CS-specific age details.
Table 4: Maternal age at the time of delivery, Addis Ababa, January - December 2018
Age ( years ) Number (n=X) Percent
15-20 years 192 3%
21-29 years 4203 56%
30-39 years 2896 39%
40 and above 85 1%
No age recorded 146 2%
From the total of 7,522 deliveries documented, the maternal outcome data shows that in 97.2% (7308) of
cases mothers experienced stable outcomes, and nine deliveries (0.1 %) resulted in maternal death. Six
mothers were unstable and referred for further care. Nearly 3% of mothers, 199 (2.6 %), had no record of
their outcome at the time of delivery. The primary maternal complications (22 total, 0.03%) included pre-
eclampsia, or PPH, and APH. See Table 5.
Table 5. Maternal Health Outcomes, January - December 2018.
Maternal outcome Number (n=7522) Percent
Stable 7308 97.2 %
Unstable 6 0.1 %
Death 9 0.1%
Not documented 199 2.6%
Maternal complications documented ( stable mothers )
No complications 7286 99.7%
Pre-Eclampsia /Eclampsia 12 0.16%
APH 2 0.03%
PPH 6 0.08%
PIH 1 0.01%
Others 1 0.01%
8. FETAL OUTCOMES
Fetal outcome data was abstracted from the delivery registers for the first and second newborns (in instances
where mothers delivered twins, or more than one child during one parity). For the first newborns, 7,398
(98.3 %) were live births, and 91 (1.2 %) were still births, with very few, 27 (0.4%) with unknown status.
More than 91.0 % of the first newborns weighed more than 2,500 grams at birth. The Apgar score of the
11
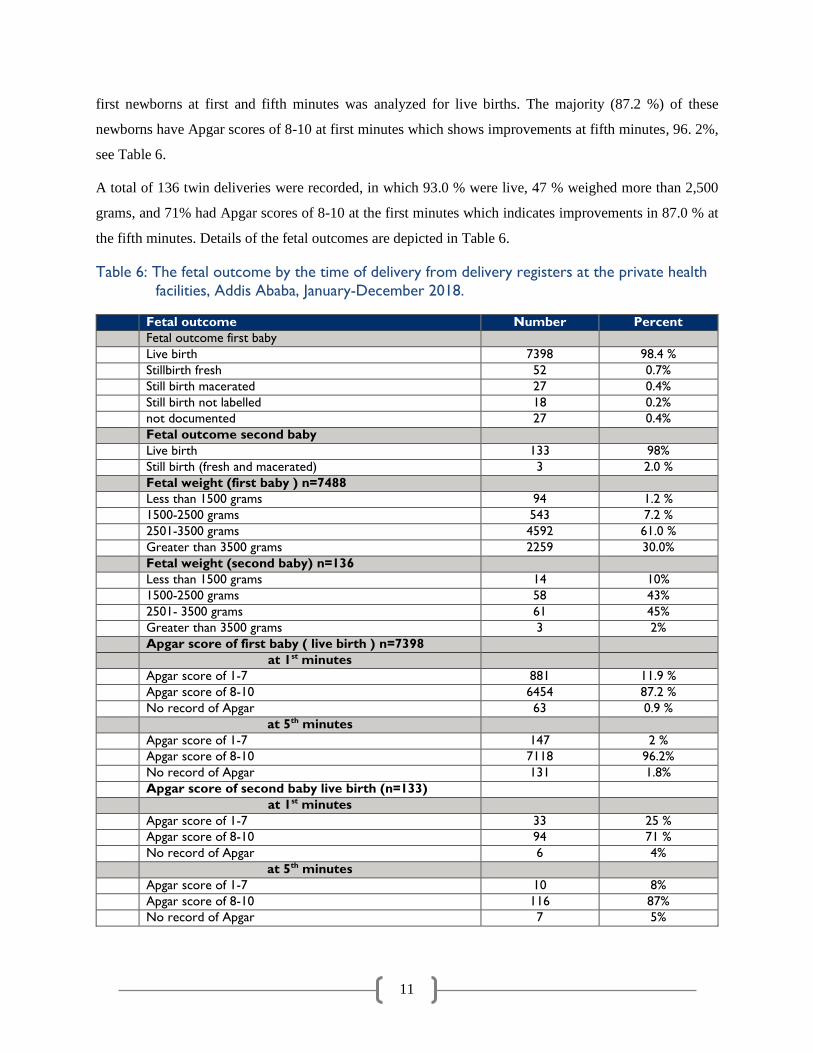
first newborns at first and fifth minutes was analyzed for live births. The majority (87.2 %) of these
newborns have Apgar scores of 8-10 at first minutes which shows improvements at fifth minutes, 96. 2%,
see Table 6.
A total of 136 twin deliveries were recorded, in which 93.0 % were live, 47 % weighed more than 2,500
grams, and 71% had Apgar scores of 8-10 at the first minutes which indicates improvements in 87.0 % at
the fifth minutes. Details of the fetal outcomes are depicted in Table 6.
Table 6: The fetal outcome by the time of delivery from delivery registers at the private health
facilities, Addis Ababa, January-December 2018.
Fetal outcome Number Percent
Fetal outcome first baby
Live birth 7398 98.4 %
Stillbirth fresh 52 0.7%
Still birth macerated 27 0.4%
Still birth not labelled 18 0.2%
not documented 27 0.4%
Fetal outcome second baby
Live birth 133 98%
Still birth (fresh and macerated) 3 2.0 %
Fetal weight (first baby ) n=7488
Less than 1500 grams 94 1.2 %
1500-2500 grams 543 7.2 %
2501-3500 grams 4592 61.0 %
Greater than 3500 grams 2259 30.0%
Fetal weight (second baby) n=136
Less than 1500 grams 14 10%
1500-2500 grams 58 43%
2501- 3500 grams 61 45%
Greater than 3500 grams 3 2%
Apgar score of first baby ( live birth ) n=7398
at 1st minutes
Apgar score of 1-7 881 11.9 %
Apgar score of 8-10 6454 87.2 %
No record of Apgar 63 0.9 %
at 5th minutes
Apgar score of 1-7 147 2 %
Apgar score of 8-10 7118 96.2%
No record of Apgar 131 1.8%
Apgar score of second baby live birth (n=133)
at 1st minutes
Apgar score of 1-7 33 25 %
Apgar score of 8-10 94 71 %
No record of Apgar 6 4%
at 5th minutes
Apgar score of 1-7 10 8%
Apgar score of 8-10 116 87%
No record of Apgar 7 5%
12
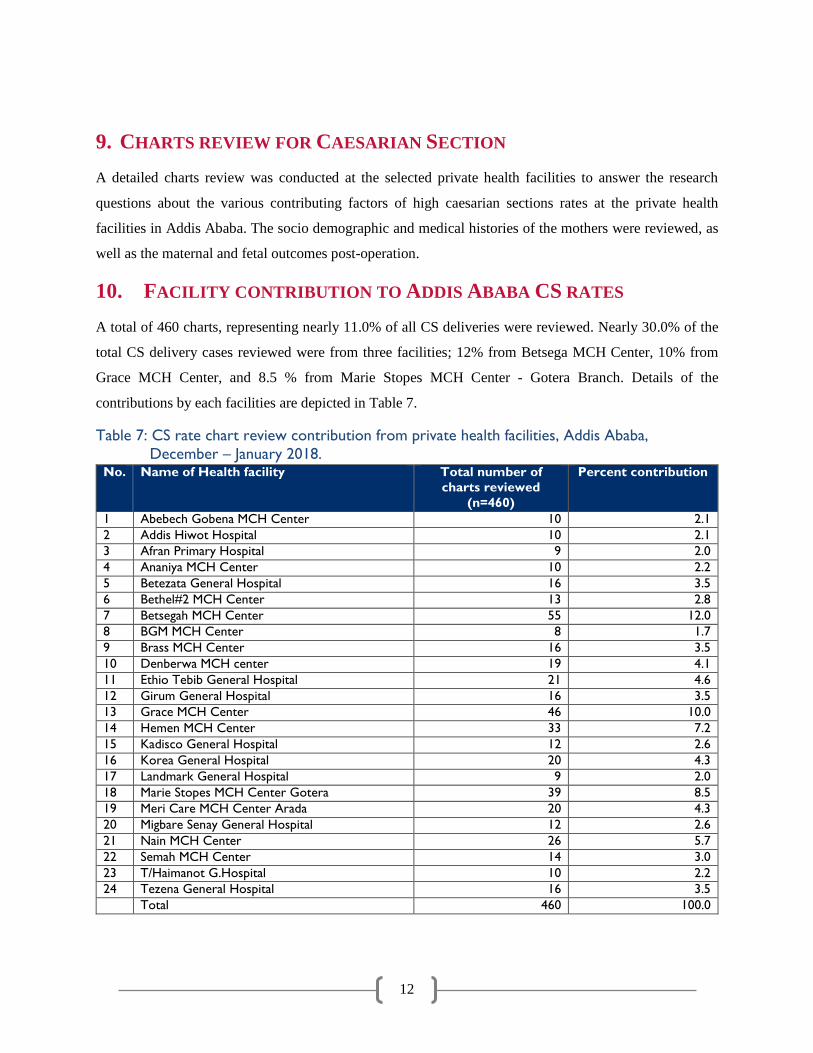
9. CHARTS REVIEW FOR CAESARIAN SECTION
A detailed charts review was conducted at the selected private health facilities to answer the research
questions about the various contributing factors of high caesarian sections rates at the private health
facilities in Addis Ababa. The socio demographic and medical histories of the mothers were reviewed, as
well as the maternal and fetal outcomes post-operation.
10. FACILITY CONTRIBUTION TO ADDIS ABABA CS RATES
A total of 460 charts, representing nearly 11.0% of all CS deliveries were reviewed. Nearly 30.0% of the
total CS delivery cases reviewed were from three facilities; 12% from Betsega MCH Center, 10% from
Grace MCH Center, and 8.5 % from Marie Stopes MCH Center - Gotera Branch. Details of the
contributions by each facilities are depicted in Table 7.
Table 7: CS rate chart review contribution from private health facilities, Addis Ababa,
December – January 2018. No. Name of Health facility Total number of
charts reviewed
(n=460)
Percent contribution
1 Abebech Gobena MCH Center 10 2.1
2 Addis Hiwot Hospital 10 2.1
3 Afran Primary Hospital 9 2.0
4 Ananiya MCH Center 10 2.2
5 Betezata General Hospital 16 3.5
6 Bethel#2 MCH Center 13 2.8
7 Betsegah MCH Center 55 12.0
8 BGM MCH Center 8 1.7
9 Brass MCH Center 16 3.5
10 Denberwa MCH center 19 4.1
11 Ethio Tebib General Hospital 21 4.6
12 Girum General Hospital 16 3.5
13 Grace MCH Center 46 10.0
14 Hemen MCH Center 33 7.2
15 Kadisco General Hospital 12 2.6
16 Korea General Hospital 20 4.3
17 Landmark General Hospital 9 2.0
18 Marie Stopes MCH Center Gotera 39 8.5
19 Meri Care MCH Center Arada 20 4.3
20 Migbare Senay General Hospital 12 2.6
21 Nain MCH Center 26 5.7
22 Semah MCH Center 14 3.0
23 T/Haimanot G.Hospital 10 2.2
24 Tezena General Hospital 16 3.5
Total 460 100.0
13
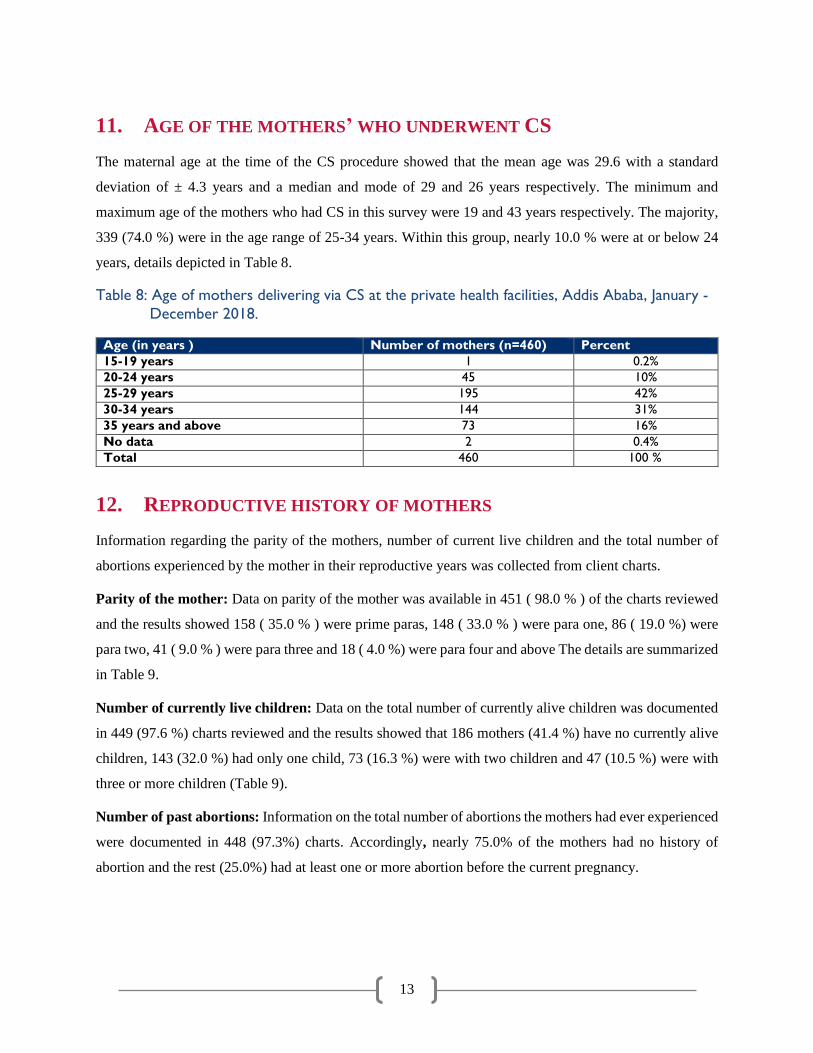
11. AGE OF THE MOTHERS’ WHO UNDERWENT CS
The maternal age at the time of the CS procedure showed that the mean age was 29.6 with a standard
deviation of ± 4.3 years and a median and mode of 29 and 26 years respectively. The minimum and
maximum age of the mothers who had CS in this survey were 19 and 43 years respectively. The majority,
339 (74.0 %) were in the age range of 25-34 years. Within this group, nearly 10.0 % were at or below 24
years, details depicted in Table 8.
Table 8: Age of mothers delivering via CS at the private health facilities, Addis Ababa, January -
December 2018.
Age (in years ) Number of mothers (n=460) Percent
15-19 years 1 0.2%
20-24 years 45 10%
25-29 years 195 42%
30-34 years 144 31%
35 years and above 73 16%
No data 2 0.4%
Total 460 100 %
12. REPRODUCTIVE HISTORY OF MOTHERS
Information regarding the parity of the mothers, number of current live children and the total number of
abortions experienced by the mother in their reproductive years was collected from client charts.
Parity of the mother: Data on parity of the mother was available in 451 ( 98.0 % ) of the charts reviewed
and the results showed 158 ( 35.0 % ) were prime paras, 148 ( 33.0 % ) were para one, 86 ( 19.0 %) were
para two, 41 ( 9.0 % ) were para three and 18 ( 4.0 %) were para four and above The details are summarized
in Table 9.
Number of currently live children: Data on the total number of currently alive children was documented
in 449 (97.6 %) charts reviewed and the results showed that 186 mothers (41.4 %) have no currently alive
children, 143 (32.0 %) had only one child, 73 (16.3 %) were with two children and 47 (10.5 %) were with
three or more children (Table 9).
Number of past abortions: Information on the total number of abortions the mothers had ever experienced
were documented in 448 (97.3%) charts. Accordingly, nearly 75.0% of the mothers had no history of
abortion and the rest (25.0%) had at least one or more abortion before the current pregnancy.

14
Table 9: Reproductive history of the mothers having CS for the current pregnancy at the
private facilities.
Number Parity (n=460) Live children currently
available (n=460)
Abortion
(n=460)
0 158 186 335
1 148 143 78
2 86 73 27
3 41 35 7
4 13 8 1
5 4 3 0
6 0 0 0
7 1 1 0
No data 9 11 12
13. GESTATIONAL AGE AT DELIVERY
The majority of the CS deliveries (84%) occurred during the GA category of 38-42 weeks followed by 28-
37 weeks and >=42 weeks of gestation, accounting for 13% and 1.0% of the cases respectively (Table 10).
Table 10: The gestational age in weeks of CS births in private facilities, Addis Ababa, January -
December 2018.
Gestational age ( weeks ) Number of mothers with C/S Percentage
28-37 62 13.0
38-42 386 84.0
>=42 3 1.0
No data 9 2.0
Total 460 100.0%
14. TYPE OF PREVIOUS DELIVERIES
Type of delivery for the first baby: Out of 258 mothers in which previous delivery type data was available,
180 (70.0 %) gave birth to their first children by CS, 76 (29.4 %) by SVD with episiotomy.
Type of delivery for the second baby: Data was available for 117 mothers on mode of delivery for their
second baby. The majority of this group 88 (75.0%) delivered by CS, with the remaining mothers through
SVD and episiotomy.
Type of delivery for third, fourth and fifth deliveries: CS was the most frequently documented mode of
delivery for the third, fourth and fifth deliveries in 26.0%, 50.0% and 100% of the mothers respectively
(see Table 11).

15
Table 11: The mode of deliveries of the mothers for the previous pregnancies at the private
health facilities, January - December 2018.
Order of Delivery SVD SVD and
Episiotomy
Instrumental C/S Total
n % n % n % n % n %
First delivery 74 29 % 2 O.8% 2 0.8 % 180 70 % 258 100 %
Second delivery 28 24 % 1 0.9% 0 0 88 75 % 117 100 %
Third delivery 16 35 % 0 0 0 0 30 26 % 46 100 %
Fourth delivery 4 50% 0 0 0 0 4 50% 8 100%
Fifth delivery 0 0 0 0 0 0 4 100% 4 100%
15. NUMBER OF PREVIOUS CS OPERATIONS
The mode of the previous delivery may influence the decision at the time of the procedure such as elective
or emergency for caesarian section. The details are depicted in Table 11.
Charts were reviewed to find out the total number of CSs mothers had before the current CS delivery.
Information was available for 456 (99.1%) of the cases, in which 47.0% had no history of previous CS and
52.4% had one or more CS deliveries. The details are depicted in Table 12.
Table 12: Total number of CS done for mothers in their previous pregnancies at the private
facilities, January - December 2018.
Total number of CS Number of mothers Percent
None 215 47.0
One 155 34 .0
Two 66 14 .0
Three 15 3.3
Four 5 1.1
No data 4 0.8
Total 460 100.0
16. HISTORY OF MEDICAL, SURGICAL AND OBSTETRIC ILLNESSES IN
THE PAST
During chart review, history of medical and surgical conditions were reviewed if documented.
Unfortunately, a significant number of charts did not have data on mothers’ medical histories (76%).
Mothers with a history of either post-date, post-term, pre-eclampsia or Gestational Diabetes Mellitus
(GDM) comprised 10.1% of the reviewed charts. A total of 2.8% and 3.5% of the cases had a history of
medical and surgical conditions respectively documented in their charts. See Table 13.

16
Table 13: History of medical, surgical and other Obstetric conditions of the mothers with
Caesarian section, January - December 2018.
Variables Number ( n=460 ) Percentage
Had history of chronic medical problem 13 2.8%
Had prior abdominal /pelvic or other surgeries 16 3.5%
Had GDM 6 1.3%
Post Date pregnancy 15 3.2%
Pre term pregnancy 12 2.6%
Pre-eclampsia /Eclampsia 14 3%
Others 34 7.4%
Not documented 350 76.0%
17. ANC, BIRTH PREPAREDNESS COUNSELING AND PARTOGRAPH
USE
From a total of 460 mothers who had a CS for the current pregnancy, 401 (87.0%) had ANC appointments
at the same facility in which the procedure was performed. Birth preparedness counselling was provided
for very few; 54 mothers (12.0%). Only 95 (20%) cases had a documented partograph.
Table 14: ANC follow up, birth preparedness counselling and use of partograph at the facilities
for CS Clients, January - December 2018.
Variables Number ( yes ) Percentage
ANC follow up at same facility 401 87 %
Birth preparedness counselling 54 12 %
Used partograph 95 20%

17
18. CS TYPES (PRIMARY / SECONDARY, ELECTIVE / EMERGENCY)
According to the chart review, 59.0 % of mothers had an elective CS operation, while 40.0% had the CS as
an emergency procedure. More than half (52.4%) of the mothers underwent the procedure for the first time
(primary CS), while in 46.1% of cases it was a repeat CS.
Table 15: Caesarian section schedule and pattern for clients having CS, January - December
2018.
Variables Number (n=460) Percentage
Caesarian section schedule
Elective 273 59 %
Emergency 182 40%
Unknown 5 1%
Cesarean section type ( based on Number)
Primary 241 52.4%
Repeat 212 46.1
Unknown 7 1.5%
19. REASON FOR CURRENT CS
The charts review showed that 207 (45.0%) of the CS deliveries were performed with an indication of
previous CS, followed by non-reassuring fetal heart rate pattern (NRFHR) (8.3%), and maternal request
(6.1%). The details for CS indications are depicted in Table 16.
Table 16: Reasons for the CS at the private health facilities, January - December 2018.
Indication for C/S Number Percent
Previous CS 207 45.0%
NRFHR 38 8.3%
Maternal request 28 6.1%
Breech presentation 23 5.0%
Failure to progress 21 4.6%
Failed induction 21 4.6%
CPD 20 4.3%
Poor Bio physical profile 14 3.0%
Pre-eclampsia/eclampsia 13 2.8%
Post term 11 2.4%
APH 9 2.0%
Obstructed Labor 7 1.5%
Multiple pregnancy 6 1.3%
Others 28 6.1%
Mal-presentation/malposition(other than breech) 3 0.7%
Cord prolapsed 4 0.9%
Unfavorable cervix 2 0.4%
Not documented 5 1.1%
Total 460 100 %

18
20. FETAL AND MATERNAL HEALTH OUTCOMES
Of the 460 mothers who delivered by CS, nearly 99.5% of the first deliveries were born live and only two
(0.05%) fetuses were documented as still birth (the still births were not labeled as fresh or macerated). More
than 529 (94.9 %) of the births weighted above 2,500 grams, while 26 (5.7%) were above 4,000 grams. The
Apgar scores at the first minutes were above five for all deliveries which had improved to more than eight
at the fifth minutes. Only seven twin deliveries were documented and all were alive with weights greater
than 1,500 grams, and had an Apgar score of seven and above at the first and fifth minutes.
Following the CS procedure, it was found that all mothers were alive with no documented maternal deaths.
However, two mothers had PPH as a complication and were managed appropriately.
Table 17: Fetus weight CS delivery at private facilities, Jan. Dec. 2018.
No Fetal weight of first baby (n=456) Number Percent
<=1500 grams 1 0.2%
1500-2500 grams 24 5.3%
2500-4000 grams 505 88.8%
>=4000 grams 26 5.7%
21. DISCUSSION
The cost of SVD ranges from 2,500.00-7,000.00 ETB ($87.00 - $242.40USD with conversion rate of 1
USD to 28.88 ETB -based on June 2019 conversion rate) while CS procedures with a 48 hours stay (which
is the usual practice in private facilities in Ethiopia) payment ranges from 3,500 ETB-22, 000.00 ETB
($121.29 - $761.77). The mean CS procedure cost and 48 hours payment were $169.8 and $507.1
respectively. This finding was three times higher than costs that were documented in Fishea et al. study
which documented an average cost of $155 USD across nearly all NGOs (nationally), and the private wing
of Jimma University specialized hospital ($129.0 USD). However, the Fishea et al. study did not compare
CS costs to SVD costs. The higher cost found in our study could be explained by the fact that there were
official devaluations and increased costs of living which happened since 2009.
The CS rate in our study was found to be 57.8% ( see Table 3) with SVD rates standing at 34.9%, and 3.9%
instrument assisted vaginal delivery. The CS rate from our study is somewhat similar to the study conducted
in Mexico and a cross-sectional study performed at the university hospitals of Niknafs and Ali-Ibn Abi
Talib of Rafsanjan, Iran, in 2014. The Mexico study found a CS rate of 57.3%, and the Iran study found a
52.6% rate. The rate found in this study is higher than the rate on a retrospective study done in government

19
maternity hospitals in India 2014 and a retrospective study done in maternity hospital at Albania, with rates
of 25.66 and 32.3% respectively. This is likely due to the fact that all the later three studies were public
facilities (Neuman, Alcock, and Azard 2014) (Gjonej et al. 2015).
When compared with other African contexts, the rate found in this study is also higher. The two year cross-
sectional study carried out in a public tertiary hospital in Northwestern Nigeria found the caesarean section
rate to be 11.3%, and an analytic study conducted at the NGO and government-run Tanzania St. Joseph
Medical Hospital found the CS rate was 18% (Daniel and Singh 2016) (Linn and Stokke 2009).
The CS rate finding of 57.8% is higher than the 2010 Ethiopian Calendar annual report, and 2011
semiannual report of the Federal Ministry of Health which documented a CS rate in Addis Ababa as 36%,
and 41 % respectively. It is also higher than the study conducted on caesarean delivery practices in teaching
public and non-government/private MCH hospitals in Addis Ababa where the CS rate in private hospitals
was 48.3% (Hussen, Shiferaw, and Lukman 2014). Similarly our CS rate is higher than the rates reported
from the PHSP collected data from its 52 supported MNCH facilities where the CS was between 25-47.0%,
from April 2017-Dec. 2018.
Moreover it is also more than what was found in Yebeltal et al. study which was 41.1% in 2013-2014.
Additionally, the CS rate from this study was higher than what was reported from that of the Felegehiwot
Referral Hospital, Mizan-Aman General Hospital, and Eastern Ethiopia Hospital based study in Harar,
21.1%, 34.35%, 27.6%, and 34.3% respectively (Yibeltal T. Bayou 2016) (Abebe F, Ashebir N, Gizachew
A 2015) (Moges A, Ade me B, Akessa G 2015) (Central Statistical Agency [Ethiopia] 2011 2012).
Higher rates found in this study may be due to higher rates of CS in big cities like Addis Ababa as a result
of the availability of technology for advanced obstetric services, high rates of maternal healthcare
utilization, and availability of private healthcare facilities. The higher rate in this study could be due to the
fact that our study only enrolled private facilities from Addis Ababa, where there is more capacity to
perform CS and the clientele are typically of a higher socio-economic group with more ability to pay for
the service.
When it comes to the reasons for CS, the majority of procedures occurred because of the mothers’ history
of delivering through this method (45.0%). The next most prominent reason for CS delivery was because
of NRFHR (8.3%), and finally because of maternal request (6.1%). The prevalence of previous CS in our
study is higher than what was found by Hiwot et al. In this study, a history of CS accounted for only 27.2%,
but NRFHR was 21.0%. Also in Hussen et al. study it is similarly documented that pervious CS delivery
accounted for 29.3% of the reasons in NGO hospitals. However, this finding was different from the study

20
conducted in Felegehiwot Referral Hospital in Northwest Ethiopia where the most frequent indication was
obstructed labor (30.7 %), followed by fetal distress (15.9%), and abnormal presentation (13.4%). In Attat
Hospital, Gurage Zone SNNPR, the leading causes for caesarean birth were CPD (38.1%), previous CS
(18.9%), and fetal distress (Abebe Ashebir, and Gizachew 2015) (Moges, Ade, and Akessa 2015). This
difference might be due to a decrease in the trend to consider vaginal birth after CS in the private facilities,
similar to what was documented in our study. This indicates that more mothers inclined for CS on their
own. This can likely signify the failure of medical personnel to give appropriate birth preparedness
counselling for possible vaginal delivery (Abebe, Ashebir, and Gizachew 2015) (Moges, Ade, and Akessa
2015).
The majority of mothers who delivered through CS in this study were between 21 and 29 years old (56.1%).
This is different from what was reported in a cross-sectional survey conducted in Addis Ababa where
women older than 30 years were found to be more likely to have CS delivery than a younger age groups.
Similarly, the study findings also contradicted the age structure reported from the three most recent EDHS
data (2000, 2005 and 2011), where the CS rate did not show significant variation across the categories of
maternal age groups. Moreover, the findings from this study are also contrary to the findings from the
Yebeltal et al. study where compared with young mothers ages 15–24 years, older mothers aged 30–49
years had greater odds of CS delivery, (odds ratio = 2.56) (Hussen, Shifewaw, and Lukman 2014). Based
on researcher observations and the current focus of the Ethiopian FMoH to increase use of epidurals and
other pain management medications during SVD, the lack of provision of pain management drugs in study
facilities could increase fear of pain by younger mothers and drive a higher demand among this group for
CS delivery.
When it comes to parity, 35.1% of the CS cases were primiparous which is somewhat similar to the Hiwot
et al. study that found 48.7 % to be primiparous. Regarding GA at CS, the majority (91.0%) occurred during
GA category of 37-42 weeks in our study which is similar to Hiwot et al. study of 85.2 % for GA of 37-42
weeks.
Regarding CS timing, 59.0% were elective in our study which is somewhat higher than Hiwot’s et al. study
which documented a CS performed on elective bases to be 41.2% of cases. Moreover, our emergency CS
rate of 41.0% is less than Hiwot’s study finding of 58.8%. Our finding is also contrary to the findings from
a study conducted in a Pakistani teaching hospital which found 61.35% emergency and 38.6%
elective(Maimoona Hafeez,et al.) .
However, the rate of elective CS operations in this study was lower than a study conducted in Atata
Hospital, Gurage Zone SNNPR, Ethiopia which found 90.4% emergency CSs, and only 9.6% elective. A

21
similar trend was identified in Felegehiwot referral hospital in Northwest Ethiopia; 90.3% emergency, and
9.7% elective. The observed discrepancy could be the increasingly large number of previous CS and
availability of private healthcare facilities in Addis Ababa unlike the other study findings mentioned above.
This study found that about 52.4% of CSs were primary, which is less than the study conducted in Addis
Ababa, Attat Hospital, and Gurage Zone SNNPR which documented rates of primary CS at 64.0%, 68.7%,
65.1% rates respectively (Hiwot 2017) (Abebe, Ashebir, and Gizachew 2015) (Moges, Ade, and Akessa
2015). The repeat CS rate in this study was 60.0%, which is higher than the study conducted in Addis by
Hiwot , in Attat Hospital, Gurage Zone SNNPR, and a study in Harar which documented rates of repeat CS
at 46.1% , 36.0% and 31.3 % respectively (Hiwot 2017) (Abebe, Ashebir, and Gizachew 2015) (Moges,
Ade, and Akessa 2015) .
Regarding the timing of CS, CS was electively performed in 59.0 % of mothers unlike the studies in Addis
Ababa (by Hiwot), the Felegehiwot Referral Hospital and Attata Hospital where elective CS rates of 41.2%,
9.6%, and 9.7% respectively were documented. This could be due to the fact that most public hospitals
receive and manage referred clients and have to provide more emergency CS’s rather than elective unlike
the private care facilities who largely manage mothers who were not in actual labor.
Moreover, the high elective CS rate could be influenced by many non-medical factors such as cultural
norms, personal characteristics of the woman, and socioeconomic factors (Hiwot 2017) (Abebe, Ashebir,
and Gizachew 2015) (Moges, Ade, and Akessa 2015, (Can ONER, Binali CATAK, Sevinç and Selçuk
2016).
Regarding outcomes of CS deliveries, of the 460 mothers who delivered by CS in this study, nearly 98.4%
of the first born baby was born alive, and only 1.6 % were documented as still birth. Ninety-eight percent
of second delivered twins were born alive, while 2.0% were still birth. This finding is higher than the 81%
live birth documented in Feshea et al. study. No maternal deaths were documented in this study, unlike the
findings in the above mentioned study where two women out of the 267 cases of cesarean delivery reviewed
died. (Fesseha et al. 2011).
The percentage of births having birth weight of 2,500-3,999 grams (88.8%) is somewhat higher than the
Hiwot study of 76.2%. This could be due to the fact that the private for-profit clients included in this study
are from better socioeconomic groups with better maternal health and nutritional status, resulting in better
birth weight.
Finally, while the standard practice and recommendation is to follow all laboring mothers using partograph,
this only occurred for one out of every five (20%) of the laboring mothers included in this study. However,
22
this figure is higher than what was found by Fishier et al. group which documented 12%. While 87.0% of
mothers had ANC visits in the same facility, only 12% of cases received some form of counselling on birth
preparedness.
22. Conclusion
The study describes the current level, pattern and magnitude of CS delivery in private health facilities in
Addis Ababa, Ethiopia.
There was a relatively higher cost for a CS procedure and 48 hour post-operation hospital stay when
compared to costs for SVD services; (the mean CS procedure cost and 48 hours stay payment were found
to be $169.8 and $507.1 USD respectively).
The study shows a CS rate of 57.8% across included private facilities, which is extremely high compared
to the WHO recommendation of 10-15%. These high rates could indicate unjustified overuse, which is of
equal concern as underuse. Underuse of planned/ elective and overuse of emergency CS could indicate
issues related to suboptimal counselling and birth preparedness counselling during antenatal care (ANC),
and at the time of labor and delivery.
Use of CS was highest amongst relatively young age groups (21-29 years) and prim parous women. The
majority of cases occurred at GA of 37-42 weeks. Elective and repeat CS cases accounted for the majority
of the cases reviewed in this study. While a history of CS was the most common reason for the CS reviewed
for this study, the other two most common reasons were NRFHR and maternal request.
In conclusion, we have provided evidence of substantially higher CS rates in private facilities in Addis
Ababa compared to the available literature on CS rates in facilities in other low- and middle-income
countries, and public facilities in Addis Ababa. Factors such as suboptimal client birth preparedness and
counselling on safe delivery options could be the drivers for the observed high CS rate in this study.
23. Recommendations
We highly recommend carrying out a detailed study to document factors that might affect CS rates by using
a prospective study design with qualitative component. Moreover, exploration of the clients’, providers’,
managers’ and facility owners’ perspectives regarding the ever increasing rate of CS delivery in private
health care facilities in Ethiopia is recommended.
In addition, providers must be advised to inform expectant mothers about birth preparedness in general and
the risks and benefits of CS in particular, provide pain relief medications during labor and delivery, provide

23
trial of vaginal birth as per the standard recommendation for previous CS, and also try to refrain from
unnecessary increased medicalization of labor and delivery by decreasing intervention as recommended by
WHO.
And finally, we also recommend the FMoH and AARHB to monitor the CS rates to make sure that it is
within the acceptable limits so as to avert maternal, fetal and newborn mortality without causing significant
risk following unnecessary procedure.

24
ANNEX I. LIST OF FACILITIES SELECTED FOR THE STUDY
No Name of facilities Sub city
PHSP
supports
Yes/No
C/S done
for six
month
Charts
for
Review
1 Abebech Gobena MCH Center Arada Sub City No 175 18
2 Addis Hiwot Hospital Bole Sub City Yes 246 25
3 Afran primary Hospital Kolfe Sub City No 148 15
4 Ananiya MCH Center Arada Sub City Yes 170 17
5 Betel No.2 MCH Hospital Lideta Sub City Yes 132 13
6 Bethezatha General Hospital Kirkos Sub City Yes 205 21
7 Betsega Mothers and Pediatrics Center Bole Sub City Yes 1168 117
8 BGM Mothers and Pediatrics Center Bole Sub City Yes 145 15
9 Brass Hospital Bole Sub City Yes 283 28
10 Dinberua MCH Center Yeka Sub City Yes 324 32
11 Ethi Tebib General Hospital Addis Ketema Sub City Yes 322 32
12 Girum General Hospital Addis Ketema Sub City No 180 18
13 Grace MCH Center Bole Sub City Yes 1007 101
14 Hemen MCH Center Arada Sub City Yes 240 24
15 Kadisko General Hospital Bole Sub City Yes 292 29
16 Koria Hospital Bole Sub City no 562 56
17 Landmark General Hospital Kirkos Sub City No 124 12
18 Marie Stopes MCH Specialty Center Kirkos Sub City No 849 85
19 Marie Stopes MCH Center Arada Sub City No 432 43
20 Migbare Senay General Hospital Yeka Sub City yes 110 11
21 Naine MCH Specialty Center Nifas Silk Lafto Sub City yes 254 25
22 Semah GYN and OBS Center Bole Sub City yes 200 20
23 Tekelhaimanot General Hospital Arada Sub City Yes 160 16
24 Tzana General Hospital Kolfe Sub City No 348 34
Total 8076 807
25
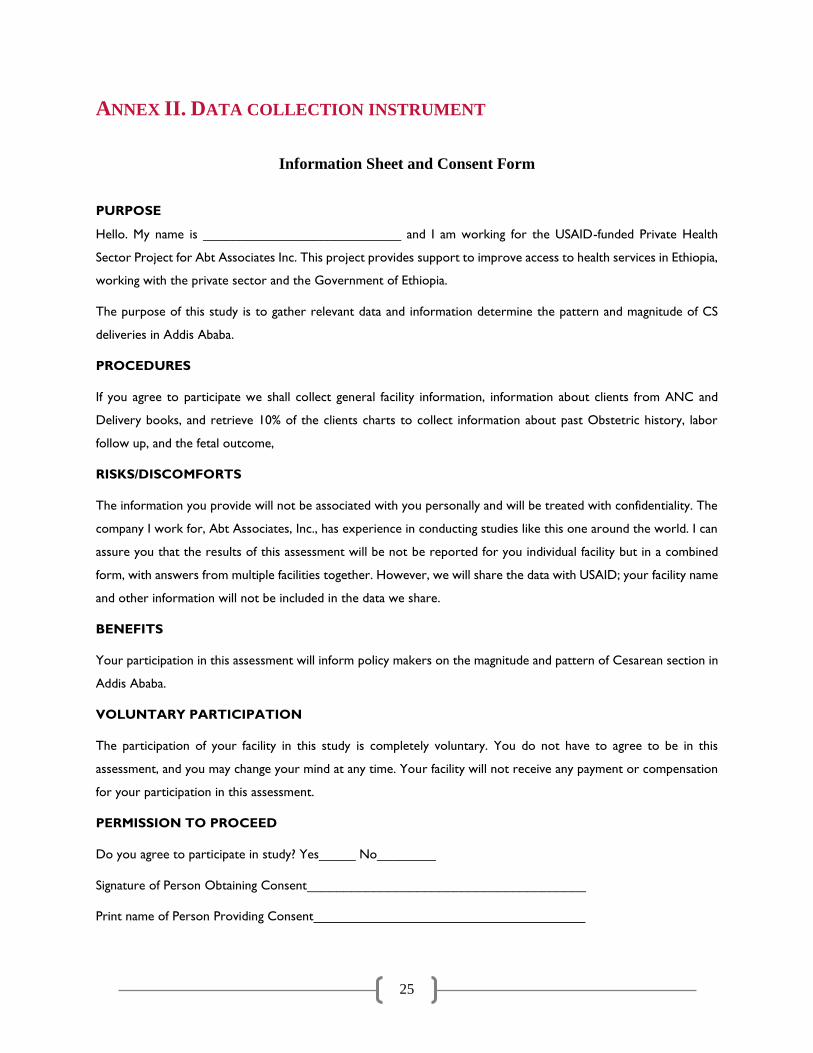
ANNEX II. DATA COLLECTION INSTRUMENT
Information Sheet and Consent Form
PURPOSE
Hello. My name is ___________________________ and I am working for the USAID-funded Private Health
Sector Project for Abt Associates Inc. This project provides support to improve access to health services in Ethiopia,
working with the private sector and the Government of Ethiopia.
The purpose of this study is to gather relevant data and information determine the pattern and magnitude of CS
deliveries in Addis Ababa.
PROCEDURES
If you agree to participate we shall collect general facility information, information about clients from ANC and
Delivery books, and retrieve 10% of the clients charts to collect information about past Obstetric history, labor
follow up, and the fetal outcome,
RISKS/DISCOMFORTS
The information you provide will not be associated with you personally and will be treated with confidentiality. The
company I work for, Abt Associates, Inc., has experience in conducting studies like this one around the world. I can
assure you that the results of this assessment will be not be reported for you individual facility but in a combined
form, with answers from multiple facilities together. However, we will share the data with USAID; your facility name
and other information will not be included in the data we share.
BENEFITS
Your participation in this assessment will inform policy makers on the magnitude and pattern of Cesarean section in
Addis Ababa.
VOLUNTARY PARTICIPATION
The participation of your facility in this study is completely voluntary. You do not have to agree to be in this
assessment, and you may change your mind at any time. Your facility will not receive any payment or compensation
for your participation in this assessment.
PERMISSION TO PROCEED
Do you agree to participate in study? Yes_____ No________
Signature of Person Obtaining Consent______________________________________
Print name of Person Providing Consent_____________________________________

26
QUESTIONNER ONE: DATA COLLECTION FORMAT
(FOR ALL FACILITIES)
No. Facility Information Response Code
1 Name of facility ---------------------
2 Type of facility 1 General Hospital
2 MCH center
3 Average payment of C/S in Ethiopian Birr ------birr
4 Average payment of SVD in Ethiopian Birr ------birr
II Data from labour and Delivery Book
5 Total No. of deliveries in the past one yea --------------deliveries
6 Total No. of CS deliveries in the past one
year
-----------------deliveries
7 Other instrumental assisted deliveries in the
past year
-----deliveries
8 Total number of deliveries in the months
(March, May, August and November
-----deliveries
9 CS delivery proportion in the months
(March, May, August and
-----deliveries
10 Other instrumental deliveries or
interventions (March May, August and
November
-----deliveries
QUESTINNER NO. TWO: FOR ALL DELIVERIES (FROM DELIVERY BOOK) No. Information Response Code
1 Client / patient information
1.1 MRN _______
1.2 Age _______
2 Mode of Delivery 1. SVD
2. SVD with episiotomy
3. CS
4. Instrumental delivery
3.Maternal and fetal Outcome and complications
3.1 Maternal outcome 1. Stable
2. Unstable
3. Referred
3.2 Fetal outcome 1. Live birth
2. Stillbirth
3.3 Weight in grams
3.4 Apgar score _____1st &_____5th minutes
3.5 Maternal complication 1. Pre-eclampsia/eclampsia
2. APH
3. PPH
4. Others
27
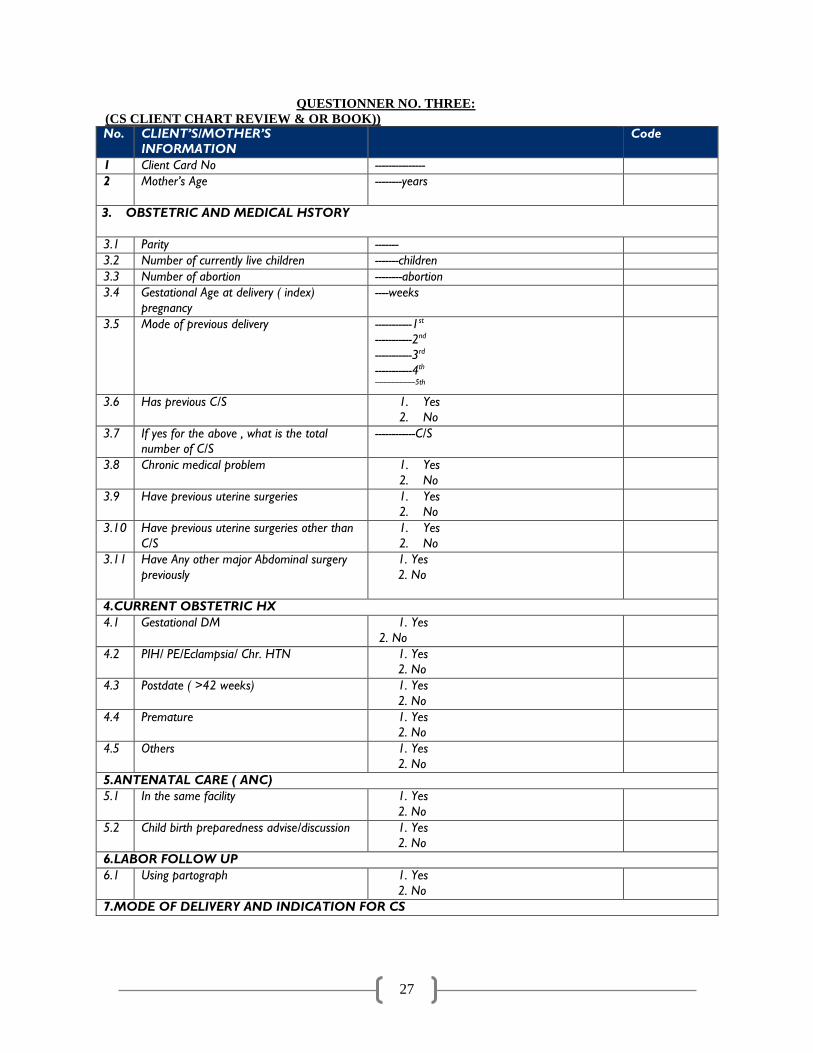
QUESTIONNER NO. THREE:
(CS CLIENT CHART REVIEW & OR BOOK)) No. CLIENT’S/MOTHER’S
INFORMATION
Code
1 Client Card No ---------------
2 Mother’s Age
--------years
3. OBSTETRIC AND MEDICAL HSTORY
3.1 Parity -------
3.2 Number of currently live children -------children
3.3 Number of abortion --------abortion
3.4 Gestational Age at delivery ( index)
pregnancy
----weeks
3.5 Mode of previous delivery -----------1st
-----------2nd
-----------3rd
-----------4th
--------------------5th
3.6 Has previous C/S 1. Yes
2. No
3.7 If yes for the above , what is the total
number of C/S
------------C/S
3.8 Chronic medical problem 1. Yes
2. No
3.9 Have previous uterine surgeries 1. Yes
2. No
3.10 Have previous uterine surgeries other than
C/S
1. Yes
2. No
3.11 Have Any other major Abdominal surgery
previously
1. Yes
2. No
4.CURRENT OBSTETRIC HX
4.1 Gestational DM 1. Yes
2. No
4.2 PIH/ PE/Eclampsia/ Chr. HTN 1. Yes
2. No
4.3 Postdate ( >42 weeks) 1. Yes
2. No
4.4 Premature 1. Yes
2. No
4.5 Others 1. Yes
2. No
5.ANTENATAL CARE ( ANC)
5.1 In the same facility 1. Yes
2. No
5.2 Child birth preparedness advise/discussion 1. Yes
2. No
6.LABOR FOLLOW UP
6.1 Using partograph 1. Yes
2. No
7.MODE OF DELIVERY AND INDICATION FOR CS

28
No. CLIENT’S/MOTHER’S
INFORMATION
Code
7.1 Timing if CS 1. Elective
2. Emergency
7.2 Number of CS 1. Primary(first time)
2. Repeat
7.3 Indication for CS of current 1. Obstructed Labor
2. CPD
3. APH
4. Previous C/S
5. Malpresentation/ malposition (other than
breech)
6. Breech presentation
7. Pre-eclampsia /eclampsia
8. Failure to progress
9. Failed induction
10. Cord prolapsed
11. Post-term (> 42 completed weeks)
12. Multiple pregnancy
13. Unfavorable cervix
14. Non-reassuring HR
15. Poor BPP
16. Maternal request
17. Other specify
8.Maternal and fetal Outcome and complications
8.1 Maternal outcome 1. Alive
2. Dead
8.2 Fetal outcome 1. Alive
2. Dead
8.3 Weight in grams ________
8.4 Apgar scores( 1st and 5th minutes) ______&_____
8.5 Maternal complications 1.Pre-eclampsia/eclampsia
2.APH
3.PPH
4.Others
29
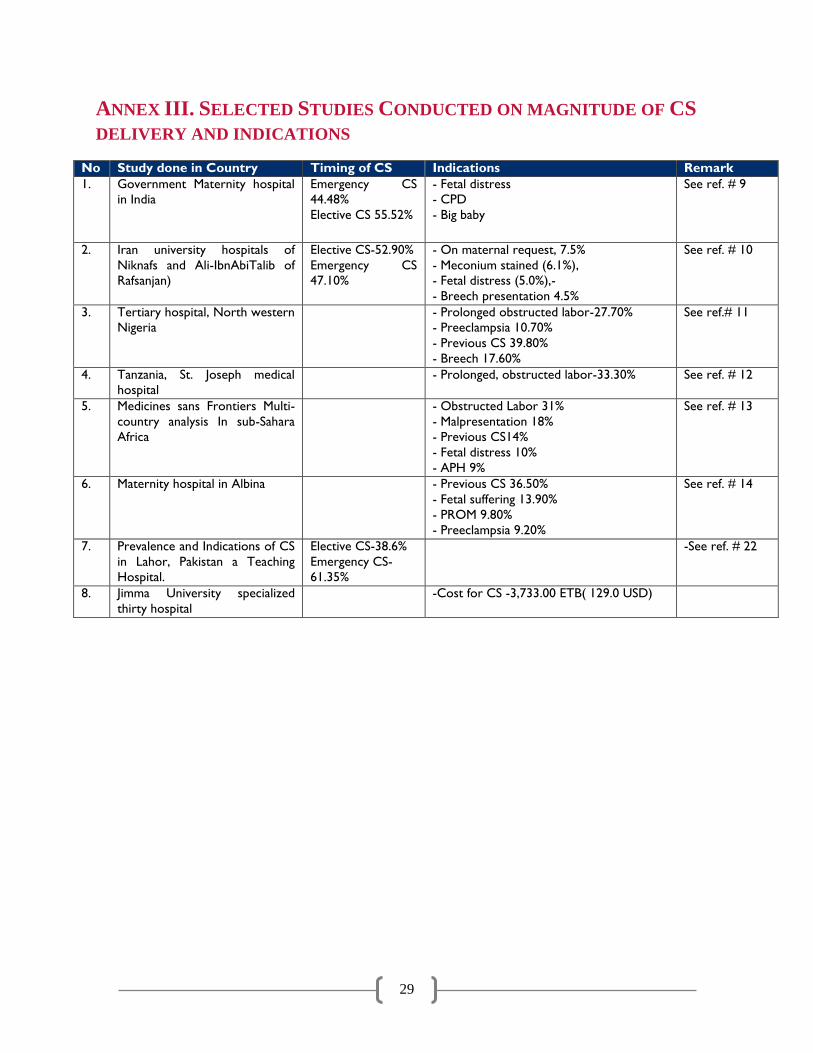
ANNEX III. SELECTED STUDIES CONDUCTED ON MAGNITUDE OF CS
DELIVERY AND INDICATIONS
No Study done in Country Timing of CS Indications Remark
1. Government Maternity hospital
in India
Emergency CS
44.48%
Elective CS 55.52%
- Fetal distress
- CPD
- Big baby
See ref. # 9
2. Iran university hospitals of
Niknafs and Ali-IbnAbiTalib of
Rafsanjan)
Elective CS-52.90%
Emergency CS
47.10%
- On maternal request, 7.5%
- Meconium stained (6.1%),
- Fetal distress (5.0%),-
- Breech presentation 4.5%
See ref. # 10
3. Tertiary hospital, North western
Nigeria
- Prolonged obstructed labor-27.70%
- Preeclampsia 10.70%
- Previous CS 39.80%
- Breech 17.60%
See ref.# 11
4. Tanzania, St. Joseph medical
hospital
- Prolonged, obstructed labor-33.30% See ref. # 12
5. Medicines sans Frontiers Multi-
country analysis In sub-Sahara
Africa
- Obstructed Labor 31%
- Malpresentation 18%
- Previous CS14%
- Fetal distress 10%
- APH 9%
See ref. # 13
6. Maternity hospital in Albina - Previous CS 36.50%
- Fetal suffering 13.90%
- PROM 9.80%
- Preeclampsia 9.20%
See ref. # 14
7. Prevalence and Indications of CS
in Lahor, Pakistan a Teaching
Hospital.
Elective CS-38.6%
Emergency CS-
61.35%
-See ref. # 22
8. Jimma University specialized
thirty hospital
-Cost for CS -3,733.00 ETB( 129.0 USD)

30
REFERENCES
1. Hussen A., Shiferaw N.,, Lukman Y. Cesarean delivery practices in teaching public and non-
government/private MCH hospitals, Addis Ababa. Ethiop. J. health dev. 2014; 28(1).
2. Yibeltal T. Bayou, Patterns of caesarean-section delivery in Addis Ababa, Ethiopia African Journal
of Primary Health Care and Family Medicine, 2016; 8(2): 953. Published online 2016 Jul 8. doi:
10.4102/phcfm.v8i2.953.
3. Federal Ministry of Health. Management protocol on selected obstetrics topics. Federal
Democratic Republic of Ethiopia; 2010.
4. JP Souza author, AM Gülmezoglu, P Lumbiganon, M Laopaiboon, G Carroli, B Fawole, P Ruyan.
Caesarean section without medical indications is associated with an increased risk of adverse
short-term maternal outcomes: the 2004-2008 WHO Global Survey on Maternal and Perinatal
Health. BMC Medicine20108:71. https://doi.org/10.1186/1741-7015-8-71© Souza et al; licensee
BioMed Central Ltd. 2010.
5. Abebe F, Ashebir N, Gizachew, A, factors leading to caesarean section at Felegehiwot referral
Hospital, North West Ethiopia, Reproductive health, 2015 vol.13. Access date 24/12 2018.
6. Moges A , Ade me B, Akessa G , Prevalence and Outcome of Cesarean Section i n Attat Hospital
lGurage Zone , S NNPR, Ethiopia. Arc h Me d. 2015; 7:4. Access date 24/12 2018.
7. Samson Gebremedhin. Trend and socio-demographic differentials of Caesarean section rate in
Addis Ababa, Ethiopia: analysis based on Ethiopia demographic and health surveys data.
Reproductive Health (2014) 11:14 access date 29/12/2018.
8. Central Statistical Agency [Ethiopia], ICF International. Ethiopia Demographic and Health Survey
2011. Addis Ababa: Central Statistical Agency and ICF International; 2012. Access date
24/12/2018.
9. Neuman M, Alcock G, Azad K,etal. Prevalence and determinants of caesarean section in private
and public health facilities in underserved South Asian communities: cross-sectional analysis of
data from Bangladesh, India and Nepal. BMJOpen 2014;4:e005982. Doi:
10.1136/bmjopen2014005982. Access date 29/12 2018.
10. RezaieSardari B, Torkashvand F, Karami M, Sheikh Fathollahi M, Manshori A. A survey on causes
of caesarean sections performed at the university hospitals of Niknafs and Ali-Ibn AbiTalib of
Rafsanjan, Iran, in the second trimester of JOHE, Spring 2014; 3(2). Access date 24/12 2018
11. Daniel CN, Singh S. Caesarean delivery: An experience from a tertiary institution in north western
Nigeria. Niger J ClinPract 2016; 19:18-24. Access date 24/12 2018.

31
12. Linn Becher and Siril Stokke (2009-2011) indications used for CS in St. Joseph Medical Hospital in
Moshi, Tanzania. Access date 24/12 2018.
13. Chu K, Cortier H, Maldonado F, Mashant T, Ford N, Trelles M. Caesarean section rates and
indications in sub-Saharan Africa: A multi-country study from Medecins sans Frontiers. PLoS One.
2012; 7(9):e44484. Access date19/12 2018.
14. Gjonej.R, Poloska.A, Keta.M, Zybeaj.F, Bezhani.V, Smakaj.E, The reasons of rising trends of
caesarean section rate year after year. IJNM 2015, 7(1), 2141-2456. Access date7/12 2018.
15. RMNCAH-N directorate of FMoH report of first 6 months of 2011 EC (Unpublished report).
16. Hiwot T. Prevalence of caesarean section and associated factors in Addis Ababa hospitals, Addis
Ababa, Ethiopia, 2017 (Unpublished study).
17. Fesseha Nebreed, Atnafu Getachew , Mihret Hiluf , Yirgu Gebrehiwot , Patricia Bailey. A national
review of cesarean delivery in Ethiopia. 2011. Int J Gynecol Obstets 115: 106-111.Access date May
22, 2019.
18. Tsega F, Mengistie B, Dessie Y, Mengesha MM (2015) Prevalence of cesarean section in urban
health facilities and associated factors in Eastern Ethiopia: Hospital based cross sectional study. J
Preg Child Health 2: 169.
19. Federal democratic republic of Ethiopia Central statistics agency, Population projection of
Ethiopia for all regions at woreda level from 2014-2017. August 2013.
20. Federal Ministry of health 2010 EC ARM report (Unpublished report).
21. Can ONER, Binali CATAK, Sevinç and Selçuk. Effect of Social Factors on Cesarean Birth in
Primiparous Women: A Cross Sectional Study (Social Factors and Cesarean Birth). Iran J Public
Health. 2016 Jun; 45(6): 768–773.
22. Maimoona Hafeez, Asthma Yasin, Nazia Badar, Muhammad Irfan Pasha, Nishat Akram, Bushra
Gulzar. Prevalence and Indications of Caesarean Section in a Teaching Hospital. JIMSA January-
March 2014 Vol. 27 No. 1.