mahanagar gas ltd. -...
TRANSCRIPT

Mahanagar Gas Ltd.
QRA Study for CNG stations Mumbai
Prepared By :
Det Norske Veritas As DNV Reg. No.: 1-2RCRXP
Rev 0., July 28, 2010

DET NORSKE VERITAS QRA Study for CNG stations
Mumbai
QRA Study for CNG stations Mumbai
For: Mahanagar Gas Limited
Account Ref.: Mr. T.L Sharnagat General Manager (Contract & Procurement) Tel: +91 66785000
DET NORSKE VERITAS AS DNV Cleaner Energy & Natural Gas
Hyderabad First Floor, Reliance Humsafar Building
No.8-2-618/2, Road No. 11, Banjara Hills, , Hyderabad 500 034
TEL:+ +91 40 447 45 501 FAX:+91 40 447 45 579
Org. No: PCGIN820
Date of First Issue
28.07.2010 Project Number
EP019788
Report No.: 1-2RCRXP Organizational Unit: DNV Cleaner Energy & Natural Gas, India
Revision Number:
0 Subject Group:
SHE Risk Management
Summary:
This QRA Study aims to identify Individual and Societal Risk associated with the MGL CNG Stations at Mumbai
Prepared by: Name and Position Vishalakshi Daine, Consultant
Signature
Verified by: Name and Position Rajkumar Dhapodkar, Consultant
Signature
Approved by: Name and Position Venkata Emani Head of the Department DNV Cleaner Energy & Natural Gas, India
Signature
Project No: EP019788
Document Revision Record
Rev No: Reason for issue:
Date of Issue Prepared by: Verified by: Approved by:
0 Draft Report for Review
28.07.2010 VD RD VE
1 Final Report VD VE
No distribution without permission from the client or responsible organisational unit
Indexing Terms
No distribution without permission from the client or responsible organisational unit (however, free distribution for internal use within DNV after 3 years)
Key Words QRA Study for CNG stations Mumbai
Strictly confidential Service Area SHE Risk Management
Unrestricted distribution Market Segment
Natural Gas and LNG
All copyrights reserved Det Norske Veritas (DNV Energy). This publication or parts thereof may not be reproduced or transmitted in any form or by any means, including photocopying or recording, without the prior written consent of Det Norske Veritas.

DET NORSKE VERITAS QRA Study for CNG stations
Mumbai
EXECUTIVE SUMMARY
E.1 Introduction
M/s Mahanagar Gas Limited (MGL) has about 136 CNG filling stations in and around Mumbai and one compressor station at Sion. Out of these 136 CNG filling stations, DNV has been requested to submit a proposal to carry out Quantitative Risk Assessment for 7 CNG filling stations of Mahanagar Gas Limited (MGL) in order assess the potential risk associated with these filling stations..
The 7 CNG filling stations are COCO auto station at Bandra, Maharashtra auto at Mumbai Central, MTA auto station at Kurla, Radiant auto station at Chembur, Satguru Auto at Wadala, Uganda Service Wadala and Lucky Auto at Sion.
E.2 Scope of Work
The scope of QRA study includes
- COCO auto station at Bandra
- Maharashtra auto at Central
- MTA auto station at Kurla
- Radiant auto station at Chembur
- Satguru Auto at Wadala
- Uganda Service Wadala
- Lucky Auto at Sion
However in this study petrol and diesel stations are not considered which is adjacent to CNG stations, only risk due to CNG activities are considered, so all risk represent the arising due to CNG only.
E.3 Objectives
The specific objectives of the study are to:
• Identification of the Hazards and selection of various risk scenarios
• Effects and consequence calculations for different scenarios
• Likelihood of occurrence of different scenarios & simultaneous scenarios (if any)
• Risk Estimation for different scenarios and presentation of estimated results
• Comparison with Risk Acceptance criteria
• Calculation of area around the station that would be under coverage of the quantified Risk

DET NORSKE VERITAS QRA Study for CNG stations
Mumbai
• Suitable recommendations, if necessary, providing the risk in the station is above the acceptance criteria
E.4 Methodology
Quantitative risk assessment (QRA) is a means of making a systematic analysis of the risks from hazardous activities, and forming a rational evaluation of their significance, in order to provide input to a decision-making process. The term ‘quantitative risk analysis’ is widely used, but strictly this refers to purely numerical analysis of risks without any evaluation of their significance.
The study has been conducted based on the premises of a traditional Quantitative Risk Assessment. The key components of a QRA are illustrated below in Figure E.1.
Figure E.1: QRA Methodology
TASK 1: System Definition
TASK 2: Hazard Identification
TASK 3: Assumptions and Rule Sets
TASK 5: Consequence Analysis
TASK 6: Risk
Analysis
TASK 7: Risk Assessment
TASK 8: Risk Reduction Measures
TASK 4: Frequency
Analysis

DET NORSKE VERITAS QRA Study for CNG stations
Mumbai
E.5 Conclusions
LSIR 1.
Lucky Auto CNG Station: Maximum LSIR level observed at any location in Lucky Auto CNG station is 10-5 per year which is in ALARP.
Maharashtra Auto CNG Station: Maximum LSIR level observed at compressor location in Maharashtra Auto CNG station is 10-4 per year which is in ALARP region as per given criteria.
Radiant Auto CNG Station: Maximum LSIR level observed at compressor location in Radiant Auto CNG Station is 10-4 per year which is in ALARP region as per given criteria.
COCO Auto CNG Station: Maximum LSIR level observed at Compressor location in COCO Auto station is 10-5 per year which is in ALARP.
MTA Auto CNG Station: Maximum LSIR level observed at any location in MTA Auto CNG station is 10-5 per year which is in ALARP.
Satguru Auto CNG Station: Maximum LSIR level observed at any location in Satguru Auto CNG station is 10-5 per year which is in ALARP.
Uganda Auto CNG Station: Maximum LSIR level observed at Compressor location in Uganda Auto CNG Station 10-4 per year which is in ALARP.
Expected Number of Fatalities (PLL) 2.
Lucky Auto CNG Station: The total Potential Loss of Life (PLL) calculated for population considered is 6.82x 10⁻⁴ per year, or approximately 1 fatality per 1466 years of operation.
Maharashtra Auto CNG Station: The total Potential Loss of Life (PLL) calculated for population considered is 4.87x 10⁻⁴ per year, or approximately 1 fatality per 2053 years of operation.
Radiant Auto CNG Station: The total Potential Loss of Life (PLL) calculated for population considered is 5.78x 10⁻⁴ per year, or approximately 1 fatality per 1730 years of operation. COCO Auto CNG Station: The total Potential Loss of Life (PLL) calculated for population considered is 7.42x 10⁻⁵ per year, or approximately 1 fatality per 1766 years of operation. MTA Auto CNG Station: The total Potential Loss of Life (PLL) calculated for population considered is 7.44x 10⁻⁴ per year, or approximately 1 fatality per 1344 years of operation. Satguru Auto CNG Station: The total Potential Loss of Life (PLL) calculated for population considered is 8.08x 10⁻⁴ per year, or approximately 1 fatality per 1237 years of operation. Uganda Auto CNG Station: The total Potential Loss of Life (PLL) calculated for population considered is 4.39x 10⁻⁴ per year, or approximately 1 fatality per 2277

DET NORSKE VERITAS QRA Study for CNG stations
Mumbai
years of operation.
Societal Risk (F-N Curve) 3.
Lucky Auto CNG Station: The F-N curves show that societal risk for Lucky Auto CNG station falls in the ALARP region.
Maharashtra Auto CNG Station: The F-N curves show that societal risk for Maharashtra Auto CNG Station starts in the ALARP region dropping to the acceptable region.
Radiant Auto CNG Station: The F-N curves show that societal risk for Radiant Auto CNG station falls in the ALARP region.
COCO Auto CNG Station: The F-N curves show that societal risk for COCO Auto CNG station falls in the ALARP region
MTA Auto CNG Station: The F-N curves show that societal risk for MTA Auto CNG station falls in the ALARP region
Satguru Auto CNG Station: The F-N curves show that societal risk for Satguru Auto CNG station falls in the ALARP region
Uganda Auto CNG Station: The F-N curves show that societal risk for Uganda Auto CNG station falls in the ALARP region
E.6 Recommendation
As a general rule, recommendations geared towards the prevention of a hazardous event or the reduction of its likelihood is preferable to mitigate that event’s consequences. Based on the QRA results, DNV has developed the following recommendations for preventing or reducing the likelihood of hazardous events:
E.6.1 Compressor Station (CGS & DBS) Design
• The compressor station shall be designed in accordance with the requirements of ASME B 31.8.
• Compressor shall be designed for use in CNG service and for the pressures and temperature to which it may be subjected under normal operating conditions conforming to API 618/ API 813 or equivalent standard and Flame proof electric motor and associated fittings should conform to IS:2148 suitable for class I division I group II area (OISD, STD-179)
CNG Cylinder
• Cylinder installed horizontally in a cascade shall be separated from another cylinder in the cascade by a distance of not less than 30 mm
• The cylinders and their fittings for CNG use shall be designed,
manufactured, tested including hydrostatic stretch test at a pressure in full conformity to IS:7285 and Gas Cylinder Rules, 1981, considering the maximum allowable operating pressure of 250 kg/ Sq.cm.g

DET NORSKE VERITAS QRA Study for CNG stations
Mumbai
• The cylinders shall be re-examined and retested every five years and in accordance with Gas Cylinder Rules, 1981 by a competent person with due markings. No cylinder shall be used which has not been duly re-tested as indicated
Valve
• Master shut off valve with locking arrangement in close position, shall be installed in steel outlet pipe outside but immediately adjacent to the gas storage unit to isolate all downstream equipment from the gas storage unit. This valve shall be outside the fencing (OISD, STD-179)
Pressure Gauges
• All pressure gauges in the installation shall be tested and calibrated atleast once a year and records maintained (OISD, STD-179)
Pressure Relief Device
• Safety Relief Devices may consist of either burst disc or safety relief valve and should conform to the requirements of OISD-STD- 132
• All safety relief devices shall be tested at least once a year for proper operations and records to be maintained
• No shut off valves shall be installed between the safety relief device and the gas storage unit or bulk tank
• Gas detectors interlocked with compressor cut out switch in the electrical system of the compressor are to be installed which would automatically switch off the unit in case of major gas leak (OISD, STD-179)
Electrical Equipment
• All electrical wiring and equipment, gas storage dispensing unit located in hazardous area Division I and II shall be in accordance with the Indian Electricity Rules, Gas Cylinder Rules, IS:5572 (Part 1), NFPA – 52 (OISD, STD-179)
Dispensing Unit
• Dispensers shall be installed on a suitable foundation observing the minimum safety distances. Dispensing unit to be protected against possible damage by vehicular movement
• The dispensing unit shall be of a type approved by the Chief Controller of Explosives / Statutory Authorities (OISD, STD-179)
CNG Refuelling into Vehicles
• The operator of the CNG dispensing unit shall check that there is no smoking, naked flame or any other source of ignition within six meter of the refuelling point (OISD, STD-179)
E.6.2 Fire Protection
• The Fire water system shall consist of: (a) Fire water Pumps (Main and Jockey) (b) Fire water storage

DET NORSKE VERITAS QRA Study for CNG stations
Mumbai
(c) Fire hydrant / Monitor distribution piping network (d) Water sprinkler / Deluge system
• Fire fighting facilities need to be carefully planned. However, at least the following Portable fire extinguishers shall be positioned:
Location Type of Extinguishers Dispensing Unit 1 x 10 kg. DCP Compressor (on-line) 1 x 10 kg. DCP CNG Storage 1 x 10 kg. DCP Cascade refuelling 1 x 10 kg. DCP area MCC/ Electrical {1 x 4.5 kg CO2 Installation {25 Sq.M floor area
• Any other flammable materials not specified in this standard in the CNG installation shall be stored in a non-flammable chamber with a minimum safety distance of 15 M from compressor station/ MCC/ electrical installation
• All approaches to machines, compressors, storage facilities and work places shall be free from obstacles, so that they are readily accessible in an emergency
• The electrical installations shall be inspected by a competent Electrical Inspector (IE)as per IE Rules and compliance shall be made as pointed out in the inspection. Records shall be maintained for all periodic inspections
• The flameproof characteristics of electrical equipment shall be checked through visual checks, condition of gasket, completeness and tightness of bolts, glands and as recommended by manufacturer's test certificates
• No unauthorised additions or modifications of the service station whether temporary or permanent shall be taken up
• Proper illumination to be ensured for all operating and non-operating areas • All electrical maintenance at the Automotive Station shall be undertaken by
licensed electrical technician under supervision of authorised person • Each installation shall have minimum two numbers hand held explosive meter in working conditions at all times
E.6.2 Training • The objective of training is to provide good understanding of all the facets of dispensing activities including operations, procedures, maintenance and hazards of CNG and the risks associated with handling of the product. Training shall ensure that the jobs are performed in accordance with the laid down procedures and practices

DET NORSKE VERITAS QRA Study for CNG stations
Mumbai
Table of Contents
1.0 Introduction .............................................................................................. 12 1.1 Scope of Work ........................................................................................... 12 1.1................................................................................................................................ 12 1.1................................................................................................................................ 12 1.2 Objectives .................................................................................................. 12
2.0 QRA Methodology.................................................................................... 13 2.1 Introduction to Risk Assessment................................................................ 13 2.2 What is QRA? ............................................................................................ 13 2.3 Key Components in QRA........................................................................... 14 2.4 Risk Modelling with Phast and Phast Risk ................................................. 16
3.0 Detailed QRA Approach .......................................................................... 18 3.1 System Definition, Hazard Identification & Failure Scenarios .................... 18 3.1.1 General Introduction ................................................................................................18 3.2 Consequence Modelling / Phast Software ................................................. 18 3.3 Frequency Analysis.................................................................................... 19 3.3.1 CNG Auto Station ....................................................................................................19 3.4 Risk Calculation / Phast Risk Software ...................................................... 20 3.4.1 Built-In Event Trees .................................................................................................20 3.4.2 Atmospheric Condition.............................................................................................23 3.4.3 Human Impact Criteria.............................................................................................23 3.4.4 Individual Risk Summation ......................................................................................23 3.4.5 Societal Risk Summation.........................................................................................25 3.4.6 Population Data .......................................................................................................25 3.5 Risk Assessment ....................................................................................... 26 3.5.1 Individual Risk Criteria .............................................................................................26 3.5.2 Societal Risk Criteria ...............................................................................................26 3.6 Risk Reduction Measures .......................................................................... 27
4.0 Risk Results from Major Accident Hazards ........................................... 28 4.1 Lucky Auto CNG Station ............................................................................ 28 4.1.1 Individual Risk Contours ..........................................................................................28 4.1.2 Societal Risk ............................................................................................................29 4.2 Maharashtra Auto CNG Station ................................................................. 29 4.2.1 Individual Risk Contours ..........................................................................................29 4.2.2 Societal Risk ............................................................................................................30 4.3 Radiant Auto CNG Station ......................................................................... 31 4.3.1 Individual Risk Contours ..........................................................................................31 4.3.2 Societal Risk ............................................................................................................32 4.4 COCO Auto CNG Station........................................................................... 33 4.4.1 Individual Risk Contours ..........................................................................................33 4.4.2 Societal Risk ............................................................................................................34 4.5 MTA Auto CNG Station .............................................................................. 35

DET NORSKE VERITAS QRA Study for CNG stations
Mumbai
4.5.1 Individual Risk Contours ..........................................................................................35 4.5.2 Societal Risk ............................................................................................................36 4.6 Satguru Auto CNG Station ......................................................................... 37 4.6.1 Individual Risk Contours ..........................................................................................37 4.6.2 Societal Risk ............................................................................................................38 4.7 Uganda Auto CNG Station ......................................................................... 39 4.7.1 Individual Risk Contours ..........................................................................................39 4.7.2 Societal Risk ............................................................................................................40
5.0 Conclusion and Recommendation ......................................................... 42
6.0 Recommendations................................................................................... 44 6.1 Compressor Station ................................................................................... 44 6.2 Fire Protection............................................................................................ 49 6.3 Training ...................................................................................................... 50
7.0 References................................................................................................ 52
8.0 Abbreviations ........................................................................................... 53
Appendix I .................................................................................................................. 54
Consequence Analysis.............................................................................................. 54
9.0 Consequence Results.............................................................................. 55 9.1 Jet Fire Events ........................................................................................... 55 9.2 Flash Fire Events ....................................................................................... 56 9.3 Vapour Cloud Explosion (VCE).................................................................. 56
Appendix II ................................................................................................................. 58
Past Accident Data .................................................................................................... 58
10.0 Past Accident data for Pipeline .............................................................. 59 10.1 Natural Gas pipeline rupture and fire near Carlsbad, New Mexico - August 19, 2000 ............................................................................................ 59 10.1.1 Accident Synopsis....................................................................................................59 10.1.2 Probable Cause .......................................................................................................60 10.1.3 Findings....................................................................................................................60 10.2 Natural Gas Explosion and Fire in South Riding, Virginia - July 7, 1998 61 10.2.1 Accident Synopsis....................................................................................................61 10.2.2 Probable Cause .......................................................................................................63 10.2.3 Findings....................................................................................................................63
11.0 Past accident for CNG Vehicle................................................................ 65 11.1 A Cylinder Ruptured in a suburb of Toronto in September 2003................ 65 11.1.1 Accident synopsis ....................................................................................................65 11.1.2 Possible Cause ........................................................................................................65 11.1.3 Findings....................................................................................................................65 11.2 Type 1 cylinder failed in 2000 .................................................................... 66 11.2.1 Accident synopsis ....................................................................................................66 11.2.2 Possible Cause ........................................................................................................66 11.2.3 Findings....................................................................................................................66

DET NORSKE VERITAS QRA Study for CNG stations
Mumbai

DET NORSKE VERITAS QRA Study for CNG stations
Mumbai
1.0 Introduction
M/s Mahanagar Gas Limited (MGL) has about 136 CNG filling stations in and around Mumbai and one compressor station at Sion. Out of these 136 CNG filling stations, DNV has been requested to submit a proposal to carry out Quantitative Risk Assessment for 7 CNG filling stations of Mahanagar Gas Limited (MGL) in order assess the potential risk associated with these filling stations..
The 7 CNG filling stations are COCO auto station at Bandra, Maharashtra auto at Mumbai Central, MTA auto station at Kurla, Radiant auto station at Chembur, Satguru Auto at Wadala, Uganda Service Wadala and Lucky Auto at Sion.
1.1 Scope of Work
The scope of QRA study for includes
- COCO auto station at Bandra
- Maharashtra auto at Central
- MTA auto station at Kurla
- Radiant auto station at Chembur
- Satguru Auto at Wadala
- Uganda Service Wadala
- Lucky Auto at Sion
However, the present petrol and diesel stations adjacent with the CNG filling stations are not included in the scope of work for this QRA study.
1.2 Objectives
The specific objectives of the study are to:
• Identification of the Hazards and selection of various risk scenarios
• Effects and consequence calculations for different scenarios
• Likelihood of occurrence of different scenarios & simultaneous scenarios (if any)
• Risk Estimation for different scenarios and presentation of estimated results
• Comparison with Risk Acceptance criteria
• Calculation of area around the station that would be under coverage of the quantified Risk
• Suitable recommendations, if necessary, providing the risk in the station is above the acceptance criteria

DET NORSKE VERITAS QRA Study for CNG stations
Mumbai
2.0 QRA Methodology
2.1 Introduction to Risk Assessment
This section is presented to assist the reader who is not familiar with the terms used in this document, and for those who are familiar, to confirm DNV understanding of the terms and their application in the context of this document.
An oil & gas facility has the potential to cause harm, such as:
• Sickness, injury or death of workers and people in the surrounding community.
• Damage to property and investments.
• Degradation of the physical and biological environment.
• Interruption to production and disruption of business.
A state or condition having the potential to cause a deviation from uniform or intended behaviour which, in turn, may result in damage to property, people or environment, is known as hazard. Thus a scraper trap is a hazard because it has the potential to cause a fire; processes such gas compression is a hazardous activity because it has the potential to cause fires and explosions. The word “hazard” does not express a view on the magnitude of the consequences or how likely it is that the harm will actually occur. A “major hazard” is associated with Loss of Containment and has the potential to cause significant damage or multiple fatalities. Again, the term does not imply that such events are likely.
Incidents are the actual realisation of a hazard, i.e. an event or chain of events, which has caused or could have caused personal injury, damage to property or environment. They are sudden unintended departures from normal conditions, in which some degree of harm is caused. They range from minor incidents such as a small gas leak, to major accidents such as Flixborough, Mexico City, Bhopal, Pasadena, Texas City, etc. Sometimes, the more neutral term “event” is used in place of the more colloquial term “incident”. For flammable incidents, ignition has to take place for a hazard to be realised. For toxic releases, the release itself may pose a hazard, if sufficient vapour at toxic concentrations is generated.
Risk is the combination of the likelihood and the consequences of such incidents. More scientifically, it is defined as the likelihood of a hazard occurrence resulting in an undesirable event. The likelihood may be expressed either as a frequency (i.e. the rate of events per unit time) or a probability (i.e. the chance of the event occurring in specified circumstances). The consequence is defined as an event or chain of events that result from the release of a hazard. The impact or effect is the degree of harm caused by the event.
Safety is the inverse of risk. The higher the risk for an occupation or installation, the lower is its safety. The popular understanding of safety sometimes appears to be “zero risk”, but this is impossible in an intrinsically hazardous activity such as oil and gas production.
2.2 What is QRA?
Quantitative risk assessment (QRA) is a means of making a systematic analysis of the risks from hazardous activities, and forming a rational evaluation of their significance, in order to provide input to a decision-making process.
QRA is sometimes called ‘probabilistic risk assessment’ or ‘probabilistic safety analysis’; terms originally used in the nuclear industry. The term ‘quantified risk assessment’ is synonymous with

DET NORSKE VERITAS QRA Study for CNG stations
Mumbai
QRA as used here. The term ‘quantitative risk analysis’ is widely used, but strictly this refers to the purely numerical analysis of risks without any evaluation of their significance.
QRA is probably the most sophisticated technique available to engineers to predict the risks of accidents and give guidance on appropriate means of minimising them. Nevertheless, while it uses scientific methods and verifiable data, QRA is a rather immature and highly judgemental technique, and its results have a large degree of uncertainty. Despite this, many branches of engineering have found that QRA can give useful guidance. However, QRA should not be the only input to decision-making about safety, as other techniques based on experience and judgement may be appropriate as well.
2.3 Key Components in QRA
The study is based on the premises of a traditional Quantitative Risk Assessment. The key components of a QRA are explained below, and illustrated in Figure 2-1.
Figure 2-1: QRA Methodology
QRA
TASK 1: System
Definition
TASK 2: Hazard
Identification
TASK 3:
Frequency
Analysis
TASK 4:
Consequence
Modelling
TASK 5: Risk
Calculations
TASK 6: Risk
Assessment
TASK 7: Risk
Reducing
Measures
The first stage in a QRA is defined as system definition, where the potential hazards associated with a facility or the activities are to be analysed. The scope of work for a QRA should be to define

DET NORSKE VERITAS QRA Study for CNG stations
Mumbai
the boundaries for the study, identifying which activities are to be included and which are excluded, and which phases of the facility’s life are to be assessed.
The hazard identification consists of a qualitative review of possible accidents that may occur, based on previous accident experience or judgement where necessary. There are several formal techniques for this, which are useful in their own right to give a qualitative appreciation of the range and magnitude of hazards and indicate appropriate mitigation measures. This qualitative evaluation is described in this guide as “hazard assessment”. In a QRA, hazard identification uses similar techniques, but has a more precise purpose – defining the boundaries of a study in terms of materials to be modelled, release conditions to be modelled, impact criteria to be used, and identifying and selecting a list of failure cases that will fully capture the hazard potential of the facilities to be studied. Failure cases are usually derived by breaking the process system down into a larger number of sub- systems, where failure of any component in the sub-system would cause similar consequences. In pipeline case, this can be performed by breaking the line into sections depending on availability of isolation valves along the line.
Once the potential hazards have been identified, the frequency analysis estimates how likely it is for the accidents to occur, based on the type and number of equipment components included in the defined failure cases. The component failure frequencies to be used are usually derived from an analysis of historical accident experience, or by some form of theoretical modelling.
In parallel with the frequency analysis, consequence modelling evaluates the resulting effects if the accidents occur, and their impact on people, equipment and structures, the environment or business, depending on the defined scope of the QRA study. Estimation of the consequences of each possible event often requires some form of computer modelling. Consequence analysis requires the modelling of a number of distinctive phases, i.e. discharge, dispersion, fires and explosions (for flammable materials).
Closely liaised with the consequence assessment is the impact assessment, i.e. how does the fire, explosion or toxic cloud affect human beings. When the frequencies and consequences / impact of each modelled event have been estimated, they can be combined to produce risk results. Various forms of risk presentation may be used, commonly grouped as follows:
• Individual risk - the risk experienced by an individual person.
• Group risk - the risk experienced by a group of people exposed to the hazard.
Up to this point, the process has been purely technical, and is known as risk analysis. The next stage is to introduce criteria, which are yardsticks to indicate whether the risks are acceptable, or to make some other judgement about their significance. Risk assessment is the process of comparing the level of risk against a set of criteria as well as the identification of major risk contributors. The purpose of risk assessment is to develop mitigation measures for unacceptable generators of risk, as well as to reduce the overall level of risk to As Low As Reasonably Practical (Figure 2-2).

DET NORSKE VERITAS QRA Study for CNG stations
Mumbai
Figure 2-2: ALARP Principle
In order to help assess the viability of Risk Reduction Measures (RRM), the economic costs of the measures can be compared with their risk benefits using Cost Benefit Analysis (CBA). However Cost Benefit Analysis is not included in the scope of work for this QRA study.
2.4 Risk Modelling with Phast and Phast Risk
Phast Risk1 has become an internationally recognized package for QRAs for onshore facilities. The study utilized the Phast Risk software package throughout the modelling process.
The software, which in 2007 celebrated its 25th anniversary, is used by governments and regulatory authorities and is in use on over 30 sites worldwide. Regular User Group meetings are organized to identify further needs for improvement. This allows for software upgrades incorporating industry experience and expertise, as well as for capturing advances in consequence modelling and risk analysis technology. The basis for this risk study is Phast Risk version 6.54.
Phast Risk automates the risk assessment of chemical and petrochemical facilities where toxic and flammable materials are manufactured, stored, and transported. As a major decision-support tool, Phast Risk can be used during strategic planning, facility sitting and layout, and for detailed risk and safety assessments. Phast Risk combines a complete library of rigorous mathematical models which, either singly or in combination, are used to calculate the risk associated with a hazardous facility or activity. The consequence models include detailed modelling of the impact of the following event outcomes: dispersing toxic gas cloud, explosion, fireball, BLEVE, flash fire, jet fire, and pool fire.
Phast Risk has different build-in event trees that are automatically selected based on type of material and release conditions These event trees determines which alternate consequences may be associated with each release, and their fractional probability. Event-trees assign the “split” between
1 Previously called: SAFETI

DET NORSKE VERITAS QRA Study for CNG stations
Mumbai
alternate consequence outcomes (e.g. fire balls, jet fires and explosions, no hazard), based on immediate ignition, delayed ignition and no ignition probabilities).
Risk contours, societal FN curves, and rankings of risk contributors are the main output parameters. With this information, the safety of an installation against any risk criteria can be assessed and guidance obtained concerning possible mitigation measures such as changes in design, operation, response, or land use planning. Risk results are available graphically and may be overlaid on digitized maps, satellite photos and plant layouts.
Phast is a consequence modelling package that can be used to assess situations which present potential hazards to life, property and the environment and to quantify their severity.
Phast was developed by DNV in 1987 and with over 600 licenses it is amongst the most widely used packages in the oil, gas and chemical industries. It is also the consequence engine for Phast Risk and its results underpin the API RBI 750 risk based inspection methodology used globally at most refineries. Similar to Phast Risk, regular User Group meetings are organized to identify further needs for improvement.
Phast examines the progress of a potential incident from the initial release to far-field dispersion including modelling of pool spreading and evaporation, and flammable and toxic effects. The results from the analysis can be displayed in tabular & graphical form, so the extent of the impact can be seen, and the effect of the release on the population and/or workforce and environment can be assessed.
Validation of software is important to obtain reliable results, and Phast is amongst the world’s most validated consequence modelling software packages, using comparisons with observations during both experiments and real life incidents.

DET NORSKE VERITAS QRA Study for CNG stations
Mumbai
3.0 Detailed QRA Approach
3.1 System Definition, Hazard Identification & Failure Scenarios
3.1.1 General Introduction
This stage of the study involves a review of the process facilities in order to define the failure cases in each unit. The failure cases in the facilities are defined in terms of LoC scenarios, i.e. accidental releases of flammable fluids into the atmosphere. This may include various sizes of process leaks, full bore rupture and catastrophic rupture of vessels.
For each failure case, the release rate and release duration is defined. This will determine the amount of material being released to the atmosphere, and hence the potential impact of the failure scenario.
The duration of a release is dependent on the time to detect the released fluids, time to isolate the leaking segment and the time to discharge remaining inventory in the segment. The total release duration is the sum of these three periods.
Further it can be argued that the time to detect depends on:
• Monitoring of process conditions, which may indicate any leak in process and/or pipeline sections.
• Availability of a fire and gas detection system and/or leak detection system in a pipeline.
• Surveillance of the process area, either by operator routine patrol or by a remote surveillance system.
While the time to isolate is determined by the availability of ESD system, which includes:
• ESD activation logic (i.e. manual or automatic),
• Remote or local activation (push button location) for manual intervention, and
• Location of the isolatable segment.
Release durations applied in this study are outlined in Appendix I.
3.2 Consequence Modelling / Phast Software
The consequence analysis is performed using DNV proprietary software Phast. Phast is a consequence and impact assessment module integrated within DNV risk calculation software Phast Risk.
Phast calculates wide range of possible consequences from the LoC events, including:
• Jet Fire, causing thermal radiation impact.
• Pool Fire, causing thermal radiation impact.
• Fireball, causing thermal radiation impact.
• Flash Fire, causing thermal radiation impact within the flammable cloud envelope.
• Explosion, causing overpressure impact.

DET NORSKE VERITAS QRA Study for CNG stations
Mumbai
• Dispersion of toxic gas, causing toxic effects.
Various factors affecting the extent of consequence are also considered within the Phast model (applied values of these factors are discussed in Appendix I which include:
• Atmospheric conditions, including solar radiation flux, ambient temperature, humidity and wind speed/direction as well as weather stability.
• Release location (height, coordinates).
• Release orientation.
Detailed findings of the consequence analysis for selected failure cases are presented in Appendix I.
The qualitative levels of explosion and heat radiation effects are described in Table 3-1 and Table 3-2 respectively are used to assess the likelihood of harm to people or the likelihood of further loss of containment and escalation.
Table 3-1: Explosion Overpressure Effects
Overpressure (bar)
Effects Within Zone
0.02 10% window glass broken 0.05 Window glass damage causing injury 0.1 Repairable damage to buildings and house facades 0.2 Structural damage to buildings 0.35 Heavy damage to buildings and process equipment
Table 3-2: Effects of Thermal Radiation
Radiation Intensity (kW/m2)
Observed Effect
37.5 Sufficient to cause damage to process equipment
25 Minimum energy required to ignite wood at indefinitely long exposures (non piloted)
12.5 Minimum energy required for piloted ignition of wood, melting plastic tubing
9.5 Pain threshold reached after 8 sec, second degree burns after 20 sec
4 Sufficient to cause pain to personnel if unable to reach cover within 20 s, however blistering of the skin (second degree burns) is likely; 0% lethality
1.6 Will cause no discomfort for long exposure
3.3 Frequency Analysis
3.3.1 CNG Auto Station
Failure frequencies for facilities of CNG auto stations have been considered from DNV Technical note 14 (Failure Frequencies for Pressure Vessels).
Failure frequency for disk rupture of the bullets is taken as 1.07 x10⁻⁷ per year and for 6mm leak of bullets is considered as 4.6 x 10⁻⁷ per year. However failure frequency for 1mm leak from

DET NORSKE VERITAS QRA Study for CNG stations
Mumbai
compressor is 5.4 x 10⁻³ and failure frequency for stuck of PSV is taken as 1.3 x10⁻³ per year and for 4” CS inlet pipeline to compressor is considered as 4.72 x 10⁻⁶ per year.
All the above frequencies are taken from DNV Technical Note 14.
3.4 Risk Calculation / Phast Risk Software
As mentioned earlier, DNV proprietary software Phast Risk is used for the main risk calculation in the study. Phast Risk combines consequence results from the Phast module with a range of risk-related information in order to produce risk results.
3.4.1 Built-In Event Trees
Phast Risk has 4 built-in consequence outcome event trees, i.e. continuous vapour release, continuous release with rain-out2, instantaneous vapour release, instantaneous release with rain-out. These event trees are presented in Figure 3-1 to Figure 3-4. It is noted that ‘No Ignition’ event leads to:
• ‘Toxic Effect’ for ‘toxic-only’ and ‘flammable & toxic’ material release.
• ‘No Effect’ for ‘flammable-only’ material release.
2Rain-out occurs if liquid drops suspended in a vapour cloud, following a pressurised release of liquid or gas, drop to the ground. Rain-out will occur when the droplets loose their initial (release) momentum and gravity prevails

DET NORSKE VERITAS QRA Study for CNG stations
Mumbai
Figure 3-31: Event Tree 1 – Continuous Vapour Release
Figure 3-2: Event Tree 2 – Continuous Release with Rainout

DET NORSKE VERITAS QRA Study for CNG stations
Mumbai
Figure 3-3: Event Tree 3 – Instantaneous Vapour Release
Figure 3-4: Event Tree 4 – Instantaneous Release with Rainout
Phast Risk also accounts for a short-duration continuous release, an event where a continuous release lasts for relatively short duration and hence gives effects similar to an instantaneous release. Release duration of 20 seconds is used as the cut-off time to consider continuous release giving instantaneous effects.
Further, in the event of an instantaneous vapour release, Phast Risk models the event as a pure fireball, in which the thermal radiation impact defines the level of human fatality, discounting the overpressure wave which may accompany the event.

DET NORSKE VERITAS QRA Study for CNG stations
Mumbai
Various probability factors which will determine the route of event within the event trees are also determined in the Phast Risk model. These include:
1. Immediate ignition; This is directly specified and will be different depending on the size of the release.
2. Delayed ignition; This is a calculated value within Phast Risk, unique to each release case and release direction. The calculation is based on the strength, location and presence factor of all ignition sources specified, and the extent and duration of dispersing flammable vapour clouds being exposed to those sources. Delayed ignition sources can be modelled as point sources (e.g. ground flares), line sources (roads, power lines) or area sources (e.g. to cater for “background” sources posed by a variety of human activity).
3. Fireball / flash fire / explosion probability in the event of immediate ignition of instantaneous release. This is directly specified in PhastRisk.
4. Flash fire / explosion probability in the event of delayed ignition. This is also directly specified in Phast Risk.
3.4.2 Atmospheric Condition
Variation in wind direction defines the apparent orientation of consequences. Phast Risk accounts for the different wind directions from the wind distribution probability input and combine the values into the risk calculation. Atmospheric conditions, which include temperature and humidity, are also addressed.
Following table outlines the atmospheric conditions applied in the study.
3.4.3 Human Impact Criteria
Impact criteria for each type of consequence to human are defined within Phast Risk in order to determine probability of people being killed from particular type of consequence.
3.4.4 Individual Risk Summation
Phast Risk then performs risk calculation by combining the consequence results of each possible final event from each failure case and the human impact criteria previously defined with event frequencies from the particular event. Phast Risk performs separate calculation for Individual Risk and Societal Risk.
The term “individual risk ” is used for the calculations of the risk of fatality for someone at a specific location, assuming that the person is always present at the location, i.e. is continuously exposed to the risk at that location. This is sometimes referred to as Location-Specific Individual Risk (LSIR), to distinguish from the “person-specific individual risk” that would depend on the movements of a given individual. It is a measure of the geographic distribution of risk, independent of the distribution of people at that location or in the surrounding area.
Phast Risk sets the size of the calculation area as the square area that will cover the maximum hazard effect distances for the set of Models that are being calculated. The program simplifies the calculations by superimposing a square grid on the area. This grid has maximum 1,000 squares along each side, giving maximum 1,000,000 squares in total. For the individual risk calculations,
DET NORSKE VERITAS QRA Study for CNG stations
Mumbai
the program calculates the risk at the centre of each grid square, which means that it calculates the risk at maximum 1,000,000 locations.
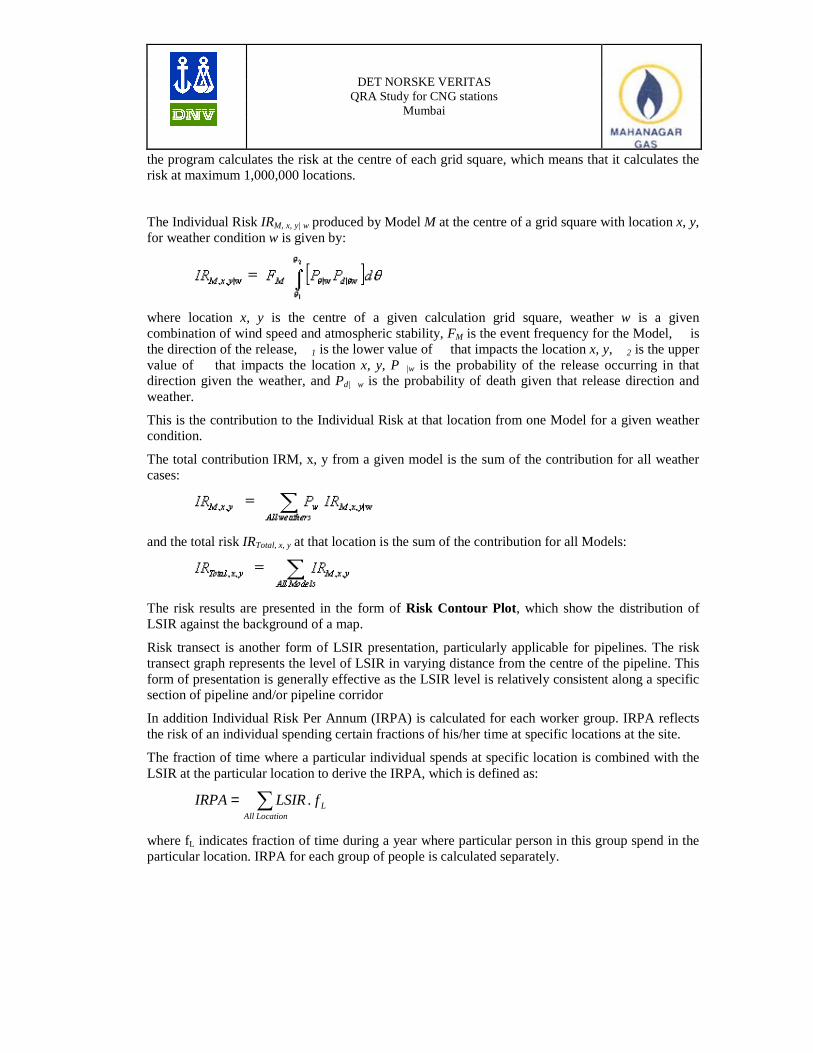
The Individual Risk IRM, x, y| w produced by Model M at the centre of a grid square with location x, y, for weather condition w is given by:
where location x, y is the centre of a given calculation grid square, weather w is a given combination of wind speed and atmospheric stability, FM is the event frequency for the Model, � is the direction of the release, �1 is the lower value of � that impacts the location x, y, �2 is the upper value of � that impacts the location x, y, P�|w is the probability of the release occurring in that direction given the weather, and Pd|�w is the probability of death given that release direction and weather.
This is the contribution to the Individual Risk at that location from one Model for a given weather condition.
The total contribution IRM, x, y from a given model is the sum of the contribution for all weather cases:
and the total risk IRTotal, x, y at that location is the sum of the contribution for all Models:
The risk results are presented in the form of Risk Contour Plot, which show the distribution of LSIR against the background of a map.
Risk transect is another form of LSIR presentation, particularly applicable for pipelines. The risk transect graph represents the level of LSIR in varying distance from the centre of the pipeline. This form of presentation is generally effective as the LSIR level is relatively consistent along a specific section of pipeline and/or pipeline corridor
In addition Individual Risk Per Annum (IRPA) is calculated for each worker group. IRPA reflects the risk of an individual spending certain fractions of his/her time at specific locations at the site.
The fraction of time where a particular individual spends at specific location is combined with the LSIR at the particular location to derive the IRPA, which is defined as:
∑=LocationAll
LfLSIRIRPA .
where fL indicates fraction of time during a year where particular person in this group spend in the particular location. IRPA for each group of people is calculated separately.

DET NORSKE VERITAS QRA Study for CNG stations
Mumbai
3.4.5 Societal Risk Summation
The societal risk is a measure of the risk that the events pose to the local population, taking into account the distribution of the population in the local area. The societal risk is expressed in terms of the likelihood of event outcomes that affect a given number of people in a single incident (e.g. the likelihood of event outcomes that affect up to 10 people, or the likelihood of event outcomes that affect up to 20 people).
The number of fatalities NM|o caused by Model M for a given combination o of weather condition, direction and event outcome, is given by:
where nx, y is the population density in the grid cell whose centre is at x, y, and Pd, x, y|o is the probability of death from the effect zone produced by the outcome.
The combination of the frequency FM|o for the Model and outcome, and the number of associated fatalities NM|o is known as an “F-N pair”, and the frequencies for given values of N can be summed for all outcomes and Models to give the total societal risk, presented in the form of a table or curve.
The program also calculates the rate of death, which is the weighted number of fatalities per year, given by:
and the “Okrent” Number given by:
The Okrent Number is a risk measure that reflects the greater impact on society of incidents that cause high numbers of fatalities. The factor 1.2 is known as the “aversion index”.
The rate of death is also commonly known as the Potential Loss of Life (PLL), which is the long-term average number of fatalities per year for a group of people. The PLL is a measure of the risk to a group of people as a whole and is particularly effective in measuring the effectiveness of various risks reducing measures
The risk results are presented in the form of FN Curve, which shows the frequency (F) of outcomes which cause N or more fatalities. In addition the PLL and contribution of each failure case to the societal risk are calculated.
3.4.6 Population Data
Whenever applicable, population data is defined separately for individual risk and societal risk calculation.
For individual risk calculation, people expected to be affected by the hazard are grouped based on their work (e.g. operators, maintenance personnel, administration personnel etc), which reflects a particular pattern of exposure to major accident hazards. The fraction of time spent inside and outside a building by an individual within each working group at each specific location is also determined in order to differentiate the indoor and outdoor effect of consequences.
DET NORSKE VERITAS QRA Study for CNG stations
Mumbai
For societal risk calculation, specific population areas are determined and the average numbers of inhabitants at each population area throughout the year are set. The average fraction of time spent inside and outside a building by the inhabitants in each population area is also determined to differentiate the indoor and outdoor effect of consequences.
3.5 Risk Assessment
In order to determine acceptability, the risk results are assessed against a set of risk criteria.
3.5.1 Individual Risk Criteria
For CNG Filling Stations
The HSE UK Individual Risk Criteria was considered to assess the risk for CNG filling station. Individual risk above 10-3 per annum for any person shall be considered intolerable and fundamental risk reduction improvements are required.
• Individual risk below 10-3 but above 10-5 per annum for any person shall be considered tolerable if it can be demonstrated that the risk are as low as reasonably practical (ALARP).
• Individual risk below 10-5 per annum for any person shall be considered as broadly acceptable and no further improvements are considered necessary provided documented control measures are in place and maintained.
3.5.2 Societal Risk Criteria
When considering the risk associated with a major hazard facility, the risk to an individual is not always an adequate measure of total risks; the number of the individuals at risk is also important. Catastrophic incidents with the potential multiple fatalities have a little influence on the level of risk but have a disproportionate effect on the response of society and impact of company reputation. The concept of societal risk is much more than that for individual risk. A number of factors are involved which make it difficult to determine single value criteria for application to a number of different situations. These factors include; • The hazard, the consequential risks and the consequential benefits
• The nature of assessment
• Factors of importance to the company, government, regulators and authorities, public attitudes and perception and aversion to major accident
Societal risk is the relationship between frequency of an event and the number of people affected. Societal risk from a major hazard facility can thus be expressed as the relationship between the number of potential fatalities N following a major accident and frequency F at which N fatalities are predicated to occur. The relationship between F and N, and the corresponding relationship involving F, the cumulative frequency of events causing N or more fatalities, are usually presented graphically on log-log axis.

DET NORSKE VERITAS QRA Study for CNG stations
Mumbai
For CNG Filling Stations
DNV has used following societal risk criteria of MGL for CNG filling stations.
The ALARP principle applies in the same way to Societal Risk as for Individual Risk. Societal risk should not be confused as being the risk to society or the risk as being perceived by society. The word “societal” is merely used to indicate a group of people and societal risk refers to the frequency of multiple fatality incidents, which includes workers and the public. Societal risk is usually represented by an FN (Frequency – Number of Fatality) curve.
As offsite population is taken into consideration for this study, the offsite societal risk is usually represented by an FN (Frequency – Number of Fatality) curve.
Table 3-1 : Societal Risk Criteria
Group FN curve slope Maximum Tolerable Intercept With N=1
Negligible Intercept With N=1
Public -1 10-3 10-5
3.6 Risk Reduction Measures
If the risk (individual or societal) is above the risk tolerability criterion, risk reduction measures must be implemented in order to reduce the risk to within the ALARP region.

DET NORSKE VERITAS QRA Study for CNG stations
Mumbai
4.0 Risk Results from Major Accident Hazards
4.1 Lucky Auto CNG Station
4.1.1 Individual Risk Contours
Figure 4-1 shows the LSIR contours for Lucky Auto CNG station, the following observations can be drawn:
• Maximum LSIR level observed at any location in Lucky Auto CNG station is 10-5 per year.
Figure 4-1: LSIR Contour for Lucky Auto CNG Station
Table 4-1 summarises the LSIR levels at observed points at different locations within Lucky Auto CNG Station.
Table 4-2: LSIR Summary at Different Locations in Lucky Auto CNG Station
Locations LSIR (per year) Evaluation
Compressor area 3.82E-5 Acceptable
Bullets Area 2.99E-5 Acceptable
Dispenser Area 2.41E-5 Acceptable

DET NORSKE VERITAS QRA Study for CNG stations
Mumbai
4.1.2 Societal Risk
The total Potential Loss of Life (PLL) calculated for population considered is 6.82x 10⁻⁴ per year, or approximately 1 fatality per 1466 years of operation. Figure 4-2 below further provides the associated F-N Curve. The curve shows that the societal risk when compared to the proposed risk criteria is in ALARP region.
Figure 4-2: F-N-Curve for Lucky Auto CNG Station
4.2 Maharashtra Auto CNG Station
4.2.1 Individual Risk Contours
Figure 4-3 shows the LSIR contours for Maharashtra Auto CNG station, the following observations can be drawn:
• Maximum LSIR level observed Compressor location in Maharashtra Auto CNG station is 10-4 per year.

DET NORSKE VERITAS QRA Study for CNG stations
Mumbai
Figure 4-3: LSIR Contours for Maharashtra Auto CNG Station
Table 4-2 summarises the LSIR levels at observed points at different locations within Maharashtra Auto CNG Station
Table 4-3: LSIR at Different Locations Maharashtra Auto CNG Station
Locations LSIR (per year) Evaluation
Compressor area 4.37E-4 Acceptable
Bullets Area 1.25E-5 Acceptable
Dispenser Area 7.28E-6 Acceptable
4.2.2 Societal Risk
The total Potential Loss of Life (PLL) calculated for population considered is 4.87x 10⁻⁴ per year, or approximately 1 fatality per 2053 years of operation. Figure 4-4 below further provides the associated F-N Curve. The curve shows that the societal risk when compared to the proposed risk criteria is in ALARP region.

DET NORSKE VERITAS QRA Study for CNG stations
Mumbai
Figure 4-4: F-N-Curve for Maharashtra Auto CNG Station
4.3 Radiant Auto CNG Station
4.3.1 Individual Risk Contours
Figure 4-5 shows the LSIR contours for Radiant Auto CNG Station, the following observations can be drawn:
• Maximum LSIR level observed at compressor location in station is 10-4 per year.

DET NORSKE VERITAS QRA Study for CNG stations
Mumbai
Figure 4-5: LSIR Contours for Contour for Radiant Auto CNG Station
Table 4-3 summarises the LSIR levels at observed points at different locations within Radiant Auto CNG Station
Table 4-4: LSIR Summary at Different Locations in Radiant Auto CNG Station
Locations LSIR (per year) Evaluation
Compressor area 4.16E-4 Acceptable
Bullets Area 8.25E-6 Acceptable
Dispenser Area 1.59E-5 Acceptable
4.3.2 Societal Risk
The total Potential Loss of Life (PLL) calculated for population considered is 5.78x 10⁻⁴ per year, or approximately 1 fatality per 1730 years of operation. Figure 4-6 below further provides the associated F-N Curve. The curve shows that the societal risk when compared to the proposed risk criteria is ALARP.
Figure 4-6: F-N-Curve for Radiant Auto CNG Station

DET NORSKE VERITAS QRA Study for CNG stations
Mumbai
4.4 COCO Auto CNG Station
4.4.1 Individual Risk Contours
Figure 4-7 shows the LSIR contours for COCO Auto CNG Station, the following observations can be drawn:
• Maximum LSIR level observed at Compressor location in COCO Auto CNG station is 10-5 per year.

DET NORSKE VERITAS QRA Study for CNG stations
Mumbai
Figure 4-7: LSIR Contours for Contour for COCO Auto CNG Station
Table 4-4 summarises the LSIR levels at observed points at different locations within COCO Auto CNG Station.
Table 4-5: LSIR Summary at Different Locations in COCO Auto CNG Station
Locations LSIR (per year) Evaluation
Compressor area 2.73E-5 Acceptable
Bullets Area 1.26E-5 Acceptable
Dispenser Area 4.41E-6 Acceptable
4.4.2 Societal Risk
The total Potential Loss of Life (PLL) calculated for population considered is 7.42x 10⁻⁵ per year, or approximately 1 fatality per 13477 years of operation. Figure 4-8 below further provides the associated F-N Curve. The curve shows that the societal risk when compared to the proposed risk criteria is ALARP.

DET NORSKE VERITAS QRA Study for CNG stations
Mumbai
Figure 4-8: F-N-Curve for COCO Auto CNG Station
4.5 MTA Auto CNG Station
4.5.1 Individual Risk Contours
Figure 4-9 shows the LSIR contours for MTA Auto station, the following observations can be drawn:
• Maximum LSIR level observed at any location in MTA Auto CNG station is 10-5 per year.

DET NORSKE VERITAS QRA Study for CNG stations
Mumbai
Figure 4-9: LSIR Contours for Contour for MTA Auto CNG Station
Table 4-5 summarises the LSIR levels at observed points at different locations within MTA Auto CNG Station.
Table 4-6: LSIR Summary at Different Locations in MTA Auto C NG Station
Locations LSIR (per year) Evaluation
Compressor area 2.26E-5 Acceptable
Bullets Area 1.34E-5 Acceptable
Dispenser Area 1.12E-5 Acceptable
4.5.2 Societal Risk
The total Potential Loss of Life (PLL) calculated for population considered is 7.44x 10⁻⁴ per year, or approximately 1 fatality per 1344 years of operation. Figure 4-10 below further provides the associated F-N Curve. The curve shows that the societal risk when compared to the proposed risk criteria is ALARP.

DET NORSKE VERITAS QRA Study for CNG stations
Mumbai
Figure 4-10: F-N-Curve for MTA Auto CNG Station
4.6 Satguru Auto CNG Station
4.6.1 Individual Risk Contours
Figure 4-11 shows the LSIR contours for Satguru Auto station, the following observations can be drawn:
• Maximum LSIR level observed at any location in Satguru Auto CNG station is 10-5 per year.

DET NORSKE VERITAS QRA Study for CNG stations
Mumbai
Figure 4-11: LSIR Contours for Contour for Satguru Auto CNG Station
Table 4-6 summarises the LSIR levels at observed points at different locations within Satguru Auto CNG Station.
Table 4-7: LSIR Summary at Different Locations in Satguru Auto CNG Station
Locations LSIR (per year) Evaluation
Compressor area 9.29E-5 Acceptable
Bullets Area 1.80E-5 Acceptable
Dispenser Area 2.90E-5 Acceptable
4.6.2 Societal Risk
The total Potential Loss of Life (PLL) calculated for population considered is 8.08x 10⁻⁴ per year, or approximately 1 fatality per 1237 years of operation. Figure 4-12 below further provides the associated F-N Curve. The curve shows that the societal risk when compared to the proposed risk criteria is ALARP.

DET NORSKE VERITAS QRA Study for CNG stations
Mumbai
Figure 4-12: F-N-Curve for Satguru Auto CNG Station
4.7 Uganda Auto CNG Station
4.7.1 Individual Risk Contours
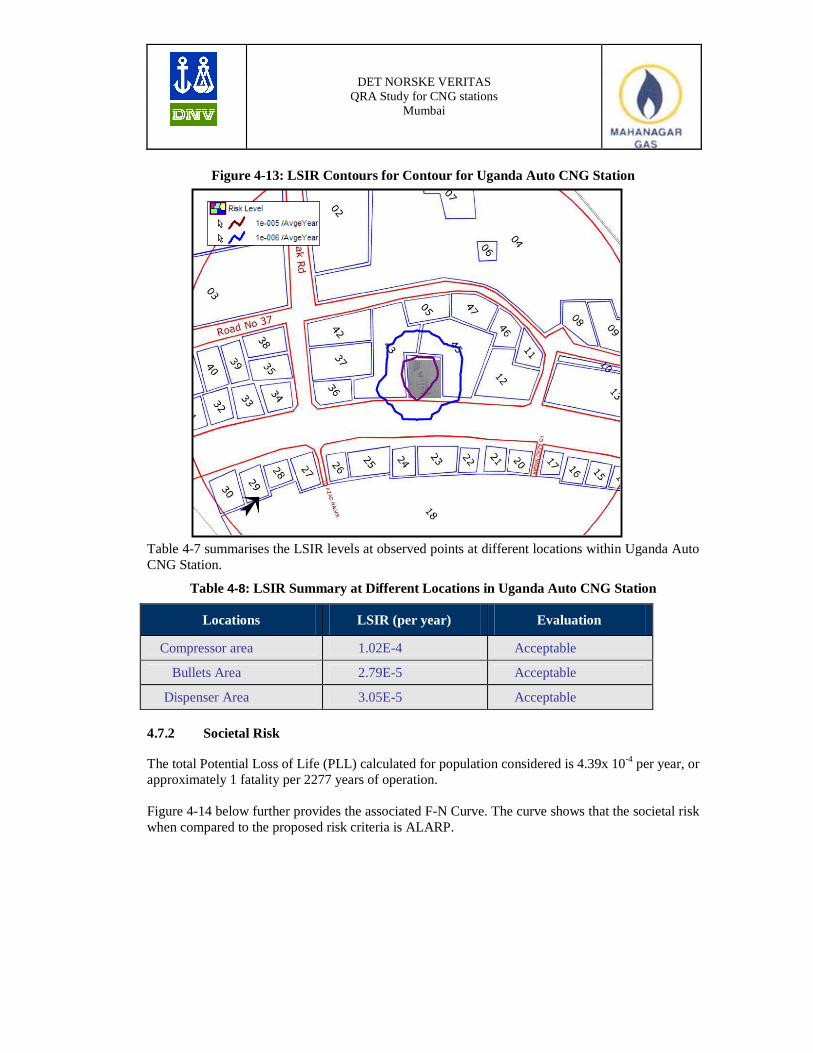
Figure 4-13 shows the LSIR contours for Uganda Auto CNG station, the following observations can be drawn:
• Maximum LSIR level observed at compressor location in Uganda Auto CNG station is 10-4 per year.
DET NORSKE VERITAS QRA Study for CNG stations
Mumbai
Figure 4-13: LSIR Contours for Contour for Uganda Auto CNG Station
Table 4-7 summarises the LSIR levels at observed points at different locations within Uganda Auto CNG Station.
Table 4-8: LSIR Summary at Different Locations in Uganda Auto CNG Station
Locations LSIR (per year) Evaluation
Compressor area 1.02E-4 Acceptable
Bullets Area 2.79E-5 Acceptable
Dispenser Area 3.05E-5 Acceptable
4.7.2 Societal Risk
The total Potential Loss of Life (PLL) calculated for population considered is 4.39x 10⁻⁴ per year, or approximately 1 fatality per 2277 years of operation. Figure 4-14 below further provides the associated F-N Curve. The curve shows that the societal risk when compared to the proposed risk criteria is ALARP.

DET NORSKE VERITAS QRA Study for CNG stations
Mumbai
Figure 4-14: F-N-Curve for Uganda Auto CNG Station

DET NORSKE VERITAS QRA Study for CNG stations
Mumbai
5.0 Conclusion and Recommendation
LSIR 5.
Lucky Auto CNG Station: Maximum LSIR level observed at any location in Lucky Auto CNG station is 10-5 per year which is in ALARP.
Maharashtra Auto CNG Station: Maximum LSIR level observed at compressor location in Maharashtra Auto CNG station is 10-4 per year which is in ALARP region as per given criteria.
Radiant Auto CNG Station: Maximum LSIR level observed at compressor location in Radiant Auto CNG Station is 10-4 per year which is in ALARP region as per given criteria.
COCO Auto CNG Station: Maximum LSIR level observed at Compressor location in COCO Auto station is 10-5 per year which is in ALARP.
MTA Auto CNG Station: Maximum LSIR level observed at any location in MTA Auto CNG station is 10-5 per year which is in ALARP.
Satguru Auto CNG Station: Maximum LSIR level observed at any location in Satguru Auto CNG station is 10-5 per year which is in ALARP.
Uganda Auto CNG Station: Maximum LSIR level observed at Compressor location in Uganda Auto CNG Station 10-4 per year which is in ALARP.
Expected Number of Fatalities (PLL) 6.
Lucky Auto CNG Station: The total Potential Loss of Life (PLL) calculated for population considered is 6.82x 10⁻⁴ per year, or approximately 1 fatality per 1466 years of operation.
Maharashtra Auto CNG Station: The total Potential Loss of Life (PLL) calculated for population considered is 4.87x 10⁻⁴ per year, or approximately 1 fatality per 2053 years of operation.
Radiant Auto CNG Station: The total Potential Loss of Life (PLL) calculated for population considered is 5.78x 10⁻⁴ per year, or approximately 1 fatality per 1730 years of operation. COCO Auto CNG Station: The total Potential Loss of Life (PLL) calculated for population considered is 7.42x 10⁻⁵ per year, or approximately 1 fatality per 1766 years of operation. MTA Auto CNG Station: The total Potential Loss of Life (PLL) calculated for population considered is 7.44x 10⁻⁴ per year, or approximately 1 fatality per 1344 years of operation. Satguru Auto CNG Station: The total Potential Loss of Life (PLL) calculated for population considered is 8.08x 10⁻⁴ per year, or approximately 1 fatality per 1237 years of operation. Uganda Auto CNG Station: The total Potential Loss of Life (PLL) calculated for population considered is 4.39x 10⁻⁴ per year, or approximately 1 fatality per 2277 years of operation.

DET NORSKE VERITAS QRA Study for CNG stations
Mumbai
Societal Risk (F-N Curve) 7.
Lucky Auto CNG Station: The F-N curves show that societal risk for Lucky Auto CNG station falls in the ALARP region.
Maharashtra Auto CNG Station: The F-N curves show that societal risk for Maharashtra Auto CNG Station starts in the ALARP region dropping to the acceptable region.
Radiant Auto CNG Station: The F-N curves show that societal risk for Radiant Auto CNG station falls in the ALARP region.
COCO Auto CNG Station: The F-N curves show that societal risk for COCO Auto CNG station falls in the ALARP region
MTA Auto CNG Station: The F-N curves show that societal risk for MTA Auto CNG station falls in the ALARP region
Satguru Auto CNG Station: The F-N curves show that societal risk for Satguru Auto CNG station falls in the ALARP region
Uganda Auto CNG Station: The F-N curves show that societal risk for Uganda Auto CNG station falls in the ALARP region
DET NORSKE VERITAS QRA Study for CNG stations
Mumbai
6.0 Recommendations
As a general rule, recommendations geared towards the prevention of a hazardous event or the reduction of its likelihood is preferable to mitigate that event’s consequences. Based on the QRA results, DNV has developed the following recommendations for preventing or reducing the likelihood of hazardous events:
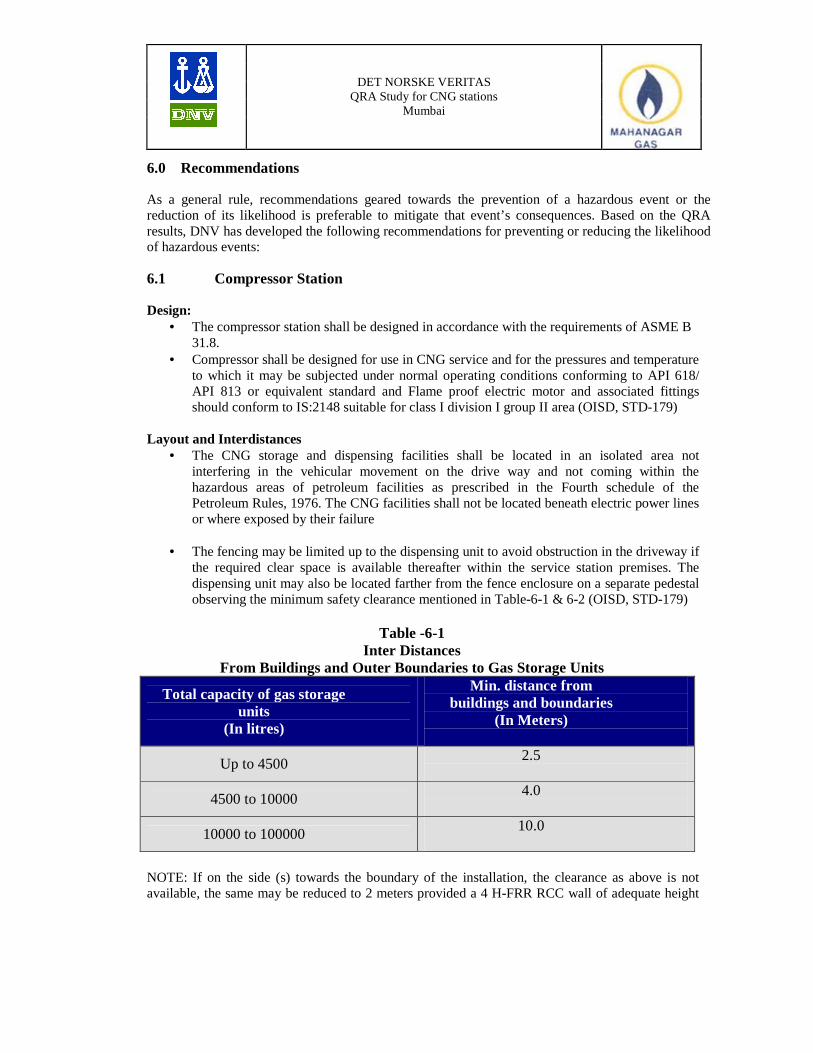
6.1 Compressor Station
Design: • The compressor station shall be designed in accordance with the requirements of ASME B
31.8. • Compressor shall be designed for use in CNG service and for the pressures and temperature
to which it may be subjected under normal operating conditions conforming to API 618/ API 813 or equivalent standard and Flame proof electric motor and associated fittings should conform to IS:2148 suitable for class I division I group II area (OISD, STD-179)
Layout and Interdistances
• The CNG storage and dispensing facilities shall be located in an isolated area not interfering in the vehicular movement on the drive way and not coming within the hazardous areas of petroleum facilities as prescribed in the Fourth schedule of the Petroleum Rules, 1976. The CNG facilities shall not be located beneath electric power lines or where exposed by their failure
• The fencing may be limited up to the dispensing unit to avoid obstruction in the driveway if
the required clear space is available thereafter within the service station premises. The dispensing unit may also be located farther from the fence enclosure on a separate pedestal observing the minimum safety clearance mentioned in Table-6-1 & 6-2 (OISD, STD-179)
Table -6-1
Inter Distances From Buildings and Outer Boundaries to Gas Storage Units
Total capacity of gas storage units
(In litres)
Min. distance from buildings and boundaries
(In Meters)
Up to 4500 2.5
4500 to 10000 4.0
10000 to 100000 10.0
NOTE: If on the side (s) towards the boundary of the installation, the clearance as above is not available, the same may be reduced to 2 meters provided a 4 H-FRR RCC wall of adequate height

DET NORSKE VERITAS QRA Study for CNG stations
Mumbai
and length covering the cylinder cascades is constructed at the boundary and adequate clear space is available on the other side of the wall.
Table - 6-2 Inter Distances
Between Various Facilities of Natural Gas Handling at Installation
Distance From
(in meters)
1 2 3 4 5 6 7
CNG Compressor
- 3 2 3 6 6
T-1 (Min-3)
CNG Dispensing
Unit
3 - 2 4 6 4 Do
Storage cascade
2 2 - T-1 T-1
T-1 (Min-6)
Do (Min-4)
Outer boundary wall/ CLF
3 4 T-1 - 6 4 Do
MS/HSD dispenser
6 6 T-1
(Min-6) 6 - 6 Do
Vent of MS/HSD,
u.g. storage tanks
6 4 T-1
(Min-4) 4 6 - 6
Filling point of MS/HSD
_____________T-1 (Min-3)_______________ 6 -
NOTES :
i) T-1 denotes Table-2 ii) ii) Distances shown as “ – ” shall be any distance necessary for operational
convenience. iii) A suitable curbing platform shall be provided at the base of the dispensing unit to prevent vehicles from coming too near the unit.

DET NORSKE VERITAS QRA Study for CNG stations
Mumbai
iv) A CNG cascade having cylinders of total water capacity not exceeding 4500 liters can be mounted on top of the compressor super structure. The assembly shall observe 3- meter clearance around and also from the dispensing unit. This can be reduced to 2 meter as per Note- I of Table – I. CNG Cylinder
• Cylinder installed horizontally in a cascade shall be separated from another cylinder in the cascade by a distance of not less than 30 mm
• Gas storage facility shall be protected from the effects of the weather by a roof or canopy designed to facilitate the dispersion of free or escaped gas and shall not permit gas to be trapped
• The cylinders and their fittings for CNG use shall be designed, manufactured, tested including hydrostatic stretch test at a pressure in full conformity to IS:7285 and Gas Cylinder Rules, 1981, considering the maximum allowable operating pressure of 250 kg/ Sq.cm.g
• The cylinders shall be re-examined and retested every five years and in accordance with Gas Cylinder Rules, 1981 by a competent person with due markings. No cylinder shall be used which has not been duly re-tested as indicated
CNG Piping
• All the piping and tubing shall have minimum turns with adequate provision for expansion, contraction, jarring, vibration and settling. Exterior piping may be either buried with suitable corrosion protection or installed 30 cm. above the ground level with supports and protection against mechanical and corrosive damage (OISD, STD-179)
Valve
• Master shut off valve with locking arrangement in close position, shall be installed in steel outlet pipe outside but immediately adjacent to the gas storage unit to isolate all downstream equipment from the gas storage unit. This valve shall be outside the fencing (OISD, STD-179)
Pressure Gauges
• All pressure gauges in the installation shall be tested and calibrated atleast once a year and records maintained (OISD, STD-179)
CNG Hoses
• The flexible hoses with their connections shall be tested after assembly and prior to use to at least two times the working pressure and also tested to a pneumatic pressure of at least 400 bar under water. Thereafter, all the hoses shall be examined visually and tested for leaks with soapsuds or equivalent at an interval not exceeding one year. Hoses shall be rejected and destroyed in the event of any leakage. These tests are to be recorded and such records shall be available at installations at all times (OISD, STD-179)

DET NORSKE VERITAS QRA Study for CNG stations
Mumbai
Pressure Relief Device • Safety Relief Devices may consist of either burst disc or safety relief valve and should
conform to the requirements of OISD-STD- 132 • Piping shall be protected by safety relief devices in conformity to OISD-STD-132 • All safety relief devices shall be tested at least once a year for proper operations and
records to be maintained • Gas detectors interlocked with compressor cut out switch in the electrical system of the
compressor are to be installed which would automatically switch off the unit in case of major gas leak (OISD, STD-179)
Electrical Equipment
• All electrical wiring and equipment, gas storage dispensing unit located in hazardous area Division I and II shall be in accordance with the Indian Electricity Rules, Gas Cylinder Rules, IS:5572 (Part 1), NFPA – 52 (OISD, STD-179)
Dispensing Unit
• Dispensers shall be installed on a suitable foundation observing the minimum safety distances. Dispensing unit to be protected against possible damage by vehicular movement
• The dispensing unit shall be of a type approved by the Chief Controller of Explosives / Statutory Authorities (OISD, STD-179)
• The dispenser has to be located outdoor, at point of use. If the dispenser is covered by some kind of roof, the roof shall be designed to prevent gas accumulation under the roof. Natural ventilation will limit the risk of build up of large ignitable gas clouds
CNG Refuelling into Vehicles • The operator of the CNG dispensing unit shall check that there is no smoking, naked flame
or any other source of ignition within six meter of the refuelling point (OISD, STD-179) Safety Distance
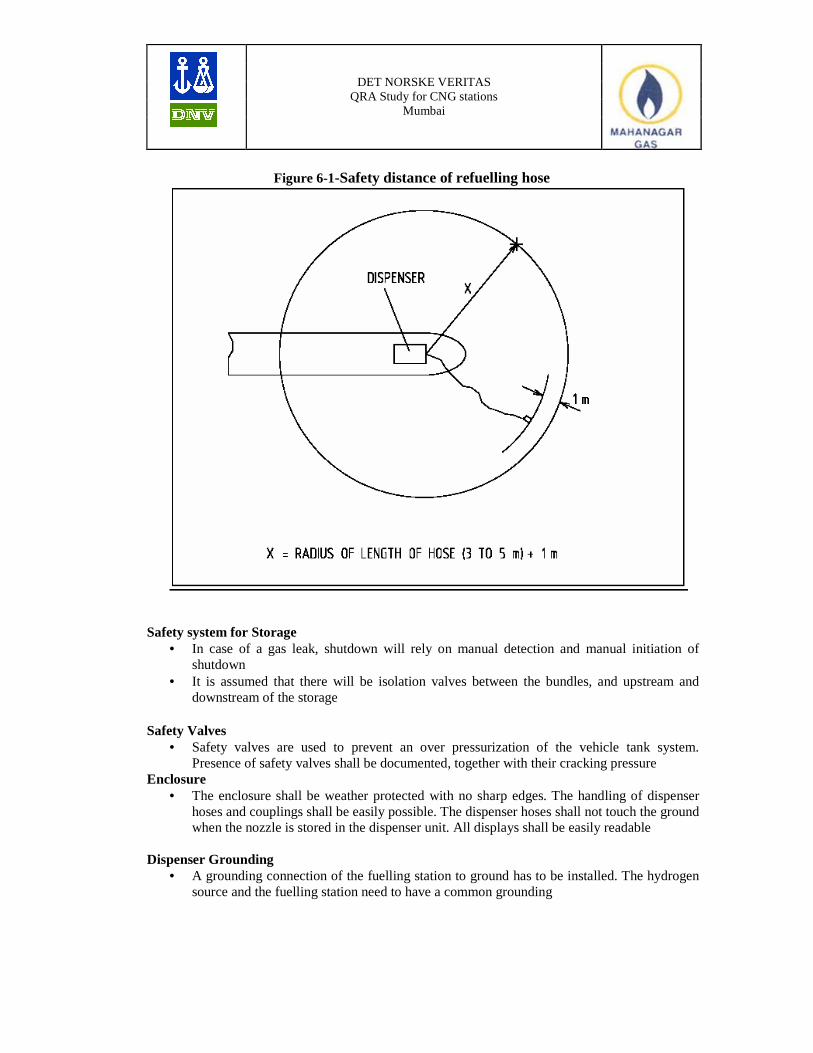
• One of the possible measures to be taken to reduce the risk or potential consequences of an incident is ensuring sufficient distance between the ‘source’ of hazard and the ‘target’ of this hazard. The distance referred to here is generally called the ‘safety distance’
• In the following figure 6-1 the concept of safety distances is schematically illustrated. The
distance indicated in these figure-6-1 is just an example, as safety distances will be determined by local circumstances
DET NORSKE VERITAS QRA Study for CNG stations
Mumbai
Figure 6-1-Safety distance of refuelling hose
Safety system for Storage
• In case of a gas leak, shutdown will rely on manual detection and manual initiation of shutdown
• It is assumed that there will be isolation valves between the bundles, and upstream and downstream of the storage
Safety Valves
• Safety valves are used to prevent an over pressurization of the vehicle tank system. Presence of safety valves shall be documented, together with their cracking pressure
Enclosure • The enclosure shall be weather protected with no sharp edges. The handling of dispenser
hoses and couplings shall be easily possible. The dispenser hoses shall not touch the ground when the nozzle is stored in the dispenser unit. All displays shall be easily readable
Dispenser Grounding
• A grounding connection of the fuelling station to ground has to be installed. The hydrogen source and the fuelling station need to have a common grounding

DET NORSKE VERITAS QRA Study for CNG stations
Mumbai
Vehicle Grounding • Vehicle grounding can be performed by one of the following solutions:
1) Grounding through vehicle tires (Preferred method if refuelling area ground surface conductivity is adequate). Resistance between pad and ground shall be less than 1 MOhm. 2) Connection of a dedicated grounding strap prior to nozzle connection
Operating Instructions • The dispenser operating instructions shall be posted at the dispensing device
Pre-Fill Leak Tightness Test • The connection between nozzle and vehicle should be tightness tested before each fuelling
Gas Detection • A system for automatic detection of gas inside the dispenser housing, which contain most
of the valves and measuring devices for the dispenser, is recommended. Shut down should be initiated automatically upon gas detection
Dispensing Process Interruption
• In case of interruption of the dispensing process, due to a power or system failure, the user shall not be exposed to any hazard. Moreover the user shall be informed of the interruption and shall receive proper instructions
Emergency Dispenser Shut Down
• At minimum one manual ESD button near the dispenser shall be available. A second manual ESD button in a larger distance from the dispenser (safe area) is recommended
• On all filling station at least there are 3 ESD’s available. One at the office, second at the petrol & diesel area and third is in the CNG area.
Detection of severe leakages
• The following points need to be documented: - Additional measures to detect severe leakages (at least one necessary) - Gas sensor on fuelling area to detect vehicle leakages - Plausibility check pressure to detect pressure drop during fuelling
Lighting • CNG fuelling facilities transferring product during the night shall have permanent lighting
at points of transfer and operation. The lighting shall be designed to provide illumination of the dispensing apparatus and dispensing area, such that all controls including emergency shutdown devices are visible to the operator
6.2 Fire Protection
• The Fire water system shall consist of: (a) Fire water Pumps (Main and Jockey) (b) Fire water storage (c) Fire hydrant / Monitor distribution piping network

DET NORSKE VERITAS QRA Study for CNG stations
Mumbai
(d) Water sprinkler / Deluge system • Fire fighting facilities need to be carefully planned. However, at least the following
Portable fire extinguishers shall be positioned:
Location Type of Extinguishers Dispensing Unit 1 x 10 kg. DCP Compressor (on-line) 1 x 10 kg. DCP CNG Storage 1 x 10 kg. DCP Cascade refuelling 1 x 10 kg. DCP area MCC/ Electrical {1 x 4.5 kg CO2 Installation {25 Sq.M floor area
• Any other flammable materials not specified in this standard in the CNG installation shall be stored in a non-flammable chamber with a minimum safety distance of 15 M from compressor station/ MCC/ electrical installation
• All approaches to machines, compressors, storage facilities and work places shall be free from obstacles, so that they are readily accessible in an emergency
• The electrical installations shall be inspected by a competent Electrical Inspector (IE)as per IE Rules and compliance shall be made as pointed out in the inspection. Records shall be maintained for all periodic inspections
• The flameproof characteristics of electrical equipment shall be checked through visual checks, condition of gasket, completeness and tightness of bolts, glands and as recommended by manufacturer's test certificates
• No unauthorised additions or modifications of the service station whether temporary or permanent shall be taken up
• Proper illumination to be ensured for all operating and non-operating areas • All electrical maintenance at the Automotive Station shall be undertaken by licensed
electrical technician under supervision of authorised person • Each installation shall have minimum two numbers hand held explosive meter in working conditions at all times
6.3 Training
• The objective of training is to provide good understanding of all the facets of dispensing activities including operations, procedures, maintenance and hazards of CNG and the risks associated with handling of the product. Training shall ensure that the jobs are performed in accordance with the laid down procedures and practices • Training shall be imparted to the staff attached with the CNG dispensing unit at the time of induction, which is to be followed up by periodic refresher courses. The training shall cover the following aspects:
� Hazardous characteristics of CNG � Familiarization with operational procedures & practices � Commissioning of new facilities and equipment � Hands on experience on operation of equipment � Routine maintenance activities of the facilities � Knowledge of emergency and manual shut down systems � Immediate & effective isolation of any CNG leak

DET NORSKE VERITAS QRA Study for CNG stations
Mumbai
� Accounting of product � Safety regulations and accident preventions � Fire Fighting facilities, methods of fire fighting and its upkeep � Evacuation and safe egress of vehicles � Housekeeping � Safety in transportation of CNG � First aid � Emergency plan/drills
• Appropriate training techniques shall be adopted which will include: � Housekeeping � Safety in transportation of CNG � Demonstration � Case-studies � Training ads
• Proper records for the training and refresher courses shall be maintained by installation.

DET NORSKE VERITAS QRA Study for CNG stations
Mumbai
7.0 References
SL. No REFERENCE DOCUMENTS
1 Center for Chemical Process Safety (CCPS), Guidelines for Hazard Evaluation Procedures 2nd Edition.
2 Overall Plot Plan
3 DNV Technical Note for Process Pipes (T14)
4 DNV Technical Note for Above Ground Tanks (T14)
5 DNV Technical Note for Under Ground Tanks (T14)
6 Population data provided by MGL
7 Software PHAST v 6.54
8 Software PHAST RISK v 6.54
9 Oil Industry Safety Directorate (OISD), STD-179 and STD-226, First Edition, August 2007.
10 Petroleum and natural Gas Regulatory Board.
11 An American National Standard, ASME B31.8 – Gas Transmission and Distribution Piping systems.

DET NORSKE VERITAS QRA Study for CNG stations
Mumbai
8.0 Abbreviations
ALARP As Low As Reasonably Practicable
Barg Bar Gauge
CGS City Gate Station
DBS Daughter Booster Station
ESD Emergency Shut-Down
F & G Fire and Gas Detection
HC Hydrocarbon
HCRD Hydro Carbon Release Database (UK HSE)
IR Individual Risk
JF Jet Fire
Kg/s Kilogram’s per second
KJ Kilo Joules, a measure of thermal dose
KW/m2 Kilo Watt per Square Metre, a measure of heat flux or radiant heat
LFL Lower Flammable Limit
LSIR Location Specific Individual Fatality Risk per year
MAH Major Accident Hazard
Mm Millimetre
P&ID Piping and Instrumentation Diagram
Psi Pounds per square inch, a measure of (over) pressure
QRA Quantitative Risk Analysis
UK HSE UK Health and Safety Executive
UFL Upper Flammable Limit
VCE Vapour Cloud Explosion

DET NORSKE VERITAS QRA Study for CNG stations
Mumbai
APPENDIX I CONSEQUENCE ANALYSIS

DET NORSKE VERITAS QRA Study for CNG stations
Mumbai
9.0 Consequence Results
The magnitude of potential consequences / hazard zones from all identified failure cases were estimated using DNV’s proprietary software package PhastRisk. This section presents consequence results for representative release scenarios for the MGL CNG filling stations facility.
9.1 Jet Fire Events
The impacts of hazardous events are described in terms of threshold values and probabilities that the impact at the given threshold is fatal. For the purpose of the risk calculations, immediate fatality is assumed for all personnel within the 37.5 kW/m2 radiation contour of a jet fire. Hazard zones from jet fire events are presented in the form of 37.5 kW/m2 radiation levels. These hazard zones show the distances from the selected release point for each jet fire event. A horizontal jet fire has been shown here as it is a worst case event that results in a larger hazard zone than a vertical or diagonal release and is generally more hazardous for personnel and equipment. However, since jet fire events are effectively unidirectional, not all of the equipment within a given hazard zone can be exposed to this level of radiation - the heat loads from any single jet fire event are direction sensitive. The jet flame lengths and the subsequent radiation hazard ranges are primarily driven by the release rate and the material. Table 9-1 represents Jet fire distances for identified events.
Table 9-1: Hazard Zones for Jet fire Events
Radiation Level 37.5
kW/m2 (m)
Radiation Level 12.5
kW/m2 (m)
Radiation Level
4kW/m2 (m) Sr. No.
Event ID Event Description
2 m/s F 2 m/s F 2 m/s F Disk Failure of Bullets
1 Low level Disk rupture 348 460 660
2 Medium level Disk rupture
370 489 700
3 High Level Disk rupture 387 513 732
Leak from Bullets
1 Low level 6 mm Not Reached Not Reached 14
2 Medium level 6 mm Not Reached Not Reached 15
3 High Level 6 mm Not Reached Not Reached 16
4” CS inlet pipeline
1 Failure of 4” 5 mm Not Reached Not Reached Not Reached

DET NORSKE VERITAS QRA Study for CNG stations
Mumbai
2 10 mm Not Reached Not Reached 6
3 25 mm Not Reached 14 18
4
CS Pipeline
Full bore rupture
45 57 75
Compressor
1 1mm Not Reached Not Reached Not Reached
2
Leak in Compressor
PSV Failure 36 46 60
9.2 Flash Fire Events
A Flash Fire is effectively the advancing flame front of an ignited vapour cloud. Although it presents significant personnel hazards (any outdoor personnel caught within the Flash Fire envelope are considered immediate fatalities), flash fires do not cause significant structural damage. There is little radiation outside of the LFL contour, and damage done by the flash fire should be restricted to ignition of easily ignitable materials such as flammable vapour vents, cabling and plastic. Furthermore, flash fires do not generally create overpressures and as such their damage is limited to thermal impacts only. Wind speed and atmospheric stability may have a significant effect on the dispersion of a vapour cloud which ultimately determines distance to LFL concentrations. It should be noted that the results relate to worst-case hazard ranges, i.e. maximum downwind distance reached. Flash fire has a heat flux of approximately 84kW/m2 for relatively short periods of time, typically less than 3 seconds (NFPA 2113). Table 9-2 represents flash fire distances for identified events.
Table 9-2: Hazard Zones for Largest Contributing Flash Fire Events (0.5 LFL ppm) Event ID Event
Description Flash fire
Distance at LFL (m)
Bullet Low Level Disk Rupture 568
Medium Level Disk Rupture 613 High Level Disk Rupture 651
Pipeline Pipeline Full Bore
Rupture 52
9.3 Vapour Cloud Explosion (VCE)
An explosion caused by the instantaneous burning of vapour cloud formed in air due to release of flammable material.

DET NORSKE VERITAS QRA Study for CNG stations
Mumbai
As the density of Natural Gas is lesser than air, it will not form the sufficient cloud for VCE to occur after releasing from the source rather it will disperse into the atmosphere.

DET NORSKE VERITAS QRA Study for CNG stations
Mumbai
APPENDIX II PAST ACCIDENT DATA

DET NORSKE VERITAS QRA Study for CNG stations
Mumbai
10.0 Past Accident data for Pipeline
10.1 Natural Gas pipeline rupture and fire near Carlsbad, New Mexico - August 19, 2000
10.1.1 Accident Synopsis
At 5:26 a.m., mountain daylight time, on Saturday, August 19, 2000, a 30-inchdiameter natural gas transmission pipeline operated by El Paso Natural Gas Company (EPNG) ruptured adjacent to the Pecos River near Carlsbad, New Mexico. The released gas ignited and burned for 55 minutes. Twelve persons who were camping under a concrete-decked steel bridge that supported the pipeline across the river were killed and their three vehicles destroyed. Two nearby steel suspension bridges for gas pipelines crossing the river were extensively damaged. According to EPNG, property and other damages or losses totalled $998,296. The EPNG pipeline system transported gas west from Texas and New Mexico to Arizona and California. A portion of the pipeline system crossed the Pecos River about 4 1/2 miles north of the Texas-New Mexico State line and 30 miles south of Carlsbad, New Mexico. About 1 mile west of the river crossing was the Pecos River compressor station, which received gas from four natural gas transmission pipelines-26-inch-diameter line 1100, 30-inch-diameter line 1103, 30-inch-diameter line 1110, and 16-inch-diameter line 3191. Three of these lines (1100, 1103, and 1110) ran parallel to Whitethorn Road (also known as Pipeline Road) from the Pecos River to the Pecos River compressor station. Lines 1103 and 1110 were supported at the river crossing by a one-lane concrete-decked steel service bridge that was not open to the public. (This bridge, which had been built by EPNG in 1950, also supported a water pipeline and a gas gathering pipeline. EPNG, which was at the time of the accident a subsidiary of El Paso Energy, owned and operated the water pipeline but not the gas gathering pipeline.) Line 1100 was supported across the river on a pipeline suspension bridge approximately 70 feet northeast of the service bridge. Another EPNG pipeline, 16- inch-diameter line 1000, was supported by a separate suspension bridge in this area, but this line had been removed from service and was filled with nitrogen at the time of the accident. The fourth pipeline, line 3191, ran from EPNG.s South Carlsbad compressor station to the Pecos River compressor station. The aerial view of the accident site is shown in figure 10-1.

DET NORSKE VERITAS QRA Study for CNG stations
Mumbai
Figure 10-1. Aerial view of accident site looking east.
10.1.2 Probable Cause
The National Transportation Safety Board determines that the probable cause of the August 19, 2000, natural gas pipeline rupture and subsequent fire near Carlsbad, New Mexico, was a significant reduction in pipe wall thickness due to severe internal corrosion. The severe corrosion had occurred because El Paso Natural Gas Company’s corrosion control program failed to prevent, detect, or control internal corrosion within the company’s pipeline. Contributing to the accident were ineffective Federal preaccident inspections of El Paso Natural Gas Company that did not identify deficiencies in the company’s internal corrosion control program.
10.1.3 Findings
• The following were neither causal nor contributory to the accident or its aftermath: overpressure of the pipeline, the interruption in or loss of supervisory control and data acquisition system communication, external damage to the pipeline through excavation or other activities, and external corrosion of the pipeline.
• Line 1103 ruptured as a result of severe internal corrosion that caused a reduction in pipe wall thickness to the point that the remaining metal could no longer contain the pressure within the pipe.
• The corrosion that was found in line 1103 at the rupture site was likely caused by a combination within the pipeline of microbes and such contaminants as moisture, chlorides, oxygen, carbon dioxide, and hydrogen sulfide.

DET NORSKE VERITAS QRA Study for CNG stations
Mumbai
• If the accident section of pipeline 1103 had been able to accommodate cleaning pigs, and if cleaning pigs had been used regularly with the resulting liquids and solids thoroughly removed from the pipeline after each pig run, the internal corrosion that developed in this section of pipe would likely have been less severe.
• As a likely result of the partial clogging of the .drip. upstream of the rupture location, some liquids bypassed the drip, continued through the pipeline, and accumulated and caused corrosion at the eventual rupture site where pipe bending had created a low point in the pipeline.
• Had El Paso Natural Gas Company effectively monitored the quality of gas entering the pipeline and the operating conditions in pipeline 1103 and periodically sampled and analyzed the liquids and solids that were removed from the line, it would likely have determined that the potential existed for significant corrosion to occur within the pipeline.
• Before the accident, El Paso Natural Gas Company did not have in place an internal corrosion control program that was adequate to identify or mitigate the internal corrosion that was occurring in its pipelines.
• The current Federal pipeline safety regulations do not provide adequate guidance to pipeline operators or enforcement personnel in mitigating pipeline internal corrosion.
• The Office of Pipeline Safety did not make accurate preaccident assessments of El Paso Natural Gas Company’s internal corrosion control program and therefore did not identify deficiencies in the program before the accident.
10.2 Natural Gas Explosion and Fire in South Riding, Virginia - July 7, 1998
10.2.1 Accident Synopsis
About 12:25 a.m. on July 7, 1998, a natural gas explosion and fire destroyed a newly constructed residence in the South Riding community in Loudoun County, Virginia. A family consisting of a husband and wife and their two children were spending their first night in their new home at the time of the explosion. As a result of the accident, the wife was killed, the husband was seriously injured, and the two children received minor injuries. Five other homes and two vehicles were damaged. The National Transportation Safety Board determines that the probable cause of the accident in South Riding, Virginia, was the corrosion and subsequent overheating and arcing at a splice in one of the conductors of the triplex electrical service line, which, because of inadequate separation between the electrical conductors and the gas service line, led to the failure of the gas service line and the subsequent uncontrolled release of natural gas that accumulated in the basement and was subsequently ignited. Precipitating the electrical service line failure was damage done to the electrical service line during installation of the gas service line and/or during subsequent excavation of the electrical line. The safety issues identified during this investigation were (1) the adequacy of standards for minimum separation distances between gas service lines and electrical service lines and (2) the lack of a requirement for the installation of excess flow valves. As a result of this investigation, the Safety Board issues two recommendations to the Research and Special Programs Administration (RSPA) and one recommendation each to the Edison Electric Institute, the National Rural Electric Cooperative Association, the American Power Association, and the U.S. Department of Agriculture’s Rural Utilities Service. The accident area and the post accident debris are shown in figure 6-2 and figure 6-3.

DET NORSKE VERITAS QRA Study for CNG stations
Mumbai
Figure 10-2: The accident area

DET NORSKE VERITAS QRA Study for CNG stations
Mumbai
Figure 10-3: Post Accident debris
10.2.2 Probable Cause
The National Transportation Safety Board determines that the probable cause of the accident in South Riding, Virginia, was the corrosion and subsequent overheating and arcing at a splice in one of the conductors of the triplex electrical service line, which, because of inadequate separation between the electrical conductors and the gas service line, led to the failure of the gas service line and the subsequent uncontrolled release of natural gas that accumulated in the basement and was subsequently ignited. Precipitating the electrical service line failure was damage done to the electrical service line during installation of the gas service line and/or during subsequent excavation of the electrical line.
10.2.3 Findings
• Based on the size and location of the hole in the gas service line, the amount of gas that would have been needed to cause the accident, the presence of a strong smell of gas outside the house before the explosion, and the presence of natural gas in the soil underneath the residence, the most likely source of the natural gas that filled the residence basement and fuelled the explosion was the damaged gas service line leading to the house.

DET NORSKE VERITAS QRA Study for CNG stations
Mumbai
• Work performed either during installation of the gas service line or during subsequent excavation of the electrical line, or both, damaged the protective insulation for the triplex electrical conductors and splices in the area of the hole in the gas service line.
• The damage to the protective insulation covering the splice in the electrical conductor identified as cable B allowed moisture to reach the crimp connector, causing corrosion that increased electrical resistance between the crimp connector and the cable sufficient to cause the splice to overheat and fail.
• Heat generated from the arcing resulting from cable B’s failure under load caused the gas service line wall to soften and weaken until the internal pressure breached the pipeline and it began to leak.
• The failure of the conductor identified as cable A was a secondary event that may have occurred after the explosion as a result of short circuiting within the damaged residence’s electrical system.
• The gas present in the soil around and under the house entered the basement of the residence either through penetrations in the concrete slab or cracks in the foundation, or both.
• Had the gas and electrical service lines involved in this accident been adequately separated, the heat from the arcing electrical conductor failure would probably not have damaged the gas service line, and the accident would not have occurred.
• Had an excess flow valve been installed in the gas line to the residence, the valve would have closed after the hole in the pipeline developed, and the explosion likely would not have occurred.

DET NORSKE VERITAS QRA Study for CNG stations
Mumbai
11.0 Past accident for CNG Vehicle
11.1 A Cylinder Ruptured in a suburb of Toronto in September 2003
11.1.1 Accident synopsis
In September 2003 in a suburb of Toronto, a cylinder ruptured during fuelling of a van which was converted to CNG in 1994(figure 11-1). “Apparently the cylinder failed during fuelling at substantially under its rated 200 bar….It was reported that there was massive external corrosion on the tank and there was no evidence of it having been inspected.”
Figure 11-1: Post accident debris
11.1.2 Possible Cause
• The cylinder was not properly inspected
11.1.3 Findings
• Periodic fuel system safety inspections help ensure safe vehicle operation

DET NORSKE VERITAS QRA Study for CNG stations
Mumbai
11.2 Type 1 cylinder failed in 2000
11.2.1 Accident synopsis
In 2000 a Type 1 cylinder failed, probably from over pressurization. It is suspected that multiple failures of pressure regulating and relief systems allowed dispensing of 400 bar gas, failing a cylinder during fuelling (figure-11-2).
Figure 11-2: Cylinder Failed due to Over Pressurization
11.2.2 Possible Cause
• Vehicle Cylinders can be Over Pressurized and Rupture
11.2.3 Findings
• Dispensers have two separate pressure relief valves to protect the cylinder against over pressurization. • Consider whether vehicle tanks should also provide protection against over pressurization.

DNV Energy DNV Energy is a leading professional service provider in safeguarding and improving business performance, assisting energy companies along the entire value chain from concept selection through exploration, production, transportation, refining and distribution. Our broad expertise covers Asset Risk & Operations Management, Enterprise Risk Management; IT Risk Management; Offshore Classification; Safety, Health and Environmental Risk Management; Technology Qualification; and Verification. REGIONAL HEAD OFFICES: DNV ENERGY Americas and West Africa Rua Sete de Setembro 111/12 Floor 20050006 Rio de Janeiro Brazil Phone: +55 21 2517 7232 DNV ENERGY Asia and Middle East 24th Floor, Menara Weld Jalan Raja Chulan 50200 Kuala Lumpur Phone: +603 2050 2888 DNV ENERGY Europe and North Africa Palace House 3 Cathedral Street London SE1 9DE United Kingdom Phone: +44 20 7357 6080
DNV ENERGY Nordic and Eurasia Veritasveien 1 N-1322 Hovik Norway Phone: +47 67 57 99 00 DNV ENERGY Offshore Class and Inspection Veritasveien 1 N-1322 Hovik Norway Phone: +47 67 57 99 00 DNV ENERGY Cleaner Energy & Utilities Veritasveien 1 N-1322 Hovik Norway Phone: +47 67 57 99 00