mahindra ltd g. m. · mhcv (>6t) -12.1% negative exchange rate impact of -3% in sales (real drop...
TRANSCRIPT

February 26,2020
Mahindra CIE Automotive Ltd Mahindra Towers, 1"' Floor.
Or. G. M. Bhosale Marg, Worli. Mumbai 400 018, India Tel: +91 22 24931449 Fax +912224915890 w mah~ndracle com
mele ~nvestors@mahlndracrecom
Dear Sir / Madam,
BSE Limited Corporate Relationship Department, P. J. Towers, Dalal Street, Fort, Murnbai - 400 001.
BSE Scrip Code: 532756
Subject: Investor Presentation - Q4CY19 and Full Year CY19 Results
National Stock Exchange of India Limited Corporate Relationship Department, Exchange Plaza, Floor, Plot No. C/1, G Block, Bandra Kurla Complex, Bandra (E), Mumbai - 400 05 1.
NSE Scrip Code: MAHINDCIE
Please find enclosed herewith Investor Presentation in respect of Q4CY19 and Full Year CY19 Results.
Kindly acknowledge the receipt.
Thanking you,
Yours faithfully, For Mabindra CIE Automotive Limited
Membership No: A 29614 Company Secretary and Compliance
Encl: As above
Mahindra CIE Automotive Limited CIN L27100MH1999PLC121285
1
Q4 and Full Year CY19 Results26th February 2020│ Mumbai
2

3
INDEX
1. KEY HIGHLIGHTS
2. OVERVIEW
3. Q4 CY2019 RESULTS
4. FULL YEAR CY2019 RESULTS
5. BALANCE SHEET AND CASH FLOW
6. STRATEGY AND PERFORMANCE
7. MCIE IN STOCK EXCHNAGES
8. MARKET AND FORECASTS
9. SEBI RESULTS

4
1. KEY HIGHLIGHTS
5
KEY HIGHLIGHTS
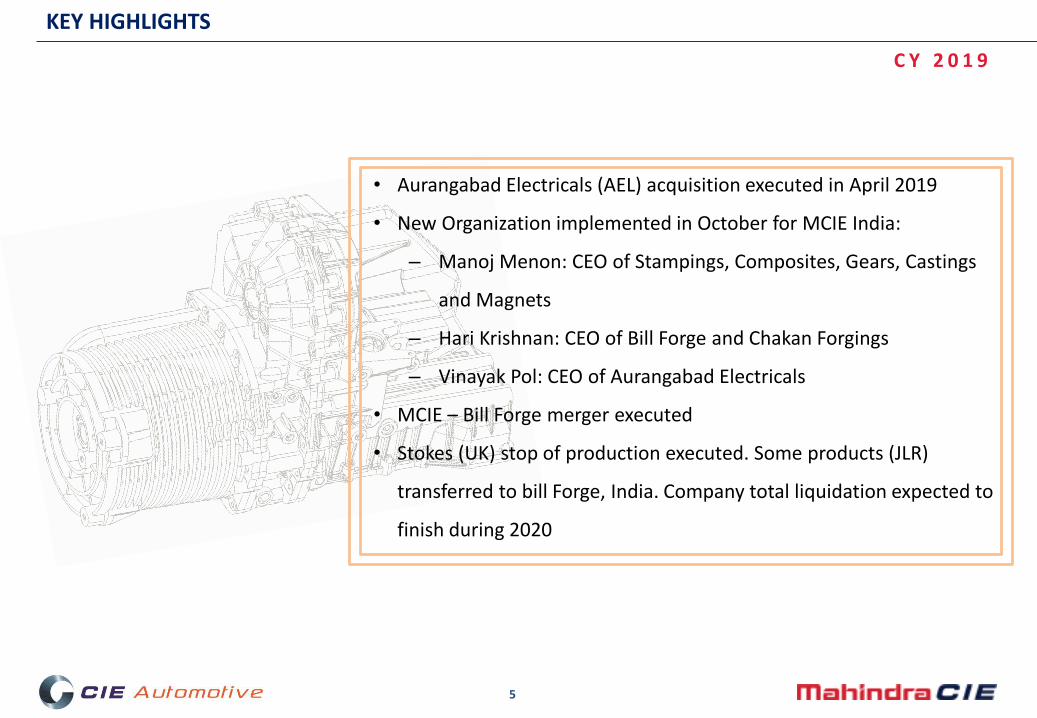
• Aurangabad Electricals (AEL) acquisition executed in April 2019
• New Organization implemented in October for MCIE India:
– Manoj Menon: CEO of Stampings, Composites, Gears, Castings
and Magnets
– Hari Krishnan: CEO of Bill Forge and Chakan Forgings
– Vinayak Pol: CEO of Aurangabad Electricals
• MCIE – Bill Forge merger executed
• Stokes (UK) stop of production executed. Some products (JLR)
transferred to bill Forge, India. Company total liquidation expected to
finish during 2020
C Y 2 0 1 9

6
AURANGABAD ELECTRICALS LIMITED (AEL)
In April 2019, MCIE acquired AEL – Aluminium die casting company for two wheelers & passenger cars primarily in the areas of body, brake & engine parts
Plant N1 HPDC (17 presses: 150-900 T ) + Machining PANTNAGAR
AURANGABAD
PUNE
Plant Locations
Plant 3HPDC (22 presses: 150-650T )+ MachiningPlant 3A&BHPDC (7 presses : 840T ) + Machining
Plant GDCGDC(32 machines) + Machining
Tool Room
Plant 6 HPDC (10 presses: 250-840T) + Machining
+ Capabilities for Heat Treatment, Powder Coating, Assembly & Leak Testing *HPDC= High Pressure Die Casting GDC = Gravity Die Casting
Brake Panel Step Holder Crankcase
Cluch Cover Brake Drum Cyld. Head
Oil Pump Hsg( HPDC)
Brake Caliper (GDC)
Turbo Cover (GDC)
HPDC
Products
Strong Customers + Strong Goodwill + Strong presence in 2W + Increasing Exports
Diversified Product Mix + High Machining Content + Competitive position in top products
100% share of business in many product categories
75% dependence on 2wheelers

7
2. OVERVIEW

8
MCIE OVERVIEW
L E G A L S T R U C T U R E

99
MCIE TECHNOLOGY REVENUE SPLIT
T E C H N O L O G Y W I S E B R E A K U P *
FORGING 62%
ALUMINUM 10%
STAMPINGS 10%
GEARS/ MACHINING
10%
CASTINGS 5%
MAGNETICS 1% COMPOSITES1%FORGING
34%
ALUMINUM
22%STAMPINGS
22%
GEARS/ MACHINING
11%CASTINGS
6%
MAGNETICS 3% COMPOSITES3%
FORGING
87%GEARS/ MACHINING
13%
* AEL 9 Months CY19 has been annualized for this consideration

1010
MCIE – END USE SEGMENTS
CARS UTILITY VEHICLES
MHCV
CONSTRUCTION EQUIPMENT
TWO WHEELERS
TRACTORSLIGHT
COMMERCIAL VEHICLES
TOP CUSTOMERS
Mahindra, Bajaj, Maruti, Tata, Hero
TECHNOLOGIES• Forging• Aluminium• Stampings• Castings• Gears/ Machining• Magnetic Products• Composites
END USE SEGMENTS
CARS
MHCV
TOP CUSTOMERSRenault, VW, Ford, JLR, BMW
Daimler, MAN, Scania, DAF, Renault
CAT, Eaton, CNHTRACTORS
TECHNOLOGIES• Car Forgings
Spain, Lithuania
• Heavy Truck ForgingsGermany
• Gears/ MachiningItaly
END USE SEGMENTS

11
3. Q4 CY2019 RESULTS
12
MCIE INDIA
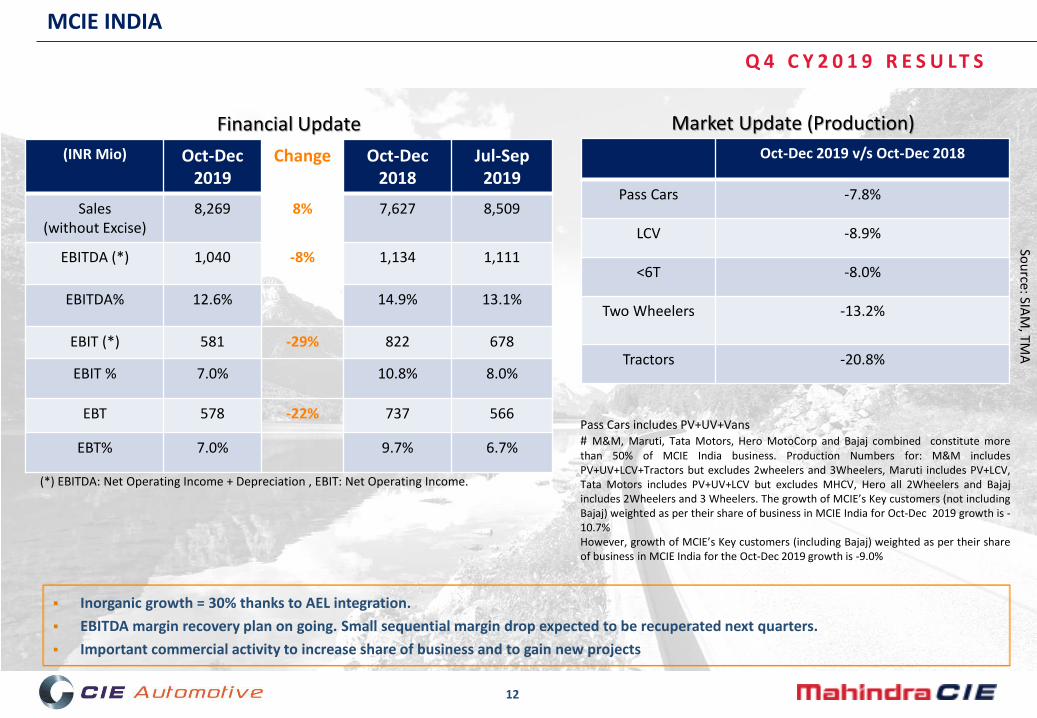
(INR Mio) Oct-Dec 2019
Change Oct-Dec 2018
Jul-Sep 2019
Sales(without Excise)
8,269 8% 7,627 8,509
EBITDA (*) 1,040 -8% 1,134 1,111
EBITDA% 12.6% 14.9% 13.1%
EBIT (*) 581 -29% 822 678
EBIT % 7.0% 10.8% 8.0%
EBT 578 -22% 737 566
EBT% 7.0% 9.7% 6.7%
(*) EBITDA: Net Operating Income + Depreciation , EBIT: Net Operating Income.
Financial Update
Q 4 C Y 2 0 1 9 R E S U LT S
Pass Cars includes PV+UV+Vans# M&M, Maruti, Tata Motors, Hero MotoCorp and Bajaj combined constitute morethan 50% of MCIE India business. Production Numbers for: M&M includesPV+UV+LCV+Tractors but excludes 2wheelers and 3Wheelers, Maruti includes PV+LCV,Tata Motors includes PV+UV+LCV but excludes MHCV, Hero all 2Wheelers and Bajajincludes 2Wheelers and 3 Wheelers. The growth of MCIE’s Key customers (not includingBajaj) weighted as per their share of business in MCIE India for Oct-Dec 2019 growth is -10.7%However, growth of MCIE’s Key customers (including Bajaj) weighted as per their shareof business in MCIE India for the Oct-Dec 2019 growth is -9.0%
Market Update (Production)
Oct-Dec 2019 v/s Oct-Dec 2018
Pass Cars -7.8%
LCV -8.9%
<6T -8.0%
Two Wheelers -13.2%
Tractors -20.8%
▪ Inorganic growth = 30% thanks to AEL integration.
▪ EBITDA margin recovery plan on going. Small sequential margin drop expected to be recuperated next quarters.
▪ Important commercial activity to increase share of business and to gain new projects
Sou
rce: SIAM
, TMA

13
MCIE EUROPE
(INR Mio) Oct-Dec 2019
Change Oct-Dec 2018
Jul-Sep 2019
Sales(without Excise)
8,361 -25% 11,199 9,340
EBITDA (*) 1,068 -34% 1,613 1,074
EBITDA% 12.8% 14.4% 11.5%
EBIT (*) 739 -38% 1,188 718
EBIT % 8.8% 10.6% 7.7%
EBT 637 -41% 1,082 632
EBT% 7.6% 9.7% 6.8%
Financial Update
(*) EBITDA: Net Operating Income + Depreciation , EBIT: Net Operating Income
Market Update (Production)
Q 4 C Y 2 0 1 9 R E S U LT S
Oct-Dec 2019v/s
Oct-Dec 2018
Passenger Vehicles -5.8%
MHCV (>6T) -12.1%
▪ Negative exchange rate impact of -3% in sales (real drop in Euros around -23%).
▪ Commercial and off road vehicle markets decline affects sales and profitability. However Q4 margin improving sequentially thanks to restructuring actions already taken
Sou
rce: IHS G
lob
al
As per IHS Global : MHCV (>6T) Production in Germany droppedin Oct-Dec 2019 by 34.6% on a y-o-y basis
As per ACEA registrations data, the Heavy Trucks segment inEurope (EU) dropped in Oct-Dec 2019 by 13% on a y-o-y basis

14
MCIE CONSOLIDATED
(INR Mio) Oct-Dec 2019 Change Oct-Dec 2018 Jul-Sep 2019
Sales(without Excise)
16,632 -11% 18,733 17,850
EBITDA (*) 2,109 -23% 2,747 2,186
EBITDA% 12.7% 14.7% 12.2%
EBIT (*) 1,321 -34% 2,010 1,396
EBIT % 7.9% 10.7% 7.8%
EBT 1,215 -33% 1,819 1,198
EBT% 7.3% 9.7% 6.7%
Q 4 C Y 2 0 1 9 R E S U LT S
(*) EBITDA: Net Operating Income + Depreciation , EBIT: Net Operating Income
▪ Weak fourth quarter sales and result, due to negative market evolution
▪ EBITDA recovery plan start showing results despite the sales drop
15
4. FULL YEAR CY2019 RESULTS

16
MCIE INDIA
(INR Mio) Jan-Dec 2019 Change Jan-Dec 2018
Sales(without Excise)
33,798 8% 31,202
EBITDA (*) 4,662 -3% 4,805
EBITDA% 13.8% 15.4%
EBIT (*) 3,047 -15% 3,588
EBIT % 9.0% 11.5%
EBT 2,908 -18% 3,552
EBT% 8.6% 11.4%
(*) EBITDA: Net Operating Income + Depreciation, EBIT: EBT + financial results.
Financial Update
F U L L Y E A R C Y 2 0 1 9 R E S U LT S
Pass Cars includes PV+UV+Vans# M&M, Maruti, Tata Motors, Hero MotoCorp and Bajaj combined constitute more than50% of MCIE India business. Production Numbers for: M&M includesPV+UV+LCV+Tractors but excludes 2wheelers and 3Wheelers, Maruti includes PV+LCV,Tata Motors includes PV+UV+LCV but excludes MHCV, Hero all 2Wheelers and Bajajincludes 2Wheelers and 3 Wheelers. The growth of MCIE’s Key customers (not includingBajaj) weighted as per their share of business in MCIE India for the Jan-Dec 2019 growthis -12.1%.However, growth of MCIE’s Key customers (including Bajaj) weighted as per their shareof business in MCIE India for the Jan-Dec 2019 growth is -5.8%
Market Update (Production)
Jan-Dec 2019 v/s Jan-Dec 2018
Pass Cars -10.9%
LCV -11.2%
<6T -10.5%
Two Wheelers -12.1%
Tractors -11.8%
▪ Accumulated sales growth due to AEL integration. Organic drop around 12%. Inorganic growth about 20%
▪ EBITDA margin slightly reduced to 13.8% due to AEL lower margin (12%) and sales drop impact specially in the last 2 quarters
Sou
rce: SIAM
, TMA

17
MCIE EUROPE
(INR Mio) Jan-Dec 2019 Change Jan-Dec 2018
Sales(without Excise)
41,861 -8% 45,284
EBITDA (*) 5,300 -13% 6,092
EBITDA% 12.7% 13.5%
EBIT (*) 3,754 -15% 4,442
EBIT % 9.0% 9.8%
EBT 3,371 -15% 3,976
EBT% 8.1% 8.8%
Financial Update
(*) EBITDA: Net Operating Income + Depreciation, EBIT: EBT + financial results.
Market Update (Production)
F U L L Y E A R C Y 2 0 1 9 R E S U LT S
Jan-Dec 2019 v/s
Jan-Dec 2018
Passenger Vehicles -4.6%
MHCV (>6T) -7.2%
▪ 2% sales drop due to exchange rate impact. Real sales in euros drop around 6%.
Sou
rce: IHS G
lob
al
As per IHS Global : MHCV (>6T) Production in Germanydropped by 18.9% in CY 2019 on y-o-y basis
As per ACEA registrations data, the Heavy Trucks segment inEurope (EU) grew by +1%

18
MCIE CONSOLIDATED
(INR Mio) Jan-Dec 2019 Change Jan-Dec 2018
Sales(without Excise)
75,660 -1% 76,486
EBITDA (*) 9,962 -9% 10,897
EBITDA% 13.2% 14.2%
EBIT (*) 6,801 -15% 8,030
EBIT % 9.0% 10.5%
EBT 6,278 -17% 7,528
EBT% 8.3% 9.8%
PAT 3,538 -36% 5,485
PAT% 4.7% 7.2%(*) EBITDA: Net Operating Income + Depreciation, EBIT: EBT + financial results.
F U L L Y E A R C Y 2 0 1 9 R E S U LT S
▪ PAT drop due to 2 main effects
₋ 331 mio on negative impact due to MAT credit loss in MCIE after changing to 25% tax rate₋ 892 mio of Forgings Germany tax credits deactivation

19
OTHER DETAILS
OTHER OPERATING REVENUE, OTHER INCOME AND EXCHANGE RATES
Period INR/ Euro
Average for Q4 CY19 78.77
Average for CY19 78.64
As on 31 Dec’ 2019 80.01
Exchange Rates
(INR Mio)
Other Operating Revenue
Other Income
India Europe Consolidated
435 152 587
24 40 64
For Q4 CY19
India Europe Consolidated
2,136 1,271 3,407
231 100 331
For Full Year CY19

20
5. BALANCE SHEET AND CASH FLOW
21
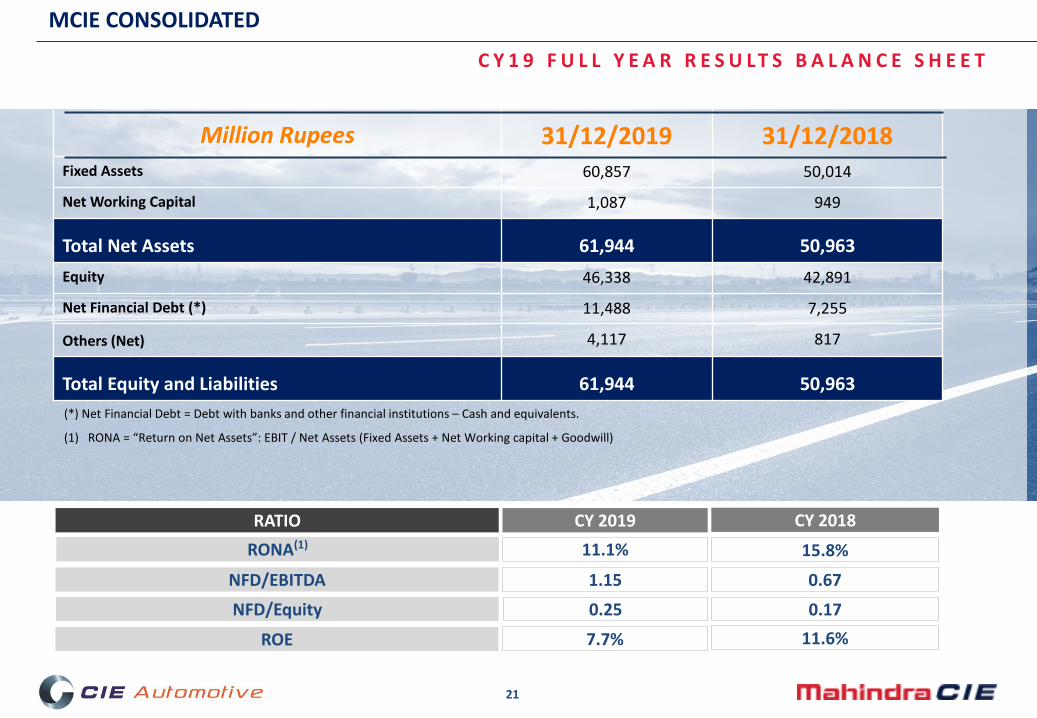
Million Rupees 31/12/2019 31/12/2018Fixed Assets 60,857 50,014
Net Working Capital 1,087 949
Total Net Assets 61,944 50,963
Equity 46,338 42,891
Net Financial Debt (*) 11,488 7,255
Others (Net) 4,117 817
Total Equity and Liabilities 61,944 50,963
(*) Net Financial Debt = Debt with banks and other financial institutions – Cash and equivalents.
(1) RONA = “Return on Net Assets”: EBIT / Net Assets (Fixed Assets + Net Working capital + Goodwill)
MCIE CONSOLIDATED
C Y 1 9 F U L L Y E A R R E S U LT S B A L A N C E S H E E T
ROE 7.7%
NFD/EBITDA 1.15
RONA(1) 11.1%
RATIO CY 2019 CY 2018
11.6%
0.67
15.8%
NFD/Equity 0.25 0.17
22
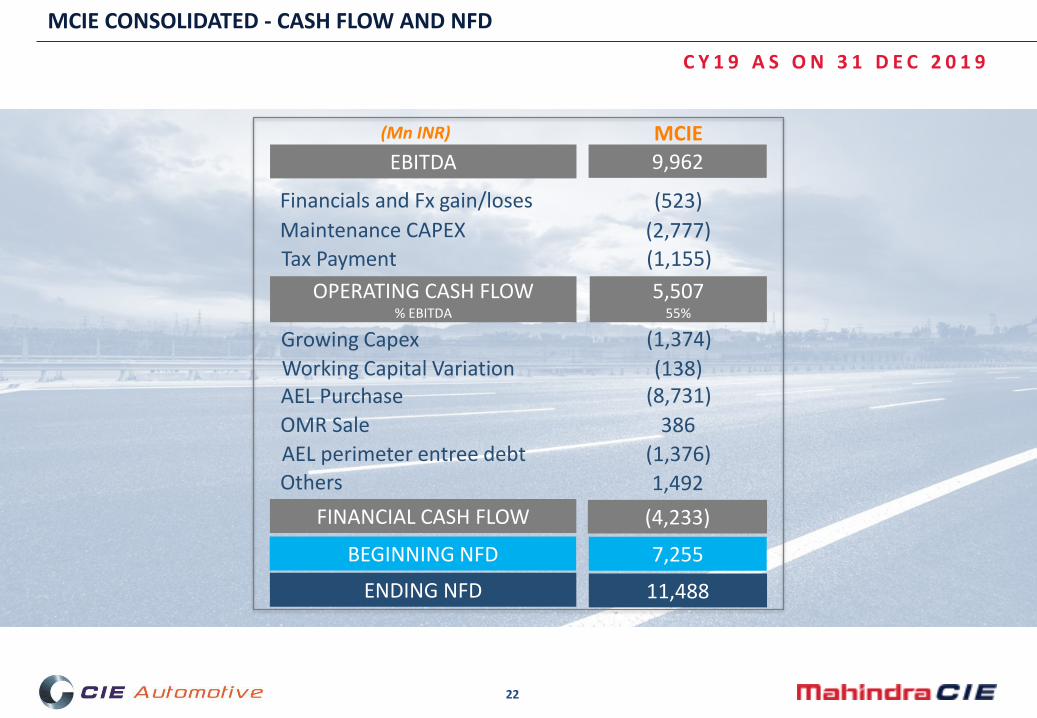
C Y 1 9 A S O N 3 1 D E C 2 0 1 9
MCIE CONSOLIDATED - CASH FLOW AND NFD
EBITDA
OPERATING CASH FLOW% EBITDA
(Mn INR) MCIE
9,962
5,50755%
(4,233)
Financials and Fx gain/loses (523)
Maintenance CAPEX (2,777)
Tax Payment (1,155)
Working Capital Variation
7,255
11,488
Others 1,492
Growing Capex (1,374)
(138)
AEL perimeter entree debt (1,376)
FINANCIAL CASH FLOW
BEGINNING NFD
ENDING NFD
OMR Sale
AEL Purchase (8,731)
386

23
6. STRATEGY AND PERFORMANCE

24
• Fill strategic gaps through M&A - Plastics
• >75% of New order booked in MCIE India (non M&M)
• New Orders (CY19 – MCIE India): EV’s – ₹85Mn and BS-VI – ₹115 Mn
MCIE STRATEGY
R E P L I C A T I N G C I E S T R A T E G Y I N I N D I A
FINANCIAL EXIGENCE
CUSTOMER/ MARKET DIVERSIFICATION
OPERATIONAL EXCELLENCE
• To maintain competitiveness
• To maintain profitability
WHAT
• To derisk Market Cycle and high customer dependence
• Be ready for technology change – Emission norms, EV’s
• Be in a position to combat market downturns
• Cash generation to Build up reserves
HOW
• Debottlenecking and incremental automation
• Manpower optimisation
• Focus on RONA and ROE• Cost Control• CAPEX monitoring• Low Debt: Debt/EBITDA<2• OCF/ EBITDA > 50%
WHY

25
(1) The EBIT for CY 2017 numbers are excluding Stokes
(2) RONA = “Return on Net Assets”: EBIT / Net Assets (Fixed Assets + Net Working capital + Goodwill).
(3) Operative Cash Flow = EBITDA – Finance Cost - Maintenance Capex – Tax Paid
(4) For all ratios of 2016, Bilforge last 12 months EBITDA and EBIT has been considered
(5) ROE including discontinued operations
(6) This is lower due to one time Tax write offs
MCIE CONSOLIDATED
K E Y R A T I O S
NFD/EBITD(4) 0.67x
NFD/EQUITY 0.17x
RONA(2) 15.8%
EBIT%(1) 10.5%
RATIO CY 2018 CY 2017
1.6x
0.3x
9.0%
6.3%
CY 2016
1.1x
0.24x
11.9%
9.2%
ROE 11.6%(5) 5.2%9.6%
OPERATIVE CASH FLOW(3) /EBITDA 66% 46%44%
1.15x
0.25x
11.1%
9.0%
CY 2019
7.7%(6)
55%

26
QUARTERLY EVOLUTION
62346356
6821 6662
7756 80248153
7627 79369,236 8,5098,2699041 8943
91549588
114161181611263 11199
12844
113169340
8361
15212 15248
15903
16184
1910719731
1932618733
2068420495
17850
16632
3000
5000
7000
9000
11000
13000
15000
17000
19000
21000
23000
Q1 C17 Q2 C17 Q3 C17 Q4 C17 Q1 C18 Q2 C18 Q3 C18 Q4 C18 Q1 C19 Q2 C19 Q3 C19 Q4 C19
India Europe Consolidated
Revenue
12.7
13.814.4 14.4
15.115.7
15.214.9
16.3
13.1 13.112.612.8
13.2
12.5
16.2
12.8
14.2
12.2
14.4
13.1 13.1
11.5
12.8
13.5
13.2
14.7
13.8
14.7
13.5
14.714.4
13.1
12.2
4
6
8
10
12
14
16
18
Q1 C17 Q2 C17 Q3 C17 Q4 C17 Q1 C18 Q2 C18 Q3 C18 Q4 C18 Q1 C19 Q2 C19 Q3 C19 Q4 C19
India Europe Consolidated
EBITDA %

27
7. MCIE IN STOCK EXCHANGES

28
STOCK EVOLUTION
I N D E X E D F R O M 1 S T J A N U A R Y 2 0 1 5
Returns over the period
MCIE Share Price Indexed to the Nifty and Nifty Auto MCIE Market Cap movement (in INR Mio)
High Low
232.9 135.1
261 135.1
302 135.1
MCIE Share Price (INR)
MCIE Nifty 50 index Nifty Auto Index
-28.7% 3.2% 4.0%
-35.4% 11.5% -10.2%
-35.0% 16.6% -30.6%
Period
6 Month (1st July – 31st Dec 2019)
12 Month (1st Jan – 31st Dec 2019)
2 Years (1st Jan 2018 – 31st Dec 2019)
60.0
70.0
80.0
90.0
100.0
110.0
120.0
130.0
140.0
150.0
160.0
Jan
uar
y-1
5
Ap
ril-
15
July
-15
Oct
ob
er-
15
Jan
uar
y-1
6
Ap
ril-
16
July
-16
Oct
ob
er-
16
Jan
uar
y-1
7
Ap
ril-
17
July
-17
Oct
ob
er-
17
Jan
uar
y-1
8
Ap
ril-
18
July
-18
Oct
ob
er-
18
Jan
uar
y-1
9
Ap
ril-
19
July
-19
Oct
ob
er-
19
MCIE Nifty Nifty Auto
40000
50000
60000
70000
80000
90000
100000
110000
120000
Jan
uar
y-1
5
Ap
ril-
15
July
-15
Oct
ob
er-
15
Jan
uar
y-1
6
Ap
ril-
16
July
-16
Oct
ob
er-
16
Jan
uar
y-1
7
Ap
ril-
17
July
-17
Oct
ob
er-
17
Jan
uar
y-1
8
Ap
ril-
18
July
-18
Oct
ob
er-
18
Jan
uar
y-1
9
Ap
ril-
19
July
-19
Oct
ob
er-
19
MCIE Mcap Max MCap Min MCap

29
8. MARKET AND FORECASTS

30
Source: SIAM, TMA
Period
CY19
Q4 CY19
Q3 CY19
Q2 CY19
Q1 CY19
Units Δ%
3,623,335 -10.9
818,304 -7.8
867,330 -19.7
903,027 -12.0
1,034,674 -3.7
INDIA MARKET: KEY SEGMENTS UPDATE - QUARTERLY
Market - Production Numbers
D E M A N D U N C E R TA I N
Cars+UV’s+Vans <6T Vehicles** Tractors
* Δ % - means comparison of Quarter volumes of this financial year with that of the same quarter of the previous financial year. E.g. Q4 C19 Volume is compared to Q4 C18volume, respectively.
** - <6T Vehicles represented here are as per International Classification and include Passenger Vehicles, Utility Vehicles, Vans and Light Commercial Vehicles as per Indian Classification
Units Δ%
4,051,551 -10.5
957,331 -8.0
995,035 -20.6
1,046,644 -12.0
1,213,489 -3.0
Units Δ%
785,414 -11.8
179,092 -20.8
903,027 -2.5
187,537 -21.3
190,528 -0.8
Units Δ%
22,062,013 -12.1
4,998,023 -13.2
5,848,239 -14.9
5,810,619 -10.1
5,405,132 -9.8
Two Wheelers
31
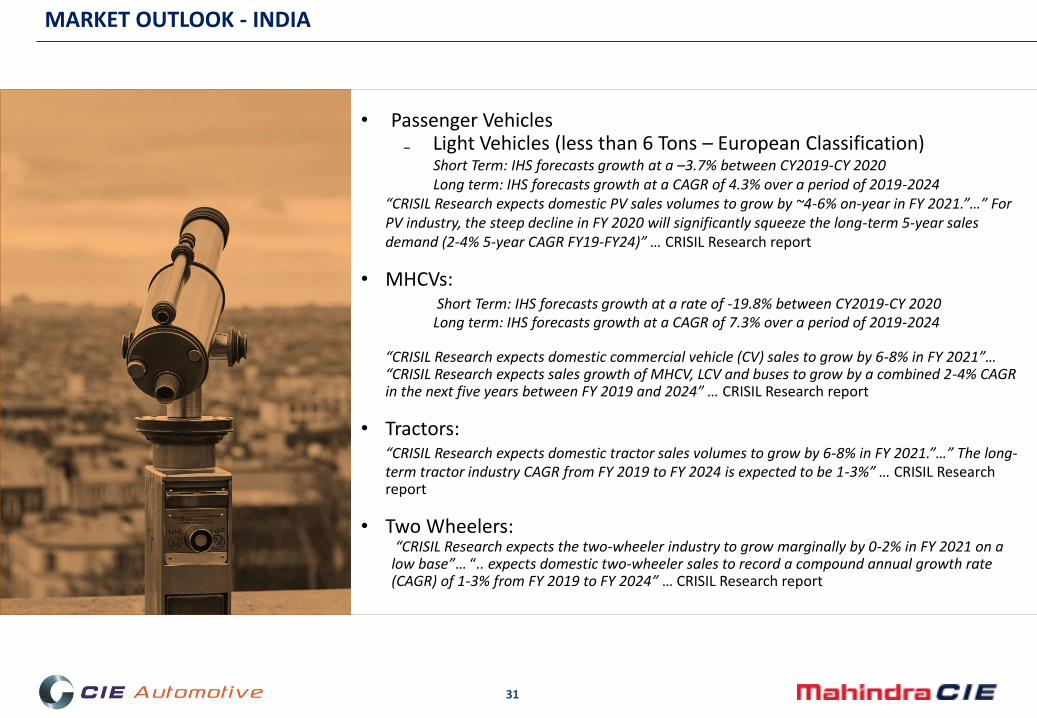
• Passenger Vehicles₋ Light Vehicles (less than 6 Tons – European Classification)
Short Term: IHS forecasts growth at a –3.7% between CY2019-CY 2020Long term: IHS forecasts growth at a CAGR of 4.3% over a period of 2019-2024
“CRISIL Research expects domestic PV sales volumes to grow by ~4-6% on-year in FY 2021.”…” For PV industry, the steep decline in FY 2020 will significantly squeeze the long-term 5-year sales demand (2-4% 5-year CAGR FY19-FY24)” … CRISIL Research report
• MHCVs: Short Term: IHS forecasts growth at a rate of -19.8% between CY2019-CY 2020
Long term: IHS forecasts growth at a CAGR of 7.3% over a period of 2019-2024
“CRISIL Research expects domestic commercial vehicle (CV) sales to grow by 6-8% in FY 2021”… “CRISIL Research expects sales growth of MHCV, LCV and buses to grow by a combined 2-4% CAGR in the next five years between FY 2019 and 2024” … CRISIL Research report
• Tractors: “CRISIL Research expects domestic tractor sales volumes to grow by 6-8% in FY 2021.”…” The long-term tractor industry CAGR from FY 2019 to FY 2024 is expected to be 1-3%” … CRISIL Research report
• Two Wheelers: “CRISIL Research expects the two-wheeler industry to grow marginally by 0-2% in FY 2021 on a
low base”… “.. expects domestic two-wheeler sales to record a compound annual growth rate (CAGR) of 1-3% from FY 2019 to FY 2024” … CRISIL Research report
MARKET OUTLOOK - INDIA
32
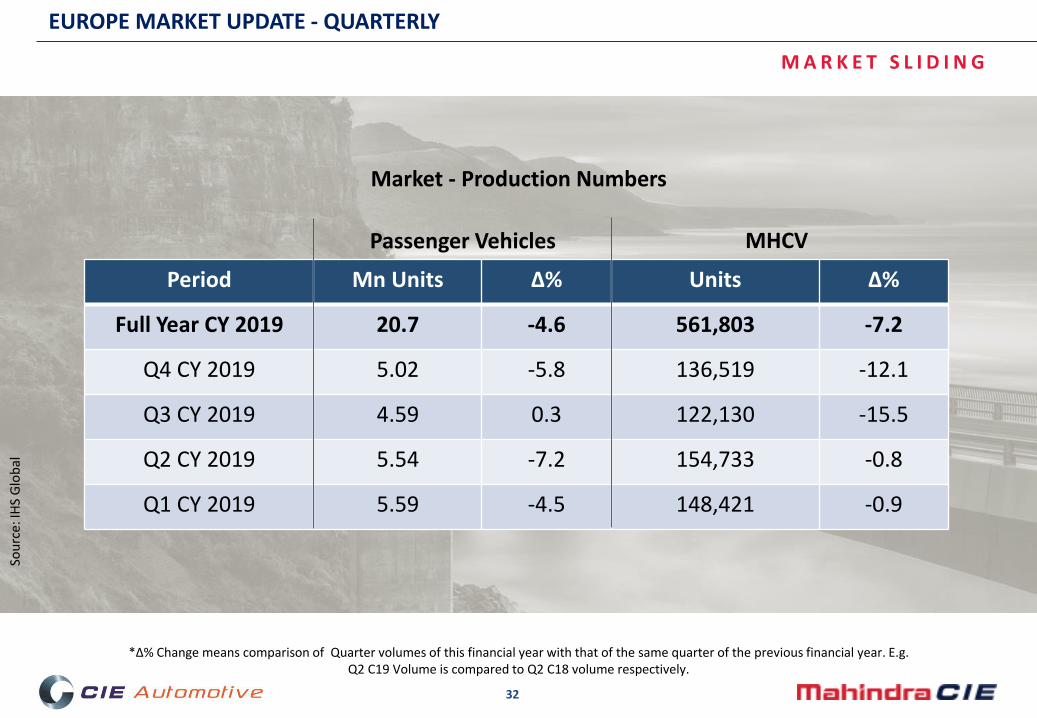
EUROPE MARKET UPDATE - QUARTERLY
Market - Production Numbers
M A R K E T S L I D I N G
Passenger Vehicles
Period Mn Units Δ% Units Δ%
Full Year CY 2019 20.7 -4.6 561,803 -7.2
Q4 CY 2019 5.02 -5.8 136,519 -12.1
Q3 CY 2019 4.59 0.3 122,130 -15.5
Q2 CY 2019 5.54 -7.2 154,733 -0.8
Q1 CY 2019 5.59 -4.5 148,421 -0.9
*Δ% Change means comparison of Quarter volumes of this financial year with that of the same quarter of the previous financial year. E.g. Q2 C19 Volume is compared to Q2 C18 volume respectively.
Sou
rce:
IHS
Glo
bal
MHCV

33
MARKET OUTLOOK - EUROPE
M A R K E T S TA B L E
• EU – Light Vehicles: ‒ IHS Global has forecasted that the Passenger Vehicle production will
decline slightly in CY20 by 2%‒ But will grow at a slow but steady pace of 0.9% CAGR between C19 to
C24
• EU – MHCV’s: ‒ IHS Global has forecasted that the MHCV production will decline
slightly in CY20 by 3.4%‒ But will grow at 2.6% CAGR between C19 to C24
34
9. SEBI RESULTS

35
STATEMENT OF STANDALONE AND CONSOLIDATED RESULTS FOR THE QUARTER AND AUDITED RESULTS FOR YEAR ENDED DECEMBER 31, 2019.
Rs. in Million
Particulars
December
31, 2019
September
30, 2019
December
31, 2018
December
31, 2019
December
31, 2018
(Refer note 12) UnauditedUnaudited
(Refer Note 10)Audited Audited
Continuing Operations
I Revenue from operations 17,229.36 18,685.02 19,750.29 79,078.23 80,315.38
II Other Income 63.17 41.62 182.09 330.88 386.86
III Total Revenue (I+II) 17,292.54 18,726.64 19,932.38 79,409.11 80,702.24
IV Expenses
a) Cost of materials consumed 7,641.23 8,567.87 9,590.49 36,590.17 37,736.82
b) Changes in stock of finished goods and work-in progress 491.10 576.73 (964.50) 896.48 (1,421.45)
c) Employee benefit expense 2,834.15 3,038.82 3,382.70 13,080.30 13,296.70
d) Finance costs 106.08 198.31 190.66 522.72 501.51
e) Depreciation and amortisation expenses 787.98 788.60 736.86 3,161.00 2,867.49
f) Other expenses 4,120.08 4,409.34 5,176.82 18,834.08 20,192.43
Total Expenses (IV) 15,980.60 17,579.67 18,113.03 73,084.75 73,173.50
V Profit before exceptional items and tax (III-IV) 1,311.94 1,146.97 1,819.84 6,324.36 7,528.74
Quarter Ended Year Ended
Consolidated
S TAT E M E N T O F P R O F I T & L O S S A C C O U N T S - C O N S O L I D AT E D
36
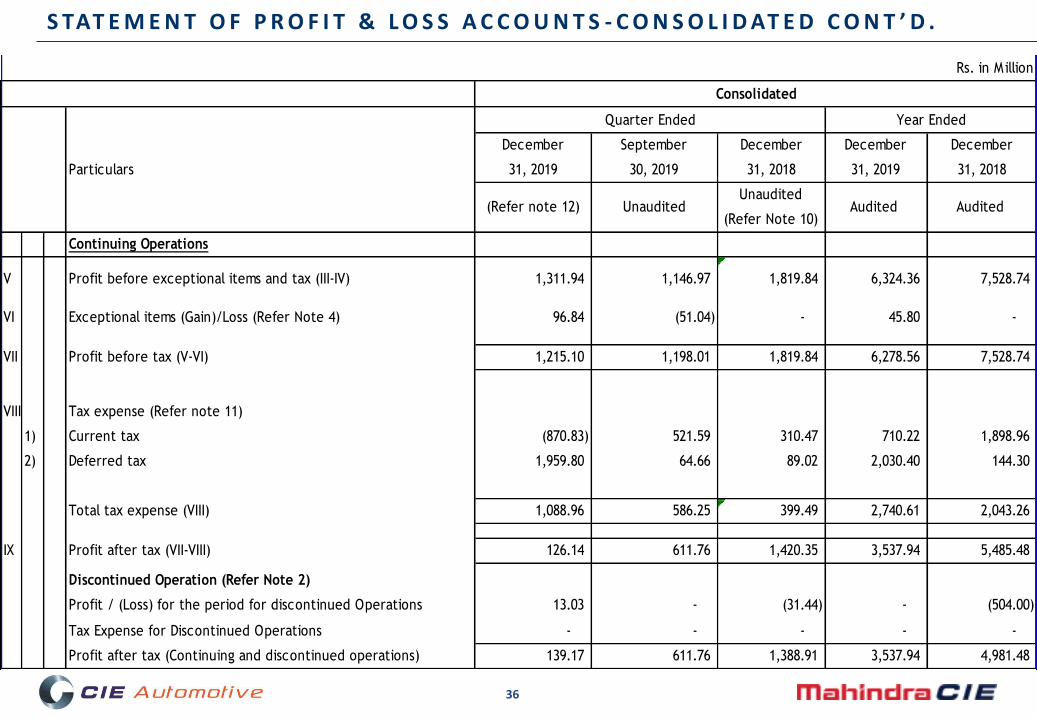
S TAT E M E N T O F P R O F I T & L O S S A C C O U N T S - C O N S O L I D AT E D C O N T ’ D .STATEMENT OF STANDALONE AND CONSOLIDATED RESULTS FOR THE QUARTER AND AUDITED RESULTS FOR YEAR ENDED DECEMBER 31, 2019.
Rs. in Million
Particulars
December
31, 2019
September
30, 2019
December
31, 2018
December
31, 2019
December
31, 2018
(Refer note 12) UnauditedUnaudited
(Refer Note 10)Audited Audited
Continuing Operations
V Profit before exceptional items and tax (III-IV) 1,311.94 1,146.97 1,819.84 6,324.36 7,528.74
VI Exceptional items (Gain)/Loss (Refer Note 4) 96.84 (51.04) - 45.80 -
VII Profit before tax (V-VI) 1,215.10 1,198.01 1,819.84 6,278.56 7,528.74
VIII Tax expense (Refer note 11)
1) Current tax (870.83) 521.59 310.47 710.22 1,898.96
2) Deferred tax 1,959.80 64.66 89.02 2,030.40 144.30
Total tax expense (VIII) 1,088.96 586.25 399.49 2,740.61 2,043.26
IX Profit after tax (VII-VIII) 126.14 611.76 1,420.35 3,537.94 5,485.48
Discontinued Operation (Refer Note 2)
Profit / (Loss) for the period for discontinued Operations 13.03 - (31.44) - (504.00)
Tax Expense for Discontinued Operations - - - - -
Profit after tax (Continuing and discontinued operations) 139.17 611.76 1,388.91 3,537.94 4,981.48
Quarter Ended Year Ended
Consolidated

37
STATEMENT OF STANDALONE AND CONSOLIDATED RESULTS FOR THE QUARTER AND AUDITED RESULTS FOR YEAR ENDED DECEMBER 31, 2019.
Rs. in Million
Particulars
December
31, 2019
September
30, 2019
December
31, 2018
December
31, 2019
December
31, 2018
(Refer note 12) UnauditedUnaudited
(Refer Note 10)Audited Audited
X Other Comprehensive income
A i) Items that will not be reclassified to profit or loss (221.00) - (53.00) (221.00) (53.00)
ii) Income tax relating to items that will not be reclassified to profit
or loss
12.00 - 17.00 12.00 17.00
B i) Items that will be reclassified to profit or loss 89.00 (140.00) (852.20) 89.00 737.00
Total Other Comprehensive Income (120.00) (140.00) (888.20) (120.00) 701.00
XI Total comprehensive income for the period (IX+X) 19.17 471.76 500.71 3,417.94 5,682.48
Earnings per equity share face value INR 10 each
1) Basic EPS
Continuing Operation 0.33 1.61 3.75 9.34 14.49
Discontinued Operation 0.03 - (0.08) - (1.33)
2) Diluted
Continuing Operation 0.33 1.61 3.75 9.33 14.48
Discontinued Operation 0.03 - (0.08) - (1.33)
Quarter Ended Year Ended
Consolidated
S TAT E M E N T O F P R O F I T & L O S S A C C O U N T S - C O N S O L I D AT E D C O N T ’ D . .
38
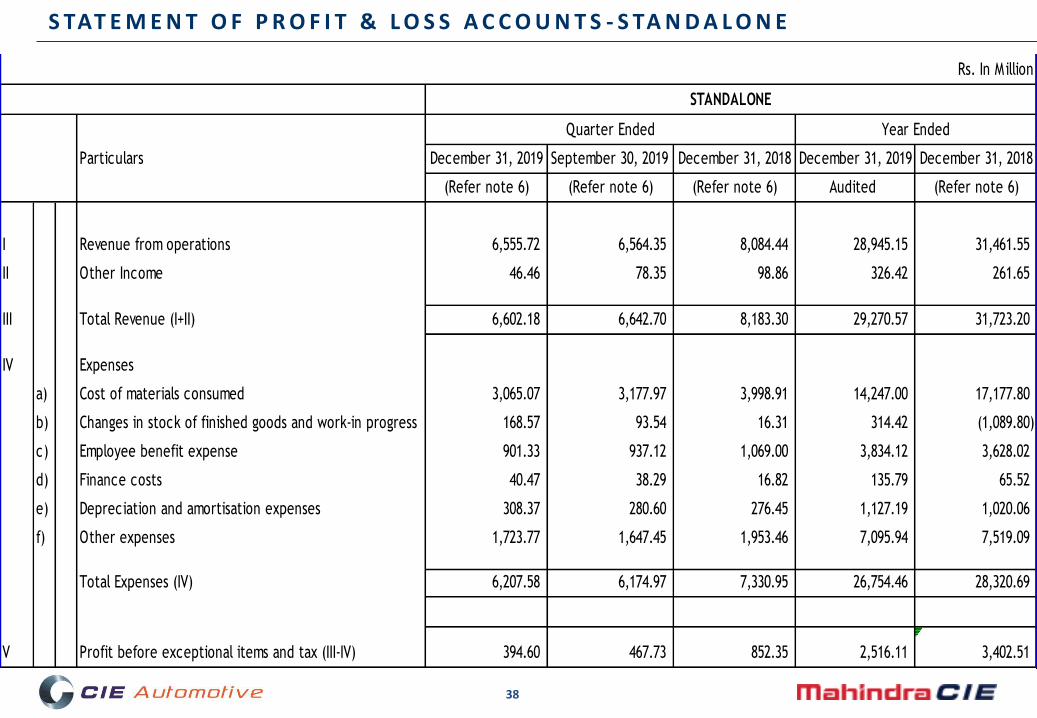
S TAT E M E N T O F P R O F I T & L O S S A C C O U N T S - S TA N D A L O N ESTATEMENT OF STANDALONE AND CONSOLIDATED RESULTS FOR THE QUARTER AND AUDITED RESULTS FOR YEAR ENDED DECEMBER 31, 2019.
Rs. In Million
Particulars December 31, 2019 September 30, 2019 December 31, 2018 December 31, 2019 December 31, 2018
(Refer note 6) (Refer note 6) (Refer note 6) Audited (Refer note 6)
I Revenue from operations 6,555.72 6,564.35 8,084.44 28,945.15 31,461.55
II Other Income 46.46 78.35 98.86 326.42 261.65
III Total Revenue (I+II) 6,602.18 6,642.70 8,183.30 29,270.57 31,723.20
IV Expenses
a) Cost of materials consumed 3,065.07 3,177.97 3,998.91 14,247.00 17,177.80
b) Changes in stock of finished goods and work-in progress 168.57 93.54 16.31 314.42 (1,089.80)
c) Employee benefit expense 901.33 937.12 1,069.00 3,834.12 3,628.02
d) Finance costs 40.47 38.29 16.82 135.79 65.52
e) Depreciation and amortisation expenses 308.37 280.60 276.45 1,127.19 1,020.06
f) Other expenses 1,723.77 1,647.45 1,953.46 7,095.94 7,519.09
Total Expenses (IV) 6,207.58 6,174.97 7,330.95 26,754.46 28,320.69
V Profit before exceptional items and tax (III-IV) 394.60 467.73 852.35 2,516.11 3,402.51
Quarter Ended Year Ended
STANDALONE
39
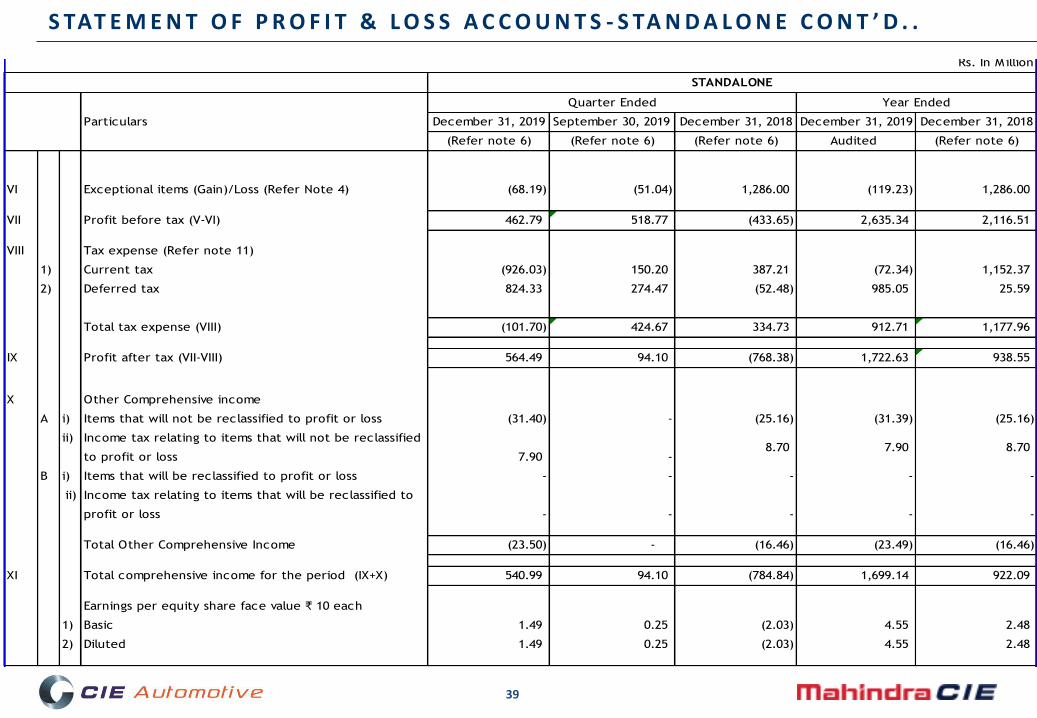
S TAT E M E N T O F P R O F I T & L O S S A C C O U N T S - S TA N D A L O N E C O N T ’ D . .STATEMENT OF STANDALONE AND CONSOLIDATED RESULTS FOR THE QUARTER AND AUDITED RESULTS FOR YEAR ENDED DECEMBER 31, 2019.
Rs. In Million
Particulars December 31, 2019 September 30, 2019 December 31, 2018 December 31, 2019 December 31, 2018
(Refer note 6) (Refer note 6) (Refer note 6) Audited (Refer note 6)
VI Exceptional items (Gain)/Loss (Refer Note 4) (68.19) (51.04) 1,286.00 (119.23) 1,286.00
VII Profit before tax (V-VI) 462.79 518.77 (433.65) 2,635.34 2,116.51
VIII Tax expense (Refer note 11)
1) Current tax (926.03) 150.20 387.21 (72.34) 1,152.37
2) Deferred tax 824.33 274.47 (52.48) 985.05 25.59
Total tax expense (VIII) (101.70) 424.67 334.73 912.71 1,177.96
IX Profit after tax (VII-VIII) 564.49 94.10 (768.38) 1,722.63 938.55
X Other Comprehensive income
A i) Items that will not be reclassified to profit or loss (31.40) - (25.16) (31.39) (25.16)
ii) Income tax relating to items that will not be reclassified
to profit or loss 7.90 -8.70 7.90 8.70
B i) Items that will be reclassified to profit or loss - - - - -
ii) Income tax relating to items that will be reclassified to
profit or loss - - - - -
Total Other Comprehensive Income (23.50) - (16.46) (23.49) (16.46)
XI Total comprehensive income for the period (IX+X) 540.99 94.10 (784.84) 1,699.14 922.09
Earnings per equity share face value ₹ 10 each
1) Basic 1.49 0.25 (2.03) 4.55 2.48
2) Diluted 1.49 0.25 (2.03) 4.55 2.48
1.49
Quarter Ended Year Ended
STANDALONE
40
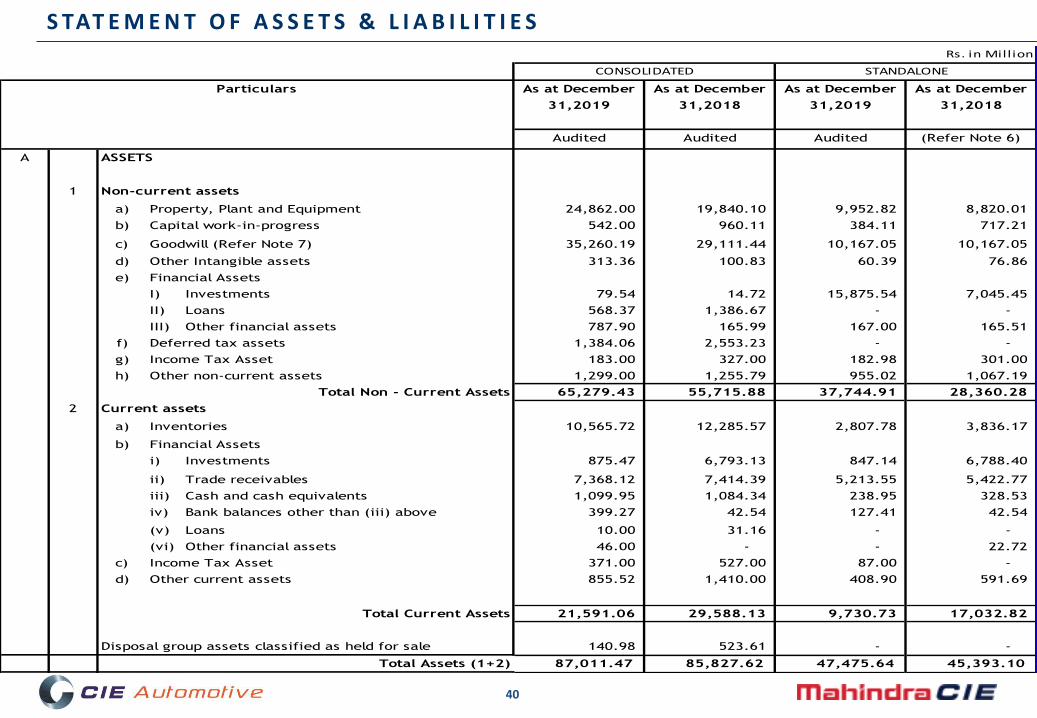
S TAT E M E N T O F A S S E T S & L I A B I L I T I E S Statement of Assets and Liabilities
As at December
31,2019
As at December
31,2018
As at December
31,2019
As at December
31,2018
Audited Audited Audited (Refer Note 6)
A
1
a) Property, Plant and Equipment 24,862.00 19,840.10 9,952.82 8,820.01
b) Capital work-in-progress 542.00 960.11 384.11 717.21
c) Goodwill (Refer Note 7) 35,260.19 29,111.44 10,167.05 10,167.05
d) Other Intangible assets 313.36 100.83 60.39 76.86
e) Financial Assets
I) Investments 79.54 14.72 15,875.54 7,045.45
II) Loans 568.37 1,386.67 - -
III) Other financial assets 787.90 165.99 167.00 165.51
f) Deferred tax assets 1,384.06 2,553.23 - -
g) Income Tax Asset 183.00 327.00 182.98 301.00
h) Other non-current assets 1,299.00 1,255.79 955.02 1,067.19
Total Non - Current Assets 65,279.43 55,715.88 37,744.91 28,360.28
2 Current assets
a) Inventories 10,565.72 12,285.57 2,807.78 3,836.17
b) Financial Assets
i) Investments 875.47 6,793.13 847.14 6,788.40
ii) Trade receivables 7,368.12 7,414.39 5,213.55 5,422.77
iii) Cash and cash equivalents 1,099.95 1,084.34 238.95 328.53
iv) Bank balances other than (iii) above 399.27 42.54 127.41 42.54
(v) Loans 10.00 31.16 - -
(vi) Other financial assets 46.00 - - 22.72
c) Income Tax Asset 371.00 527.00 87.00 -
d) Other current assets 855.52 1,410.00 408.90 591.69
Total Current Assets 21,591.06 29,588.13 9,730.73 17,032.82
Disposal group assets classified as held for sale 140.98 523.61 - -
87,011.47 85,827.62 47,475.64 45,393.10
Particulars
ASSETS
Non-current assets
Total Assets (1+2)
STANDALONECONSOLIDATED
Rs. in Mill ion

41
S TAT E M E N T O F A S S E T S & L I A B I L I T I E S C O N T ’ D . . Statement of Assets and Liabilities
As at December
31,2019
As at December
31,2018
As at December
31,2019
As at December
31,2018
Audited Audited Audited (Refer Note 6)
B
1 Equity
a) Equity Share capital 3,790.11 3,788.02 3,790.11 3,788.02
b) Other Equity
i) Share premium 15,284.90 15,233.72 15,285.34 15,233.72
ii) Other reserves 27,262.98 23,869.28 19,638.54 17,947.86
Total Equity 46,337.99 42,891.02 38,713.99 36,969.60
LIABILITIES
2 Non-current liabilities
a) Financial Liabilities
Borrowing 8,256.46 11,729.78 - -
b) Provision 3,608.05 3,490.13 867.77 1,371.60
c) Deferred tax liabilities 2,295.86 987.97 1,320.38 342.59
d) Other non-current liabilities 530.38 655.89 1.67 17.52
Total Non - Current Liabilities 14,690.75 16,863.78 2,189.82 1,731.71
3 Current liabilities
a) Financial Liabilities
i) Borrowings 6,434.74 4,403.78 971.16 863.73
ii) Trade payables 14,770.54 16,838.49 3,877.09 4,121.20
iii) Other financial liabilities (other than those
specified in (b) below)
656.49 459.07 86.92 152.05
b) Provisions 562.33 448.99 219.29 154.56
c) Current Tax Liabilities 441.30 1,205.90 - 526.01
d) Other current liabilities 2,977.86 2,194.93 1,417.38 874.24
Total Current Liabilities 25,843.26 25,551.16 6,571.84 6,691.79
Disposal group Liabilities classified as held for sale 139.47 521.62 - -
Total Equity and Liabilities (1+2+3) 87,011.47 85,827.62 47,475.64 45,393.10
0.01 (0.01) 0.00 0.00
EQUITY AND LIABILITIES
Particulars
STANDALONECONSOLIDATED
Rs. in Mill ion

42
C A S H F L O W - C O N S O L I D AT E D
Rs. in Million
I Profit before tax for the year 6,278.56 7,024.74
Adjustments for:
Finance costs 525.12 525.03
Net gain on investments held at FVTPL (183.13) (47.45)
Other non-cash income (57.24) (55.06)
Provision for doubtful debts (68.17) (13.08)
Provision for obsolescence of inventory 144.22 (22.03)
Loss/ (Gain) on disposal of property, plant and equipment 22.13 (32.01)
Depreciation and amortisation 3,168.04 2,898.15
Impairment of non-current assets 49.03 -
Expenses recognized in respect of ESOP's 2.01 14.08
9,880.57 10,292.37
Change in Operating assets and liabilities:
(Increase)/decrease in trade and receivables 3,398.08 (1,616.10)
(Increase)/decrease in inventories 2,489.30 (2,752.08)
(Decrease)/increase in other assets and liabilities (4,333.23) 2,599.04
1,554.15 (1,769.02)
Income taxes paid (1,161.04) (1,444.12)
Net cash generated by operating activities 10,273.68 7,079.23
ParticularsYear ended 31st
December,2019
Year ended 31st
December,2018
43
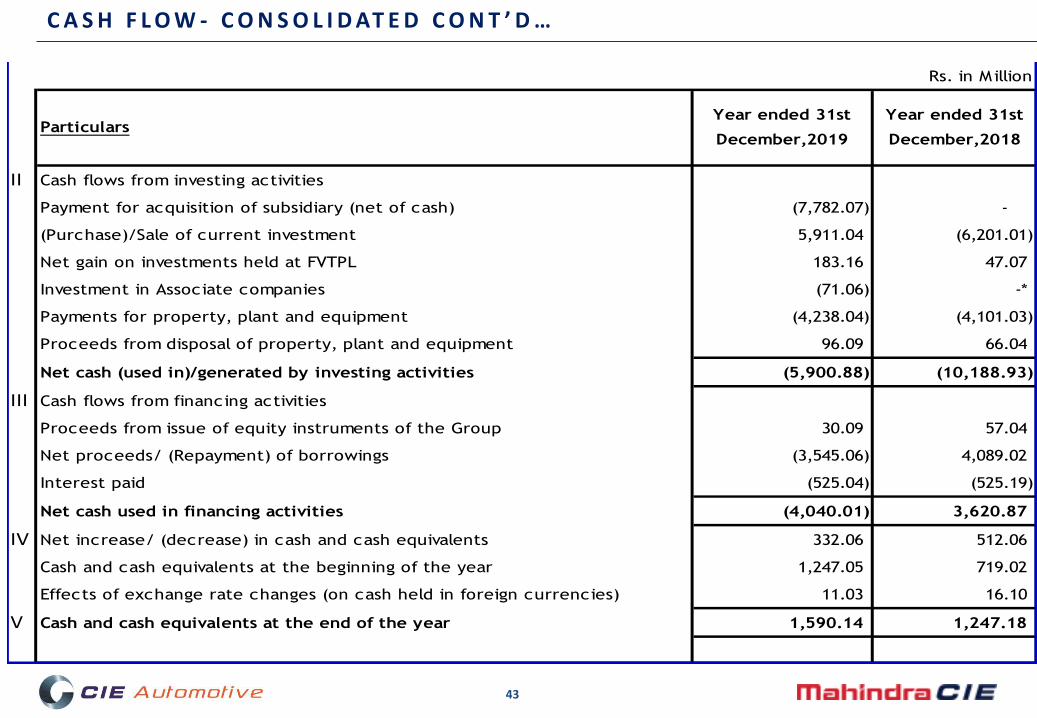
C A S H F L O W - C O N S O L I D AT E D C O N T ’ D …
Rs. in Million
II Cash flows from investing activities
Payment for acquisition of subsidiary (net of cash) (7,782.07) -
(Purchase)/Sale of current investment 5,911.04 (6,201.01)
Net gain on investments held at FVTPL 183.16 47.07
Investment in Associate companies (71.06) -*
Payments for property, plant and equipment (4,238.04) (4,101.03)
Proceeds from disposal of property, plant and equipment 96.09 66.04
Net cash (used in)/generated by investing activities (5,900.88) (10,188.93)
III Cash flows from financing activities
Proceeds from issue of equity instruments of the Group 30.09 57.04
Net proceeds/ (Repayment) of borrowings (3,545.06) 4,089.02
Interest paid (525.04) (525.19)
Net cash used in financing activities (4,040.01) 3,620.87
IV Net increase/ (decrease) in cash and cash equivalents 332.06 512.06
Cash and cash equivalents at the beginning of the year 1,247.05 719.02
Effects of exchange rate changes (on cash held in foreign currencies) 11.03 16.10
V Cash and cash equivalents at the end of the year 1,590.14 1,247.18
ParticularsYear ended 31st
December,2019
Year ended 31st
December,2018

44
C A S H F L O W - S TA N D A L O N EStatement of cash flows Standalone
Rs. in Million
Year ended Year ended
31st December, 2019 31
st December, 2018
I Cash flows from operating activities
Profit before tax for the year 2,636.13 2,117.54
Adjustments for:
Finance costs recognised in profit or loss 136.18 66.12
Interest income recognised in profit or loss (119.08) (122.58)
Net Gain on sale of investment and change in fair value of investments held at FVTPL (16.04) (47.03)
Allowances for trade receivables (30.17) 4.02
Net Gain on disposal of Property, Plant and Equipment (3.04) (8.06)
Depreciation and amortisation of non-current assets 1,127.16 1,020.00
Provision for slow moving 8.04 (8.03)
Loss on sale of subsidiary (Refer Note 33) - 125.07
Impairment of non-current assets (Refer Note 33) 49.34 1,161.11
Net Foreign exchange (gain)/loss (30.39) 6.02
Employee Share based payment expenses 2.03 14.01
3,760.16 4,328.19
Change in operating assets and liabilities:
Increase in trade and other receivables 268.16 (584.35)
(Increase)/decrease in inventories 1,020.15 (882.23)
(Increase)/decrease in other assets 119.09 55.43
Increase/(decrease) trade and other payables (244.18) (334.74)
Increase/(decrease) in provisions (440.14) 231.75
Increase/(decrease) in other liabilities (94.02) 31.17
629.06 (1,482.97)
Income taxes paid (420.00) (696.05)
Net cash inflow from operating activities 3,969.22 2,149.17
Particulars

45
C A S H F L O W - S TA N D A L O N E C O N T ’ D …
Rs. in Million
Year ended Year ended
31st December, 2019 31
st December, 2018
II Cash flows from investing activities
Purchase of Property, Plant and Equipment (1,871.15) (1,667.64)
(Purchase)/Sale of current investments 5,955.56 (6,233.09)
Proceeds from sale of Property, Plant and Equipment 27.09 25.02
Proceeds from Sale of subsidiary - 6,849.19
Investment in Subsidiary company (8,137.43) (1,161.08)
Investment in Associate company (69.27) -*
Interest received 119.02 122.34
Net cash outflow from investing activities (3,976.18) (2,065.26)
III Cash flows from financing activities
Proceeds from issue of equity instruments of the Company 30.25 57.23
Net Proceeds/(Repayment) of borrowings 107.16 55.61
Interest paid (136.39) (66.65)
Net cash inflow/ (outflow) from financing activities 1.00 46.19
IV Net increase/(decrease) in cash and cash equivalents (6.09) 130.01
Cash and cash equivalents at the beginning of the year 372.46 233.04
Effects of exchange rate changes on cash and cash equivalents -* -*
Pursuant to amalgamation of BFPL (Refer Note 39) - 8.02
V Cash and cash equivalents at the end of the year 366.37 371.07
Particulars
46
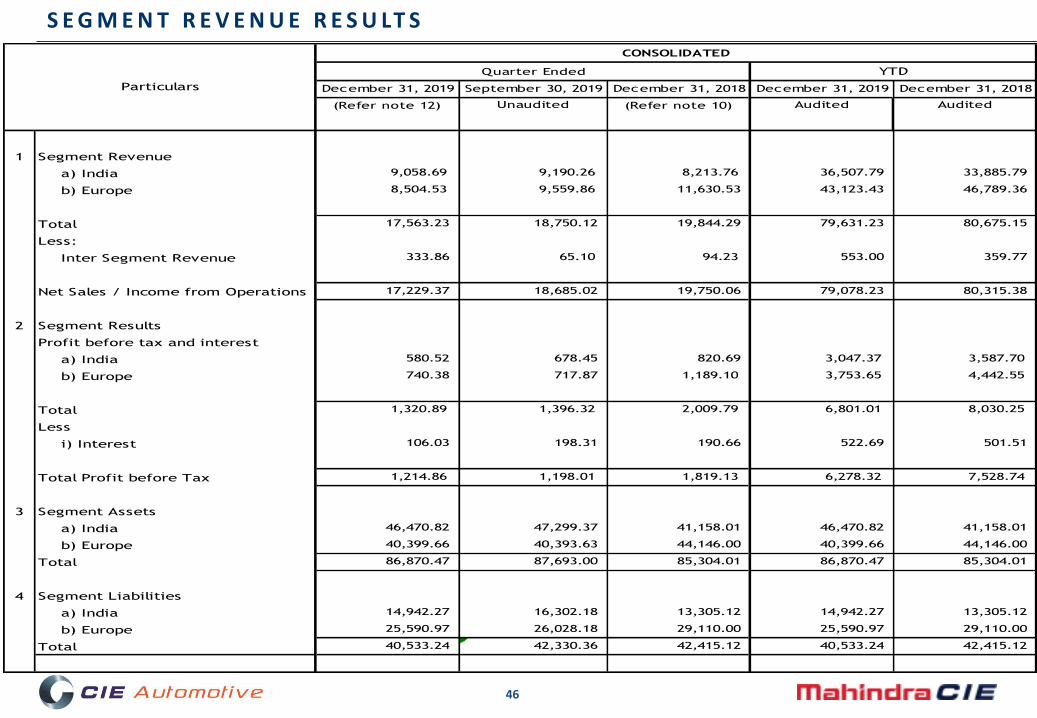
S E G M E N T R E V E N U E R E S U LT S
December 31, 2019 September 30, 2019 December 31, 2018 December 31, 2019 December 31, 2018
(Refer note 12) Unaudited (Refer note 10) Audited Audited
1 Segment Revenue
a) India 9,058.69 9,190.26 8,213.76 36,507.79 33,885.79
b) Europe 8,504.53 9,559.86 11,630.53 43,123.43 46,789.36
Total 17,563.23 18,750.12 19,844.29 79,631.23 80,675.15
Less:
Inter Segment Revenue 333.86 65.10 94.23 553.00 359.77
Net Sales / Income from Operations 17,229.37 18,685.02 19,750.06 79,078.23 80,315.38
2 Segment Results
Profit before tax and interest
a) India 580.52 678.45 820.69 3,047.37 3,587.70
b) Europe 740.38 717.87 1,189.10 3,753.65 4,442.55
Total 1,320.89 1,396.32 2,009.79 6,801.01 8,030.25
Less
i) Interest 106.03 198.31 190.66 522.69 501.51
Total Profit before Tax 1,214.86 1,198.01 1,819.13 6,278.32 7,528.74
3 Segment Assets
a) India 46,470.82 47,299.37 41,158.01 46,470.82 41,158.01
b) Europe 40,399.66 40,393.63 44,146.00 40,399.66 44,146.00
Total 86,870.47 87,693.00 85,304.01 86,870.47 85,304.01
4 Segment Liabilities
a) India 14,942.27 16,302.18 13,305.12 14,942.27 13,305.12
b) Europe 25,590.97 26,028.18 29,110.00 25,590.97 29,110.00
Total 40,533.24 42,330.36 42,415.12 40,533.24 42,415.12
Quarter Ended YTD
CONSOLIDATED
Particulars
47
N O T E SSTATEMENT OF STANDALONE AND CONSOLIDATED RESULTS FOR THE QUARTER AND AUDITED RESULTS FOR YEAR ENDED DECEMBER 31, 2019.
Notes:
1
2
3
4
S.no. Particulars December 31, 2019 September 30, 2019 December 31, 2018 December 31, 2019 December 31, 2018
a) Excess provision reversed due to settlement of a legal case pertaining to Bill
Forge Private Limited (BFPL)
- (473) - (473) -
c) Based on the managements assessment, provision has been recognised for
Provident Fund liability basis Supreme Court judgement in ‘Regional provident
fund commissioner (II) West Bengal vs Vivekananda Vidyamandir and Others'.
- 145 - 145 -
d) Provision against levy of cross subsidy charges and additional surcharge by
Maharashtra State Electricity Distribution Company Limited on account of power
consumption from non-captive generating plant.
- 100 - 100 -
e) Provision for Voluntary Retirement Scheme in Bill Forge Division. (68) 128 - 60 -
f) Provision for impairment on additional investment in Stokes Group Limited,
wholly owned subsidiary of Company to facilitate closure of business. Company
does not anticipate any amount to be recovered from this investment. Hence, the
Company has recognised full impairment loss on the said investment.
- - 1,161 - 1,161
g) Loss on sale of investment in Mahindra Forgings Europe AG (MFE), one of the
wholly owned subsidiaries of the Company, to CIE Galfor S.A. (Galfor), another
wholly owned subsidiary of the Company.
- - 125 - 125
Total-Standalone Financial Result (68) (51) 1,286 (119) 1,286
h) Provision for additional benefits offered / redundancy in GSA (subsidiary of
MFE) to employees
165 - - 165 -
Total- Consolidated Financial Result 97 (51) - 46 -
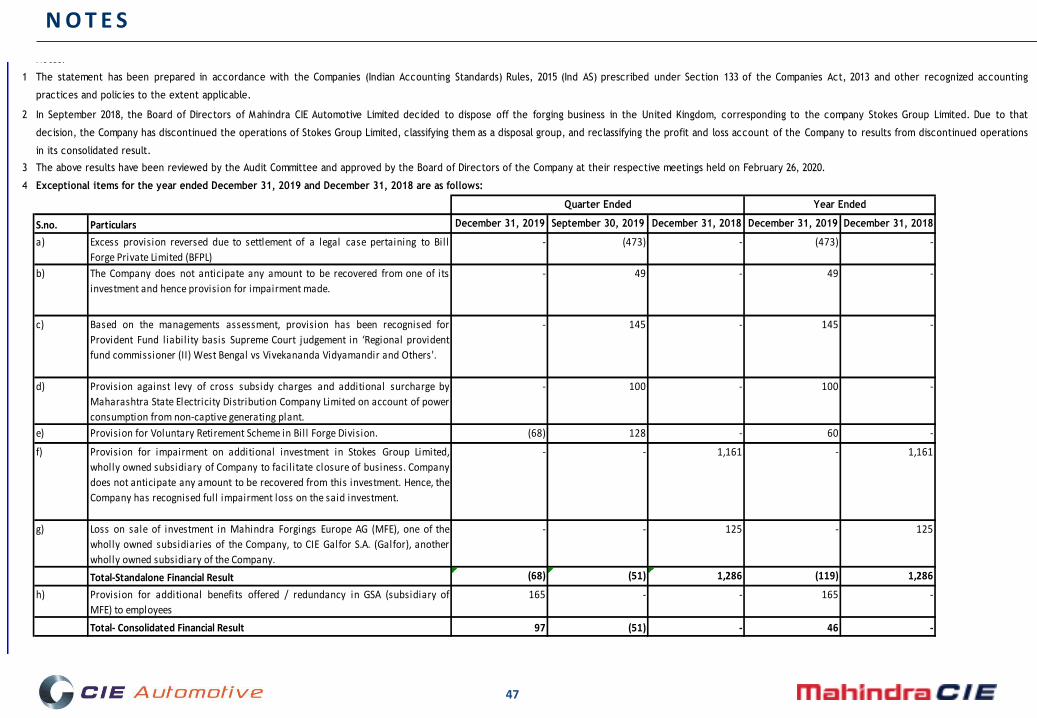
The statement has been prepared in accordance with the Companies (Indian Accounting Standards) Rules, 2015 (Ind AS) prescribed under Section 133 of the Companies Act, 2013 and other recognized accounting
practices and policies to the extent applicable.
In September 2018, the Board of Directors of Mahindra CIE Automotive Limited decided to dispose off the forging business in the United Kingdom, corresponding to the company Stokes Group Limited. Due to that
decision, the Company has discontinued the operations of Stokes Group Limited, classifying them as a disposal group, and reclassifying the profit and loss account of the Company to results from discontinued operations
in its consolidated result.
The above results have been reviewed by the Audit Committee and approved by the Board of Directors of the Company at their respective meetings held on February 26, 2020.
Quarter Ended Year Ended
49 -
Exceptional items for the year ended December 31, 2019 and December 31, 2018 are as follows:
b) The Company does not anticipate any amount to be recovered from one of its
investment and hence provision for impairment made.
- 49 -
48
N O T E S C O N T ’ D …
5
6
7
8
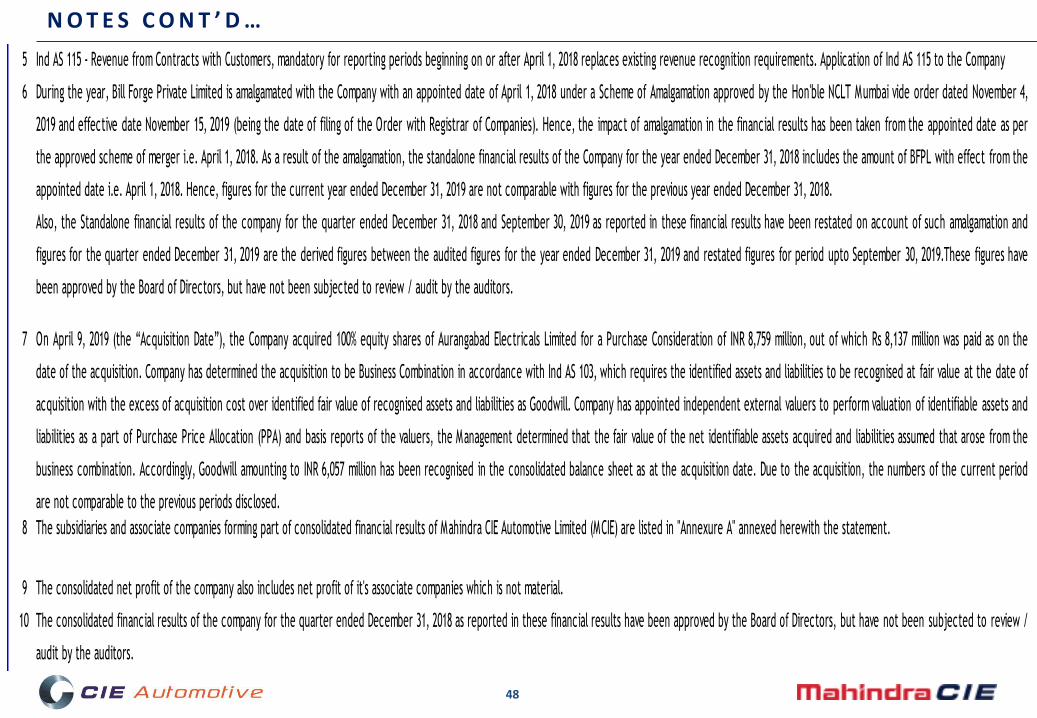
9 The consolidated net profit of the company also includes net profit of it's associate companies which is not material.
10
Ind AS 115 - Revenue from Contracts with Customers, mandatory for reporting periods beginning on or after April 1, 2018 replaces existing revenue recognition requirements. Application of Ind AS 115 to the Company
The subsidiaries and associate companies forming part of consolidated financial results of Mahindra CIE Automotive Limited (MCIE) are listed in "Annexure A" annexed herewith the statement.
The consolidated financial results of the company for the quarter ended December 31, 2018 as reported in these financial results have been approved by the Board of Directors, but have not been subjected to review /
audit by the auditors.
During the year, Bill Forge Private Limited is amalgamated with the Company with an appointed date of April 1, 2018 under a Scheme of Amalgamation approved by the Hon'ble NCLT Mumbai vide order dated November 4,
2019 and effective date November 15, 2019 (being the date of filing of the Order with Registrar of Companies). Hence, the impact of amalgamation in the financial results has been taken from the appointed date as per
the approved scheme of merger i.e. April 1, 2018. As a result of the amalgamation, the standalone financial results of the Company for the year ended December 31, 2018 includes the amount of BFPL with effect from the
appointed date i.e. April 1, 2018. Hence, figures for the current year ended December 31, 2019 are not comparable with figures for the previous year ended December 31, 2018.
Also, the Standalone financial results of the company for the quarter ended December 31, 2018 and September 30, 2019 as reported in these financial results have been restated on account of such amalgamation and
figures for the quarter ended December 31, 2019 are the derived figures between the audited figures for the year ended December 31, 2019 and restated figures for period upto September 30, 2019.These figures have
been approved by the Board of Directors, but have not been subjected to review / audit by the auditors.
On April 9, 2019 (the “Acquisition Date”), the Company acquired 100% equity shares of Aurangabad Electricals Limited for a Purchase Consideration of INR 8,759 million, out of which Rs 8,137 million was paid as on the
date of the acquisition. Company has determined the acquisition to be Business Combination in accordance with Ind AS 103, which requires the identified assets and liabilities to be recognised at fair value at the date of
acquisition with the excess of acquisition cost over identified fair value of recognised assets and liabilities as Goodwill. Company has appointed independent external valuers to perform valuation of identifiable assets and
liabilities as a part of Purchase Price Allocation (PPA) and basis reports of the valuers, the Management determined that the fair value of the net identifiable assets acquired and liabilities assumed that arose from the
business combination. Accordingly, Goodwill amounting to INR 6,057 million has been recognised in the consolidated balance sheet as at the acquisition date. Due to the acquisition, the numbers of the current period
are not comparable to the previous periods disclosed.

49
N O T E S C O N T ’ D …
11
12
13
For and on behalf of the Board of Directors,
Date : February 26, 2020
Place :Mumbai Executive Director
Previous period figures have been regrouped/reclassified, wherever necessary to conform to the current period classification.
The Consolidated results for the quarter ended December 31, 2019 are the derived figures between the audited figures for the year ended December 31, 2019 and published reviewed figures of September 30, 2019.
a) The Company elected to exercise the option under section 115BAA of the Income Tax Act, 1961 w.e.f April 1, 2019 for the reduced rates. As a result, the Company has remeasured it's net Deferred Tax Liability.
Further, on account of merger mentioned in note 6 above, the current tax has been remeasured with effect from April 1, 2018.
b) For the year ended / Quarter ended December 31, 2019:
i) based on the management’s future business expectation, the Deferred Tax Assets relating to carryforward of Non-Operating Losses of MFE Group has been written off amounting to INR 892 million in the consolidated
results.
50
N O T E S C O N T ’ D …
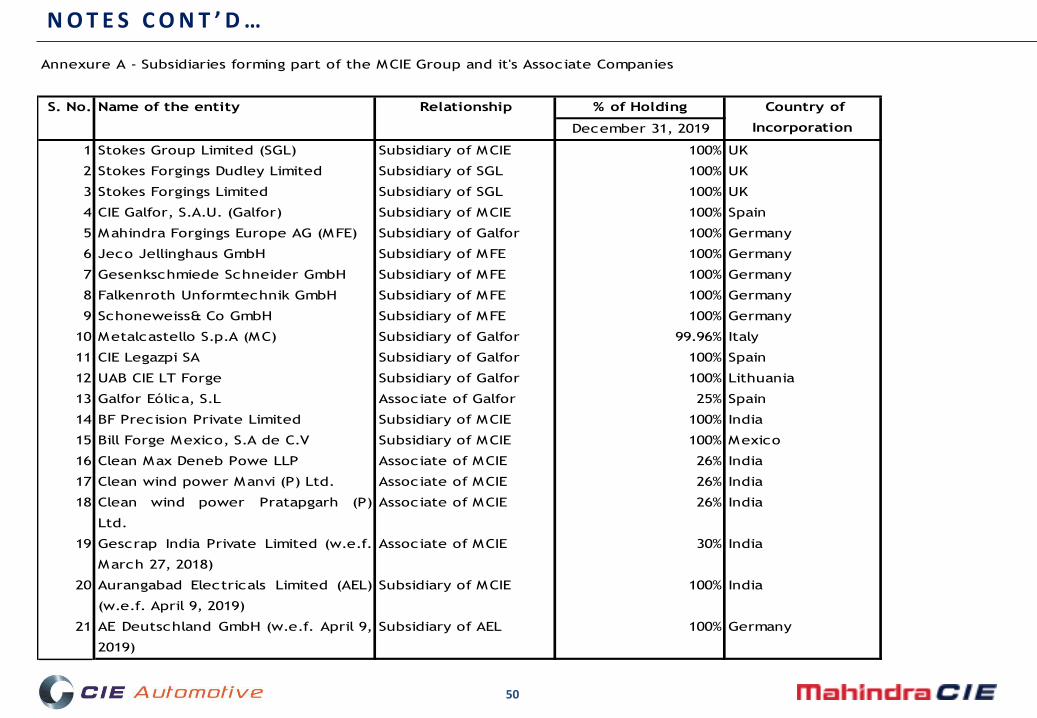
Annexure A - Subsidiaries forming part of the MCIE Group and it's Associate Companies
% of Holding
December 31, 2019
1 Stokes Group Limited (SGL) Subsidiary of MCIE 100% UK
2 Stokes Forgings Dudley Limited Subsidiary of SGL 100% UK
3 Stokes Forgings Limited Subsidiary of SGL 100% UK
4 CIE Galfor, S.A.U. (Galfor) Subsidiary of MCIE 100% Spain
5 Mahindra Forgings Europe AG (MFE) Subsidiary of Galfor 100% Germany
6 Jeco Jellinghaus GmbH Subsidiary of MFE 100% Germany
7 Gesenkschmiede Schneider GmbH Subsidiary of MFE 100% Germany
8 Falkenroth Unformtechnik GmbH Subsidiary of MFE 100% Germany
9 Schoneweiss& Co GmbH Subsidiary of MFE 100% Germany
10 Metalcastello S.p.A (MC) Subsidiary of Galfor 99.96% Italy
11 CIE Legazpi SA Subsidiary of Galfor 100% Spain
12 UAB CIE LT Forge Subsidiary of Galfor 100% Lithuania
13 Galfor Eólica, S.L Associate of Galfor 25% Spain
14 BF Precision Private Limited Subsidiary of MCIE 100% India
15 Bill Forge Mexico, S.A de C.V Subsidiary of MCIE 100% Mexico
16 Clean Max Deneb Powe LLP Associate of MCIE 26% India
17 Clean wind power Manvi (P) Ltd. Associate of MCIE 26% India
18 Clean wind power Pratapgarh (P)
Ltd.
Associate of MCIE 26% India
19 Gescrap India Private Limited (w.e.f.
March 27, 2018)
Associate of MCIE 30% India
20 Aurangabad Electricals Limited (AEL)
(w.e.f. April 9, 2019)
Subsidiary of MCIE 100% India
21 AE Deutschland GmbH (w.e.f. April 9,
2019)
Subsidiary of AEL 100% Germany
S. No. Name of the entity Relationship Country of
Incorporation

51