mahindra pragati bluechip yojana · schemes of mahindra mutual fund may or may not have any present...
TRANSCRIPT

1
MAHINDRA PRAGATI BLUECHIP YOJANA
PRAGATI KE LIYE BLUECHIP TOH BANTA HAI
INDIA’s BIG 100
STABILITY
ECONOMYGAUGE
EMERGING TRENDS

2
• Market Scope
• Large Cap Advantage
• Product Introduction
• Investment Style
• Scheme Details for Investment
WHAT’S INSIDE

3
MARKET SCOPEContributes 70% of Total Market Cap
Invests in Top 1st -100th companies by Average Full Market Cap1: TCS (M-CAP: Rs 754972.12 Cr )
100: SAIL (M-CAP: Rs 28332.73 Cr)
Contributes 16% of Total Market CapInvests in 101st – 250th companies by Average Full Market Cap
101: TORRENT PHARMA (M-CAP: Rs 27943.86 Cr)250: RELIANCE POWER (M-CAP: Rs 8589.84 Cr)
Contributes 14% of Total Market CapInvests in 251st company onwards by Average Full Market Cap
251: V-GUARD IND (M-CAP: Rs 8518.70 Cr)4895: CITIZEN YARNS (M-CAP: Rs 0.02 Cr)
MCap positions as of December 31, 2018 | Source AMFI
The data provided above is for illustrative purpose only. The companies/stocks referred above should not be construed as recommendations from Mahindra Asset Management Company Private Limited / Mahindra Mutual Fund. Schemes of Mahindra Mutual Fund may or may not have any present or future positions in these companies/stocks. Mahindra Asset Management Company Private Limited/Mahindra Mutual Fund is not guaranteeing or forecasting any returns.

4
THE LARGE CAP ADVANTAGE
The Big 100

5
LEADERS
• Established businesses, large scale of operations and diversified distribution
• Scalable business models
ECONOMY GAUGE
• Is a good measure of economic health and impact of policy reforms
QUALITY INVESTMENT
• Well-researched companies with good corporate governance
• High liquidity high volume stocks, diversified shareholding
STRONG FUNDAMENTALS
• Capital efficient with robust balance-sheets
• Better access to capital• Resilient earnings growth
LARGE
CAP
ADVANTAGE

6
4 REASONS
WHY YOU NEED LARGE CAPS
Consistent Participation in Economic
Growth
Reasonably valued with relatively lower volatility
Stable growth potential in
long term
Represents Major Sectors
and Trends

7
BE WHERE THE ACTION IS
57.6 56.4 53.761.1
54.550.4
54.3
0
10
20
30
40
50
60
70
FY05 FY08 FY11 FY14 FY17 FY18 Jan-19
NIFTY 50 MARKET CAP TO OVERALL MARKET CAP %
1. India’s GDP has shown a strong growth2. India’s Market Cap to GDP is lower than that of developed markets 3. India’s Large Cap Market Cap to GDP has shown a positive trend4. Large Caps have historically represented more than half the market
INDIA’S GDP GROWTH MARKET CAP TO GDP RATIO
Data as on Dec 31, 2018 | Data Period: 1984 - 2018
Data as on Dec 31, 2018
Data as on Dec 31, 2018
Data period: Mar 31 2005 to Jan 15, 2019 | FY -Financial year end
1
INDIA
74.6
JAPAN
129.9
USA
152.9
UK
145.0
A
2 3
4
Data Source: Bloomberg
GD
P in
USD
Bln
2 trillion
1 trillion
0.5 trillionLiberalization
37%
64% 63%
38%
47% 45%53%
49% 48%
59%
0%
10%
20%
30%
40%
50%
60%
70%
CY 08 CY 09 CY 10 CY 11 CY 12 CY 13 CY 14 CY 15 CY 16 CY 17
LARGE CAP MARKET CAPITALIZATION TO GDP

8
STAY ON TRACK WITH EMERGING TRENDS
• Nifty 50 is made of the best performers in terms of earnings and volumes
• Best performers push out others to occupy place in the Big 100
• Identifying these trends early from macro economic indicators can help generate alpha
• There should be enough agility to take required exposures for making the most of such emerging trend
Source: Bloomberg, NSE | Data as of Dec 31st, 2018
B
Capex-linked: Industrials, Utilities, Materials, Telecom, EnergyFinancial Services: Banks and Financial ServicesExport-oriented: IT, PharmaceuticalsConsumption-linked: Consumer Staples, Consumer Discretionary
The above is as per internal thematic classification of index sectors
*Internal thematic classification of Index as per MSCI sectors
31
69
37 25 27
13
11
26
30 37
25
12
18 24
16
31
8 19 21 20
2 0 0 3 2 0 0 8 2 0 1 2 2 0 1 6 2 0 1 8
NIFTY COMPOSITION* BY SECTOR (%)

9
LOOK FOR STABILITY FROM MOST OF YOUR PORTFOLIO
Source: Bloomberg, NSE | Data as of Dec 31st, 2018
• Large Caps have shown lesser volatility in different market cycles
• Large Cap valuations have also remained relatively reasonable over these market cycles, making it an all season choice
Standard Deviation
Index 1
year 3
years5 years
Nifty 50 25.3 8.0 5.1
Nifty Midcap 100 34.1 10.8 5.1
Nifty Smallcap250
39.7 13.5 7.8
STANDARD DEVIATION – A MEASURE OF VOLITILITY
C
16.8
22.1
17.6
20.5 20.2
16.8
14.4
-
5.0
10.0
15.0
20.0
25.0
FY15 FY16 FY17 FY18 FY19E FY20E FY21E
Source: Kotak Securities, Bloomberg | Data as of Jan 31, 2019Note: For FY20E & FY21E PE Index value has been taken as on Jan 31, 2019
NIFTY 50 VALUATION - 1 YEAR FORWARD PE

10
BUILD WEALTH IN LONG TERM
D
Source: ICRA| Data as on: Jan 31 2019
The data provided above is for illustrative purpose only and should not be construed as a promise on minimum returns and safeguard of capital. Mahindra Asset Management Company Private Limited/Mahindra Mutual Fund is not guaranteeing or forecasting any returns. Past performance may or may not be sustained in future.
Return Analysis of Monthly SIP
Period of SIP NIFTY 50 TRI (CAGR) NIFTY NEXT 50 TRI (CAGR) NIFTY 100 TRI (CAGR)
3 Year 12.20% 6.59% 11.40%
5 Year 11.02% 11.16% 11.09%
Risk –Return Analysis of Average Monthly Rolling Returns on Lumpsums
NIFTY 50 TRI NIFTY NEXT 50 TRI NIFTY 100 TRI
LumpsumPeriod
CAGRStandard Deviation
CAGRStandard Deviation
CAGRStandard Deviation
3 Year 11.27% 2.60% 19.64% 4.98% 12.58% 2.71%
5 Year 12.81% 4.29% 19.99% 6.25% 13.94% 4.39%
CAGR: Compounded Annual Growth Rate | TRI – Total Return Index

11
LARGE CAPS MAKE FOR MORE THAN HALF THE
MARKET ACROSS SEASONS.
THAT IS THE EMPHASIS IT DESERVES IN YOUR
PORTFOLIO TOO.
70%
16%
14%
Market Cap Weightages
Large Cap
Mid Cap
Small Cap
Mcap positions as of December 31, 2018 | Source AMFI

12
MAHINDRA PRAGATI BLUECHIP YOJANALarge Cap Fund - An open ended equity scheme predominantly investing in large cap stocks
NFO Opens: February 22, 2019 NFO Closes: March 8, 2019Scheme reopens for continuous sale and repurchase from: within 5 business days from the date of allotment

13

14
REASONS TO INVEST IN MAHINDRA PRAGATI BLUECHIP YOJANA
Agile quality portfolio from India’s
Big 100
Exposure to the more stable half of the
market
High conviction bottom up stock picking with a
focus on alpha generation

15
INVESTMENT STYLE

16
• High conviction*concentrated portfolio with a focus to generate alpha
• Blended style of growth and value stocks
• Top down approach to identify sectors with potential across different periods based on emerging macro trends
• Bottom up stock selection, that have good governance and strong leadership
• Agile portfolio management
• Tactical calls for short to medium investment horizons
INVESTMENT STYLE
*Conviction will be based on internal evaluation and price performance position keeping investor interest in mind

17
FOCUSED APPROACH TOWARDS IDENTIFYING EARLY STRUCTURAL TRENDS
Source: Haitong Securities research, Bloomberg | Data as on Mar 2017
• Fund would be focused on identifying structural trends which may play out over medium to long term. These could include, but not limited to -
• Increase in penetration in certain segments as per capita income of the country increases
• Large market share shifts either from unorganized to organized sectors or between segments of players in the market place
• Major economic transitions in the country such as infrastructure creation, policy reforms, socio economic transitions
• Technological disruptions/enablers which could alter the construct of businesses in the country
• By doing the above, the fund would aim to capture the changes in the index constituents over a period in time even before the same plays out
• A case study provided in the adjacent infographics demonstrates the large gap between India and China in consumer durables penetration which could be bridged as per capita income improves
Per Capita Income of India vs China
Low penetration in consumer durables segment
4xINDIA
$1,752
CHINA
$8,830
5
15
21
100
96
94
- 20 40 60 80 100
Air-conditioners
Washing machines
Refrigerators
China India
CASE STUDY 1: CONSUMPTION SECTOR

18
CAPTURING STRUCTURAL TRENDS CREATES MEANINGFUL ALPHA
Source: RBI, Bloomberg | * Nifty Bank index considered as proxy for private bank returns as PSU representation is fairly lowData as on Dec 30, 2018as on 30 December, 2018
Case Study 2: PSU Banks vs Private Banks
• The extent of market share shift and asset quality difference between PSU banks and private banks would have been difficult to envisage 3 to 5 years back
• But investors who bet on the same would have benefitted significantly over the same period as demonstrated by the returns for these indices
Market share shift from PSU banks to private sector banks
Return difference between PSU Banks and private banks*
Sharp rise in NPA ratio for PSU Banks
-
5.0
10.0
15.0
20.0
25.0
3YR CAGR 5YR CAGRPSU Bank Index Bank IndexNIFTY PSU Bank Index
Market-share FY13 FY15 FY18 5 YR change
PSU Banks 76.1 74.2 65.1 (10.93%)
Private Banks 19.4 21.4 30.4 11%
Foreign Banks 4.5 4.4 4.1 (0.4%)
Small Finance Banks - - 0.4 0.4%
3.7 4.7
13.6
-
5.0
10.0
15.0
FY13 FY15 FY18
NIFTY Bank Index
The data provided above is for illustrative purpose only. Mahindra Asset Management Company Private Limited/Mahindra Mutual Fund is not guaranteeing or forecasting any returns. Past performance may or may not be sustained in future.

19
TACTICAL CALLS TO CAPTURE SHORT TERM SECTOR ROTATION
CASE STUDY 3: METAL AND IT SECTORS
• Periodically, opportunities arise across sectors to benefit from some macro theme impacting the sector
• Cases in point being metal stocks which have strong correlation to commodity prices or IT sector’s dependence on currency
Metal sector performance highly correlated to steel prices
Periods* of correlation between exchange rate and IT sector performance
60.0
110.0
160.0
210.0
260.0
310.0
360.0
410.0
460.0
510.0
Jan
-05
Jan
-07
Jan
-09
Jan
-11
Jan
-13
Jan
-15
Jan
-17
Jan
-19
STEEL vs NSEMET
NSEMET STEEL
6.7
(10.1)
5.7
(10.3)(5.3)
37.0
(7.3)
21.2
(20.0)
(10.0)
-
10.0
20.0
30.0
40.0
Jan'06 - Jul'06 May'10 - Nov'10 Jan'15 - Jul'15 Nov'16 - May'17
PERFORMANCE: USDINR & NSEIT INDEX
USDINR NSEIT
Source: Bloomberg | Data as on Dec 31, 2018 Source: Bloomberg | Data as on Dec 31, 2018
* Only those periods that have exhibited a correlation between exchange rate and IT sector performance have been considered for this analysisPrice
The data provided above is for illustrative purpose only. Mahindra Asset Management Company Private Limited/Mahindra Mutual Fund is not guaranteeing or forecasting any returns. Past performance may or may not be sustained in future.

20
MARKET OUTLOOK

21
MARKET OUTLOOK
• Election results is the most keenly awaited event• We do not expect any major market movement before that• Earnings growth visible despite challenges• Valuation gap between midcap and large cap has narrowed.• Markets awaiting clarity on formation of new government, adherence to fiscal
deficit target for FY 19 and end to U.S.A. China trade war.
FY 19 EPS FY 19 PE FY 20 EPS FY 20 PE
Nifty 50 545 19.9 659 16.4
Nifty Midcap 100 867 19.5 1,136 14.9
INDEX RETURNS FOR CALENDAR 2018(Absolute Returns)
NIFTY 50 + 4.70%Nifty Midcap 100 -15.00%Nifty Smallcap 100 - 28.00%
Data Source: Bloomberg Consensus Estimates | Data as on 31 Jan 2019
All figures are estimates
The data provided above is for illustrative purpose only and should not be construed as a promise on minimum returns and safeguard of capital. Mahindra Asset Management Company Private Limited/Mahindra Mutual Fund is not guaranteeing or forecasting any returns. Past performance may or may not be sustained in future.

22
Source: Value Research : https://www.valueresearchonline.com/story/h2_storyView.asp?str=46202#prettyPhoto
There isn’t any statistical data showing election outcome or government in power or tenure to have any correlation with market performance
SHOULD YOU WORRY ABOUT ELECTION RESULTS?

23
FUND MANAGER PROFILE

24
Mr. V. BalasubramanianChief Portfolio Strategist (Equity)
Mr. V. Balasubramanian has over 38 years of work experience of which around 20 years have been in the Mutual Fund Industry and 8 years in Treasury of a nationalized bank.
Prior to joining Mahindra Asset Management Company Private Limited, he was the Chief Investment Officer at IDBI Mutual Fund.
FUND MANAGER

25
SCHEME DETAILS FOR INVESTMENT

26
Instruments
Indicative Allocation
(% of assets)
Risk Profile
Minimum Maximum High/Medium/Low
Equity and Equity related Securities of Large Cap
companies^*
80 100 High
Equity and Equity Related Securities of other
companies^
0 20 High
Debt and Money Market Securities^ (including
CBLO and Reverse Repo)
0 20 Low to Medium
Units issued by REITs & InvITs 0 10 Medium to High
ASSET ALLOCATION
*Definition of Large Cap Companies: 1st – 100th company in terms of full Market Capitalization. For the purpose of this definition, the list of stocks prepared by AMFI in this regard will be adopted. ^ including derivative instruments to the extent of 50% of the Net Assets of the Scheme. For detailed asset allocation refer SID of the Scheme available at www.mahindramutualfund.com or visit nearest Investor Service Centre.
Benchmark: Nifty 50

27
Available plans for subscription by investors Direct (D), Regular
Available option under each plan Growth (D), Dividend
Available Facilities under Dividend Option Dividend Payout, Dividend Reinvestment (D)
Loads Entry Load: NAExit Load: -An Exit Load of 1% is payable if Units are redeemed / switched-out upto 1 year from the date of allotment;-Nil if Units are redeemed / switched-out after 1 year from the date of allotment.
Minimum Application/ Additional Purchase Amount Rs. 1,000/- and in multiples of Re. 1/- thereafter
Minimum Amount for Switch-in Rs. 1,000/- and in multiples of Re. 0.01/- thereafter.
Minimum Amount for Redemption/ Switch-outs Rs. 1,000/- or 100 units or account balance, whichever is lower
Minimum SIP Amount Rs 500 under monthly frequency; Rs 1500 under quarterly frequency
D- Default

28
This product is suitable for investors who are seeking*
• Long term capital appreciation;
• Investment predominantly in equity and equity related securities including derivatives of large cap companies.
* Investors should consult their financial advisers if in doubt about whether the product is suitable for them.
PRODUCT LABELING
Investors understand that their principal will be moderately high risk
Riskometer

29
ANNEXURES FOR IN-DEPTH DISCUSSIONS
30
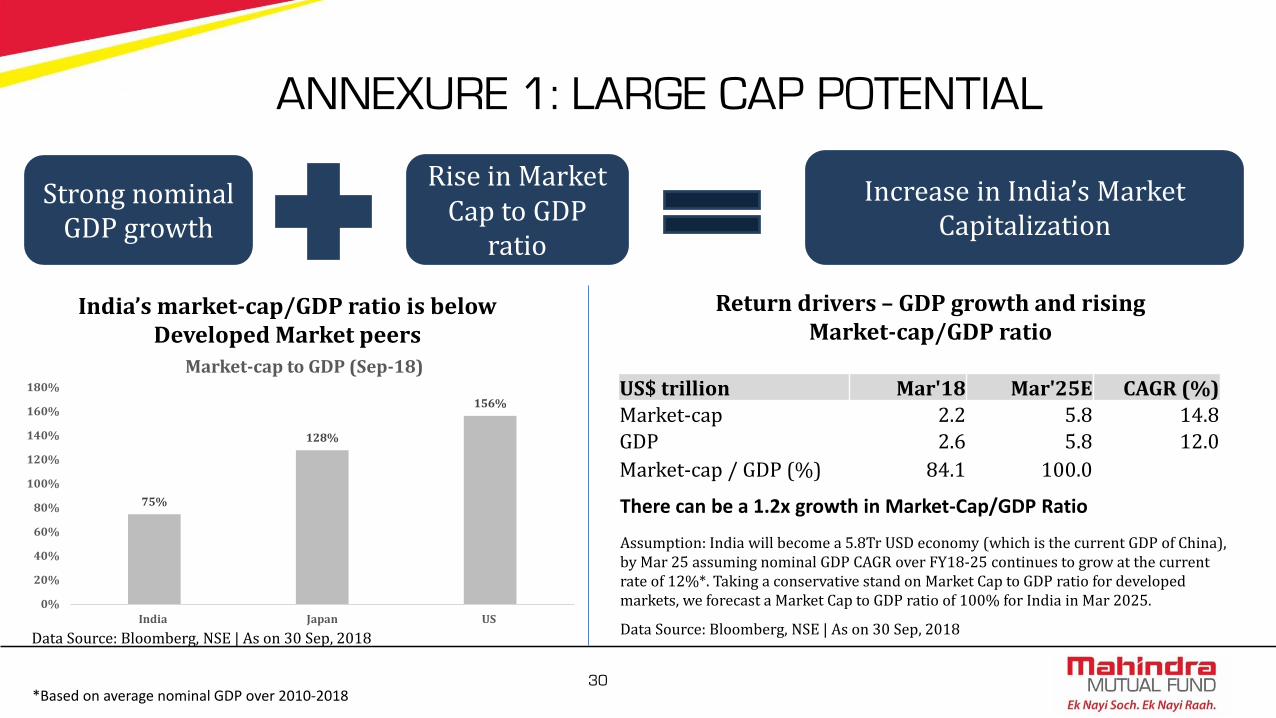
ANNEXURE 1: LARGE CAP POTENTIAL
India’s market-cap/GDP ratio is below Developed Market peers
Data Source: Bloomberg, NSE | As on 30 Sep, 2018
US$ trillion Mar'18 Mar'25E CAGR (%)
Market-cap 2.2 5.8 14.8 GDP 2.6 5.8 12.0
Market-cap / GDP (%) 84.1 100.0
75%
128%
156%
0%
20%
40%
60%
80%
100%
120%
140%
160%
180%
India Japan US
Market-cap to GDP (Sep-18)
Return drivers – GDP growth and rising Market-cap/GDP ratio
Assumption: India will become a 5.8Tr USD economy (which is the current GDP of China), by Mar 25 assuming nominal GDP CAGR over FY18-25 continues to grow at the current rate of 12%*. Taking a conservative stand on Market Cap to GDP ratio for developed markets, we forecast a Market Cap to GDP ratio of 100% for India in Mar 2025.
Increase in India’s Market Capitalization
Strong nominal GDP growth
Rise in Market Cap to GDP
ratio
There can be a 1.2x growth in Market-Cap/GDP Ratio
Data Source: Bloomberg, NSE | As on 30 Sep, 2018
*Based on average nominal GDP over 2010-2018

31
ANNEXURE 2: LARGE CAP POTENTIAL (Cont..)
Market Capitalization US$ mn
Top-6 US companies market-cap
Microsoft Corp 788
Amazon 770
Google 747
Apple 704
Berkshire Hathaway 480
Facebook 397
Total - top 6 US companies 3,886
India - overall market-cap 2,050
India$2.2tn
India FY25E$5.8tn
Projected Market Capitalization
• Just the Top 6 US companies are 2x the Market Cap of entire India’s listed space
• India’s top 50 companies are less than US$1tn in market cap
Data Source: Bloomberg | As of 7th Jan 2019
Data Source: Bloomberg | As of 7th Jan 2019

32
50.0
55.0
60.0
65.0
70.0
75.0
80.0
85.0
90.0
95.0
100.0
CY07 CY08 CY09 CY10 CY11 CY12 CY13 CY14 CY15 CY16 CY17 CY18
LARGE CAP MARKET CAPITALIZATION TO COUNTRY GDP (% )
India Japan US UK
India - NIFTY + NIFTYJR TO GDP 8 YEAR AVERAGE : 67.4%Japan - NIKKEI225 TO GDP 8 YEAR AVERAGE: 60.7%
US - S&P500 TO GDP 8 YEAR AVERAGE: 77.6%UK - FTSE100 TO GDP 8 YEAR AVERAGE: 77.4%
ANNEXURE 3: COMPARISON WITH DEVELOPED
ECONOMIES
Source: Bloomberg| CY18 Data on Sep 30, 2018

33
ANNEXURE 4: VOLATILITY ACROSS MARKET CAPS
Source: Bloomberg, NSE | Data as of Dec 31st, 2018
Lower volatility in large caps compared to mid and small caps
Lower risk of draw downs compared to mid and small caps during corrections
0
5000
10000
15000
20000
25000
30000
35000
40000
45000
Jan
-04
Jan
-05
Jan
-06
Jan
-07
Jan
-08
Jan
-09
Jan
-10
Jan
-11
Jan
-12
Jan
-13
Jan
-14
Jan
-15
Jan
-16
Jan
-17
Jan
-18
Jan
-19
NIFTY NIFTY Midcap 100 NIFTY Smallcap 100

34
ANNEXURE 5.A: THEMES PLAYING OUT IN THE INDEX
Capex-linked: Industrials, Utilities, Materials, Telecom, EnergyFinancial Services: Banks and Financial ServicesExport-oriented: IT, PharmaceuticalsConsumption-linked: Consumer Staples, Consumer Discretionary
Source: Bloomberg, NSE
31.4
69.4
36.8 25.1 26.6
12.6
11.1
26.2
29.7 37.1
25.3
11.8
18.3 24.4
16.4
30.9
7.6 18.7 20.8 19.9
2 0 0 3 2 0 0 8 2 0 1 2 2 0 1 6 2 0 1 8
NIFTY COMPOSITION* BY SECTOR (%)
• 2003-08: A period of high gross fixed capital formation growth; Rising share of investment linked segment in Nifty reflected this mix well.
• 2008-12: Consumption growth showed strong uptick even as capex slowed down; Pharma exports saw strong traction; Retail financing took strong roots and gained share from unorganized segments; Same got reflected in index mix;
• 2012-16: Above trends got accentuated; So did their reflection in Nifty. Many new NBFCs, private banks saw inclusion in index.
• 2016-18: Moderation in exports; Consumption and Financials services theme continue to see strong growth in economy; Capex stabilizes; All trend captured in Nifty mix;
Changing complexion of economy reflected in Nifty mix change
*Internal thematic classification of Index as per MSCI sectors

35
ANNEXURE 5.B: THEMATIC SPLIT OF THE INDEX
The above classification has been used to demonstrate category movements in NIFTY over years in previous slide
CONSUMPTION LINKED* EXPORT ORIENTED* FINANCIALS SERVICES* CAPEX LINKED*
Automobile - 4 Wheelers Computers - Software Banks and Financial Institutions Engineering
Cigarettes Pharmaceuticals Power
Diversified Mining
Automohiles - 2 And 3 Wheelers Cement & Cement Products
Paints Telecommunication - Services
Media & Entertainment Oil Exploration / Production
Auto Ancillaries Steel & Steel Products
Aluminium
Gas
Shipping
PESTICIDES AND AGROCHEMICALS
Telecommunication - Equipment
Electrical Equipment
Construction
Metals
*Internal thematic classification of Index as per MSCI sectors

36
The views expressed here in this presentation are for general information and reading purpose only and do not constitute anyguidelines and recommendations on any course of action to be followed by the reader / user of this presentation. No representationor warranty is made as to the accuracy, completeness or fairness of the information and opinions contained herein. The views are notmeant to serve as a professional guide / investment advice / intended to be an offer or solicitation for the purchase or sale of anyfinancial product or instrument or mutual fund units for the reader / user. This presentation has been prepared on the basis of publiclyavailable information, internally developed data and other sources believed to be reliable. While utmost care has been exercised whilepreparing this presentation, Mahindra Asset Management Company Private Limited (Mahindra AMC) does not warrant thecompleteness or accuracy of the information and disclaims all liabilities, losses and damages arising out of the use of this information.The data/statistics, wherever provided, are given to explain general market trends in the securities market, it should not be construedas any research report/research recommendation. Readers / users of this presentation should rely on information / data arising out oftheir own investigations and are advised to seek independent professional advice and arrive at an informed decision before makingany investments. Neither Mahindra Mutual Fund, Mahindra AMC nor Mahindra Trustee Company Private Limited, its directors orassociates shall be liable for any damages that may arise from the use of the information contained herein.
For detailed asset allocation, investment strategy, scheme specific risk factors and more details, please read the SchemeInformation Document and Key Information Memorandum of Mahindra Pragati Bluechip Yojana available at the ISCs ofMahindra AMC and Computer Age Management Services Private Limited and are also available onwww.mahindramutualfund.com. Past performance may or may not be sustained in the future and should not be used as abasis for comparison with other investments.
Mutual fund investments are subject to market risks read all scheme related documents carefully.
CNo.00446
Disclaimer

धन्यवादThank You