main findings for the draft network (released august … · web viewpearl oyster fishery tac, itq,...
TRANSCRIPT
North-west Marine Region Commonwealth Reserves Network:social and economic assessment of the impacts on commercial and charter fishing
Report on the draft marine reserves network, with a supplementary report for the final proposed marine reserves network
Research by the Australian Bureau of Agriculturaland Resource Economics and Sciences
June 2012

© Commonwealth of Australia 2012
Ownership of intellectual property rightsUnless otherwise noted, copyright (and any other intellectual property rights, if any) in this publication is owned by the Commonwealth of Australia (referred to as the Commonwealth).
Creative Commons licenceAll material in this publication is licensed under a Creative Commons Attribution 3.0 Australia Licence, save for content supplied by third parties, logos and the Commonwealth coat of arms.
Creative Commons Attribution 3.0 Australia Licence is a standard form licence agreement that allows you to copy, distribute, transmit and adapt this publication provided you attribute the work. A summary of the licence terms is available from creativecommons.org/licenses/by/3.0/au/deed.en. The full licence terms are available from creativecommons.org/licenses/by/3.0/au/legalcode.
This publication (and any material sourced from it) should be attributed as: Australian Bureau of Agricultural and Resource Economics and Sciences (ABARES) 2012, North-west Commonwealth Marine Reserves Network: social and economic assessment of the impacts on commercial and charter fishing. Report prepared for the Australian Government Department of Sustainability, Environment, Water, Population and Communities, Canberra, June 2012. CC BY 3.0.
Cataloguing dataAustralian Bureau of Agricultural and Resource Economics and Sciences (ABARES) 2012. North-west Commonwealth Marine Reserves Network: social and economic assessment of the impacts on commercial and charter fishing. Report on the draft marine reserves network, with a supplementary report for the final proposed marine reserves network. Report prepared for the Australian Government Department of Sustainability, Environment, Water, Population and Communities, Canberra, June 2012.
ABARES project 43210
Australian Bureau of Agricultural and Resource Economics and Sciences (ABARES)Postal address GPO Box 1563 Canberra ACT 2601Switchboard: +61 2 6272 2010|Facsimile: +61 2 6272 2001Email: [email protected]: daff.gov.au/abares
Inquiries regarding the licence and any use of this document should be sent to [email protected]
The Australian Government acting through the Department of Agriculture, Fisheries and Forestry represented by the Australian Bureau of Agricultural and Resource Economics and Sciences, has exercised due care and skill in the preparation and compilation of the information and data in this publication. Notwithstanding, the Department of Agriculture, Fisheries and Forestry, ABARES, its employees and advisers disclaim all liability, including liability for negligence, for any loss, damage, injury, expense or cost incurred by any person as a result of accessing, using or relying upon any of the information or data in this publication to the maximum extent permitted by law.
AcknowledgementsABARES thanks the Australian Fisheries Management Authority and the Western Australian Department of Fisheries for their assistance in providing data and reviewing this report. ABARES also acknowledges the comments and contributions of commercial fishers and industry group representatives, including those from the Commonwealth Fisheries Association and the Western Australian Fishing Industry Council.
ABARES contributors (alphabetical): Gavin Begg, Peter Berry, Katherine Cheshire, Robert Curtotti, Alix Duncan, Saan Ecker, Marco Hatt, Edwina Heyhoe, Patty Hobsbawn, Robert Kancans, James Larcombe, Nic Marton, Rob New, Rocio Noriega, Patty Please, Nyree Stenekes, Rupert Summerson, Charlene Trestrail and Alasebu Yainshet.

ContentsExecutive summary..........................................................................................................................................1
Main findings for the draft network (released August 2011)............................................2
Main findings for the final proposed network (released 14 June 2012)......................9
Draft North-west Commonwealth Marine Reserves Network proposal...............................12
1 Background and introduction.......................................................................................................13
The North-west Marine Region....................................................................................................13
Fisheries in the North-west Marine Region............................................................................14
Demographics of the North-west Marine Region.................................................................19
Scope of work....................................................................................................................................... 20
The social and economic assessment.........................................................................................21
2 Potential displacement of fishing................................................................................................23
Area closures and entitlement values........................................................................................25
Commercial fishing potential displacement...........................................................................25
Charter fishing potential displacement.....................................................................................34
Prospective fishing.............................................................................................................................34
Fisheries management..................................................................................................................... 36
3 Flow of potential impacts to ports and supply chains........................................................37
Flow of gross value of production to ports..............................................................................38
Inputs to fishing businesses (upstream impacts)................................................................39
Outputs from fishing businesses (downstream impacts).................................................41
Town and local area summary......................................................................................................43
Potential impacts on the economy..............................................................................................45
Potential impacts on employment..............................................................................................46
Summary of flow of impacts.......................................................................................................... 47
4 Impacts on fishing businesses.......................................................................................................48
Survey data caveats and notes......................................................................................................48
Commercial fishery qualitative value mapping.....................................................................49
Direct displacement impacts on fishing businesses............................................................51
Fishing business impacts.................................................................................................................53
Fishing business plans and future investments....................................................................56
Other issues and cumulative factors impacting fishing businesses.............................57
Ability to adapt—fishing businesses..........................................................................................60
Fishing business impacts summary............................................................................................61
iii

5 Personal and community impacts...............................................................................................62
Personal impacts.................................................................................................................................62
Ability to adapt—personal............................................................................................................. 65
Community impacts...........................................................................................................................67
Ability to adapt—community........................................................................................................67
Community and personal impacts summary..........................................................................69
6 Case studies........................................................................................................................................... 70
Telling the fisher’s story: a narrative approach....................................................................70
Macroeconomic context...................................................................................................................70
Case study: Carnarvon—flow-on impacts to the community.........................................73
Case study: Western Tuna and Billfish Fishery—displacement and prospective fishing.............................................................................................................................76
Case study: Shark Bay, Kimberley and Nickol Bay prawn fisheries—variability in prawn production...................................................................................................80
Case study: West Coast Demersal Gillnet and Longline Fishery—individual fisher......................................................................................................................................................... 82
7 Appendixes............................................................................................................................................ 84
A: Fisheries data processing methods.......................................................................................84
B: Social impact assessment methods.......................................................................................92
C: Estimating job reduction using the survey.........................................................................98
D: Developing an index of community vulnerability...........................................................99
E: Profile of survey respondents...............................................................................................103
F: Summary information on flow of impacts, supply chains and demographics of communities..................................................................................................................................108
8 References........................................................................................................................................... 111
Supplementary report: Final North-west Commonwealth Marine Reserves Network proposal............................................................................................................................114
Overview.............................................................................................................................................. 115
Changes to the North-west Commonwealth Marine Reserves Network.................117
Potential displacement of fishing..............................................................................................120
Flow of potential impacts to ports............................................................................................123
Fishing business impacts..............................................................................................................127
Personal impacts..............................................................................................................................127
Case studies........................................................................................................................................ 128
Summary tables for the final North-west Commonwealth Marine Reserves Network proposal............................................................................................................................129
iv
TablesTable 1 Comparison of estimates of catch and gross value of production (GVP)
potentially displaced by the draft (released August 2011) and final proposed (released 14 June 2012) marine reserves networks in the North-west Marine Region............................................................................................................................................................ 8
Table 2 Reference information for potentially impacted fisheries within the North-west Marine Region..............................................................................................................................16
Table 3 Estimated direct employment in the Australian fishing industry (full-time equivalent positions)........................................................................................................................... 19
Table 4 Estimates of Commonwealth and Western Australia fishery catch and gross value of production (GVP) that would be potentially displaced by the draft North-west Commonwealth Marine Reserves Network (Map 2)....................................27
Table 5 Estimates of mean annual potential catch displaced by the draft North-west Commonwealth Marine Reserves Network from Commonwealth fisheries over the 2001–10 reference period............................................................................28
Table 6 Estimates of mean annual potential gross value of production (GVP) displaced by the draft North-west Commonwealth Marine Reserves Network from Commonwealth fisheries over the 2001–10 reference period..............................29
Table 7 Estimates of mean annual potential catch displaced by the draft North-west Commonwealth Marine Reserves Network from Western Australian fisheries over the 2001–10 reference period............................................................................30
Table 8 Estimates of mean annual potential gross value of production (GVP) displaced by the draft North-west Commonwealth Marine Reserves Network from Western Australian fisheries over the 2001–10 reference period.......................31
Table 9 Estimated mean annual displaced catch (number of retained fish) and number of clients in the WA charter fishing industry...........................................................34
Table 10 Community exposure, sensitivity and adaptive capacity—draft North-west Commonwealth Marine Reserves Network....................................................................44
Table 11 Estimated paid job reduction anticipated by survey respondents due to draft North-west Commonwealth Marine Reserves Network...........................................47
Table 12 Number of value markers placed in draft marine reserve areas for each of the value categories..............................................................................................................................51
Table 13 Number of survey respondents who indicated they would be excluded or displaced to some degree by the draft marine reserves......................................................52
Table 14 Number of survey responses that indicated a defined proportion of their 2010–11 catch was taken from within draft marine reserves..........................................52
Table 15 Responses to the question, ‘If the draft reserves were declared I would have to change my current fishing activities’............................................................................54
Table 16 Responses from those who declared their fishing activity would have to change......................................................................................................................................................... 54
Table 17 Number of respondents with business and investment plans in place.................57
Table 18 Commonwealth fishing methods and zoning implications.........................................87
v
Table 19 Mean aggregate prices used to calculate gross value of production for Western Australia–managed fisheries.........................................................................................88
Table 20 Western Australian fishing methods and zoning implications..................................91
Table 21 Percentages used to calculate reduction in employees based on the overall response to the draft marine reserves and response to a question of whether the business will reduce employees...........................................................................98
Table 22 Indicators and data.....................................................................................................................100
Table 23 Licences held by survey respondents in 2010–11.......................................................103
Table 24 Fishing methods...........................................................................................................................104
Table 25 Fishing history..............................................................................................................................104
Table 26 Respondents role in fishing business.................................................................................105
Table 27 Fishing business structure......................................................................................................105
Table 28 Fishing business activities.......................................................................................................105
Table 29 Fishing business employees...................................................................................................106
Table 30 Value of total landed catch 2010–11..................................................................................106
Table 31 Age of respondents.....................................................................................................................107
Table 32 Summary of flow of impacts, supply chain, demographics and vulnerability under the draft North-west Commonwealth Marine Reserves Network................................................................................................................................................... 109
Table S1 Differences between the draft and final proposed North-west Commonwealth Marine Reserves Networks..........................................................................117
Table S2 Comparison of estimates of catch and gross value of production (GVP) potentially displaced by the draft (released August 2011) and final proposed (released 14 June 2012) marine reserves networks in the North-west Marine Region...................................................................................................................................................... 122
Table S3 Comparison of estimated potential charter fishing displacement between the draft and final North-west Commonwealth Marine Reserves Network proposals................................................................................................................................................ 123
Table S4 Comparison of estimates of flow of potentially displaced gross value of production (GVP) by the draft and final proposed North-west Commonwealth Marine Reserves Networks............................................................................................................ 124
Table S5 Community exposure, sensitivity and adaptive capacity—final North-west Commonwealth Marine Reserves Network proposal.........................................................125
Table S6 Comparison of the short-term net economic impact and job losses between the draft and final North-west Commonwealth Marine Reserves Network proposals.............................................................................................................................126
Table S7 Overview of additional potentially impacted fisheries and aggregate prices used to calculate gross value of production under the final North-west Commonwealth Marine Reserves Network proposal.........................................................130
Table S8 Estimates of mean annual potential catch displaced by the final North-west Commonwealth Marine Reserves Network proposal from Commonwealth fisheries over the reference period..........................................................131
vi
Table S9 Estimates of mean annual potential gross value of production (GVP) displaced by the final North-west Commonwealth Marine Reserves Network proposal from Commonwealth fisheries over the reference period............................132
Table S10 Estimates of mean annual potential catch displaced by the final North-west Commonwealth Marine Reserves Network proposal from Western Australian fisheries over the reference period......................................................................133
Table S11 Estimates of mean annual potential gross value of production (GVP) displaced by the final North-west Commonwealth Marine Reserves Network proposal from Western Australian fisheries over the reference period....................134
Table S12 Updated summary information on flow of impacts, supply chains and demographics of communities for all towns identified under the final North-west Commonwealth Marine Reserves Network proposal..............................................135
vii
FiguresFigure 1 Trends in total fisheries gross value of production since 2000 (percentage
deviation from the mean).................................................................................................................. 33
Figure 2 Conceptual model of community vulnerability.................................................................43
Figure 3 Fishing business impacts for respondents who indicated they would continue operating by making up shortfall or moving into an alternative fishery......................................................................................................................................................... 55
Figure 4 Fishing business impacts for respondents who indicated they would continue operating with a reduced catch....................................................................................56
Figure 5 Other issues impacting fishing business in the North-west Marine Region.........59
Figure 6 Ability to adapt— fishing businesses.....................................................................................60
Figure 7 Indirect personal impacts for respondents who indicated they would continue operating by making up the shortfall or moving into an alternative fishery......................................................................................................................................................... 63
Figure 8 Indirect personal impacts for respondents who indicated they would continue operating with a reduced catch....................................................................................64
Figure 9 Ability to adapt—personal......................................................................................................... 66
Figure 10 Ability to adapt—community.................................................................................................68
Figure 11 Commonwealth fisheries gross value of production (GVP) and Australian dollar exchange rate, 2000–01 to 2009–10...............................................................................71
Figure 12 Real average off-road diesel price, inclusive of farm rebates and subsidies, but excluding GST, 2000–01 to 2009–10..............................................................71
Figure 13 Illustration of treatment of fishing operations in relation to marine reserve boundaries............................................................................................................................... 87
Figure 14 The relationship among all fishers, target population, survey frame and survey respondents.............................................................................................................................. 93
Figure 15 Conceptual model of community vulnerability..............................................................99
MapsMap 1 North-west Marine Region draft (released August 2011) and final proposed
(released 14 June 2012) marine reserves networks with zones and area numbering................................................................................................................................................... 7
Map 2 Draft North-west Commonwealth Marine Reserves Network with zones and area numbering...................................................................................................................................... 14
Map 3 All commercial fishing gross value of production (GVP) in the North-west Marine Region, employment in the consolidated fishing industry and draft North-west marine reserves.............................................................................................................20
Map 4 Flow of potentially displaced gross value of production (GVP) to ports....................38
viii
Map 5 Number of input businesses identified as potentially impacted by the draft North-west Commonwealth Marine Reserves Network......................................................39
Map 6 Number of respondents who source inputs from this location for their fishing business (size of the circle), with proportional allocation to each draft marine reserve (pie chart)................................................................................................................40
Map 7 Number of output businesses identified as potentially impacted by the draft North-west Commonwealth Marine Reserves Network......................................................41
Map 8 Number of respondents who send outputs to this location from their fishing business (size of the circle), with proportional allocation to each draft marine reserve (pie chart).................................................................................................................................42
Map 9 Qualitative value mapping for all value classes ('catch reliability', 'catch diversity', 'easy to access', 'a safe area', 'less competition', 'future use value').........50
Map 10 Japanese and Australian pelagic longline fishing catches during the decades 1980–89 and 1990–99......................................................................................................79
Map 11 Western Australian fisheries reporting grid systems overlaid on the outline of the draft North-west Commonwealth Marine Reserves Network..............................89
Map 12 Illustration of spatial refinements to the 60-minute reporting grids used by the Kimberly Prawn Fishery in the North-west Marine Region.......................................91
Map S1 North-west Marine Region draft (released August 2011) and final proposed (released 14 June 2012) marine reserves networks with zones and area numbering....................................................................................................................................119
BoxesBox 1 Assessing the economic impact of marine reserves.............................................................24
ix

North-west Marine Region social and economic assessment ABARES
Executive summary The Australian Government is undertaking marine bioregional planning in Commonwealth waters. This includes identifying areas for inclusion in the National Representative System of Marine Protected Areas. The Australian Government Department of Sustainability, Environment, Water, Population and Communities (SEWPaC; the lead government agency) has commissioned the Australian Bureau of Agricultural and Resource Economics and Sciences (ABARES) to assess the impacts of the proposed marine reserves networks on commercial and charter fishing in each marine region.
This social and economic assessment used a range of statistical analyses, social impact assessment and economic modelling to provide a variety of perspectives on potential impacts. It drew on data from fisheries logbooks, a survey of fishing businesses, interviews and focus groups.
The scope of work does not include potential impacts on non-commercial activities, including recreational fishing, customary fishing and tourism, nor does it attempt to cost or quantify any loss of asset values (e.g. fishing access rights, boats and shore-based infrastructure). The costing and design of any Australian Government assistance (structural adjustment) were also not part of the scope.
The assessment was undertaken in two stages that relate to the draft North-west Commonwealth Marine Reserves Network proposal released for public comment from August–November 2011, and the final North-west Commonwealth Marine Reserves Network proposal released on 14 June 2012 (Map 1). This report (and this summary) is therefore structured into two sections as follows:
Draft North-west Commonwealth Marine Reserves Network proposal (released August 2011). The consultative social and economic assessment was undertaken on the draft North-west Commonwealth Marine Reserves Network and forms the bulk of this report. The assessment of the proposed network is structured to provide a variety of information and perspectives on potential impacts. In general, the assessment progresses from large-scale aggregate impacts across the entire reserves network in the early chapters, through to a finer scale covering the potential impacts to towns, businesses and people. Different data were used to estimate or infer potential impacts at each scale. In developing this assessment, ABARES has consulted and been guided by a working group comprising representatives from the Western Australian Government and fishing industry bodies.
Final North-west Commonwealth Marine Reserves Network proposal (released 14 June 2012). An abridged assessment was undertaken on the final North-west Commonwealth Marine Reserves Network proposal, and this is contained within the supplementary section of this report. The revisions to the network were informed by submissions received by SEWPaC through the public consultation process and by ABARES's initial analysis on the draft network released for public consultation. This abridged assessment provides (where possible) a comparative analysis of the changes in potential impacts between the draft and final proposed reserves networks. ABARES was not in a position to undertake additional consultation (surveys or interviews) with commercial and charter fishing businesses for this abridged assessment.
1

North-west Marine Region social and economic assessment ABARES
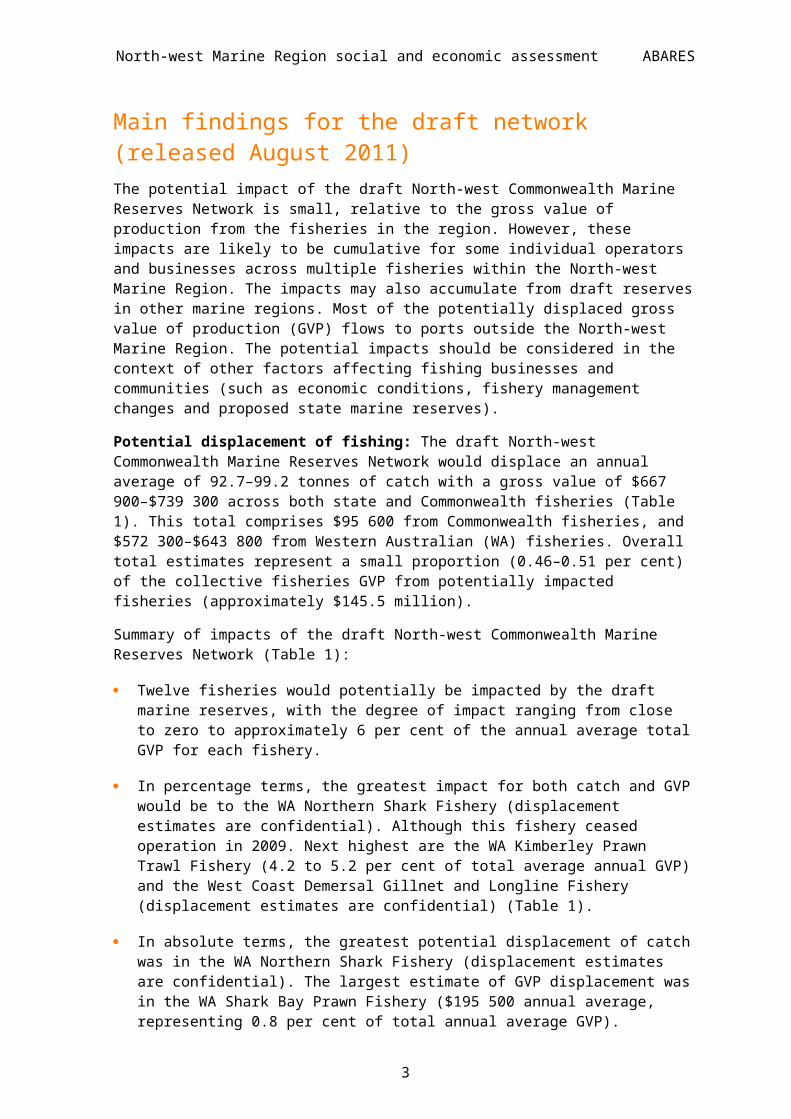
Main findings for the draft network (released August 2011)The potential impact of the draft North-west Commonwealth Marine Reserves Network is small, relative to the gross value of production from the fisheries in the region. However, these impacts are likely to be cumulative for some individual operators and businesses across multiple fisheries within the North-west Marine Region. The impacts may also accumulate from draft reserves in other marine regions. Most of the potentially displaced gross value of production (GVP) flows to ports outside the North-west Marine Region. The potential impacts should be considered in the context of other factors affecting fishing businesses and communities (such as economic conditions, fishery management changes and proposed state marine reserves).
Potential displacement of fishing: The draft North-west Commonwealth Marine Reserves Network would displace an annual average of 92.7–99.2 tonnes of catch with a gross value of $667 900–$739 300 across both state and Commonwealth fisheries (Table 1). This total comprises $95 600 from Commonwealth fisheries, and $572 300–$643 800 from Western Australian (WA) fisheries. Overall total estimates represent a small proportion (0.46–0.51 per cent) of the collective fisheries GVP from potentially impacted fisheries (approximately $145.5 million).
Summary of impacts of the draft North-west Commonwealth Marine Reserves Network (Table 1):
Twelve fisheries would potentially be impacted by the draft marine reserves, with the degree of impact ranging from close to zero to approximately 6 per cent of the annual average total GVP for each fishery.
In percentage terms, the greatest impact for both catch and GVP would be to the WA Northern Shark Fishery (displacement estimates are confidential). Although this fishery ceased operation in 2009. Next highest are the WA Kimberley Prawn Trawl Fishery (4.2 to 5.2 per cent of total average annual GVP) and the West Coast Demersal Gillnet and Longline Fishery (displacement estimates are confidential) (Table 1).
In absolute terms, the greatest potential displacement of catch was in the WA Northern Shark Fishery (displacement estimates are confidential). The largest estimate of GVP displacement was in the WA Shark Bay Prawn Fishery ($195 500 annual average, representing 0.8 per cent of total annual average GVP).
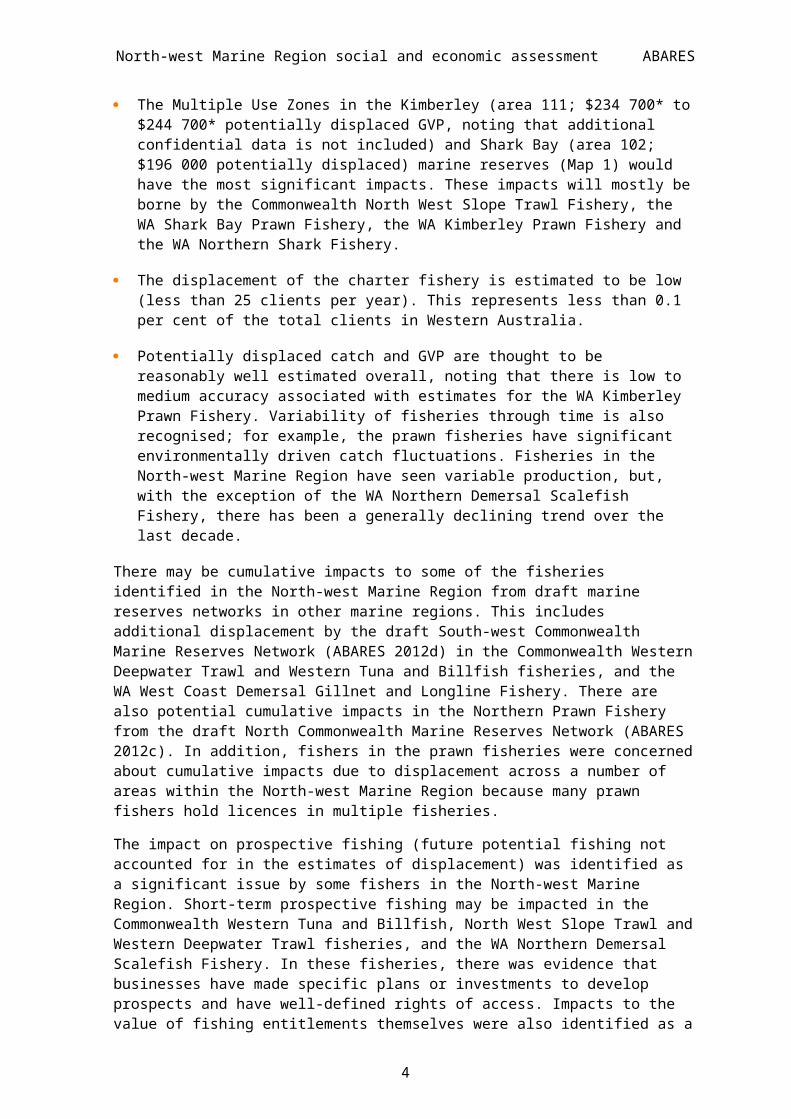
The Multiple Use Zones in the Kimberley (area 111; $234 700* to $244 700* potentially displaced GVP, noting that additional confidential data is not included) and Shark Bay (area 102; $196 000 potentially displaced) marine reserves (Map 1) would have the most significant impacts. These impacts will mostly be borne by the Commonwealth North West Slope Trawl Fishery, the WA Shark Bay Prawn Fishery, the WA Kimberley Prawn Fishery and the WA Northern Shark Fishery.
The displacement of the charter fishery is estimated to be low (less than 25 clients per year). This represents less than 0.1 per cent of the total clients in Western Australia.
Potentially displaced catch and GVP are thought to be reasonably well estimated overall, noting that there is low to medium accuracy associated with estimates for the WA Kimberley Prawn Fishery. Variability of fisheries through time is also recognised; for example, the prawn fisheries have significant environmentally driven catch fluctuations. Fisheries in the North-west Marine Region have seen variable production, but, with the
2
North-west Marine Region social and economic assessment ABARES
exception of the WA Northern Demersal Scalefish Fishery, there has been a generally declining trend over the last decade.
There may be cumulative impacts to some of the fisheries identified in the North-west Marine Region from draft marine reserves networks in other marine regions. This includes additional displacement by the draft South-west Commonwealth Marine Reserves Network (ABARES 2012d) in the Commonwealth Western Deepwater Trawl and Western Tuna and Billfish fisheries, and the WA West Coast Demersal Gillnet and Longline Fishery. There are also potential cumulative impacts in the Northern Prawn Fishery from the draft North Commonwealth Marine Reserves Network (ABARES 2012c). In addition, fishers in the prawn fisheries were concerned about cumulative impacts due to displacement across a number of areas within the North-west Marine Region because many prawn fishers hold licences in multiple fisheries.
The impact on prospective fishing (future potential fishing not accounted for in the estimates of displacement) was identified as a significant issue by some fishers in the North-west Marine Region. Short-term prospective fishing may be impacted in the Commonwealth Western Tuna and Billfish, North West Slope Trawl and Western Deepwater Trawl fisheries, and the WA Northern Demersal Scalefish Fishery. In these fisheries, there was evidence that businesses have made specific plans or investments to develop prospects and have well-defined rights of access. Impacts to the value of fishing entitlements themselves were also identified as a potential issue in some fisheries. However, this impact is difficult to quantify, and is beyond the scope of this report.
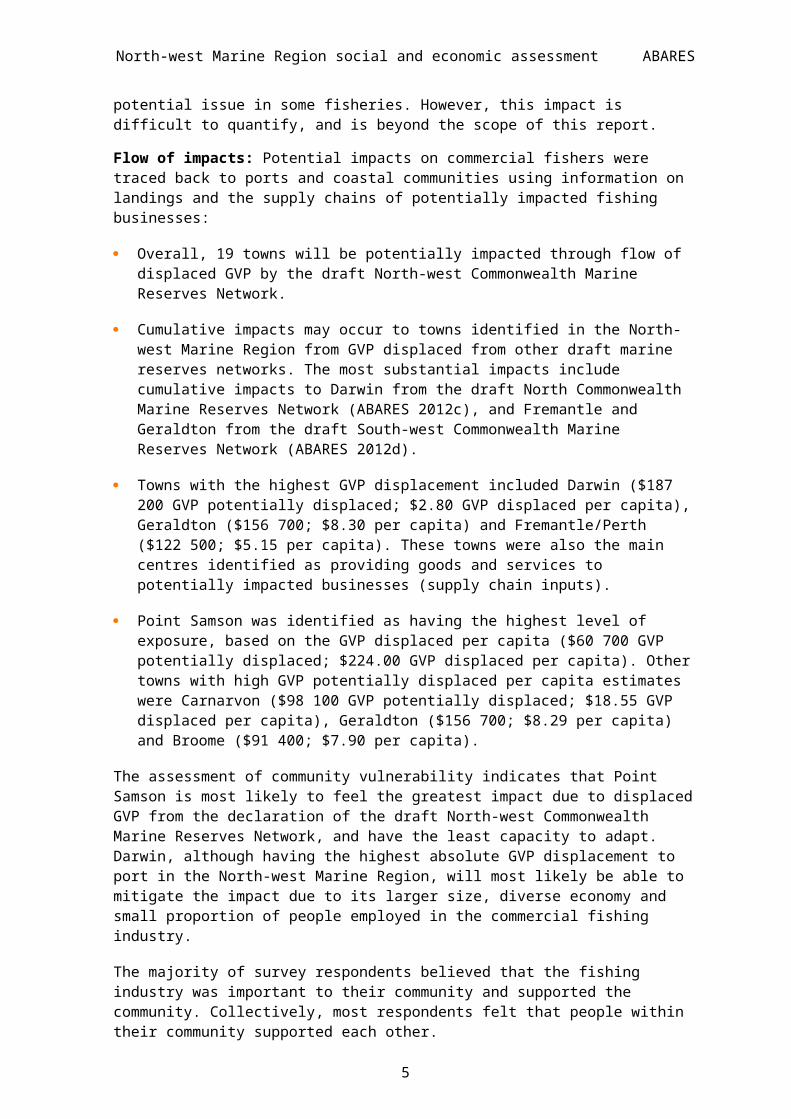
Flow of impacts: Potential impacts on commercial fishers were traced back to ports and coastal communities using information on landings and the supply chains of potentially impacted fishing businesses:
Overall, 19 towns will be potentially impacted through flow of displaced GVP by the draft North-west Commonwealth Marine Reserves Network.
Cumulative impacts may occur to towns identified in the North-west Marine Region from GVP displaced from other draft marine reserves networks. The most substantial impacts include cumulative impacts to Darwin from the draft North Commonwealth Marine Reserves Network (ABARES 2012c), and Fremantle and Geraldton from the draft South-west Commonwealth Marine Reserves Network (ABARES 2012d).
Towns with the highest GVP displacement included Darwin ($187 200 GVP potentially displaced; $2.80 GVP displaced per capita), Geraldton ($156 700; $8.30 per capita) and Fremantle/Perth ($122 500; $5.15 per capita). These towns were also the main centres identified as providing goods and services to potentially impacted businesses (supply chain inputs).
Point Samson was identified as having the highest level of exposure, based on the GVP displaced per capita ($60 700 GVP potentially displaced; $224.00 GVP displaced per capita). Other towns with high GVP potentially displaced per capita estimates were Carnarvon ($98 100 GVP potentially displaced; $18.55 GVP displaced per capita), Geraldton ($156 700; $8.29 per capita) and Broome ($91 400; $7.90 per capita).
The assessment of community vulnerability indicates that Point Samson is most likely to feel the greatest impact due to displaced GVP from the declaration of the draft North-west Commonwealth Marine Reserves Network, and have the least capacity to adapt. Darwin, although having the highest absolute GVP displacement to port in the North-west Marine
3

North-west Marine Region social and economic assessment ABARES
Region, will most likely be able to mitigate the impact due to its larger size, diverse economy and small proportion of people employed in the commercial fishing industry.
The majority of survey respondents believed that the fishing industry was important to their community and supported the community. Collectively, most respondents felt that people within their community supported each other.
Potential impacts on the economy: No specific modelling was undertaken to examine the potential impacts of the draft North-west Commonwealth Marine Reserves Network on subregional economies. However, the results of subregional modelling undertaken in the South-west Marine Region (ABARES 2012d), North Marine Region (ABARES 2012c), Coral Sea (ABARES 2012b) and Temperate East Marine Region (ABARES 2012e) can be used to infer the likely scale of net economic impact arising from displaced GVP.
The potential total regional net economic impact from the displacement of fishing was estimated to be approximately $1.2–$1.3 million in the short term.
Within directly affected regions it was estimated there would be a loss of three full-time jobs in the short term (using the upper estimate of potential displacement).
There are likely to be flow-on impacts in other regions; however, changes in economic activity and employment at the state and national level are assessed to be negligible in terms of the size of those economies and job markets.
Independent of the AusRegion modelling, potential job losses from the catching and processing sectors was estimated at 5 full-time jobs in the short term, based on survey responses from fishing businesses.
Potential impacts on fishing businesses: A survey was sent to 104 fishing businesses in the catching sector. These businesses were identified in consultation with fisheries agencies and industry associations as being potentially impacted by the draft marine reserves network. The survey was completed by most, but not all, potentially impacted fishing businesses operating in North-west Marine Region.
Of the 39 responses received, 27 businesses reported being potentially impacted. Of these, 18 indicated they would stay in the fishing industry: 9 respondents indicated that they would stay and make up the shortfall (or move into another fishery) and 9 indicated that they would reduce catches or downsize their fishing operation. Three respondents indicated that they would leave the fishing industry, four were unsure how they would respond and two did not answer this question. Most fishing businesses indicated that less than 10 per cent of their catch would be displaced, while some indicated larger percentage impacts (one survey respondent indicated that up to 80 per cent of their catch would be displaced).
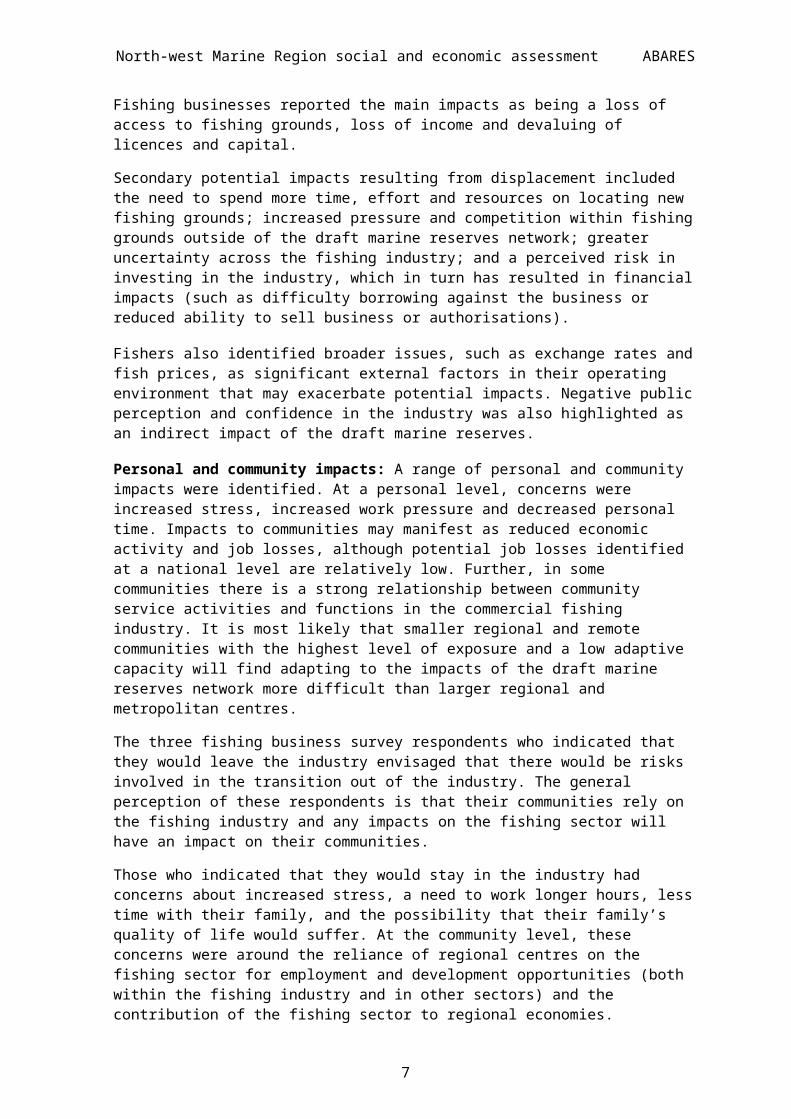
Fishing businesses reported the main impacts as being a loss of access to fishing grounds, loss of income and devaluing of licences and capital.
Secondary potential impacts resulting from displacement included the need to spend more time, effort and resources on locating new fishing grounds; increased pressure and competition within fishing grounds outside of the draft marine reserves network; greater uncertainty across the fishing industry; and a perceived risk in investing in the industry, which in turn has resulted in financial impacts (such as difficulty borrowing against the business or reduced ability to sell business or authorisations).
4

North-west Marine Region social and economic assessment ABARES
Fishers also identified broader issues, such as exchange rates and fish prices, as significant external factors in their operating environment that may exacerbate potential impacts. Negative public perception and confidence in the industry was also highlighted as an indirect impact of the draft marine reserves.
Personal and community impacts: A range of personal and community impacts were identified. At a personal level, concerns were increased stress, increased work pressure and decreased personal time. Impacts to communities may manifest as reduced economic activity and job losses, although potential job losses identified at a national level are relatively low. Further, in some communities there is a strong relationship between community service activities and functions in the commercial fishing industry. It is most likely that smaller regional and remote communities with the highest level of exposure and a low adaptive capacity will find adapting to the impacts of the draft marine reserves network more difficult than larger regional and metropolitan centres.
The three fishing business survey respondents who indicated that they would leave the industry envisaged that there would be risks involved in the transition out of the industry. The general perception of these respondents is that their communities rely on the fishing industry and any impacts on the fishing sector will have an impact on their communities.
Those who indicated that they would stay in the industry had concerns about increased stress, a need to work longer hours, less time with their family, and the possibility that their family’s quality of life would suffer. At the community level, these concerns were around the reliance of regional centres on the fishing sector for employment and development opportunities (both within the fishing industry and in other sectors) and the contribution of the fishing sector to regional economies.
Case studies: The purpose of the case studies is to provide a broader understanding of how the impacts of the draft marine reserves network would emerge at different levels. Case study themes were chosen through consultation with industry, WA state government and SEWPaC. Narrative case studies are specifically intended to 'tell the fisher’s story' about potential impacts. Case studies are:
Carnarvon—flow-on impacts to the community
This case study considers impacts of potential displacement in the Shark Bay Prawn Fishery by the draft Shark Bay marine reserve on the community of Carnarvon. Nor-West Seafoods is the majority licence holder in the Shark Bay Prawn Fishery and one of the largest employers in Carnarvon. Reductions in catch could therefore have indirect economic impacts for the town.
Commonwealth Western Tuna and Billfish Fishery—displacement and prospective fishing
This case study considers the potential displacement of an individual fisher and the potential impacts of the draft marine reserves network on prospective fishing in the Commonwealth Western Tuna and Billfish Fishery. Licence holders have indicated that they are exploring the option of expanding fishing activity. One company has made investments to accumulate quota and boat statutory fishing rights with a view to redeveloping the fishery. Furthermore, the impact of displacement is likely to fall primarily on one individual. This fisher believes that the draft Gascoyne and Pilbara marine reserves, together with draft reserves in the South-west Marine Region, will force him to move out of the Australian Fishing Zone.
5
North-west Marine Region social and economic assessment ABARES
Shark Bay, Kimberley and Nickol Bay prawn fisheries—variability in prawn production
This case study explores the inherently variable nature of the prawn fisheries and the business diversification that is consequently used by many operators within these fisheries. There are currently three prawn fisheries that operate completely in the North-west Marine Region. Potential displacement estimates for catch and GVP for the prawn fisheries rank the Shark Bay and Kimberley prawn fisheries as two of the most affected WA fisheries. Rainfall in northern Australia is highly irregular; consequently, annual prawn production (particularly banana prawns) is inherently variable, and prawn fishing grounds may vary in productivity between years. Each prawn fishery is a management area defined in statute because of its separate biological or regional characteristics, and does not necessarily represent a discrete group of fishers. From a business point of view, each prawn fishery forms part of a whole suite of interlocking fisheries across the north of Australia. Individual prawn fishers therefore often have authorisations to fish in multiple fisheries.
Western Australian West Coast Demersal Gillnet and Longline Fishery—individual fisher
This case study considers the potential impacts of a draft marine reserve on an individual operator fishing in the West Coast Demersal Gillnet and Longline Fishery. Industry suggests that the impact of the draft Kalbarri marine reserve will be borne by a single operator (‘the fisher’) who’s agreed fishing area encompasses the northernmost region of the fishery. The fisher reported that he will be displaced from a significant proportion of his fishing area by the draft Kalbarri marine reserve. He believes that the Kalbarri reserve will have the largest impact on his business, excluding him from 60 per cent of his fishing grounds.
6
North-west Marine Region social and economic assessment ABARES
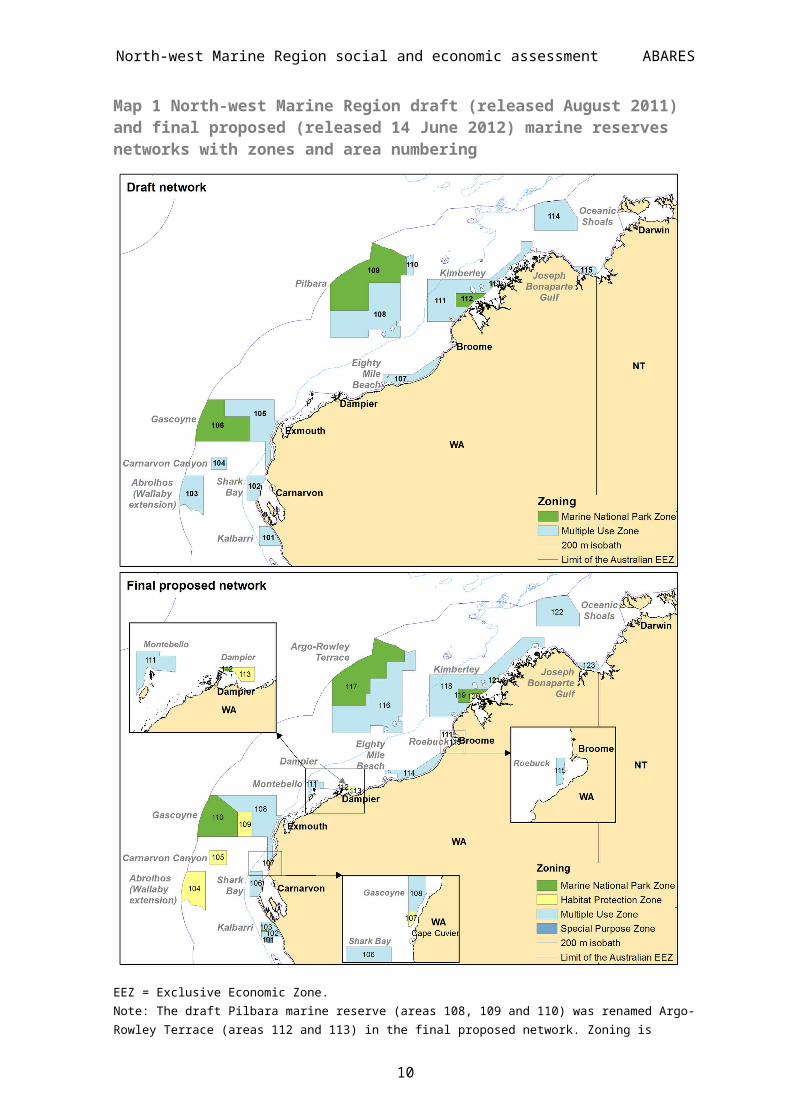
Map 1 North-west Marine Region draft (released August 2011) and final proposed (released 14 June 2012) marine reserves networks with zones and area numbering
EEZ = Exclusive Economic Zone. Note: The draft Pilbara marine reserve (areas 108, 109 and 110) was renamed Argo-Rowley Terrace (areas 112 and 113) in the final proposed network. Zoning is described in Appendix A: Fisheries data processing methods. Data sources: Marine reserve boundary from the Australian Government Department of Sustainability, Environment, Water, Population and Communities; coastline and bathymetry from Geoscience Australia
7
North-west Marine Region social and economic assessment ABARES
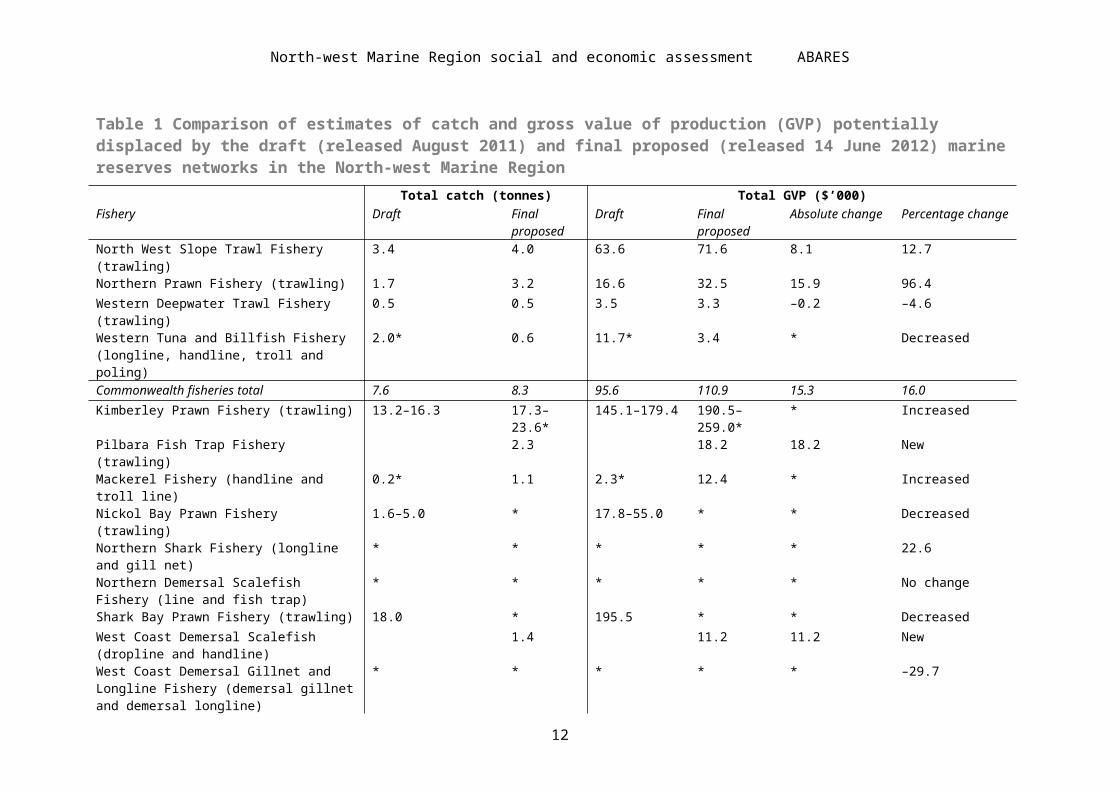
Table 1 Comparison of estimates of catch and gross value of production (GVP) potentially displaced by the draft (released August 2011) and final proposed (released 14 June 2012) marine reserves networks in the North-west Marine Region
Total catch (tonnes) Total GVP ($’000)
Fishery Draft Final proposed
Draft Final proposed Absolute change Percentage change
North West Slope Trawl Fishery (trawling) 3.4 4.0 63.6 71.6 8.1 12.7
Northern Prawn Fishery (trawling) 1.7 3.2 16.6 32.5 15.9 96.4
Western Deepwater Trawl Fishery (trawling) 0.5 0.5 3.5 3.3 –0.2 –4.6
Western Tuna and Billfish Fishery (longline, handline, troll and poling)
2.0* 0.6 11.7* 3.4 * Decreased
Commonwealth fisheries total 7.6 8.3 95.6 110.9 15.3 16.0
Kimberley Prawn Fishery (trawling) 13.2–16.3 17.3–23.6* 145.1–179.4 190.5–259.0* * Increased
Pilbara Fish Trap Fishery (trawling) 2.3 18.2 18.2 New
Mackerel Fishery (handline and troll line) 0.2* 1.1 2.3* 12.4 * Increased
Nickol Bay Prawn Fishery (trawling) 1.6–5.0 * 17.8–55.0 * * Decreased
Northern Shark Fishery (longline and gill net) * * * * * 22.6
Northern Demersal Scalefish Fishery (line and fish trap)
* * * * * No change
Shark Bay Prawn Fishery (trawling) 18.0 * 195.5 * * Decreased
West Coast Demersal Scalefish (dropline and handline)
1.4 11.2 11.2 New
West Coast Demersal Gillnet and Longline Fishery (demersal gillnet and demersal longline)
* * * * * –29.7
Trochus Fishery n.a. n.a. n.a. Removed
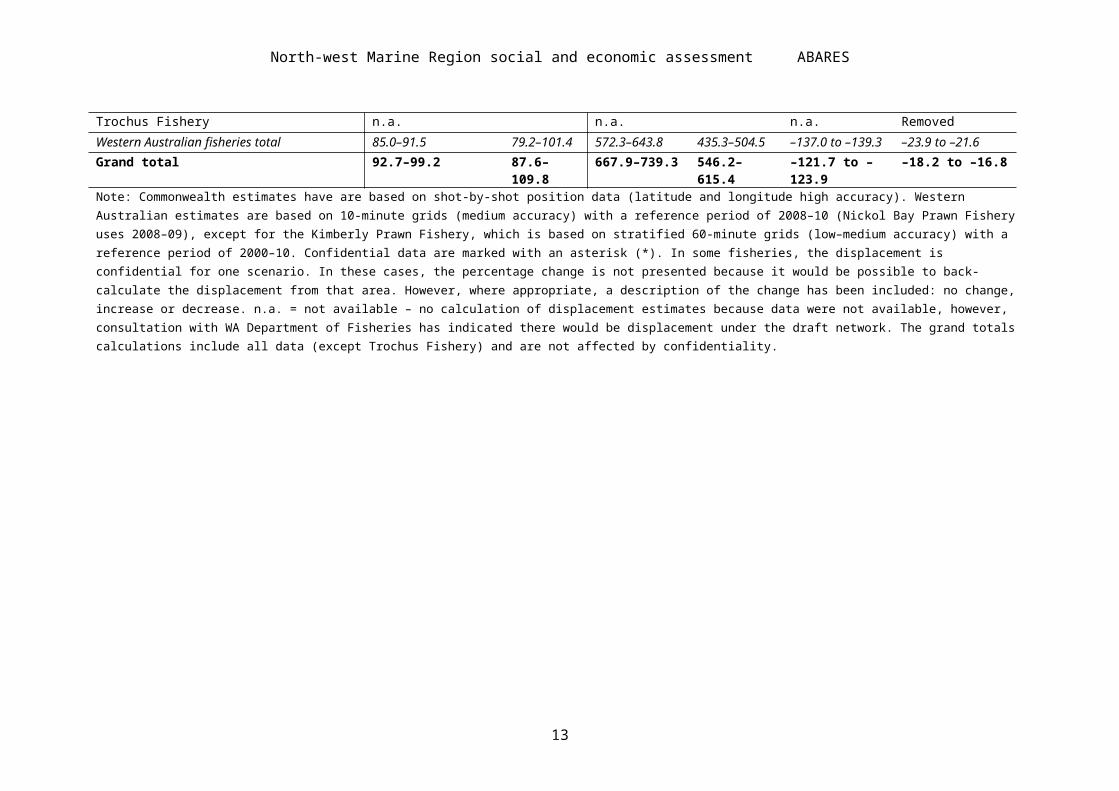
Western Australian fisheries total 85.0–91.5 79.2–101.4 572.3–643.8 435.3–504.5 –137.0 to –139.3 –23.9 to –21.6
Grand total 92.7–99.2 87.6–109.8 667.9–739.3 546.2–615.4 –121.7 to –123.9 –18.2 to –16.8
Note: Commonwealth estimates have are based on shot-by-shot position data (latitude and longitude high accuracy). Western Australian estimates are based on 10-minute grids (medium accuracy) with a reference period of 2008–10 (Nickol Bay Prawn Fishery uses 2008–09), except for the Kimberly Prawn Fishery, which is based on stratified 60-minute grids (low–medium accuracy) with a reference period of 2000–10. Confidential data are marked with an asterisk (*). In some fisheries, the displacement is confidential for one scenario. In these cases, the percentage change is not presented because it would be possible to back-calculate the displacement from that area. However, where appropriate, a description of the change has been included: no change, increase or decrease. n.a. = not available – no calculation of displacement estimates because data were not available, however, consultation with WA Department of Fisheries has indicated there would be displacement under the draft network. The grand totals calculations include all data (except Trochus Fishery) and are not affected by confidentiality.
8
North-west Marine Region social and economic assessment ABARES
Main findings for the final proposed network (released 14 June 2012)SEWPaC provided a final North-west Commonwealth Marine Reserves Network proposal (released 14 June 2012; Map 1) following consideration of submissions received during the public consultation period, as well as ABARES’ assessment of potential social and economic impacts associated with the draft North-west Commonwealth Marine Reserves Network.
Broadly, the potential impact of the final North-west Commonwealth Marine Reserves Network proposal remains small relative to the GVP of fisheries in the region, and is reduced when compared with the draft marine reserves network.
Potential displacement of fishing: The final North-west Commonwealth Marine Reserves Network proposal would displace an annual average of 87.6–109.8 tonnes of catch with a GVP of $546 200–$615 400 across both state and Commonwealth fisheries. The total comprises $110 910 would be displaced from Commonwealth fisheries, and $435 300–$504 500 from WA fisheries (Table 1). Overall total estimates represent a small proportion (0.37–0.42 per cent) of the collective fisheries GVP from potentially impacted fisheries ($146.3 million). These values are the totals for the potentially impacted fisheries in each jurisdiction and are not adjusted to account only for fishing in the North-west Marine Region.
Summary of impacts of the final North-west Commonwealth Marine Reserves Network proposal (Table 1):
Thirteen fisheries would potentially be impacted by the final proposed marine reserves network. The final proposed network would remove potential impacts on the WA Trochus Fishery, but would add the WA West Coast Demersal Scalefish and WA Pilbara Fish Trap fisheries to the impacted fisheries. Marginally higher impacts were identified for the Commonwealth North West Slope Trawl and the Northern Prawn fisheries under the final proposed network. The degree of impact would range from close to zero to approximately 20 per cent of the average annual total GVP of a fishery.
Under the final proposed network, the largest absolute impact in terms of catch remains the WA Northern Shark Fishery (estimates are confidential as they come from less than three vessels). However, the largest estimate for GVP displacement shifts to the WA Kimberley Prawn Fishery ($190 500*–259 040*, representing 5.5–7.5 per cent of the total annual average GVP of the fishery, additional confidential data is not presented).
The draft Multiple Use Zone in the Kimberley marine reserve (potential displacement $190 500–235 400 GVP) and the Argo-Rowley Terrace ($71 500; previously Pilbara) marine reserves (Map 1) would have the largest impact. These impacts will mostly be borne by the Commonwealth North West Slope Trawl Fishery, the WA Kimberley Prawn Fishery and the WA Northern Shark Fishery.
The displacement of the WA charter fishery is estimated to be lower under the final proposed network, with fewer than 5 clients per year potentially displaced, representing less than 0.07 per cent of total charter fishery clients in Western Australia.
The final proposed network represents a reduction from $667 900–739 300 (annual average GVP) under the draft network, to $546 200–615 400 under the final proposed network. This is a reduction of 16.8–18.2 per cent in the potential annual average GVP displacement overall, comprised of a 16 per cent increase for Commonwealth fisheries, and a 21.6–23.9 per cent decrease for WA fisheries. (Table 1).
9

North-west Marine Region social and economic assessment ABARES
There are cumulative impacts to some fisheries as a result of the final proposed reserve networks in South-west and North marine regions (ABARES 2012c, d).
Assessment of the draft reserves noted potential impacts to prospective fishing, some of which may have been mitigated and some of which may remain following the revisions. For example, the rezoning of the Gascoyne Marine National Park Zone to a Habitat Protection Zone will allow pelagic longline within the area identified as being historically important for the Western Tuna and Billfish Fishery, and should alleviate some of the impact on prospective fishing.
Flow of impacts: Potential impacts on commercial fishers were traced back to ports and coastal communities using information on landings under the final proposed network:
The final North-west Commonwealth Marine Reserves Network proposal will potentially impact 25 ports/towns through flow of displaced GVP. The primary towns would be Darwin, Broome, Fremantle, Geraldton, Kalbarri and Point Samson (in descending order of total flow of displaced GVP).
Newly identified impacted towns under the final North-west Commonwealth Marine Reserves Network proposal include Dampier, Denham, Desperate Bay, Dongara, Kalbarri and Onslow. Of these, Kalbarri ($7 600 displaced GVP) and Onslow ($4 130 displaced GVP) had the largest potential displacement under the final proposed network.
Key changes in the flow of GVP to ports under the final North-west Commonwealth Marine Reserves Network proposal include a significant reduction in the flow of displaced GVP for Carnarvon (decrease of $97 050, to approximately $850), Geraldton (decrease of $78 410) and Fremantle (decrease of $28 920).
Towns with the highest potential GVP and per capita displacement would be Darwin ($204 950 GVP potentially displaced; $3.09 GVP displaced per capita), Broome ($103 200; $8.90 per capita), Fremantle ($93 200; $3.91 per capita), Geraldton ($77 430; $4.09 per capita) and Point Samson ($30 560; $112.78 per capita).
Point Samson was identified as having the highest level of exposure, based on the GVP displaced per capita, which decreased 54 per cent under the final proposed network ($30 560 GVP potentially displaced; $112.78 GVP displaced per capita). Darwin, Broome, Fremantle and Geraldton all have exposure levels of less than $10.00 GVP displaced per capita.
Cumulative impacts identified for Darwin (from the draft North Commonwealth Marine Reserves Network (ABARES 2012c)) and Fremantle (from the draft South-west Commonwealth Marine Reserves Network (ABARES 2012d)) remain under the final proposed network.
Potential impacts on the economy: The impact of the final proposed marine reserves network is expected to scale linearly with the change in GVP impact. Under this assumption, the final North-west Commonwealth Marine Reserves Network proposal would have an estimated total regional net economic impact of $1.0 –$1.1 million, and a loss of approximately three jobs in the short term (using the upper estimate of potential displacement) in directly impacted regions.
Potential fishing business, community and personal impacts: ABARES has not undertaken additional consultation (surveys or interviews) with potentially impacted commercial fishing, charter or supply chain businesses, or individuals based on the final North-west Commonwealth Marine Reserves Network proposal. The nature of potential direct and secondary impacts, and other issues that may exacerbate impacts arising from the final proposed network, are likely to
10
North-west Marine Region social and economic assessment ABARES
be broadly similar to those identified for the draft North-west Commonwealth Marine Reserves Network.
Case studies: The case studies conducted for the draft North-west Commonwealth Marine Reserves Network were re-examined under the final North-west Commonwealth Marine Reserves Network proposal. No further consultation (surveys or interviews) with impacted fishers or interviewees was possible for this purpose.
Carnarvon—flow-on impacts to the community
Under the final proposed network, it is anticipated that the impacts described in this case study will have been mostly removed because the displaced flow of GVP to Carnarvon was reduced due to the changes to the boundary of the Shark Bay marine reserve.
Commonwealth Western Tuna and Billfish Fishery—displacement and prospective fishing
Impacts on prospective fishing as described in this case study are unlikely to have changed significantly, due to the nature of the prospective business plans in the North-west Marine Region. However, the rezoning of the Gascoyne Marine National Park Zone to a Habitat Protection Zone may lessen the impact on prospective fishing in this region. In contrast, the impacts on the potential displacement of the individual fisher in the Western Tuna and Billfish Fishery are perceived to have been significantly reduced due to the overall decrease in displacement estimates for this fishery, compared with the draft network
Shark Bay, Kimberley and Nickol Bay prawn fisheries—variability in prawn production
The explanation of the variability of prawn fishing grounds through time and its consequence for potential impacts remain relevant to the final proposed marine reserves. Potential displacement estimates for catch and GVP for the prawn fisheries are significantly altered under the final proposed network. Under the final proposed network the impacts estimated for the Nickol Bay Prawn Fishery have been removed by the change to the Eighty Mile Beach Marine Reserve, however, a new impact is identified in the new Dampier marine reserve. A reduction is observed in the displacement of the Shark Bay Prawn Fishery, while estimates for the Kimberley Prawn Fishery have increased.
Western Australian West Coast Demersal Gillnet and Longline Fishery—individual fisher
The impact on the West Coast Demersal Gillnet and Longline Fishery is reduced by 30 per cent under the final North-west Commonwealth Marine Reserves Network proposal. However potential impacts highlighted in this case study are likely to remain. The fisher highlighted that some of his income is also derived from the West Coast Demersal Scalefish Fishery, which is one of the additional impacted fisheries under the final North-west Commonwealth Marine Reserves Network proposal.
11
North-west Marine Region social and economic assessment ABARES
Draft North-west Commonwealth Marine Reserves Network proposalThis section of the report provides the social and economic assessment of the draft North-west Commonwealth Marine Reserves Network that was released in August 2011 (SEWPaC 2011b) and open for public consultation for 90 days until 28 November 2011.
12

North-west Marine Region social and economic assessment ABARES
1 Background and introductionThe Australian Government is undertaking a marine bioregional planning program in Commonwealth waters. The program includes identifying areas for inclusion in the National Representative System of Marine Protected Areas.
For background to marine bioregional planning in the North-west Marine Region and the establishment of Commonwealth marine reserves, see:
Marine bioregional plan for the North-west Marine Region: draft for consultation (SEWPaC 2011a)—describes the marine environment and conservation values (protected species, protected places and key ecological features) of the North-west Marine Region, sets out broad objectives for its biodiversity, identifies regional priorities, and outlines strategies and actions to achieve these.
Proposal for the North-west Commonwealth Marine Reserves Network: consultation paper (SEWPaC 2011b)—presents a proposal for the North-west Marine Region marine reserves network, as well as rationale and design principles.
The North-west Marine RegionThe North-west Marine Region encompasses all Commonwealth waters from the Northern Territory – Western Australia border, extending west and south to near Kalbarri in Western Australia (Map 2). Commonwealth waters extend from 3 nautical miles offshore from the territorial sea baseline, out to the 200 nautical mile limit of Australia’s exclusive economic zone. The North-west Marine Region is adjacent to Western Australian (WA) state jurisdictional waters, and some of the state-managed fisheries overlap the Commonwealth boundaries. Western Australia is responsible for managing 17 fisheries in this region through Offshore Constitutional Settlement arrangements; the Commonwealth is responsible for 4 fisheries.
The North-west Marine Region encompasses waters over the continental shelf, continental slope, continental rise and abyssal plains. The shallower waters of the continental shelf typically range from 10 metres to 200 metres deep. The meeting point of the shelf and slope is often referred to as the ‘shelf break’; the majority of fishing activity occurs inshore of the shelf break. The region is important for the petroleum industry and commercial fishing, and some areas are also important for national defence (DEWHA 2008). A more detailed description of the North-west Marine Region can be found in the North-West Marine Region bioregional profile (DEWHA 2008).
The Australian Government has proposed a draft marine reserves network across the North-west Marine Region (SEWPAC 2011b). This draft North-west Commonwealth Marine Reserves Network has different levels of zoning (based on the International Union for Conservation of Nature [IUCN] categories), which affect whether fishing activities may or may not occur within an area. The zone levels in the North-west Marine Region are:
Marine National Park Zone (green)—all fishing excluded
Multiple Use Zone (light blue)—demersal trawl, demersal gillnet and demersal longline excluded.
The North-west Marine Region contains 10 proposed draft marine reserves: Kalbarri, Abrolhos (Wallaby extension), Shark Bay, Carnarvon Canyon, Gascoyne, Pilbara, Eighty Mile Beach, Kimberley, Oceanic Shoals and Joseph Bonaparte Gulf (Map 2).
13
North-west Marine Region social and economic assessment ABARES
ABARES has allocated an area number to help distinguish reserve areas that have varied zoning (Map 2). The potential displacement of commercial fishing (in terms of gross value of production [GVP]) by a marine reserve was analysed for each reserve at the zone level.
Map 2 Draft North-west Commonwealth Marine Reserves Network with zones and area numbering
EEZ = Exclusive Economic Zone. Data source: Marine reserve boundary from the Australian Government Department of Sustainability, Environment, Water, Population and Communities; coastline and bathymetry from Geoscience Australia.
Fisheries in the North-west Marine RegionCommercial fishing is generally defined as the take of fish and other marine life for commercial purposes. In this report, commercial fishing refers to the wild-catch sector (as opposed to aquaculture). A range of commercial fisheries operate within the North-west Marine Region, and some of these are potentially impacted by the draft marine reserves network. Reference information is provided in Table 2 for the subset of potentially impacted fisheries in the North-west Marine Region that are managed under the jurisdictions of Western Australia or the Commonwealth.
A map of total fisheries GVP for all jurisdictions in the North-west Marine Region is provided in Map 3 (note that these data are somewhat dated, but the overall patterns of fishing at this scale have not changed). Generally, the most valuable fishing grounds are located on, or at the edge of, the continental shelf, which extends out to a depth of 200 metres. Fishing in offshore oceanic waters is predominantly pelagic tuna longline, although some trawling and fish trapping also occurs.
14
North-west Marine Region social and economic assessment ABARES
Some valuable WA fisheries operate partially within the North-west Marine Region, including the West Coast Rock Lobster Fishery ($183 million GVP in 2009–10), Pearl Oyster Fishery ($99 million), Shark Bay Prawn Fishery ($19 million), Shark Bay Scallop Fishery ($5.5 million), Northern Demersal Scalefish Fishery ($5.4 million) and Pilbara Fish Trawl Fishery ($3.6 million) (WA DoF 2011). The value of the Commonwealth wild-catch fisheries in the North-west Marine Region is relatively low on an Australia-wide scale. The Northern Prawn Fishery is the most valuable Commonwealth fishery in the North-west Marine Region ($88 million GVP in 2009–10). However, only a small proportion of this fishery directly operates within the North-west Marine Region; the majority of this fishery operates in the adjacent North Marine Region (DEWHA 2008). Other Commonwealth fisheries operating in the North-west Marine Region are the North West Slope Trawl Fishery, the Western Deepwater Trawl Fishery and the Western Tuna and Billfish Fishery (GVP is confidential for each of these fisheries; ABARES 2011, Woodhams et al. 2011).
The draft North-west Commonwealth Marine Reserves Network overlaps some high-value fishing areas, particularly areas inside the shelf in the draft Kalbarri (area 101), Shark Bay (area 102) and Kimberley (area 111) marine reserves. Most draft reserves in the North-west Marine Region are zoned so that they do not displace most high-value fisheries. However, there is potential for displacement of a variety of other valuable fisheries, such as those that use trawl (which is excluded from all zones).
Charter fishing in Commonwealth waters off Western Australia is managed by the state government. Charter fishing is generally defined as a commercial fee-for-service operation that provides services relating to the taking, capture or catching of fish as part of recreational fishing activities.
15
North-west Marine Region social and economic assessment ABARES
Table 2 Reference information for potentially impacted fisheries within the North-west Marine RegionFishery Management
arrangementsTarget species Number of
licencesNumber of active vessels
Employment Catch Sources
Commonwealth
Western Deepwater Trawl Fishery
Limited entry, catch trigger levels
Deepwater bugs, orange roughy, ruby snapper
11 permits (2009–10)
3 (2009–10)
n.a. 34.3 t (2009–10)
ABARES 2011; Woodhams et al. 2011
North West Slope Trawl Fishery
Limited entry, gear restrictions, catch limits for some species
Scampi (various species), deepwater prawns (byproduct)
7 permits(2009–10)
2(2009–10)
n.a. 2 t(2009-10)
Woodhams et al. 2011
Western Tuna and Billfish Fishery
SFR, limited entry, gear and area restrictions, TAC, ITQ, bycatch restrictions
Albacore, bigeye, yellowfin and longtail tuna, broadbill swordfish, striped marlin
93 SFR holders3 carrier boat permits (2010)
3 longline 1 minor line (2010)
n.a. 464 t (2010)
ABARES 2011; Woodhams et al. 2011
Northern Prawn Fishery Limited entry, gear restrictions including individual tradeable gear units, spatial and temporal closures, SFR
Banana, tiger, endeavour and king prawns (various species)
52 permits(2010)
52 (2010)
n.a. Banana: 5642 tTiger: 1628 TEndeavour: 429 t(2010)
AFMA 2010a; Woodhams et al. 2011
Western Australia
Kimberley Prawn Fishery Limited entry, effort controls, seasonal closures, gear controls, restrictions on vessel replacements, closed areas
Banana prawns, also some tiger, endeavour and western king prawns
126(2010)
13(2010)
n.a., but 11 boats operated for 448 days(2009)
220 t(2009)
Fletcher & Santoro 2010; 2011
Mackerel Fishery Limited entry, gear restrictions, minimum size, ITQ, TAC
Spanish mackerel and grey mackerel
65 permits(2010)
38 permits are active on 3, 4 and 7 boats operating within areas 1, 2 and 3, respectively(2009)
42 people for 6 months(2007)
296 t (2009)
Fletcher & Santoro 2010; 2011
Nickol Bay Prawn Fishery Limited entry, temporal and spatial closures, gear controls, TAE
Banana, western king, brown tiger and endeavour prawns
14 (2007)
3(2010)
n.a., but 3 boats operated for 69 days(2010)
40 t (2010) Fletcher & Santoro 2010; 2011
16
North-west Marine Region social and economic assessment ABARES
Fishery Management arrangements
Target species Number of licences
Number of active vessels
Employment Catch Sources
Northern Demersal Scalefish Fishery (Kimberley)
Closed area, TAE, gear controls, notional TAC
Tropical snapper, emperors, groupers
11 licences under ITE(2010)
7 vessels collectively operated the assigned effort for the 11 licences(2010)
At least 21 people (2010)
1116 t(2010)
Fletcher & Santoro 2010; 2011
Northern Shark Fisheries (Northern Shark)
Limited entry, TAE, gear restrictions, spatial and seasonal closures
Sandbar, blacktip, tiger and lemon sharks
Not reported 2 3–5 part-time per vessel (2009)
231 t(mean annual catch between 2006–07 and 2008–09)
Fletcher & Santoro 2010; 2011
Pearl Oyster Fishery TAC, ITQ, minimum size limit, spatial management (area-specific TAC, maximum size limit), limited entry
Indo-Pacific silver-lipped pearl oyster
572 wild-stock ITQ units allocated across three management zones (Zone 1 = 115 units; Zone 2 = 425 units; Zone 3 = 32 units) 350 hatchery ITQ units allocated among 14 pearling licensees(2010)
4vessels, 4447 dive hours (2010)
10–14 part-time per vessel(2010)
397, 947 oysters (2010)
Fletcher & Santoro 2010; 2011
Shark Bay Prawn (and Scallop) Fishery
Limited entry; spatial, moon phase and temporal closures; gear controls, gear restrictions
Mainly king and tiger prawns
27 Shark Bay Prawn Fishery only. In 2009, industry bought back 9 inactive licences, resulting in 18 active licenses
18 (Shark Bay Prawn Fishery only) (2010)
150 skippers and crew,100 processing staff at Carnarvon, Geraldton and Fremantle (2010)
1545 t prawns 1592 t scallops(2010)
Fletcher & Santoro 2010; 2011
17

North-west Marine Region social and economic assessment ABARES
Fishery Management arrangements
Target species Number of licences
Number of active vessels
Employment Catch Sources
Western Australian Trochus Fishery
Maximum and minimum size limits, spatial closures, annual quota, reef walking/wading only (no diving), all trochus must be sold through one central point
Trochus niloticus Approximately 30 n.a. n.a. 10 t dry weight (13 t live weight).
WA DoF (unpublished data)
West Coast Demersal Gillnet and Longline (Interim) Managed Fishery
Limited entry, effort controls, temporal closures, gear restrictions, maximum legal size limit for one target species
Dusky, sandbar and whiskery shark
20 (2009–10) 4 (2010) 9 skippers and crew (2009–10)
Shark: 198.1 t Scalefish: 35.3 t (2009–10)
Fletcher & Santoro 2010; 2011
West Coast Demersal Scalefish Fishery
Limited entry, gear restrictions, max no. hours annually, total catch limit
West Australian dhufish (Glaucosoma hebraicum) and pink snapper (Pagrus auratus), but also catch substantial numbers of up to 100 other species
60 permits 50 N/A, estimates assume on average 1–3 crew members per boat
365 t (2010) Fletcher & Santoro 2010; 2011
ITE = individual transferable effort; ITQ = individual transferable quota; n.a. = not available; SFR = statutory fishing rights; t = tonne; TAC = total allowable catch; TAE = total allowable effort; VMS = vessel monitoring system
18
North-west Marine Region social and economic assessment ABARES
Demographics of the North-west Marine RegionThe coastal areas of the North-west Marine Region incorporate a diverse range of individuals and communities that are linked to the commercial fishing industry. As would be expected from such a large area—much of which is very remote—there is diversity in the inhabitants, industries, economies and standards of living. Mining, oil and gas industries form a large part of the economy in the region.
These differences play an important role in how the potential impacts of the draft North-west Commonwealth Marine Reserves Network will be felt by individuals, businesses and communities, and how they will respond to these changes.
Key indicators of social and economic characteristics of the communities in the North-west Marine Region are listed in the Appendix F: Summary information on flow of impacts, supply chains and demographics of communities.
Employment in the fishing industryThe Australian Bureau of Statistics (ABS) collects data on direct employment within the commercial fishing sector through the census. Data from the 2006 census provides an indication of employment in the consolidated fishing industry by state and statistical local area (SLA). These data include direct commercial fishing and aquaculture employment, as well as wholesaling and seafood processing. It should be noted that census employment data are not collected at a level that can distinguish between Commonwealth and state fisheries. In addition, it is believed that these data are not disaggregated in sufficient detail, because they tend to under-report the number of employees by allocating them to other industries (FRDC 2004).
The 2006 census showed that Western Australia employs about 15 per cent of the total Australian fishing industry (Table 3).
Table 3 Estimated direct employment in the Australian fishing industry (full-time equivalent positions)
Wild catch fishing Processing Wholesaling Total
Western Australia 1080* 359 454 1893
Australia 6217* 2 002 4202 12 421Note: * Includes offshore aquaculture. Data source: Australian Bureau of Statistics census data, August 2006
Map 3 shows the proportion of individuals employed in the consolidated fishing industry (commercial fishing including aquaculture, fish wholesaling and seafood processing), based on 2006 census data. The SLAs with the highest dependency ratio for consolidated fishing industry employment adjacent to the North-west Marine Region include Exmouth (7 per cent of the workforce in the fishing industry), Carnarvon (4.3 per cent), and Shark Bay (3.8 per cent). Others include Ashburton (0.12 per cent), Roebourne (0.1 per cent), Broome (2 per cent), Derby West Kimberley (0.5 per cent) and Wyndham–East Kimberley (0.3 per cent).
19
North-west Marine Region social and economic assessment ABARES
Map 3 All commercial fishing gross value of production (GVP) in the North-west Marine Region, employment in the consolidated fishing industry and draft North-west marine reserves
Data sources: commercial fishing GVP from Larcombe et al. 2006; marine reserve boundaries from Australian Government Department of Sustainability, Environment, Water, Population and Communities; fishing industry employment from Australian Bureau of Statistics census data, 2006.
Scope of workABARES was commissioned by the Australian Government Department of Sustainability, Environment, Water, Population and Communities (SEWPaC) to assess the social and economic implications of the proposed draft Commonwealth marine reserves network in the North-west Marine Region. The assessment focuses on impacts to commercial and charter fisheries, and the implications for associated local communities and regional economies.
Goals To develop and refine estimates of the potential displacement of commercial fishing
activity (including charter fishing) from the draft marine reserves network.
To provide quantitative and qualitative information about the way commercial fisheries inputs and outputs interact with regional economies and associated local communities. This includes potential short-term and longer term responses of those economies and communities to the levels and types of displacement estimated for the draft marine reserves network. This information is required to assess potential short-term and longer term impacts on employment and economic flows at local (e.g. key ports) and regional levels.
20
North-west Marine Region social and economic assessment ABARES
To provide quantitative and qualitative information about the degree of economic dependence of individual fishers and local communities on fisheries that will potentially be displaced by the draft marine reserves network.
To provide sufficient data and information about the methods, structure and patterns of potentially affected fisheries to ensure that changes in the design of draft marine reserves can be evaluated for their relative social and economic impacts.
To provide suitable information to be incorporated in the regulatory impact statement for the draft marine reserves network to ensure that the economic and social costs of the proposals are transparent to government.
The social and economic assessmentThis assessment relates to the impacts on commercial and charter fishing of the draft North-west Commonwealth Marine Reserves Network that was open for public consultation during August–November 2011.
The Australian Government produced a final North-west Commonwealth Marine Reserves Network proposal following consideration of public submissions. ABARES completed an abridged assessment on final proposed network, which is contained in the supplementary section at the end of this report.
The assessment centred on three main elements:
1) Estimates of direct displacement of commercial and charter fishing by draft marine reserves
This analysis aimed to provide an indication of the potential fishery catch that would be displaced by the draft marine reserves network and place a value on those displaced catches. This was undertaken using the best available fisheries logbook data from each jurisdiction in the period 2000 to 2010.
2) Social impact assessment
The social impact assessment included an extensive survey of commercial and charter fishers and fishing businesses that may be affected by the draft marine reserves. This survey allowed ABARES to better understand the impacts on individuals and businesses, as well as indirect impacts on the supply chain. The assessment also included in-depth interviews with some industry and community stakeholders, as well as workshops and focus groups in some regions. Secondary data from the Australian Bureau of Statistics were used to understand the socioeconomic characteristics of the fishing sector and communities.
3) Subregional economic modelling
In assessments of other marine regions, economic modelling was undertaken on selected subregions to determine the short-term and long-term impacts of the draft marine reserves on employment and gross regional production. No subregions were examined within the North-west Marine Region; however, modelling was undertaken for Darwin, which included impacts from both the North-west and North marine regions. This is reported fully in the North Marine Region assessment.
21

North-west Marine Region social and economic assessment ABARES
The assessment provides a variety of information and perspectives on potential impacts. In general, the report progresses from large-scale aggregate impacts across the entire marine reserves network in the early chapters, through to a finer scale where the potential impacts to towns, businesses and people are covered. Different data were used to estimate or infer potential impacts at each scale; for example, the chapter 'Potential displacement of fishing' relied on fisheries logbook data collected by fisheries management agencies, while the chapter 'Flow of potential impacts to ports and supply chains' relied on logbook data and a survey of impacted businesses. The chapters 'Impacts on fishing businesses' and 'Personal and community impacts' are drawn predominantly from the survey of impacted businesses, but also from focus groups and interviews. Finally, the set of four case studies uses a range of different data and approaches. Three of the case studies use a narrative approach to ‘tell the fishers' story’ about potential impacts. For the most part, we have simply reflected the individuals’ perceptions of impact in these case studies.
It was not always possible to cross-check information across chapters or scales. For example, cross-checking the stated business impacts with estimates of potential GVP displacement was not possible on a case-by-case basis because individual logbook data were not available. However, where possible, information from other parts of the report is given to provide context. The assessment necessarily relies on responses from individuals through the survey, focus groups or interview data collection. The survey, focus groups and interviews were specifically directed at potentially impacted parties, so results from these data represent this potentially impacted group and not the wider commercial fisher population in the North-west Marine Region.
In developing this draft assessment, ABARES consulted and was guided by a working group of representatives from the Western Australian Department of Fisheries, the Commonwealth Fisheries Association, the Western Australian Fishing Industry Council (WAFIC) and SEWPaC. The working group met via teleconference every 1–2 weeks. ABARES also sought the assistance of industry liaison officers, operating through WAFIC, to help coordinate activities such as the survey and focus groups, relay industry concerns about the scope of impacts and comment on the assessment approach.
22

North-west Marine Region social and economic assessment ABARES
2 Potential displacement of fishingThis chapter provides estimates of the quantities of catch for commercial fisheries that would potentially be displaced by the draft North-west Commonwealth Marine Reserves Network. These estimates are derived from historical catches during the period 2000–10, although reference periods for individual fisheries varied depending on data availability. The gross value of production (GVP) of the potentially displaced catch has also been estimated. This value is intended to reflect recent (2008–10) landed prices or beach prices for product. All values and prices have been adjusted to account for inflation and are expressed in 2010–11 dollars. A full technical explanation of methodology is in Appendix A: Fisheries data processing methods. Where a range of values is reported, the first figure is a best ‘point estimate’ following the methodology and the second figure is an upper bound based on commentary from the fishing industry or additional analysis.
ABARES used logbook data as collected by the Western Australian Department of Fisheries (WA DoF) and the Australian Fisheries Management Authority (AFMA), together with price data from WA DoF and ABARES to estimate the potential catch and GVP displaced by the draft marine reserves network. The following caveats apply to the estimates:
GVP is a relatively simple aggregate measure of the level of commercial fishing activity. See Box 1 for a discussion of more complete measures of the impact of area closures.
The use of historical GVP information to estimate the impact on future fishing activities (i.e. the opportunity cost) should be interpreted with caution. This is because GVP will vary with market demand, inflation, exchange rates and the reference period of analysis. Potential displacement estimates may not incorporate the impact of any changes in fishery management, or historical or long-term cyclical fluctuations in fish stocks, and ignores potential future harvests.
GVP is the assessed value of commercial fishery products at the point of landing for the quantity produced and excludes the cost of transporting, processing and marketing of fish products for wholesale and retail markets (Box 1). It does not take into account asset values (e.g. fishing access rights, boats, shore-based infrastructure) or flow-on effects, such as value-adding and other potential benefits to individuals and communities.
Potential displacement estimates are given as annual means spanning up to 11 years. Catches in the most recent years may have been higher or lower than the mean. For example, the Commonwealth Western Tuna and Billfish Fishery was a large fishery in the late 1990s; however, due to changes in management and costs of operating effort, participation declined sharply in the 2000s and has remained low in recent years. In addition, there is inherent catch variability as a result of environmental influences in the prawn fisheries, and annual catch fluctuates significantly around the mean.
Potential displacement calculations are based on different reference periods depending on the jurisdiction. Catch data for Commonwealth fisheries are over a 10-year reference period (2001–10); data for the Western Australian (WA) Kimberley Prawn Fishery are over an 11-year reference period (2000–10). The reference period for all other WA fisheries was 2008–10 because higher resolution spatial data (10 minutes) were available for that period. GVP was calculated from average 'recent' prices rather than the price in the year the catch was taken (see Appendix A: Fisheries data processing methods; Table 19).
The reduction in total GVP following closure of a particular fishing ground is likely to be less than the historical GVP associated with catches in those grounds. Fishers may be able
23

North-west Marine Region social and economic assessment ABARES
to move to alternative fishing grounds and maintain a similar level of activity, catch and viability of their operations. This may not be the case in some fisheries, and will depend on a number of (potentially interrelated) factors, such as economics, distance to port facilities, management arrangements, availability of target species and the suitability of fishing grounds in adjacent areas.
Box 1 Assessing the economic impact of marine reserves
A variety of different approaches can be used to assess the economic impact of marine reserves. Using historical commercial fishery gross value of production (GVP) and a range of qualitative information is a first step in assessing these impacts.
A full economic assessment would account for all use and non-use values associated with the relevant marine resources, and would estimate the difference between the flows of goods and services over a defined time horizon, both with and without the proposed reserve arrangements.
A standard approach for commercial fishing would be to estimate the change in the net present value (NPV) of future net revenues from the affected fisheries under the proposed area closures. Varying levels of sophistication can be brought to this calculation. Ideally, the assessment would take into account the effects of the closures on recruitment and catchability, changes in fishery management related to the area closures, the costs of accessing alternate fishing grounds and the behavioural response of fishers to the area closures.
Estimating historical fishery revenue is relatively straightforward, but cost information is less readily available. Regular surveys are available for Commonwealth fisheries (see ABARES 2011a).
Using a gross revenue measure, such as GVP, does not account for the costs involved in generating that revenue or net revenues generated by downstream industries. The spatial variations of these costs affect the value of different fishing grounds.
Temporal factors are important to consider under different valuation approaches. In response to area closures, fishers may shift their effort to other areas and possibly other fisheries within fishery management and profitability constraints. Historical measures give some indication of how much of a shock is applied to different fisheries, but while some fisheries may be able to adjust to a large shock with relatively little reduction in net revenues others may be forced to contract—if, for example, no other fishing grounds are available. In addition, some increase in stocks and resilience of stocks to environmental shocks may result from area closures. However, predicting the magnitude of these effects is difficult.
GVP is a relatively simple aggregate measure of the level of commercial fishing activity. However, caution should be used if historical GVP information is used to estimate the impact of marine reserves on future fishing activities. The reduction in total GVP following closure of particular fishing grounds is likely to be less than the historical GVP associated with catches in those grounds.
Impacts on the wider economyThis assessment uses a model to examine the impact of a contraction in the fisheries sector on the wider economy. The AusRegion dynamic computable general equilibrium model of the Australian economy is used to examine the net economic impact of a marine reserves network to part, or all, of the Australian economy. The economic effects of the changes are reported as changes in gross product at the regional, state and national level. The historical GVP measures are likely to overestimate the impact of the marine reserves and thus the broader estimates of
24

North-west Marine Region social and economic assessment ABARES
economic impact should be interpreted as upper bound estimates.
Area closures and entitlement values Fishing entitlements derive their value from the profits that fishers expect to earn from the fishing access rights that entitlements provide. Restricting access to a fishery through area closures, such as marine reserves, may directly affect the future commercial returns that can be generated and as such would be expected to affect the value of fishing entitlements.
Area closures can potentially affect the value of a fishery and its entitlements in a number of ways. Most obviously, exclusion from historical fishing grounds will reduce access to known productive areas and can be expected to reduce fishery profits in the immediate and longer term. Exclusion from fishing grounds that are currently unprofitable may also affect the value of a fishing entitlement; for example, changes in fish prices or fishing costs may significantly improve the attractiveness of currently unused areas. The option to develop new areas of a fishery has some value and may be affected by changes in fishing access arrangements.
Secondary effects of area closures may also affect the value of fishing entitlements. For example, an area closure may affect stock availability in adjacent areas, changing the productivity of areas which remain open. The net effect of all of these factors will be reflected in the change in value of fishery entitlements.
Commercial fishing potential displacement The draft North-west Commonwealth Marine Reserves Network would potentially displace an annual average of 92.7– 99.2 tonnes of catch with a gross value of $667 900–$739 300. Of this, $95 600 would be displaced from Commonwealth fisheries, and $572 300–$643 800 from WA fisheries (Table 4). These values do not include the WA Trochus Fishery because data were unavailable; therefore, values of potential displacement for catch and GVP could not be quantified. However, this fishery is listed as potentially impacted: consultation with the WA Department of Fisheries indicated displacement as a result of the Kimberley marine reserve (area 112). For comparison, the total value of the 12 potentially impacted fisheries across both state and Commonwealth jurisdictions is $136.7 million: $41.6 million for WA fisheries (mean annual GVP for the reference period) and $95.1 million for the Commonwealth (mean annual 2000–10, of which the Northern Prawn Fishery accounts for $89 million). These values are the totals for the potentially impacted fisheries in each jurisdiction and are not adjusted to account only for fishing in the North-west Marine Region.
The largest potential impacts in the North-west Marine Region are in the Shark Bay (area 102), Pilbara (area 108) and Kimberley (area 111) marine reserves (Table 5 to Table 9). The most impacted fisheries in terms of absolute tonnage and GVP would be the Commonwealth North West Slope Trawl Fishery, the WA Shark Bay Prawn Fishery, the WA Kimberley Prawn Fishery and the Northern Shark Fishery (Table 4). The WA Kimberley Prawn Fishery and Northern Shark Fishery would be the next most affected fisheries for displaced GVP and catch, respectively. Other fisheries potentially affected by the draft North-west Commonwealth Marine Reserves Network are the Commonwealth Northern Prawn, Western Deepwater Trawl and Western Tuna and Billfish fisheries, and the WA Mackerel, Nickol Bay Prawn, Northern Demersal Scalefish, West Coast Demersal Gillnet and Demersal Longline, and Trochus fisheries.
25

North-west Marine Region social and economic assessment ABARES
The potential impact of the draft North-west Commonwealth Marine Reserves Network on individual fisheries is relatively small compared with the total value of these fisheries. For example, the displacement estimates for the North West Slope Trawl Fishery suggest that 6.21 per cent of the total value of the fishery would be displaced—this was the most impacted of the Commonwealth fisheries. For WA fisheries, the greatest percentage impact for both catch and GVP would be to the WA Northern Shark Fishery (displacement estimates are confidential); however, this fishery ceased operation in 2009. The next highest percentage impacts would be the WA Kimberley Prawn Trawl Fishery (4.2 to 5.2 per cent of total average annual GVP) and the West Coast Demersal Gillnet and Longline Fishery (displacement estimates are confidential).
The draft North-west Commonwealth Marine Reserves Network contains relatively large areas of marine reserve. However, the potential impact to most fisheries is relatively low because much of the highly protected marine reserve areas (Marine National Park Zones) are located off the continental shelf, in deeper waters. Most of the potential impact would occur to fisheries operating on the shelf and relatively close to land (Table 5 to Table 9). The exceptions to this are the Commonwealth Western Tuna and Billfish Fishery and the North West Slope Trawl Fishery, which operate off the shelf in deep oceanic waters (Table 5 and Table 6).
Note that the estimates for the Commonwealth Northern Prawn Fishery arise from catch reported within the WA Kimberley Prawn Fishery management area, suggesting some misallocation of catch between fisheries; however, these estimates were retained because they represent recorded catch. The potential displacement of the Kimberley Prawn Fishery is likely to be overestimated because the analysis method does not fully account for the staggered nature of effort within fishing grounds, which is likely to mean that less fishing is occurring within the marine reserves (which tend to be at the margins of the fishing grounds). Better estimates would require better trawl ground mapping or detailed data on positions of shots.
26

North-west Marine Region social and economic assessment ABARES
Table 4 Estimates of Commonwealth and Western Australia fishery catch and gross value of production (GVP) that would be potentially displaced by the draft North-west Commonwealth Marine Reserves Network (Map 2)
FisheryTotal catch (tonnes)
Total GVP ($’000)
Percentage of fishery GVP
Commonwealth fisheries
North West Slope Trawl Fishery (trawling) a 3.4 63.6 6.2
Northern Prawn Fishery (trawling) a 1.7 16.6 0.0
Western Deepwater Trawl Fishery (trawling) a 0.5 3.5 0.3Western Tuna and Billfish Fishery (longline, handline, troll and pole and line) a 2.0* 11.7* 0.2
Commonwealth fisheries total 7.6 95.6 0.1
Western Australian fisheries
Kimberley Prawn Fishery (trawling) b, d 13.2–16.3c 145.1–179.4c 4.2-5.2
Mackerel Fishery (handline and troll line) c 0.2* 2.3* 0.1
Nickol Bay Prawn Fishery (trawling) c, d 1.6–5.0c 17.8–55.0c 1.5
Northern Shark Fishery (longline and gill net) c * * *Northern Demersal Scalefish Fishery (line and fish trap) c * * *
Shark Bay Prawn Fishery (trawling) c 18.0 195.5 0.8West Coast Demersal Gillnet and Longline Fishery (demersal gillnet and demersal longline)c * * *
Western Australian Trochus Fishery n.a. n.a. n.a.
Western Australian fisheries total 85.0–91.5 572.3–643.8 1.5-2.1
Grand total 92.7–99.2 667.9–739.3 0.5n.a. = not available – no calculation of displacement estimates because data were not availablea = confidential catch and GVP data for Commonwealth fisheries based on shot by-shot position data (latitude and longitude, high accuracy)b = confidential catch and GVP data for WA fisheries using a 60-minute reporting grid; c = confidential catch and GVP data for WA fisheries using a 10-minute reporting grid; d = upper and lower estimates* = confidential data. In some fisheries, only one area is confidential; in these cases, the total does not include the confidential data as it would be possible to back-calculate the displacement from that area. The grand totals for catch and GVP include all data and are not affected by confidentiality.
27
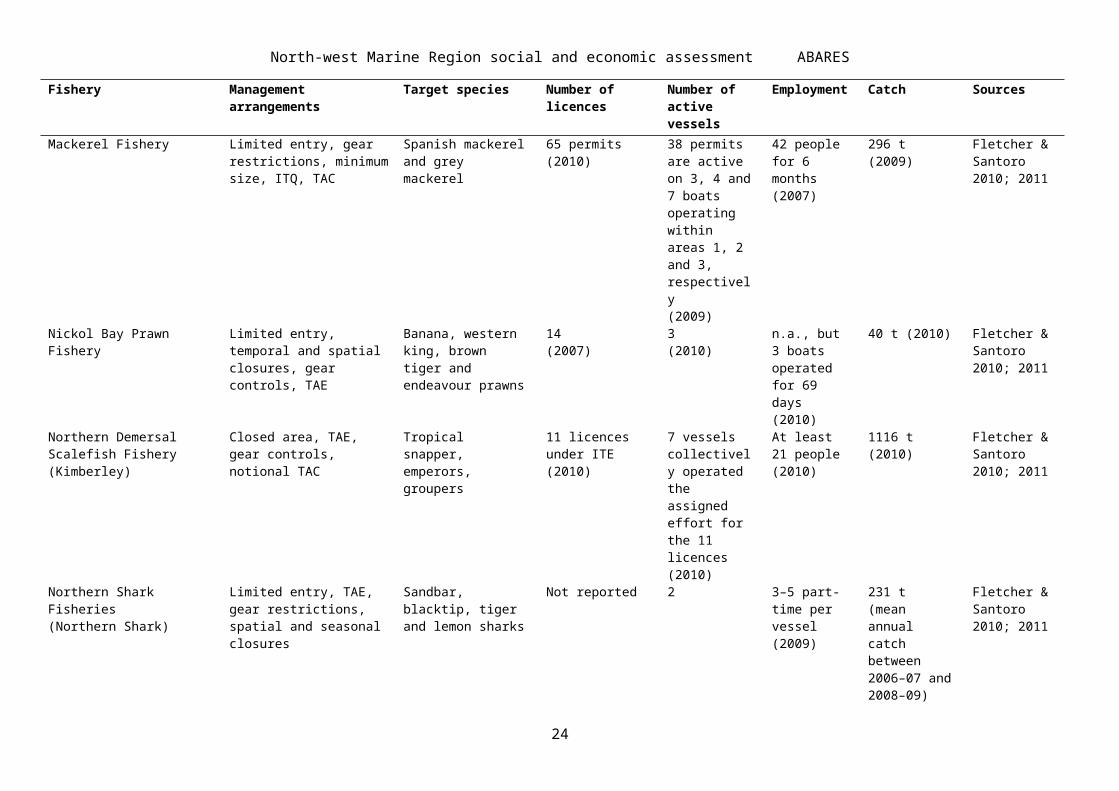
North-west Marine Region social and economic assessment ABARES
Commonwealth fisheries—catch Table 5 Estimates of mean annual potential catch displaced by the draft North-west Commonwealth Marine Reserves Network from Commonwealth fisheries over the 2001–10 reference period
Catch (tonnes)
Kal
bar
ri
Shar
k B
ay
Ab
rolh
os
Gas
coyn
e
Eigh
ty M
ile
Bea
ch
Pil
bar
a
Kim
ber
ley
Oce
anic
Sh
oals
Jose
ph
B
onap
arte
Tot
al
Per
cen
tage
of
tota
l fis
her
y ca
tch
Fishery 101 102 103 105 106 107 108 109 111 114 115North West Slope Trawl Fishery (trawling) * 3.4 * * 3.4 5.1
Northern Prawn Fishery (trawling) * * 1.7 0.0
Western Deepwater Trawl Fishery (trawling) * <0.05 * 0.4 * 0.5 0.5Western Tuna and Billfish Fishery (longline, handline, troll and poling)
2.0 * 2.0* 0.2*
Total * <0.05 *0.4
*2.0* 3.4 * * * * 7.6 0.1
Multiple Purpose Zone Marine National Park ZoneNote: Confidential data are marked with an asterisk (*). In some fisheries, only one area is confidential. In these cases, the total does not include the confidential data because it would be possible to back-calculate the displacement from that area. These are denoted by showing the sum of the non-confidential areas followed by an asterisk (e.g. 2.0*). The grand total at the bottom right includes all data and is not affected by confidentiality. Fisheries that did not report activity in the draft marine reserves network or used incompatible methods for the zoning are not included in the table. Estimates have high accuracy because they are based on shot-by-shot position data (latitude and longitude).
28

North-west Marine Region social and economic assessment ABARES
Commonwealth fisheries—gross value of productionTable 6 Estimates of mean annual potential gross value of production (GVP) displaced by the draft North-west Commonwealth Marine Reserves Network from Commonwealth fisheries over the 2001–10 reference period
GVP ($’000)
Kal
bar
ri
Shar
k B
ay
Ab
rolh
os
Gas
coyn
e
Eigh
ty M
ile
Bea
ch
Pil
bar
a
Kim
ber
ley
Oce
anic
Sh
oals
Jose
ph
B
onap
arte
Gu
lf
Tot
al
Per
cen
tage
of t
otal
fi
sher
y ca
tch
Fishery 101 102 103 105 106 107 108 109 111 114 115North West Slope Trawl Fishery (trawling) * * 63.4 * * 63.6 6.2
Northern Prawn Fishery (trawling) * * 16.6 0.0
Western Deepwater Trawl Fishery (trawling) * 0.7 * 2.0 * 3.5 0.3Western Tuna and Billfish Fishery (longline, handline, troll and poling)
11.7 * 11.7* 0.2*
Total * 0.7 * 2.0 11.7* * 63.4 * * * * 95.6 0.1
Multiple Purpose Zone Marine National Park ZoneNote: Confidential data are marked with an asterisk (*). In some fisheries, only one area is confidential. In these cases, the total does not include the confidential data because it would be possible to back-calculate the displacement from that area. These are denoted by showing the sum of the non-confidential areas followed by an asterisk (e.g. 2.0*). The grand total at the bottom right includes all data and is not affected by confidentiality. Fisheries that did not report activity in the draft marine reserves network or used incompatible methods for the zoning are not included in the table. Estimates have high accuracy because they are based on shot-by-shot position data (latitude and longitude). Prices used to calculate GVP were revised to reflect recent prices as per the preferred methodology; see Appendix A: Fisheries data processing methods.
29

North-west Marine Region social and economic assessment ABARES
Western Australian fisheries—catchTable 7 Estimates of mean annual potential catch displaced by the draft North-west Commonwealth Marine Reserves Network from Western Australian fisheries over the 2001–10 reference period
Catch (tonnes)
Kal
bar
ri
Shar
k B
ay
Eigh
ty M
ile
Bea
ch
Kim
ber
ley
Oce
anic
Sh
oals
Jose
ph
B
onap
arte
Gu
lf
Tot
al
Per
cen
tage
of t
otal
fi
sher
y ca
tch
Fishery 101 102 107 111 112 113 114 115
Kimberley Prawn Fishery (trawling) 13.2–14.1 0.0–0.1 0.0–2.1 13.2–16.3 4.2–5.2
Mackerel Fishery (handline and troll line) * 0.2 0.2* <0.1*
Nickol Bay Prawn Fishery (trawling) 1.6–5.0 1.6–5.0 1.5
Northern Shark Fishery (longline and gill net) * * * * * * *
Northern Demersal Scalefish Fishery (line and fish trap) * * *
Shark Bay Prawn Fishery (trawling) 18.0 18.0 0.8West Coast Demersal Gillnet and Longline Fishery (demersal gillnet and demersal longline)
* * *
Trochus Fishery (reef walking/wading hand collection) n.a. n.a. n.a.
Total * 18.0 1.6–5.0 13.2–14.1* 8.0–8.0 0.2–2.3* * * 85.0–91.5 2.1-2.3
Multiple Purpose Zone Marine National Park Zonen.a. = not available – no calculation of displacement estimates because data were not availableNote: Estimates are based on 10-minute grids (medium accuracy) with a reference period of 2008–10 (Nickol Bay Prawn Fishery uses 2008–09), except for the Kimberly Prawn Fishery, which is based on stratified 60-minute grids (low–medium accuracy) with a reference period of 2000–10. Confidential data are marked with an asterisk (*). In some fisheries, only one area is confidential. In these cases, the total does not include the confidential data because it would be possible to back-calculate the displacement from that area. These are denoted by showing the sum of the non-confidential areas followed by an asterisk (e.g. 2.0*). The grand total at the bottom right includes all data and is not affected by confidentiality. Point estimates and upper estimates have been provided for Nickol Bay Prawn and Kimberley Prawn fisheries. There is no calculation of displacement estimates for the Western Australian Trochus Fishery because data were unavailable; however, consultation with WA Department of Fisheries has indicated that there would be displacement as a result of the Kimberley marine reserve (area 112).
30

North-west Marine Region social and economic assessment ABARES
Western Australian fisheries—gross value of productionTable 8 Estimates of mean annual potential gross value of production (GVP) displaced by the draft North-west Commonwealth Marine Reserves Network from Western Australian fisheries over the 2001–10 reference period
GVP ($’000)
Kal
bar
ri
Shar
k B
ay
Eigh
ty M
ile
Bea
ch
Kim
ber
ley
Oce
anic
Sh
oals
Jose
ph
B
onap
arte
Gu
lf
Tot
al
Per
cen
tage
of t
otal
fi
sher
y ca
tch
Fishery 101 102 107 111 112 113 114 115
Kimberley Prawn Fishery (trawling) 145.1–155.1 0.0–0.7 0.0–23.6 145.1–179.4 4.2–5.2
Mackerel Fishery (handline and troll line) * 2.3 2.3* <0.1*
Nickol Bay Prawn Fishery (trawling) 17.8–55.0 17.8–55.0 1.5
Northern Shark Fishery (longline and gill net) * * * * * * *Northern Demersal Scalefish Fishery (line and fish trap)
* * *
Shark Bay Prawn Fishery (trawling) 195.5 195.5 0.8West Coast Demersal Gillnet and Longline Fishery (demersal gillnet and demersal longline)
* * *
Trochus Fishery (reef walking/wading hand collection)
n.a. n.a. n.a.
Total * 195.5 17.8–55.0 145.1–155.1* 31.4–32.1 3.6–27.3 * * 572.3–643.8 1.4-1.5
Multiple Purpose Zone Marine National Park Zonen.a. = not availableNote: Estimates are based on 10-minute grids (medium accuracy) with a reference period of 2008–10 (Nickol Bay Prawn Fishery uses 2008–09), except for the Kimberly Prawn Fishery, which is based on stratified 60-minute grids (low–medium accuracy) with a reference period of 2000–10. Confidential data are marked with an asterisk (*). In some fisheries, only one area is confidential. In these cases, the total does not include the confidential data because it would be possible to back-calculate the displacement from that area. These are denoted by showing the sum of the non-confidential areas followed by an asterisk (e.g. 2.0*). The grand total at the bottom right includes all data and is not affected by confidentiality. Point estimates and upper estimates have been provided for Nickol Bay Prawn and Kimberley Prawn fisheries. There is no calculation of displacement estimates for the Western Australian Trochus Fishery because data were unavailable; however, consultation with WA Department of Fisheries has indicated there would be displacement as a result of the Kimberley marine reserve (area 112). Prices used to calculate GVP were revised to reflect recent prices as per the preferred methodology; see Appendix A: Fisheries data processing methods.
31
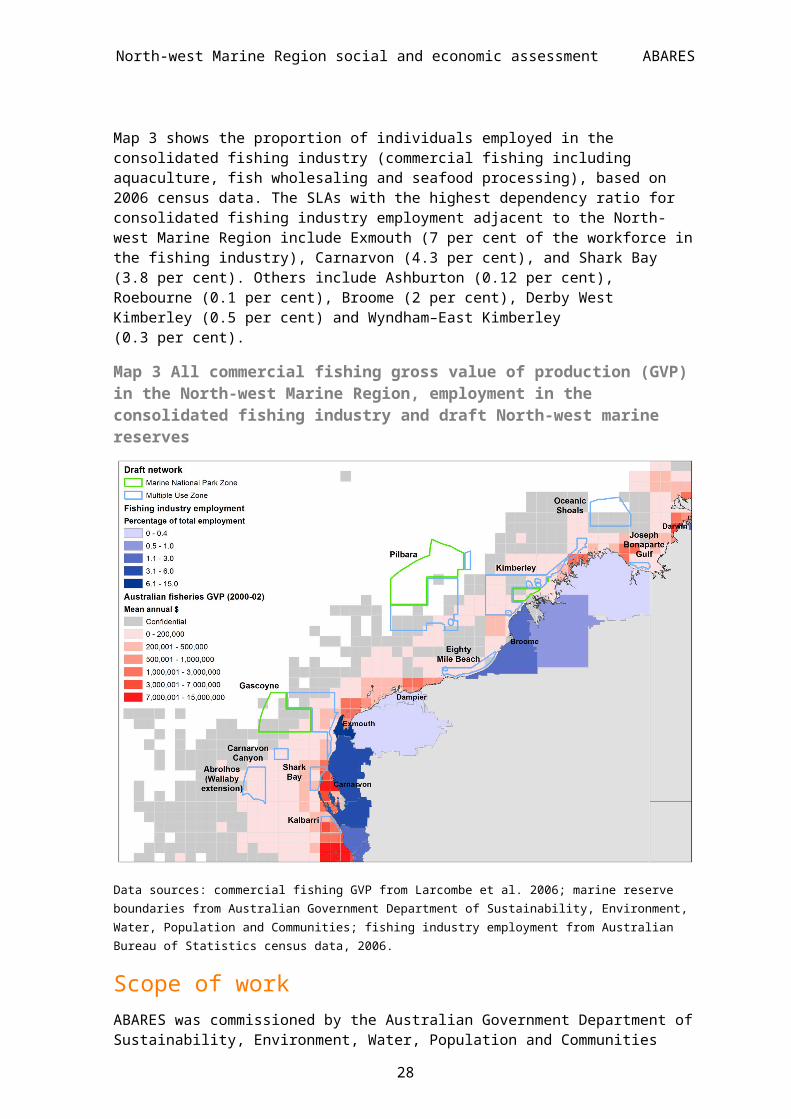
North-west Marine Region social and economic assessment ABARES
Links to other marine regions—fisheriesThere may be cumulative impacts to some of the fisheries identified in the North-west Marine Region from draft marine reserves networks in other marine regions. This includes additional displacement by the draft South-west Commonwealth Marine Reserves Network in the Commonwealth Western Deepwater Trawl (9.5 tonnes; $47 958 GVP) and Western Tuna and Billfish (42.8 tonnes; $246 070 GVP) fisheries, and the WA West Coast Demersal Gillnet and Longline Fishery (although estimates are confidential) (ABARES 2012d). There are also potential cumulative impacts in the Northern Prawn Fishery from the draft North Commonwealth Marine Reserves Network (159–209 tonnes; $1.6–3.1 million GVP) (ABARES 2012c).
In addition, fishers in the prawn fisheries were particularly concerned about cumulative impacts due to displacement across a number of areas within the North-west Marine Region because many prawn fishers hold licences in multiple fisheries.
Reliability and trends over time Some important aspects for interpreting the estimates of potential displacement are noted in this section. A full description of the methodology is contained in Appendix A: Fisheries data processing methods.
Potentially displaced catch and GVP are thought to be reasonably well estimated overall across the North-west Marine Region. Estimates of mean potential displacement have high accuracy for the four Commonwealth fisheries (shot-by-shot position data), and medium accuracy for the WA fisheries (10-minute scale data), with the exception of the Kimberley Prawn Fishery, which has low–medium accuracy (refined 60-minute scale data). Limitations include the variability of fisheries through time, the low–medium accuracy for the Kimberley Prawn Fishery, and unavailable data to calculate estimates for the Western Australian Trochus Fishery.
Time trends in total annual catch for each potentially impacted fishery are shown in Figure 1. These illustrate gross trends in the fisheries and are expressed in relative terms (percentage change relative to the mean). Peaks in most fisheries occurred in the early to mid 2000s, followed by declines. With the exception of the WA Northern Demersal Scalefish Fishery, there has been a general downward trend in fisheries production in the North-west Marine Region. These falls have resulted from a number of factors, including changes to economic and business conditions (e.g. Western Deepwater Trawl Fishery) or changes to the management arrangements of the fishery (Western Tuna and Billfish Fishery). The Nickol Bay Prawn Fishery has demonstrated the most variability in GVP over the time period.
Some fisheries have undergone significant changes in production over longer time scales. The Commonwealth Western Tuna and Billfish Fishery has had annual catches of less than 500 tonnes in recent years, compared with up to 6000 tonnes in the 1990s and more than 17 000 tonnes in the 1980s, when Japanese vessels were permitted to fish in Australia’s exclusive economic zone (see Case study: Western Tuna and Billfish Fishery—displacement and prospective fishing). Production in the WA Shark Bay, Nickol Bay and Kimberley prawn fisheries is inherently variable and depends on seasonally variable rainfall and run-off events (see Case study: Shark Bay, Kimberley and Nickol Bay prawn fisheries—variability in prawn production).
Fisheries in the North-west Marine Region have seen variable production over the reference period, but there has been a generally declining trend (Figure 1). Most have experienced increases or decreases but appear to be relatively stable (with the exception of the Shark Bay Prawn Fishery). It is also apparent that there is significant capacity for (re)expansion of the Western Tuna and Billfish Fishery if operating circumstances permit.
32
North-west Marine Region social and economic assessment ABARES
Figure 1 Trends in total fisheries gross value of production since 2000 (percentage deviation from the mean)
-150%
-100%
-50%
0%
50%
100%
150%
2000 2001 2002 2003 2004 2005 2006 2007 2008 2009 2010
Mackerel Fishery
Northern Shark Fishery
Northern Demersal Scalefish Fishery
West Coast Demersal Scalefish Fishery
-150%
-100%
-50%
0%
50%
100%
150%
200%
250%
300%
350%
400%
2000 2001 2002 2003 2004 2005 2006 2007 2008 2009 2010
Nickol Bay Prawn Fishery
Shark Bay Prawn Fishery
Kimberley Prawn Fishery
-150%
-100%
-50%
0%
50%
100%
150%
200%
250%
2000 2001 2002 2003 2004 2005 2006 2007 2008 2009 2010
North West Slope Trawl Fishery
Northern Prawn Fishery
Western Deepwater Trawl Fishery
Western Tuna and Billfish Fishery
c)
a)
b)
Year
Devi
ation
from
the
mea
n(%
)
Data source: Commonwealth and state fisheries logbook data
33
North-west Marine Region social and economic assessment ABARES
Charter fishing potential displacement Charter vessel activity in Western Australia is concentrated around some of the major population centres including Carnarvon, Exmouth, Dampier and Broome. Low levels of WA charter activity (less than 10 clients per year) may be displaced from Gascoyne (area 106), Pilbara (area 109) and Kimberley (areas 112 and 113) (Table 9), and overall displacement of charter fishing is estimated to be low for Western Australia. This is consistent with feedback from consultation with WA charter vessel operators and Recfishwest. For comparison, the total WA charter fishing industry comprised around 25 000 clients in 2010.
Table 9 Estimated mean annual displaced catch (number of retained fish) and number of clients in the WA charter fishing industry
Gascoyne Pilbara KimberleyTotal
106 109 112 113Mean retained catch (number of fish) * * * * 16.6
Mean number of clients * * * * 21.4
Marine National Park ZoneNote: Estimates are based on 5-minute grid scale data with a reference period of 2002–10. Confidential data are marked with an asterisk (*).Data source: WA Department of Fisheries
Prospective fishingIn this report, prospective fishing is treated as potential fishing that has not been accounted for in the estimates of potential direct displacement of catch and GVP. Prospective fisheries range from short-term prospects that have been clearly identified, through to long-term, speculative prospects. Establishing the full long-term set of fisheries development possibilities (i.e. the present value of all future fisheries opportunities) for the oceans within the draft North-west Commonwealth Marine Reserves Network is outside the scope of this report. Instead, we focus on the short term, where there is evidence that companies or individuals have made specific plans or investments to develop prospects, where potential for expansion has been clearly identified by fisheries management, and where there are strong, well-defined rights of access. This section provides a brief overview of the concepts of prospective fishing, and highlights several fisheries where evidence is available and where these prospects were raised during the ABARES consultation process.
Prospective fishing includes:
development of completely new fisheries (e.g. for new species and using new fishing methods, targeting practices or fishing areas)
fisheries where there is capacity for expansion within long-term sustainable limits, based on the size or productivity of the fish stock, or recovery of depleted stocks
expansion of current fisheries into new fishing areas or intermittently productive fishing areas, or movement back into historically productive areas, or by using new methods or targeting practices
redevelopment of fisheries that have ceased operating or are operating at a reduced level (e.g. catches that are well below defined long-term sustainable management levels).
34

North-west Marine Region social and economic assessment ABARES
In addition, some developed fisheries such as prawns, scallops and squid, are highly variable through time and space. Areas may not be fished for years but are still part of the mosaic of potentially productive grounds that make up the fishery. If historical reference periods are too short then periods of activity within a given area may not be captured.
Prospective fishing is fundamentally about the future and cannot always be predicted from past activity. It is therefore difficult to quantitatively assess and assign a value to the prospectivity of any given fishery or area of ocean.
There are several factors to consider when assessing the value a fisher places on a prospective fishery. Any value that the fisher determines would need to take account of the perceived value if the fishery is developed to its potential, the likelihood of an individual accessing the fishery, the likelihood of the fishery reaching its expected potential and the fisher’s time-value of money.
In light of this, factors that may influence the value of a prospective fishery include:
the expected abundance and quality of stocks
the expected costs of accessing, harvesting and transporting the stocks
the expected market price at the time at which the stocks will be sold
the confidence in the assessment of the fishery
the likelihood that the area will be used preferentially over other prospective areas
the expected time of accessing the prospective fishery.
Given that the value of fisheries endorsements is closely related to the value of a fishery, these factors also have the potential to affect the value of endorsements. In addition, because of the need to adjust for the risk and time involved with prospective fisheries, their value is often significantly less than the value of their expected potential. In an attempt to account for temporal variability in fisheries, where suitable, a relatively long reference period was applied when generating the estimates of potential displacement —however, in some cases the availability of finer scale data necessitated a shorter reference period.
The Western Tuna and Billfish, Northern Demersal Scalefish, North West Slope Trawl and the Western Deepwater Trawl fisheries provide examples of prospective fishing in the North-west Marine Region:
The Commonwealth Western Tuna and Billfish Fishery was previously much larger, initially with Japanese vessels and then a domestic fishery that peaked around the year 2000 with annual catches of 3700 tonnes. Catches from the tail end of this peak in the fishery can be seen in the Western Tuna and Billfish Fishery displacement in the Gascoyne (area 106) and Pilbara (area 109) marine reserves. Licence holders in the Western Tuna and Billfish Fishery are exploring the option of expanding fishing activity to target yellowfin tuna in these waters. One company has made investments to accumulate quota and boat statutory fishing rights with a view to (re)developing the fishery. The draft marine reserves in the South-west Marine Region also affect the prospects for this fishery. (See Case study: Western Tuna and Billfish Fishery—displacement and prospective fishing; ABARES 2012d).
The WA Northern Demersal Scalefish Fishery has been identified by industry to have significant development potential. It is the only fishery in the North-west Marine Region that has clearly shown increased catch during the reference period. However, any catch increases in this fishery would need to adhere to the harvest strategy targets and limits that apply to this fishery (Fletcher & Santoro 2011).
35
North-west Marine Region social and economic assessment ABARES
Industry has highlighted that the loss of prospective grounds would be potentially significant in a number of the impacted fisheries, particularly for Commonwealth fisheries including the North West Slope Trawl Fishery, the Western Tuna and Billfish Fishery and the Western Deepwater Trawl Fishery.
Most of the survey respondents during the ABARES consultation process indicated that they considered much of the North-west Marine Region to be important for future use, even if they were not currently fishing the specific area. The survey also suggested that many fishers consider that there is potential for expansion of their current activities to new grounds.
Placing a value on prospective fisheries is a difficult task and was outside the scope of this assessment. In the case of licences, it appears likely that part of the value of fishing rights is associated with the full scope of prospective fisheries that could be developed under that right. This is particularly the case for tradeable statutory fishing rights in fisheries with management measures that actively limit fishing. If the prospective values of a licence are diminished then the value of the licence may also be diminished. For businesses that have made investments specifically to develop prospective fisheries, it should be possible (case by case) to provide clear evidence of this investment and to estimate potential loss associated with the draft marine reserves.
Fisheries managementChanges to the current management of a fishery may be necessary after the announcement of the final marine reserve boundaries. Where a significant amount of fishing effort is displaced by a marine reserve, management may need to consider how this effort will be redistributed or removed. Any changes will need to be assessed in the context of the magnitude of the impact, and managers will need to determine if the remaining effort within the fishery triggers a reassessment of the current management arrangements. Management arrangements also need to consider any increased pressure as a result of displaced operators moving within or between fisheries. Any management changes will be fishery specific and depend on the nature of the fishery, but responsible management agencies may need to consider changes to the input (e.g. limited entry, area or spatial closures) or output controls (e.g. total allowable catch, individual transferable quotas). This assessment does not attempt to assess the cost of fisheries management changes that are directly attributable to the marine reserves network.
36

North-west Marine Region social and economic assessment ABARES
3 Flow of potential impacts to ports and supply chains
This chapter examines the ‘flow’ of impacts, from exclusion of fishing and associated catches within the draft marine reserves, through to towns and communities and their resident businesses. The chapter is partly informed by results from the ABARES survey, Your marine areas matter: a survey of commercial fishers' values and preferences for Commonwealth marine reserves in the North and North-west Marine Regions of Australia (‘the survey’), conducted as part of this assessment. The survey contained specific questions about where respondents sourced inputs from, and where they sent their outputs to. For an explanation of the social assessment methodology, refer to Appendix B: Social impact assessment methods.
Flow of potential impact was examined using three approaches:
1) Fishing vessel home port or landing port of the displaced catch. This approach relies on the logbook and ancillary data supplied by each jurisdiction and makes a direct link between the estimates of potential displacement (Table 4) and where that catch is landed or the home port of the fishing vessel.
2) The location of inputs to fishing business (upstream impacts). This approach relies on supply chain data from the survey, where respondents were asked where they source inputs to their fishing business (such as fuel, bait, ice, fishing gear and maintenance). Reductions in catch volumes or changes to fishing behaviour would be expected to flow ‘upstream’ to those businesses and towns that supply inputs to affected fishers.
3) The location of outputs from fishing businesses (downstream impacts). This approach relies on supply chain data from the survey, where respondents were asked where their catch is landed (or distributed directly to). Reductions in catch volumes would be expected to flow ‘downstream’ to those businesses and towns that receive outputs from affected fishers.
37
North-west Marine Region social and economic assessment ABARES
Flow of gross value of production to ports The flow of potentially displaced gross value of production (GVP) to towns and coastal communities was estimated using fisheries logbook data and ancillary fisheries data held by fisheries management agencies. Map 4 illustrates the flow of potential GVP impacts for fisheries managed by the Commonwealth and Western Australia. The primary towns receiving potentially displaced GVP would be Fremantle, Geraldton, Carnarvon, Point Samson, Broome and Darwin. To a lesser extent, Albany, Two Rocks, Exmouth, Johns Creek, Port Hedland, Derby, Wyndham, Nhulunbuy (Gove), Cairns, Brisbane, Lakes Entrance and Hobart would also be impacted.
Map 4 Flow of potentially displaced gross value of production (GVP) to ports
Note: Commonwealth GVP flow estimates are based on recorded home port of vessel or landing port for quota-managed fisheries; Western Australian estimates are based on recorded landing location. Where potential displacement estimates are ranges, the maximum estimate has been used.Data source: logbook data from the Australian Fisheries Management Authority (Commonwealth) and the Western Australian Department of Fisheries (WA); marine reserve boundaries from Australian Government Department of Sustainability, Environment, Water, Population and Communities;
38

North-west Marine Region social and economic assessment ABARES
Inputs to fishing businesses (upstream impacts)The flow of impacts to upstream businesses (i.e. those that supply products to fishing businesses) was determined through the survey. The survey was filtered to exclude responses from operators where no displacement could occur. These were scenarios where either fishing methods were compatible with the zoning of a particular reserve, or where logbook analysis indicated no displaced fishing effort. Respondents reported a total of 101 businesses that are potentially impacted by the draft North-west Commonwealth Marine Reserves Network; Map 5 shows the number of input businesses from each location. Most respondents sourced their inputs from outside the region, with the largest numbers in Darwin (32 businesses), Perth (23) and Geraldton (19) (Map 5). As not all potentially impacted fishers returned a survey there may be potentially impacted business that have not been identified here.
Map 5 Number of input businesses identified as potentially impacted by the draft North-west Commonwealth Marine Reserves Network
Note: Input businesses provide goods and services such as fuel, lubricants, bait, ice, fishing gear, repairs/maintenance, boat slipping and accessories/chandlery. Data source: ABARES, Your marine areas matter: a survey of commercial fishers' values and preferences for Commonwealth marine reserves in the North and North-west Marine Regions of Australia; marine reserve boundaries from Australian Government Department of Sustainability, Environment, Water, Population and Communities;
39

North-west Marine Region social and economic assessment ABARES
Map 6 shows the number of survey respondents who source inputs from each location, as well as the marine reserves that potentially impacted those respondents. The most frequently identified towns for supplying inputs were Darwin (11 respondents), Perth (10), Geraldton (6) and Cairns (6). The draft marine reserves listed by the largest number of respondents as having an impact on input businesses were the Kimberley, Gascoyne and Eighty Mile Beach marine reserves. The Carnarvon Canyon marine reserve was not identified by respondents as a contributor to the input impacts. These results mirror the impact of the marine reserves in displacement of catch and GVP (Tables 5–8).
Map 6 Number of respondents who source inputs from this location for their fishing business (size of the circle), with proportional allocation to each draft marine reserve (pie chart)
Data source: ABARES, Your marine areas matter: a survey of commercial fishers' values and preferences for Commonwealth marine reserves in the North and North-west Marine Regions of Australia; marine reserve boundaries from Australian Government Department of Sustainability, Environment, Water, Population and Communities;
40
North-west Marine Region social and economic assessment ABARES
Outputs from fishing businesses (downstream impacts) The flow of impacts to downstream businesses (i.e. those that receive products from fishing businesses) was determined through the survey. The survey was filtered to exclude responses from operators where no displacement could occur. These were scenarios where either fishing methods were compatible with the zoning of a particular reserve, or where logbook analysis indicated no displaced fishing effort. Map 7 shows the number of output businesses from each location that are potentially impacted by the draft marine reserves. Respondents reported a total of 42 potentially impacted output businesses, with the largest numbers in Darwin (12 businesses), Perth (7), Cairns (5) and Geraldton (4) (Map 7). These locations mirror those identified with the largest flow of impacts of the potentially displaced GVP (Map 4).
Map 7 Number of output businesses identified as potentially impacted by the draft North-west Commonwealth Marine Reserves Network
Note: Output businesses provide goods and services related to receiving, transport and processing of catch. Data source: ABARES, Your marine areas matter: a survey of commercial fishers' values and preferences for Commonwealth marine reserves in the North and North-west Marine Regions of Australia; marine reserve boundaries from Australian Government Department of Sustainability, Environment, Water, Population and Communities;
41

North-west Marine Region social and economic assessment ABARES
Map 8 shows the number of survey respondents who send outputs to each location, as well as the marine reserves that potentially impacted those respondents. The most frequently identified towns for potential output impacts were Darwin (9 respondents) Cairns (5) Perth (4 respondents), Geraldton (4 respondents) and Karumba (4). The draft marine reserves in the North-west Marine Region that impacted the largest number of respondents were the Gascoyne, Kimberley and Pilbara. These marine reserves are also listed as having the most impacts in the catch and GVP displacement in Tables 5–8. In contrast, respondents did not indicate a large impact by the Shark Bay marine reserve, despite this accounting significantly for the Western Australian (WA) fisheries displacement (Table 7–8). The Carnarvon Canyon marine reserve was not identified by respondents as a contributor to the output impacts, which directly reflects the displacement estimates in Tables 5–8.
Map 8 Number of respondents who send outputs to this location from their fishing business (size of the circle), with proportional allocation to each draft marine reserve (pie chart)
Data source: ABARES, Your marine areas matter: a survey of commercial fishers' values and preferences for Commonwealth marine reserves in the North and North-west Marine Regions of Australia; marine reserve boundaries from Australian Government Department of Sustainability, Environment, Water, Population and Communities;
42
Exposure Sensitivity
Potential impact Adaptive capacity
Vulnerability
North-west Marine Region social and economic assessment ABARES
Town and local area summary To identify which communities would be impacted most by the displacement of GVP from the draft North-west Commonwealth Marine Reserves Network, data on flow of impacts to towns was combined with demographic and socioeconomic data. Figure 2 summarises the elements that make up community vulnerability. Community vulnerability is a function of a community's exposure (GVP displaced per capita), sensitivity (percentage employment in commercial wild-catch fishing) and adaptive capacity (community socioeconomic characteristics). It provides a broad view of which communities will potentially face the biggest impacts, and which might be least able to adapt to these changes. It is important to read the methods in Appendix D: Developing an index of community vulnerability regarding construction, caveats and limitations before interpreting the vulnerability index.
Figure 2 Conceptual model of community vulnerability
Source: Allen Consulting Group 2005, based on Schröter and the ATEAM Consortium 2004
To identify which communities would be impacted most by the displacement of GVP resulting from the declaration of the draft North-west Commonwealth Marine Reserves Network, the following approach was used:
A composite index of community vulnerability was constructed and analysed to provide an initial understanding of which communities may be most impacted and least adaptable. A complete set of impact flow and supply chain results, together with a community vulnerability index ranking and demographic data are presented in Appendix F: Summary information on flow of impacts, supply chains and demographics of communities. Methods, caveats and limitations on the index are provided in Appendix D: Developing an index of community vulnerability.
Communities were identified where total flow of potentially displaced GVP is greater than or equal to $50 000 or where GVP displaced per capita is greater than or equal to $20 per capita.
Communities were identified that meet either of the criteria above are reported on with the addition of data on supply chain businesses, employment in the commercial fishing industry (sensitivity) and community characteristics influencing adaptive capacity.
43

North-west Marine Region social and economic assessment ABARES
Community exposure, sensitivity and adaptive capacityTable 10 presents community exposure, sensitivity and adaptive capacity measures. Six communities had a potential flow of GVP impact greater than $50 000 per year. These were (in descending order of impact) Darwin, Geraldton, Fremantle, Carnarvon, Broome and Point Samson. Based on the GVP displaced per capita, the community with the highest level of exposure is Point Samson ($224 GVP displaced per capita).
Table 10 Community exposure, sensitivity and adaptive capacity—draft North-west Commonwealth Marine Reserves Network
SENSITIVITY
GVP displaced
($'000 max)Population
(2006)GVP displaced per capita ($)
Fishing industry employment
(% of total employment)
Economic diversity index
ARIA remoteness
index
Median household
income ($/week)
SEIFA index of relative
disadvantageDarwin Darwin City (statistical subdivision) 187.2 66 289 2.8 0.47 0.72 2 1277 6Geraldton Geraldton (C) 156.7 18 915 8.3 2.17 0.91 2 783 2Fremantle Fremantle (C) - Inner 122.5 23 838 5.1 0.64 0.88 0 911 6Carnarvon Carnarvon (S) 98.1 5 284 18.6 4.23 0.53 3 858 2Broome Broome (S) 91.4 11 548 7.9 2.00 0.88 3 1129 2Point Samson Point Samson (UC/L) 60.7 271 224.0 0.11 0.19 3 2010 7Nickol Bay Roebourne (S) 8.6 16 421 0.5 0.11 0.19 3 2010 7Port Hedland Port Hedland (T) 7.8 11 961 0.7 0.06 0.26 3 1865 5Cairns Cairns City Part A (statistical subdivision) 2.3 122 736 0.0 0.39 0.88 2 1050 6Albany Albany (C) - Central 1.0 15 977 0.1 0.26 0.97 2 728 3Lakes Entrance E. Gippsland (S) - Bairnsdale 0.6 25 367 0.0 0.62 0.95 2 645 3Brisbane Brisbane (statistical division) 0.6 1 763 124 0.0 0.13 0.91 0 1192 7Two Rocks Gingin (S) 0.5 4 318 0.1 2.38 0.30 2 827 5Wyndham Wyndham-East Kimberley (S) 0.4 6 595 0.1 0.20 0.56 3 1160 1Derby Derby-West Kimberley (S) 0.3 6 506 0.0 0.21 0.56 4 881 1Exmouth Exmouth (S) 0.3 2 064 0.1 6.24 0.82 4 1059 6Hobart Greater Hobart (statistical subdivision) 0.1 200 516 0.0 0.59 0.88 1 884 5Brookes Inlet Manjimup (S) 0.0 9 255 0.0 0.14 0.51 2 792 3
ADAPTIVE CAPACITYEXPOSURE
Population geographyTown
ARIA = Accessibility/Remoteness Index of Australia; C = City; GVP = gross value of production; S = Shire; SEIFA =Socio-Economic Indexes For Areas; t = Town; UC/L = Urban Centre/LocalityNote: The 'traffic light' indicators for each measure follow the logic of green being a positive measure through to red being a negative measure. Indicators are based on a measures distribution within the group of localities. Australian Bureau of Statistics population data are available for a variety of geographies within the Australian Standard Geographical Classification (ASGC). To reflect the most appropriate representation of a community's population, different geographies were used to calculate the GVP displaced per capita. Data source: Commonwealth and WA logbook data; Australian Bureau of Statistics 2006
These six communities are further analysed by adding data on supply chain businesses, employment in the commercial fishing industry (sensitivity) and community characteristics influencing adaptive capacity. These additional data are reported at the statistical local area (SLA) level because this better represents the regional social and economic catchments that the communities sit within, are influenced by and are accessible to community members.
Point SamsonThe potential GVP displaced linked to Point Samson was estimated at $60 700. Survey results identified two upstream and two output businesses that could potentially be impacted in Point Samson, which in turn may flow through to the community via the supply chain. State data indicated one fish processing facility in Point Samson. The exposure indicator of potential GVP displacement per capita for Point Samson is $224.01. Community sensitivity and adaptive capacity measures show that the SLA of Roebourne (shire), in which Point Samson is located, has very low employment in the consolidated fishing industry (ABS data indicates 0.11 per cent), and is not particularly disadvantaged (SEIFA decile ranking of 7), is located in a remote area and has a small population (population for the urban centre / locality (UC/L) was 271 in 2006).
44
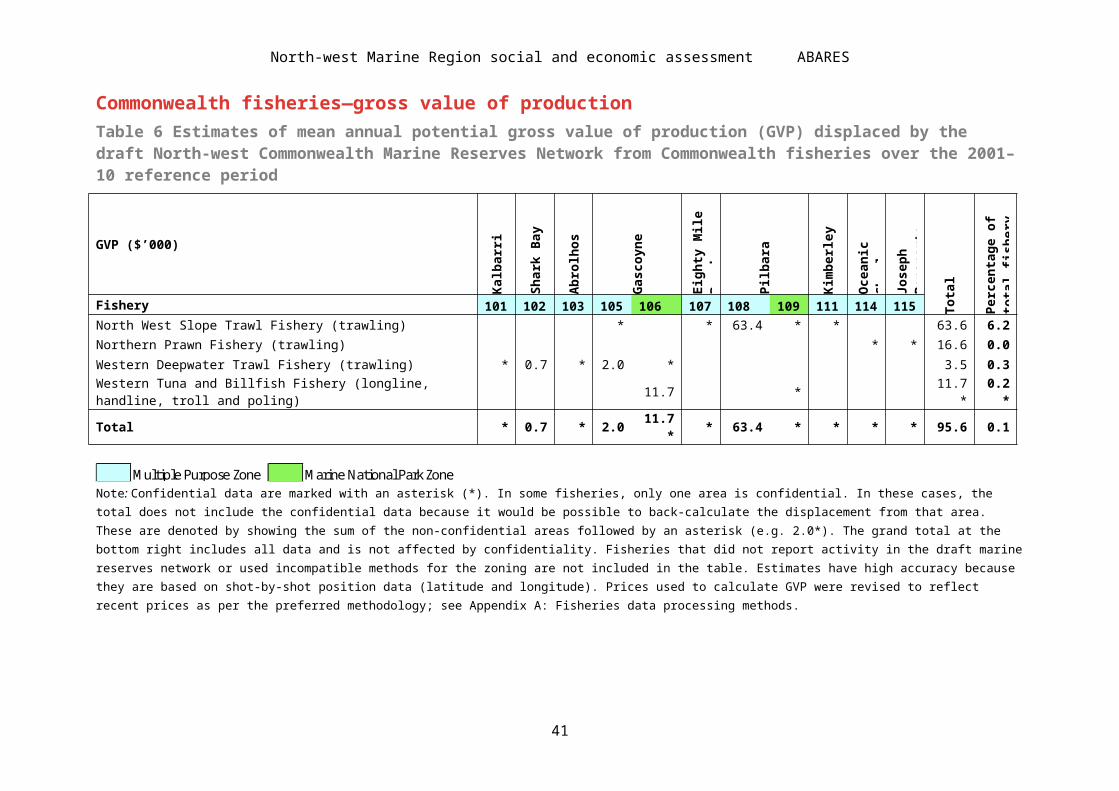
North-west Marine Region social and economic assessment ABARES
Darwin, Fremantle and GeraldtonDarwin, Fremantle and Geraldton have the three highest absolute GVP displacements to port in the North-west Marine Region, respectively (Table 10). However, these locations have relatively low exposure levels, between $2.82 and $8.30 per capita (Table 10) and will most likely be able to mitigate the impacts due to their larger size, diverse economies and small proportion of people employed in the commercial fishing industry.
Darwin, Fremantle and Geraldton are potentially subject to cumulative impacts from draft Commonwealth marine reserves in neighbouring marine regions. The cumulative impact of GVP displaced to Darwin from the draft North Commonwealth Marine Reserve Network ($672 000; ABARES 2012c), and Fremantle ($326 900) and Geraldton ($143 000) from the draft South-west Commonwealth Marine Reserves Network (ABARES 2012d), should also be noted.
CarnarvonThe potentially displaced GVP linked to Carnarvon was estimated at $98 100 in total, and $18.55 per capita. The survey identified one input business and two output businesses, while state data indicate six seafood processors in Carnarvon. These supply chain businesses may be impacted by the draft North-west Commonwealth Marine Reserves Network, and this GVP displacement may flow through to the Carnarvon community. Community sensitivity and adaptive capacity measures show that the statistical local area of Carnarvon (shire; S) has a relatively high dependence on the consolidated fishing industry for employment (4.23 per cent based on ABS data) compared with other communities in the North-west Marine Region. Carnarvon displays a relatively high degree of social disadvantage (SEIFA decile ranking of 2), has a moderately diverse economy (0.53), is located in a remote area and has a relatively low median household income ($858.00 per week).
Links to other marine regions— towns and local area
Cumulative impacts may occur to towns in the North-west Marine Region from displaced GVP from other draft marine reserves networks. The most substantial include cumulative impacts to Darwin ($672 000 annual average GVP) from the draft North Commonwealth Marine Reserves Network (ABARES 2012c), and Fremantle ($326 900) from the draft South-west Commonwealth Marine Reserves Network (ABARES 2012d).
Potential impacts on the economyNo specific modelling was undertaken to examine the potential impacts of the draft North-west Commonwealth Marine Reserves Network on subregional economies or the Western Australian economy. However, the results of subregional modelling undertaken in the South-west Marine Region (ABARES 2012d), North Marine Region (ABARES 2012c), Coral Sea (ABARES 2012b) and Temperate East Marine Region (ABARES 2012e) can be used to infer the likely scale of net economic impact arising from displaced GVP.
Modelling in four marine regions was undertaken using AusRegion, which is a dynamic computable general equilibrium (CGE) model of the Australian economy specified at the national level, the level of the eight states and territories, and selected subregional levels. It was used to examine the net economic impact to the economy and to employment in both the short term (2012–13) and long term (2019–20). Across the eight subregions examined (Eyre Peninsula, South Australia; Augusta–Margaret River, Western Australia; Darwin, Northern Territory; Karumba, Cairns, Hervey Bay/Bundaberg and Mooloolaba, Queensland; and Shoalhaven, New South Wales) the modelled net economic effect ranged from 0.1 per cent to 0.81 per cent of the regional economy. With the exception of Northern Territory, modelled impacts outside the regions are negligible in the context of state and national economies. Modelled economic
45

North-west Marine Region social and economic assessment ABARES
impacts in subregions ranged from around 1.4 times the initial displacement to around 2.2 times the initial displacement.
Applying the average relationship between displacement and net economic impact from other modelled subregions, the draft North-west Commonwealth Marine Reserves Network is estimated to result in a regional net economic impact of approximately $1.2 to $1.3 million in the short term, compared with the baseline. This reflects estimated annual fisheries GVP displacement of between $667 900 and $739 300.
Potential impacts on employmentThe potential impact of the draft North-west Marine Reserves Networks on jobs was estimated using two methodologies: economic modelling and the survey of fishing businesses. The two approaches provide different measures. The economic modelling estimates job loss from the economy as a whole, including the supply chain (businesses that supply inputs to, and process outputs from, the fishing industry). The survey provided an estimate of job loss from impacted fishing businesses in the catching sector, and to some extent in the processing sector, for respondents that completed the survey.
Economic modelling (method 1)No specific modelling was undertaken to examine the potential impacts of the draft North-west Commonwealth Marine Reserves Network on employment. However, the results of subregional modelling undertaken in the South-west Marine Region (ABARES 2012d), North Marine Region (ABARES 2012c), Coral Sea (ABARES 2012b) and Temperate East Marine Region (ABARES 2012e) can be used to infer the likely scale of net economic impact arising from displaced GVP (See section ‘Potential Impacts on the economy’, above). These studies model how the draft marine reserves are likely to affect gross product and employment across the selected subregional economies. The modelling includes short term impacts where adaptation in the economy was limited, and in the longer term were adaptation (labour and capital mobility) was free to occur.
On average, in the short term, one full-time job was estimated to be lost in the modelled subregions for every $243 900 of GVP displaced. Considering the draft North-west Commonwealth Marine Reserves Network is estimated to displace an annual fisheries GVP of $739 400 (upper estimate), this would equate to a loss of around three full-time-equivalent jobs displaced in the short term in directly affected regions.
Survey results (method 2)Job reduction was estimated using results of the survey of fishing businesses. This estimate applies only to those who completed the survey and does not include any fishing businesses that did not complete the survey. The estimate was also based on each surveyed business's prediction about how they would respond to the draft North-west Commonwealth Marine Reserves Network, how many staff they employed and whether they would need to reduce employees.
From the survey responses, it was estimated there would be a reduction of eight individual positions, comprising mostly full-time employment (Table 11). This represented five full-time equivalent positions. The majority of fishing businesses that are potentially impacted by the draft North-west marine reserves were believed to be surveyed, there are some that are not accounted for in this estimate.
Job losses are likely to occur in the most affected fisheries (Table 4) and in the most affected towns and regions (see this chapter and Appendix C: Estimating job reduction using the survey).
46
North-west Marine Region social and economic assessment ABARES
Table 11 Estimated paid job reduction anticipated by survey respondents due to draft North-west Commonwealth Marine Reserves Network
Employment typeNumber of positions
Full-time equivalent
Casual 1 <1
Full-time 4 4
Part-time 1 <1
Seasonal 2 1
Total 8 5
Note: Conversion to full-time equivalent used the following multipliers: casual 0.3, full-time 1, part-time 0.5 and seasonal 0.4. For methods, see Appendix C: Estimating job reduction using the survey, Table 21.Data source: ABARES, Your marine areas matter: a survey of commercial fishers' values and preferences for Commonwealth marine reserves in the North and North-west Marine Regions of Australia
Summary of flow of impacts The areas most impacted by flow of potentially displaced GVP to towns would be Darwin, Geraldton, Fremantle, Carnarvon, Broome and Point Samson. The different methods used to determine the flow of potential impacts to towns consistently showed that the main towns that supply inputs and receive produce are Perth, Darwin, Carnarvon, Geraldton and Cairns. The main marine reserves that contribute to the potential impact on businesses are Gascoyne, Shark Bay, Kimberley and Eighty Mile Beach. Survey respondents did not identify the Carnarvon Canyon marine reserve as a contributor to the impacts. More detailed information on the flow of impacts to Carnarvon and the impacts on the Carnarvon community can be found in Chapter 5 Personal and community impacts and in the Case study: Carnarvon—flow-on impacts to the community.
Economic modelling undertaken in the other marine regions suggests that the regional net economic impact of potentially displaced GVP in the North-west Marine Region would be $1.2 to $1.3 million in the short term. There are likely to be flow-on impacts in other regions; however, changes in economic activity and employment at the state and national level are negligible in terms of the size of those economies and job markets.
From the survey, it was estimated there would be a reduction of five full-time equivalent positions (eight individual positions), comprising mostly full-time employment. Economic modelling conducted for the other regions suggests a loss of three jobs in the short term as a result of displaced GVP in the North-west Marine Region. Job losses are likely to occur in the most affected fisheries (the Commonwealth North West Slope Trawl Fishery, the WA Shark Bay Prawn Fishery, the WA Kimberley Prawn Fishery and the WA Northern Shark Fishery), and more widely in either the most affected towns (Fremantle, Geraldton, Carnarvon, Point Samson, Broome and Darwin) or those with the greatest vulnerability (Point Samson).
This assessment indicates that Point Samson is most likely to feel the greatest impact due to displaced GVP from the declaration of the draft North-west Commonwealth Marine Reserves Network, and have the least capacity to adapt. Darwin, although having the highest absolute GVP displacement to port in the North-west Marine Region, will most likely be able to mitigate the impact due to its larger size, diverse economy and small proportion of people employed in the commercial fishing industry.
47

North-west Marine Region social and economic assessment ABARES
There would be additional impacts to Darwin ($672 000 annual average GVP) from the draft network in the North Marine Region (ABARES 2012c), and to Fremantle ($326 900) from the draft network in the South-west Marine Region (ABARES 2012d).
48
North-west Marine Region social and economic assessment ABARES
4 Impacts on fishing businesses This chapter presents a synthesis of results from the survey, Your marine areas matter: a survey of commercial fishers' values and preferences for Commonwealth marine reserves in the North and North-west Marine Regions of Australia, and qualitative data from focus groups and interviews with potentially impacted fishers, supply chain businesses and community representatives. The synthesis explores the potential impacts of the draft marine reserves on fishing businesses, and investigates:
values held by fishers in the North-west Marine Region
potential displacement of current fishing activities
response to displacement and indirect impacts
business plans and investment based on current entitlements to fish
other factors currently impacting the fishing industry
ability to adapt.
Survey data caveats and notesThe survey instrument and survey frame were developed in consultation with industry and governments. The target group for the survey was state and Commonwealth commercial fishers with a likelihood of being displaced and impacted by the draft North-west Commonwealth Marine Reserves Network. The following notes and caveats apply to the survey:
The target population is a subset of all fishers in the North-west Marine Region. The goal was to ensure the highest number of potentially displaced and impacted licence holders would be identified for the survey. The survey results are intended to be representative of the potentially impacted businesses and not all fishing businesses operating in the North-west Marine Region.
The final survey frame consisted of 104 fishing businesses, and the consultative process used to develop the frame gave a high degree of confidence that the majority of potentially impacted fishing businesses were given an opportunity to participate.
Cognitive biases can affect survey responses and lead to response error. These are difficult to address because the respondent may unintentionally or deliberately provide inaccurate information due to a perceptual distortion, inaccurate judgment or illogical interpretation of reality. Cognitive biases may be an issue in this study due to the sensitive nature of the study topic and general objections within the fishing industry to the draft Commonwealth marine reserves.
Measurement error may result from inaccurate responses to questions, an inability of the respondent to recall information, differences in how respondents interpreted a question or socially desirable responding.
Throughout the following sections, people who participated in the survey are referred to as respondents. This further reinforces that all results refer only to those that participated in the survey. For further detail on the survey process, see Appendix B: Social impact assessment methods.
49

North-west Marine Region social and economic assessment ABARES
Commercial fishery qualitative value mapping To understand how and to what degree commercial fishers value specific areas within the draft North-west Commonwealth Marine Reserves Network survey participants were asked to undertake a qualitative value mapping exercise as a part of the survey. Respondents were given a map of the region (which included a graticule, the draft marine reserve boundaries and significant regional ports) and asked to identify valued areas within the region by placing up to three marks for each of six different fishing-related values: ‘catch reliability’; ‘catch diversity’; ‘easy to access’; ‘a safe area’; ‘less competition’; and ‘future use value’ (for a maximum of 18 marks per respondent). These qualitative data allow a better understanding of which areas within the draft marine reserves network have higher values according to the survey respondents.
Map 9 provides a summary of all the value points provided in the survey, across all six value classes. Data were summarised at both fine and coarse scales to protect confidentiality and to allow display of all data.
High fishing values concentrated on the shelf, notably in the Kalbarri and Shark Bay marine reserves, and also within the western end of the Eighty Mile Beach marine reserve. Low and dispersed values were found throughout all marine reserves and comprised large areas of the North-west Marine Region. One survey respondent highlighted that the entire area was important for future use consideration, which is not reflected in the qualitative value mapping.
More than 200 value stickers were applied; approximately 100 of these were within the marine reserves network (Table 12). More than 50 per cent of all value stickers applied related to catch reliability (24 per cent) and future use (prospective fishing) (26 per cent) (Table 12).
It is important to note that this qualitative value mapping is not the same as impact mapping. Some areas of high value to fishers do not have high impact because zoning will allow continued use (e.g. the Multiple Use Zones only exclude demersal longline, demersal gillnet and demersal trawl). For example, the Kalbarri marine reserve has high value identified through value mapping; however, the displacement estimates are relatively low, and therefore the overall impact is relatively low.
This process does not fully explore why fishers value the areas they marked. It may be best to interpret the qualitative value mapping as though it largely reflects areas valued by impacted fishers; however, there may be some bias towards areas of high impact (e.g. no-take areas).
50
North-west Marine Region social and economic assessment ABARES
Map 9 Qualitative value mapping for all value classes ('catch reliability', 'catch diversity', 'easy to access', 'a safe area', 'less competition', 'future use value')
EEZ = Exclusive Economic Zone. Note: Mapping is at fine scale (0.1 degree) in areas with a high density of value points and at coarse scale (1 degree) where value points are less dense.Data source: ABARES, Your marine areas matter: a survey of commercial fishers' values and preferences for Commonwealth marine reserves in the North and North-west Marine Regions of Australia; marine reserve boundaries from Australian Government Department of Sustainability, Environment, Water, Population and Communities;
51
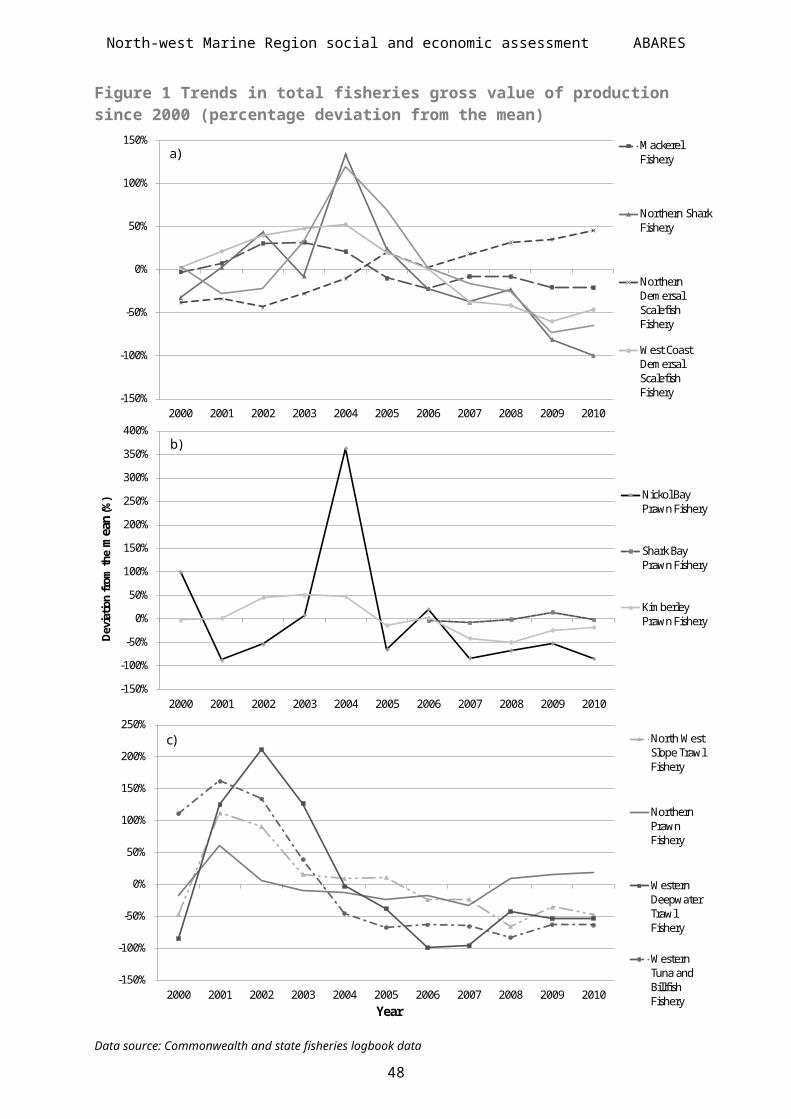
North-west Marine Region social and economic assessment ABARES
Table 12 Number of value markers placed in draft marine reserve areas for each of the value categories Draft marine reserve Area
Catch diversity
Catch reliability
Ease of access
Future use
Less competition
Safe area Total
Kalbarri 101 5 7 3 4 3 1 23
Shark Bay 102 5 9 2 3 1 1 21Abrolhos (Wallaby extension) 103 2 1 3 1 7
Carnarvon Canyon 104 0
Gascoyne
105 3 2 2 3 1 1 12
106 1 3 1 5
Eighty Mile Beach 107 1 1 1 1 1 5
Pilbara
108 3 1 2 2 8
109 1 1
110 1 1
Kimberley
111 1 2 5 1 3 12
112 1 1 2 4
113 0
Oceanic Shoals 114 2 1 2 2 7Joseph Bonaparte Gulf 115 1 1 1 3Outside marine reserves 12 22 11 24 9 19 97
Total 30 50 23 54 18 31 206
Multiple Purpose Zone Marine National Park ZoneData source: ABARES, Your marine areas matter: a survey of commercial fishers' values and preferences for Commonwealth marine reserves in the North and North-west Marine Regions of Australia
Direct displacement impacts on fishing businesses This section presents results from the survey, and qualitative data from focus groups and interviews, where respondents were asked about direct displacement of fishing from the draft marine reserves. For this analysis of potential direct impacts, the survey was filtered to exclude responses from operators where no displacement could occur. These were scenarios where either fishing methods were compatible with the zoning of a particular reserve, or where logbook analysis indicated no displaced fishing effort.
Table 13 indicates the marine reserves that respondents identified they would be excluded from (or were unsure if they were excluded). The draft Kimberley and Pilbara marine reserves have the highest number of respondents who indicated that they would be excluded. These results broadly reflect the displacement estimates calculated for catch and GVP (Tables 5–8); however, only one respondent indicated that they would be excluded by the Shark Bay marine reserve, despite this accounting for a significant share of the potential displacement of the Shark Bay Prawn Fishery (see Case study: Carnarvon—flow-on impacts to the community).
52

North-west Marine Region social and economic assessment ABARES
Table 13 Number of survey respondents who indicated they would be excluded or displaced to some degree by the draft marine reserves Draft marine reserve Excluded Unsure
Kalbarri Canyon 1 0
Shark Bay 1 0
Abrolhos (Wallaby extension) 1 0
Carnarvon Canyon 0 0
Gascoyne 5 3
Eighty Mile Beach 4 0
Pilbara 6 0
Kimberley 8 3
Oceanic Shoals 4 1
Joseph Bonaparte Gulf 5 0
Note: Respondents could choose multiple marine reserves.Data source: ABARES, Your marine areas matter: a survey of commercial fishers' values and preferences for Commonwealth marine reserves in the North and North-west Marine Regions of Australia
People who identified themselves as being excluded by the draft marine reserves provided estimates for the proportion of their total catch in 2010–11 that was taken from within the draft marine reserves (Table 14). Not all respondents completed this question, so counts in Table 13 and Table 14 are not equal. Most respondents indicated a level of displacement between 0 and 10 per cent, and one respondent indicated that more than 50 per cent of the catch would be displaced.
Table 14 Number of survey responses that indicated a defined proportion of their 2010–11 catch was taken from within draft marine reservesDraft marine reserve
Percentage of catch from within draft marine reserves
1–10 11–20 21–30 31–40 41–50 51–60 61–70 71–80 81–90 91–100
Kalbarri Canyon
Shark Bay 2
Abrolhos (Wallaby extension)
1 1
Carnarvon Canyon
Gascoyne 10 1 1 1
Eighty Mile Beach 2 2 2
Pilbara 9
Kimberley 12 1 2
Oceanic Shoals 7 1
Joseph Bonaparte Gulf
9 1
Note: Respondents could choose multiple marine reserves.Data source: ABARES, Your marine areas matter: a survey of commercial fishers' values and preferences for Commonwealth marine reserves in the North and North-west Marine Regions of Australia
53
North-west Marine Region social and economic assessment ABARES
Qualitative findings across the North-west Marine Region revealed a number of consistent themes in relation to displacement of fishing from the draft North-west Commonwealth Marine Reserves Network:
Participants advised that fishers, particularly those operating in Commonwealth waters, typically fish several areas within the South-west Marine Region and North-west Marine Region at different times of the year. Fishers advised that losing a proportion of one fishery could make the rest of their business unviable. For example, if the draft Gascoyne and Pilbara marine reserves are closed to longlining, the Commonwealth Western Tuna and Billfish Fishery may become less viable (see Case study: Western Tuna and Billfish Fishery—displacement and prospective fishing).
Fishers in the prawn fisheries were particularly concerned about cumulative impacts due to displacement across a number of areas within the North-west Marine Region, because many prawn fishers hold licences in multiple fisheries.
Fishers in the prawn fisheries were also concerned about the loss of areas that are fished only occasionally due to variable prawn production (see Case study: Shark Bay, Kimberley and Nickol Bay prawn fisheries—variability in prawn production).
Fishers were concerned that the announcement of the draft North-west Commonwealth Marine Reserves Network had influenced the value of entitlements and capital assets.
Fishing business impactsThis section reports fishers’ responses to their perceived displacement and how this response will impact their fishing business.
Survey respondents were asked if they believed they would have to change their current fishing activities if the draft North-west Commonwealth Marine Reserves Network was declared. Respondents who indicated that their current fishing activities would have to change were asked to indicate what their most likely response would be:
1) stay in the same fishery and make up the shortfall from other fishing areas
2) move into an alternative fishery
3) continue operating with reduced catch in the same fishery(s) or downsize the operation
4) leave the fishing industry
5) unsure.
Based on the likely response to displacement, each respondent then indicated how strongly they agreed or disagreed with a series of statements about potential impacts.
The potential impacts on the fishing businesses have been collated into three groups based on the above responses options—Group 1 (responses 1 and 2), Group 2 (response 3) and Group 3 (response 4). Where applicable, potential impacts are further supported by qualitative data collected through interviews and focus groups with potentially impacted fishers.
54
North-west Marine Region social and economic assessment ABARES
Fishing business response to displacement Of the 39 survey respondents that answered this question, 27 indicated that they would have to change their current fishing activities if the draft North-west Commonwealth Marine Reserves Network was declared (Table 15).
Table 15 Responses to the question, ‘If the draft reserves were declared I would have to change my current fishing activities’ Response
Number of respondents
Yes 27No 12Data source: ABARES, Your marine areas matter: a survey of commercial fishers' values and preferences for Commonwealth marine reserves in the North and North-west Marine Regions of Australia
Of the 27 respondents that indicated they would have to change their fishing activities, the majority indicated that they would continue fishing. A small number of fishers indicated that their response would be to leave the industry (Table 16). Two respondents did not indicate what their response would be.
Table 16 Responses from those who declared their fishing activity would have to change
Response Count
Make up the shortfall from other fisheries 8
Move into an alternative fishery 1
Operate with reduced catch 9
Leave the fishing industry 3
Unsure 4Data source: ABARES, Your marine areas matter: a survey of commercial fishers' values and preferences for Commonwealth marine reserves in the North and North-west Marine Regions of Australia
Fishing business impacts—Group 1 Group 1 (respondents who would either stay in the same fishery and make up the shortfall in other areas, or move into an alternative fishery) included nine respondents. The majority of these either agreed or strongly agreed (Figure 3) that their business would be impacted by:
increased pressure on fish stock in areas outside the draft marine reserves
increased time spent looking for new fishing grounds
increased conflict with fishers over competition for fish
increased fuel costs
increased travel time to and from fishing grounds
increased wear and tear on boat/equipment.
In addition the majority of survey respondents indicated they would have to become more innovative in the way they fish, this may include changing gear types and purchasing/leasing quota in alternative fisheries.
55
North-west Marine Region social and economic assessment ABARES
Figure 3 Fishing business impacts for respondents who indicated they would continue operating by making up shortfall or moving into an alternative fishery
The fishing business will need to hire more staff
The fishing business will have to reduce the number of employees
There will be increased safety issues from fishing in adverse weather conditions
We will have to become more innovative in the way we fish
Increased bait costs due to intensified fishing effort
Fishing business would have to relocate to a new port/town
We will have to purchase alternative fishing licences/quota
Increased conflict with fishers over competition for fish
Equipment upgrades will be necessary
Changes to fishing gear will be necessary
Increased travel time to and from fishing grounds
Fuel costs will increase
Increased time spent looking for new fishing grounds
Increased wear and tear on boat/equipment
There will be increased pressure on fish stock in areas outside of the proposed marine reserve
0 20 40 60 80 100
Strongly agree Agree Neither agree nor disagreeDisagree Strongly disagree
Percentage of respondents
Data source: ABARES, Your marine areas matter: a survey of commercial fishers' values and preferences for Commonwealth marine reserves in the North and North-west Marine Regions of Australia
Fishing business impacts—Group 2 Group 2 (respondents who would either continue operating with reduced catch or downsize their operation) included nine respondents. The majority of these either agreed or strongly agreed that their business would be impacted in the following ways (Figure 4):
there will be increased conflict with other fishers over competition for fish
the fishing business will have to reduce the number of employees.
56
North-west Marine Region social and economic assessment ABARES
Figure 4 Fishing business impacts for respondents who indicated they would continue operating with a reduced catch
The fishing business will sell off one or more of its fishing endorsements/entitlements
Part of the fishing business will be sold
I will diversify the fishing business
The fishing business will have to relocate to a different town/port
The fishing business will have to reduce the number of employees
There will be increased conflict with other fishers over competition for fish
0 20 40 60 80 100
Strongly agree Agree Neither agree nor disagreeDisagree Strongly disagree
Percentage of respondents
Data source: ABARES, Your marine areas matter: a survey of commercial fishers' values and preferences for Commonwealth marine reserves in the North and North-west Marine Regions of Australia
Fishing business impacts—Group 3 Of the three respondents in Group 3 (respondents who would leave the fishing industry), the majority either agreed or strongly agreed that their business would be impacted in the following ways:
our employees will be without a job
there are considerable risks in the changes I am planning
it will place considerable stress on my family and relationships.
Fishing business plans and future investments The potential impact of the draft North-west Commonwealth Marine Reserves Network on future plans and investments was raised as a major concern by the fishing industry and individual fishers.
A small number of survey respondents reported that they had made business plans or financial investments to fish in one or more of the draft North-west Commonwealth marine reserves. Table 17 presents the number of respondents who had made plans or financial investments to fish in each of the draft North-west Commonwealth marine reserves.
57

North-west Marine Region social and economic assessment ABARES
Table 17 Number of respondents with business and investment plans in place
Draft marine reserve Business plans made Investments made
Gascoyne 5 5
Kimberley 6 4Abrolhos (Wallaby extension)
4 3
Shark bay 4 3
Pilbara 4 3
Joseph Bonaparte Gulf 2 3
Kalbarri 5 2
Carnarvon Canyon 1 1
Eighty Mile Beach 1 1
Oceanic Shoals 2 1Note: Respondents could choose multiple marine reserves.Data source: ABARES, Your marine areas matter: a survey of commercial fishers' values and preferences for Commonwealth marine reserves in the North and North-west Marine Regions of Australia
Participants in interviews and focus groups raised the following issues about the potential impact on business plans and financial investments:
Uncertainty about future development and economic contribution of fisheries. Fishers were concerned that the boundaries or zoning of the declared marine reserves would change over the next decade, and did not feel confident about making business plans or financial investments in the fishing industry due to this uncertainty.
Difficulty accessing finance. Participants felt that the uncertainty created by the marine reserve planning process had made it difficult to access finance. Fishers were concerned that banks and financial institutions were no longer loaning against fishing licences because the marine reserves proposal has cast doubt on licence value.
Delayed investment decisions. Some participants indicated they were delaying decisions to upgrade or purchase new vessels and gear that would be used to further develop fisheries or enter new fisheries.
Cessation of business. Fishers were concerned that the buying and leasing of boats and fishing licences had stopped due to the uncertainty created by the marine reserve planning process. An example of this can be seen in the Western Tuna and Billfish Fishery, where a buyer has ceased purchasing licences as a result of the draft marine reserves networks (for further details see the Case study: Western Tuna and Billfish Fishery—displacement and prospective fishing).
Other issues and cumulative factors impacting fishing businesses The potential impacts of the draft marine reserves network on fishing businesses should not be viewed in isolation from other factors affecting the fishing industry (Figure 5). However, fully accounting for these factors is beyond the scope of this assessment. A strong and consistent theme raised by survey respondents, interviewees and focus group participants in the North-west Marine Region was that many factors impact their businesses and they were concerned that these factors would compound with the draft Commonwealth marine reserves. Particular issues raised were:
58
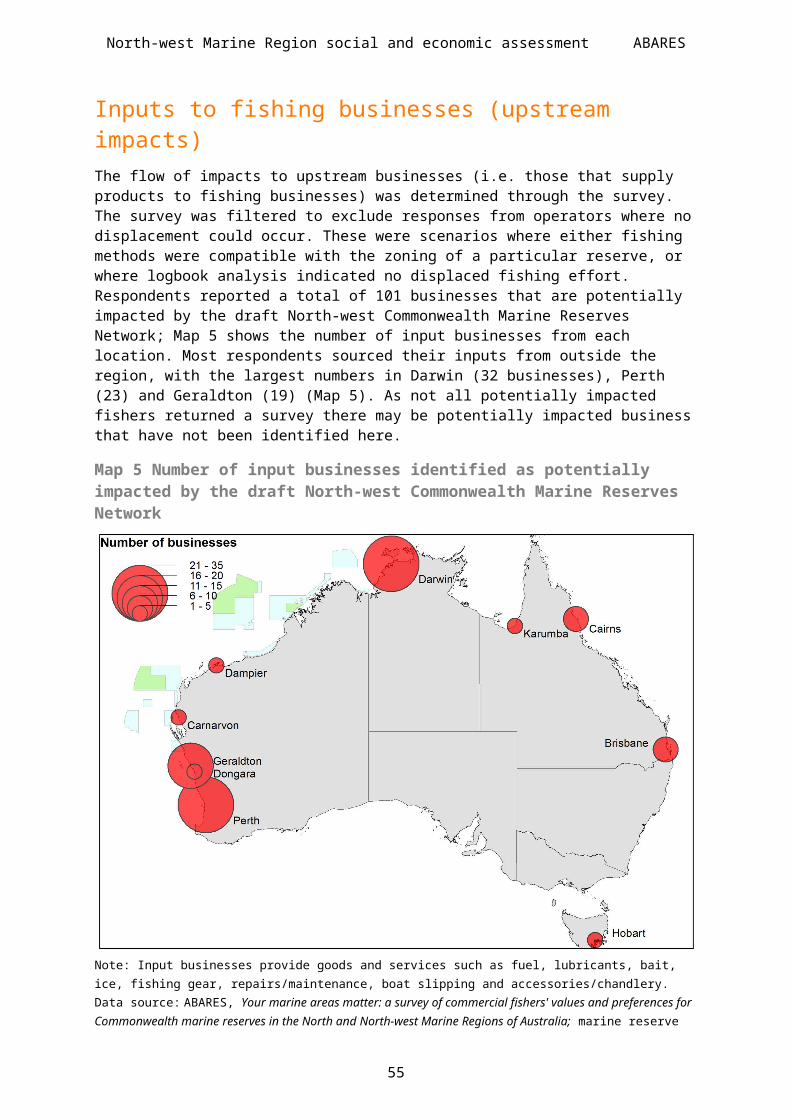
North-west Marine Region social and economic assessment ABARES
economic influences, including fish prices, input costs (fuel, labour, etc.), cheaper imported fish, exchange rates and market demand (see Case study: Shark Bay, Kimberley and Nickol Bay prawn fisheries—variability in prawn production)
the competitive standing of fisheries in the region compared with international fisheries (and imports from those fisheries) was also a strong concern. There was a perception that Australian fishers are being disadvantaged by regulations that do not apply to foreign fisheries.
access to labour, both skilled and unskilled
cumulative impacts for operators who are authorised to fish in multiple fisheries (see Case study: Shark Bay, Kimberley and Nickol Bay prawn fisheries—variability in prawn production) or across marine regions (see Case study: Western Tuna and Billfish Fishery—displacement and prospective fishing)
cumulative impacts for operators due to recent changes to fishery management arrangements (see Case study: West Coast Demersal Gillnet and Longline Fishery—individual fisher).
59
North-west Marine Region social and economic assessment ABARES
Figure 5 Other issues impacting fishing business in the North-west Marine Region
Illegal (unlicensed) fishing in Australia
Gross pollutants (e.g. rubbish)
Bycatch compliance
Fish stocks
Access to finance
Competition from other commercial fishers
My age/age of workers
Competition form recreational fishers
Food safety regulations
Dissolved pollutants (e.g. oil)
Climate change
My health
License buy-outs
Market demand for fish caught
Interest rates
Animal welfare campaigns
Access to skilled labour
Changes to fishing ground access (state MPAs)
Changes in fisheries management (e.g. quota)
Access to labour
Exchange rates
Input costs (fuel, labour, etc.)
Cheaper imported fish
Prices received for fish
0 20 40 60 80 100
Major problem Moderate problem Small problemNo problem Don't know
Percentage of respondents
MPAs = marine protected areasData source: ABARES, Your marine areas matter: a survey of commercial fishers' values and preferences for Commonwealth marine reserves in the North and North-west Marine Regions of Australia
60

North-west Marine Region social and economic assessment ABARES
Ability to adapt—fishing businessesSurvey respondents were asked a series of questions about the ability of their fishing business to adapt to changes (Figure 6). The number of respondents answering these questions varied between 24 and 28; responses included the following:
most respondents believed they had well-developed business skills
13 respondents agreed or strongly agreed that their business had previously managed change successfully, while 8 respondents disagreed with this statement
10 respondents felt that their business was in a good financial situation, while 14 indicated that their business was not in a good financial situation.
the majority of respondents disagreed or strongly disagreed that their business was able to afford to make the necessary changes to adapt to the draft North-west Commonwealth Marine Reserves Network
Figure 6 Ability to adapt— fishing businesses
The business can afford to make the necessary changes to adapt to the draft Commonwealth marine reserves
The business has previously managed change successfully
The business is in a good financial situation
I have well-developed business skills
0 20 40 60 80 100
Strongly agree Agree Neither agree nor disagreeDisagree Strongly disagree
Percentage of respondents
Data source: ABARES, Your marine areas matter: a survey of commercial fishers' values and preferences for Commonwealth marine reserves in the North and North-west Marine Regions of Australia
61
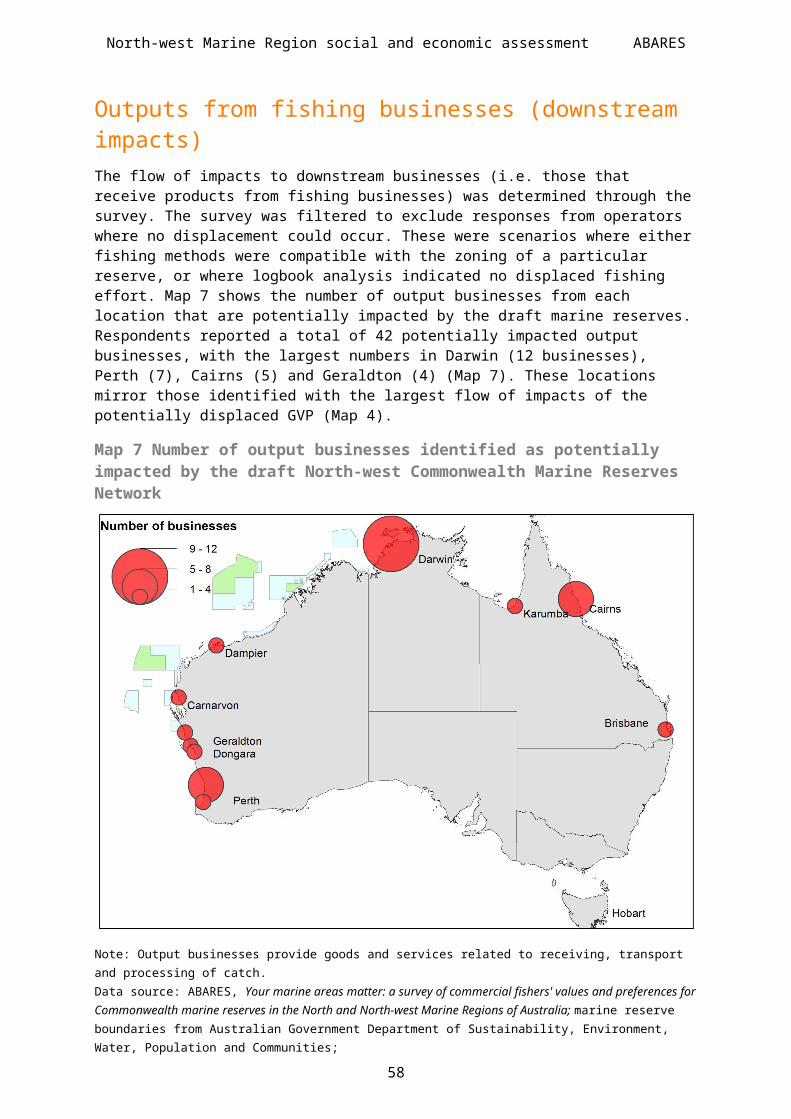
North-west Marine Region social and economic assessment ABARES
Fishing business impacts summary The potential impacts to fishing businesses were examined using the survey, focus groups and interviews. The survey was completed by 39 fishers or fishing businesses. The following potential impacts of the draft North-west Commonwealth Marine Reserves Network were identified:
Twenty-seven respondents that indicated they would have to change their fishing activities; of this group, eight indicated that they would continue operating in the same fishery and attempt to make up the shortfall, one respondent planned to move into an alternative fishery, nine indicated that they would continue operating in the same fishery with a reduced level of catch or with a smaller fishing operation, and three indicated that they would leave the fishing industry.
Survey and qualitative data from focus groups and interviews found that the secondary potential impacts on businesses resulting from displacement and having to change their current fishing activities include increased pressure on fish stocks in the North-west Marine Region, a need to become more innovative in the way they fish, increased travel time to and from fishing grounds, increased fuel costs, increased conflict with other fishers over competition for fish, increased time spent looking for new fishing grounds, increased wear and tear on boats and equipment, and devaluing of licences, quota and capital items.
For those downsizing their operations, the main secondary impact would be an increase in conflict with other fishers over competition for fish.
For those indicating that they would leave the fishing industry, the secondary impacts of most concern were employees losing their jobs, stress on family and relationships, and considerable risks in the change.
A major concern was the cumulative impacts that result from other factors that exacerbate the potential impact of the draft marine reserves network. These other factors were predominantly external economic drivers, including prices received for fish, cheaper imported fish, input costs, exchange rates and market demand for product. Other important factors were access to skilled and unskilled labour and changes in fisheries management.
There was concern about cumulative impacts for operators who hold authorisations to fish in multiple fisheries within the North-west Marine Region.
There would be cumulative impacts for fisheries operating across marine reserve regions (i.e. South-west Marine Region and North Marine Region) and across marine reserves within the region.
Access to finance, uncertainty about future changes of the marine reserves network and a perceived decline in the demand for licences and equipment were highlighted as major concerns for future business plans and investments.
62

North-west Marine Region social and economic assessment ABARES
5 Personal and community impactsSurvey respondents expected a number of community and personal impacts if the draft marine reserves were declared. Many of the comments about impacts reflect people’s attempts to understand what the changes would mean for themselves, their families and their communities. Note that there is inherent uncertainty when predicting or speculating about the future based on what respondents know of the proposed changes, their current personal circumstances and that of their communities.
Personal impactsPersonal impacts are discussed in terms of three response options indicated by survey respondents:
Group 1: Stay in the same fishery and make up the shortfall fishing in other areas, or move into an alternative fishery
Group 2: Continue operating with reduced catch or downsize operation
Group 3: Leave the fishing industry.
The caveats regarding the survey frame discussed at the start of the previous chapter (Impacts on fishing businesses) also apply to this chapter. References are made to case studies where relevant.
Personal impacts—Group 1 Most of the nine respondents in Group 1 indicated the following personal impacts as a result of deciding to stay in the same fishery and make up the shortfall in other areas, or move to an alternative fishery, in response to the draft North-west Commonwealth Marine Reserves Network (Figure 7):
less time to spend with family
increased stress levels
working longer hours.
Most respondents in this group did not indicate an intention to relocate to a new town if the draft marine reserves were declared.
63

North-west Marine Region social and economic assessment ABARES
Figure 7 Indirect personal impacts for respondents who indicated they would continue operating by making up the shortfall or moving into an alternative fishery
I will move to a new town
I will need to move my family to a new area
I will have less time to spend with my family
My family's quality of life will suffer as a result of this change
I will have to work longer hours
My stress levels will increase
0 20 40 60 80 100
Strongly agree Agree Neither agree nor disagreeDisagree Strongly disagree
Percentage of respondents
Data source: ABARES, Your marine areas matter: a survey of commercial fishers' values and preferences for Commonwealth marine reserves in the North and North-west Marine Regions of Australia
Personal impacts—Group 2 The majority of the nine respondents in Group 2 (respondents who indicated that they would continue operating with reduced catch or downsize their operation) indicated the following personal impacts as a result of their response to the draft North-west Commonwealth Marine Reserves Network (Figure 8):
less time to spend with family
increased stress levels
working longer hours
family quality of life will suffer.
Most respondents in this group did not indicate an intention to relocate to a new town if the draft marine reserves were declared. Only one respondent indicated that they had the skills to enable them to find a second job.
64
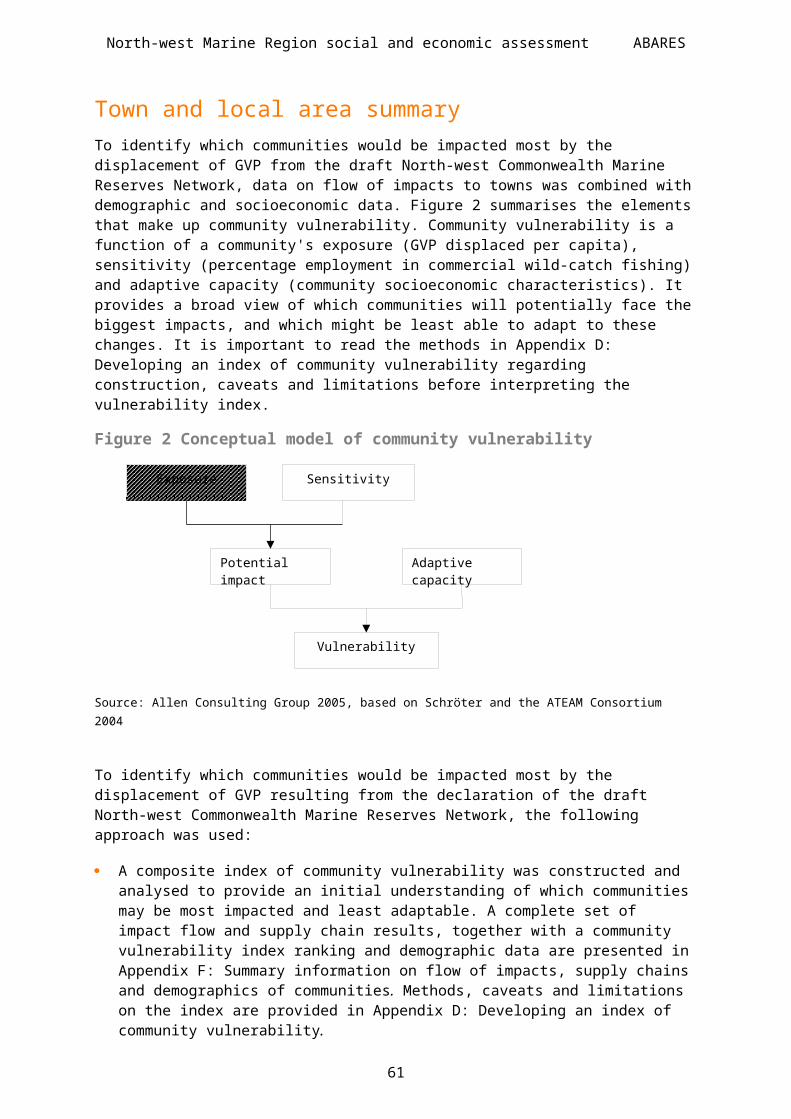
North-west Marine Region social and economic assessment ABARES
Figure 8 Indirect personal impacts for respondents who indicated they would continue operating with a reduced catch
I have the skills to find a second job
I will need to move my family to a new area
I will move to new town
I will have less time to spend with my family
I will have to work longer hours
My family's quality of life will suffer as a result of these changes
My stress levels will increase
0 20 40 60 80 100
Strongly agree Agree Neither agree nor disagreeDisagree Strongly disagree
Percentage of respondents
Data source: ABARES, Your marine areas matter: a survey of commercial fishers' values and preferences for Commonwealth marine reserves in the North and North-west Marine Regions of Australia
Personal impacts—Group 3 Three respondents indicated that they would leave the fishing industry (and another was 'unsure' of how they would respond to the draft marine reserves but filled out the section on 'leaving the fishing industry'). All four respondents strongly agreed that their employees would be without a job. Three respondents agreed or strongly agreed that there were considerable risks in the changes they were planning.
Two of the four respondents who indicated that they would leave the industry if the draft North-west Commonwealth Marine Reserves Network was declared indicated that:
they would look for alternative employment or retire
their stress levels would increase
they would move to a new town
there would be considerable stress on family and relationships.
65
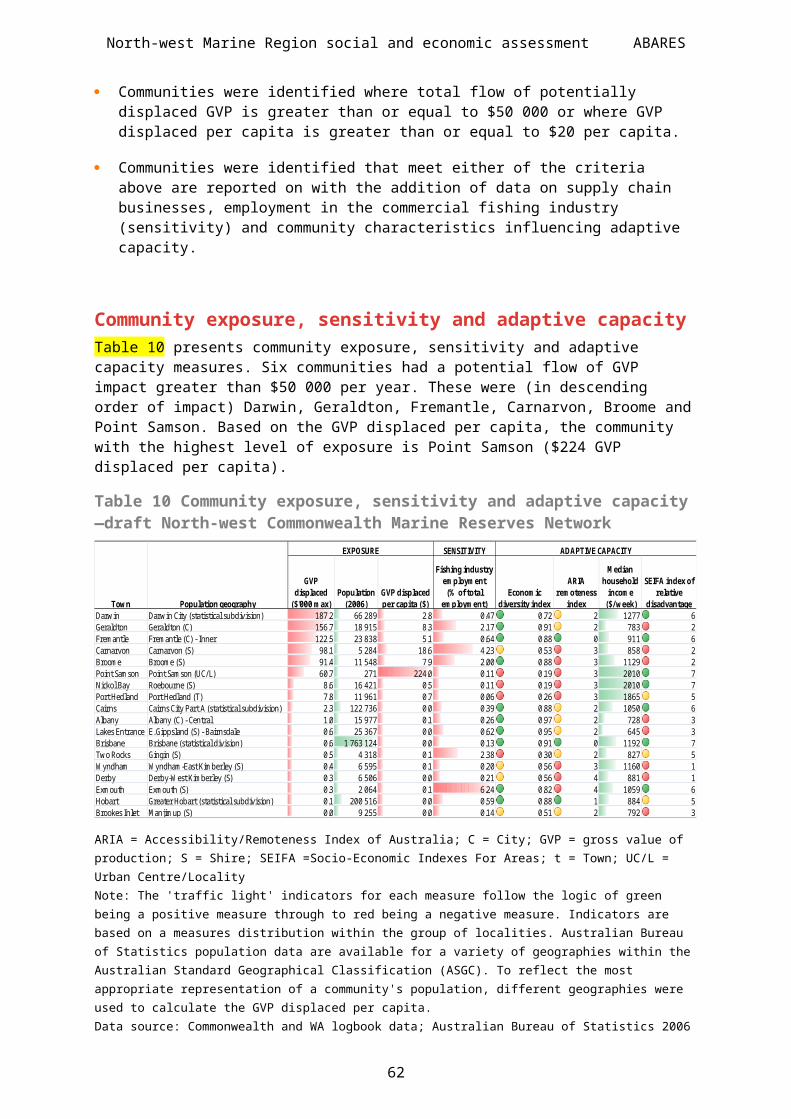
North-west Marine Region social and economic assessment ABARES
Ability to adapt—personalThe ability to adapt includes the inherent capacities and resources that enable people to manage change and cope with stresses. Questions in the survey were specifically aimed at understanding the extent to which respondents felt connected to their communities, how they respond to challenges, their confidence in their skill levels and ability to assess their own health (Figure 9). These factors can provide insight into the personal ability of respondents to adapt.
Most respondents agreed or strongly agreed with the following statements (Figure 9):
they do not have access to superannuation or pension benefits
there is a lack of other income opportunities
they do not want to give up fishing
they have confidence in their ability to find solutions when faced with problems
they are in good health
they are too young to retire
they feel part of their local community
they have been able to handle unforeseen situations in the past thanks to their resourcefulness
they have people they can ask for help when problems arise.
Two of the case studies (Case study: Western Tuna and Billfish Fishery—displacement and prospective fishing and Case study: West Coast Demersal Gillnet and Longline Fishery—individual fisher) illustrate two individuals’ desire to continue fishing and to consider other options to make their business viable so that they can stay in the industry.
66
North-west Marine Region social and economic assessment ABARES
Figure 9 Ability to adapt—personal
I have people I can ask to help me when problems arise
I am confident in my ability to secure employment elsewhere if needed
I have other income opportunities
I'm interested in adapting to the changes that occur in life
I remain calm when facing difficulties because I can rely on my coping abilities
I do not have job skills that I can use in other industries
Planning, learning or reorganising doesn't seem 'exhausting' to me
Thanks to my resourcefulness, I have been able to handle unforseen situations in the past
When faced with problems, I have confidence in my ability to find solutions
I do not have access to superannuation or pension benefits
I feel part of my local community
I personally just can't cope with any more changes
My health is good
I'm too young to retire
I don't want to give up fishing
0 20 40 60 80 100
Strongly agree Agree Neither agree nor disagreeDisagree Strongly disagree
Percentage of respondents
Data source: ABARES, Your marine areas matter: a survey of commercial fishers' values and preferences for Commonwealth marine reserves in the North and North-west Marine Regions of Australia
67
North-west Marine Region social and economic assessment ABARES
Community impacts The assessment of community impacts focused mainly on communities with a direct link to the fisheries displaced by the draft marine reserves network. However, a number of focus group and interview participants commented on impacts that they believed would flow through to the wider Australian community.
Information about community impacts was largely derived from interviews with fishing industry representatives from Carnarvon, and relates specifically to that town. Although the fishing industry only represents around 4.2 per cent of employment in Carnarvon (223 people), it was reported to play a key role in supporting employment and development in a range of other sectors associated with the need to supply boats, crew, housing, support services and seasonal employment that complements other industries (see Case study: Carnarvon—flow-on impacts to the community).
Nor-West Seafoods supports the majority of fishing industry employment in the Carnarvon community. A participant noted that, if the impacts are significant, Nor-West Seafoods may need to look at options for moving the factory to offshore processing (see Case study: Carnarvon—flow-on impacts to the community). Besides supporting employment and development in Carnarvon, it was reported that the fishing sector also facilitates lower fuel costs and more efficient electricity supply due to economies of scale linked to their presence in the area. The findings for Carnarvon could be applied to other small to medium-scale communities across the North-west Marine Region where fishing is a significant industry.
The issue of food provision and food security is one that has been echoed in other marine regions around Australia. A broad-scale issue that was raised in the focus group was ‘Who is going to feed the masses?’ Some fishers are concerned that they will not be able to continue to provide a community service by supplying fresh, ‘affordable’ seafood. These broader concerns predominately focused on the future of the fishing industry in Australia and what this means for Australia as a whole. Marine reserves—along with other challenges to the industry such as competing with cheaper imported seafood, rising input costs and increased management costs and changes to management arrangements—are seen by fishers and the fishing industry as threatening the industry as a whole and thus impacting the future domestic supply of seafood. Fishers see themselves as providers of fresh, high-quality seafood for the Australian people, and take pride in doing so in a sustainable way. They believe that locally caught seafood provides a nutritious and affordable meal to many Australians, as well as providing a high-quality gourmet experience for locals and visitors. Further, fishers believe that Australia and regions within Australia are renowned for high-quality seafood, which is seen as a key driver for tourism.
Ability to adapt—communityThe ability for communities to adapt includes the degree to which they depend on the fishing industry, as well as potential inherent capacities and resources that enable them adapt to changes and manage stresses. Questions in the survey were specifically aimed at understanding a community’s dependence on the fishing industry, whether previous changes in the fishing industry had also impacted the community and the degree of social capital within the community (Figure 10). These indicators and attributes can provide insight into a community's ability to adapt.
68
North-west Marine Region social and economic assessment ABARES
The majority of these 26 respondents from the North-west Marine Region indicated that:
previous changes that have affected the fishing industry have also affected our community
other fishing businesses in my community will be impacted
the fishing industry supports my community
the community I live in is highly reliant on the fishing industry
people are willing to help each other out.
In interviews, participants also reported on the dependence on the fishing industry, identifying limited opportunities for employment and growth in Carnarvon (see Case study: Carnarvon—flow-on impacts to the community).
Figure 10 Ability to adapt—community
People around here are willing to help each other out
I have done unpaid work for a community group in the past 12 months
I am an active member of a local community group
The fishing industry supports my community
The community I live in is highly reliant on the fishing industry
Previous changes that have affected the fishing industry have also affected our community
Other fishing businesses in my community will be impacted
0 20 40 60 80 100
Strongly agree Agree Neither agree nor disagreeDisagree Strongly disagree
Percentage of respondents
Data source: ABARES, Your marine areas matter: a survey of commercial fishers' values and preferences for Commonwealth marine reserves in the North and North-west Marine Regions of Australia
69

North-west Marine Region social and economic assessment ABARES
Community and personal impacts summary Several key messages emerge about the personal and community impacts and ability to adapt:
Survey results indicated that the majority of the respondents (18 out of 22) would be likely to stay in the industry if the draft marine reserves were declared. At a personal level, for many of them, this would result in increased stress, a need to work longer hours, less time with their family, and the possibility that their family’s quality of life would suffer. Most of these fishers did not indicate an intention to relocate to a new town if the draft marine reserves were declared. Some fishers’ capacity to adapt is illustrated by two individuals who reported in their interviews their desire to stay in the industry and to consider a range of other options for their business.
A smaller number survey of respondents indicated they would leave the industry if the draft North-west Commonwealth Marine Reserves Network was declared (3 of 22). They envisaged that there would be risks involved in the transition and that their employees would be without a job.
The respondents’ general perception is that their communities rely on the fishing industry, and that any impacts on the fishing sector will therefore have an impact on their communities.
For the community of Carnarvon, the key themes were reliance on the fishing sector for employment and development opportunities, both within the fishery industry and flowing on into other sectors; and the contribution of the fishing sector to economies of scale in Carnarvon and the benefits that brings. These themes can be applied to other small-to-medium scale communities across the North-west Marine Region where fishing is a significant industry.
70
North-west Marine Region social and economic assessment ABARES
6 Case studiesThe purpose of the case studies was to provide a broader understanding of how the impacts of the draft North-west Commonwealth Marine Reserves Network would emerge at different levels. This provided a means of exploring the impact through a number of different perspectives, from an individual business’s perspective through to that of a community. Case study themes and topics were chosen through consultation with industry, state governments and the Australian Government Department of Sustainability, Environment, Water, Population and Communities (SEWPaC). Working group members agreed on four case studies, presented in this chapter across a range of key themes:
Carnarvon—supply chain and flow of impacts to the community
Western Tuna and Billfish Fishery—displacement and prospective fishing
Shark Bay, Kimberley and Nickol Bay prawn fisheries—variability in prawn production
West Coast Demersal Gillnet and Longline Fishery—individual fisher.
Telling the fisher’s story: a narrative approachA case study narrative approach was adopted for case studies 1, 2 and 4. The narrative case studies are specifically intended to 'tell the fisher's story' about potential impacts. For the most part, ABARES has simply reflected the perceptions of impact. This approach provides a broader contextual understanding of the impacts that representatives of fishing communities think they will experience as a result of the draft North-west Commonwealth Marine Reserves Network. A mixed-methods social science research methodology was used to develop these narratives, with material sourced from qualitative data from interviews and focus groups, with additional quantitative and qualitative data provided by the survey and literature.
Macroeconomic contextThe success of a fisheries operation depends on a wide range of factors, some of which are within the control of the operator, and many of which are outside their control. These include broader economic trends such as the exchange rate, the fuel price, competition for labour and international market effects. The following case studies should be read in this context.
Exchange rateThe value of the Australian dollar is outside the control of fisheries operators, but has been a significant factor in determining profitability, particularly in highly export dependent fisheries. The value of the Australian dollar relative to the value of the currencies of major trading partners can have a significant impact on the value of exported fisheries products. An appreciation of the Australian dollar (i.e. an increase in the value of the Australian dollar relative to the currency of a trading partner) will make the price received by Australian producers decrease and make imports more competitive. A depreciation of the Australian dollar will result in an increase in the price received by Australian producers and make imports less competitive. Producers who supply domestic markets may also be affected if they compete with imported products. Since 2000, the Australian dollar has appreciated significantly, which has placed downward pressure on the price of Australian fisheries product exports (Figure 11) and made imports cheaper relative to domestically produced seafood.
71
North-west Marine Region social and economic assessment ABARES
Figure 11 Commonwealth fisheries gross value of production (GVP) and Australian dollar exchange rate, 2000–01 to 2009–10
2000-01
2001-02
2002-03
2003-04
2004-05
2005-06
2006-07
2007-08
2008-09
2009-10
0
100
200
300
400
500
600
700
0
0.5
1
1.5
2
2.5Commonwealth fisheries GVPExchange rate
2009
-10
Aust
ralia
n do
llars
(mill
ions
)$A/$US
Data source: ABARES 2011b
Fuel priceFuel is a major input to most fisheries businesses. For example, fuel accounted for around 26 per cent (in 2009–10) of average total cash costs in the Northern Prawn Fishery, and around 14 per cent (in 2008–09) in the Eastern Tuna and Billfish Fishery (ABARES 2010; ABARES 2012a).
The price paid for fuel by fishers is closely related to international oil prices, which have increased significantly in recent years (Figure 12). This substantially increased costs for many fishers, placing additional pressure on the profitability of many fisheries operators.
Figure 12 Real average off-road diesel price, inclusive of farm rebates and subsidies, but excluding GST, 2000–01 to 2009–10
2000-01
2001-02
2002-03
2003-04
2004-05
2005-06
2006-07
2007-08
2008-09
2009-10
2010-11
0
20
40
60
80
100
120
2009
-10
cent
s/Lit
re
Data source: ABARES 2011a
72
North-west Marine Region social and economic assessment ABARES
Competition for labourThe competitive nature of the labour market and the need to compete with other industries has presented some issues for the fishing sector in attracting employees with desired skill sets. The Australian mining industry has grown strongly over the past decade, with the value of resources and energy exports increasing at an average annual rate of around 12 per cent from 2000–01 to 2010–11 (BREE 2011). This has increased labour demand from the industry, resulting in increased competition for labour economy-wide. This includes unskilled workers (who could be employed as fishing crew) and people with transferrable skills, such as skippers and engineers, resulting in some people leaving the fishing industry to work in the mining industry for higher and more secure income. Competition for labour from the mining industry is particularly relevant in Western Australia and Queensland, given the substantial mining industries in these states. This has placed additional pressure on some fishing operations where labour is a significant input to the production process.
International market effectsExporters of Australian seafood compete with other international seafood suppliers and, for many species, Australian producers are unable to influence the world price. Therefore, changes in supply in other countries can have a significant impact on the price that Australian producers receive for their product. For example, the increased supply of aquaculture prawns from the developing world, particularly China, has resulted in downward pressure on prawn prices.
73

North-west Marine Region social and economic assessment ABARES
Case study: Carnarvon—flow-on impacts to the communityThis case study considers the impacts of potential displacement in the Shark Bay Prawn Fishery on the community of Carnarvon. Nor-West Seafoods is the majority licence holder in the Shark Bay Prawn Fishery and supports the majority of fishing industry employment in the community. Information used in this case study was obtained from reference information and an interview with Nor-West Seafoods and industry representatives in December 2011 as part of the social impact assessment process.
Carnarvon backgroundCarnarvon is located on the edge of the Gascoyne river delta in the north-west of Western Australia, approximately 900 km north of Perth. The statistical local area (SLA) of Carnarvon had a usual resident population of 5284 in 2006, down from 6393 in 2001. Carnarvon experiences an influx of people—usually tourists—at periods throughout the year, with the population swelling by up to 3000 people. Carnarvon also has a significant proportion of seasonal residents, usually transitory people employed in the horticultural and fishing industries.
Carnarvon has five main industries: horticulture, mining (salt and gypsum), fishing, tourism and pastoral agriculture, all of which are significant contributors to the local economy. In 2006, the consolidated fishing industry employed 223 people, or 4.2 per cent of the workforce (Carnarvon SLA, 2006). Of these, 81 people were employed in seafood processing and fish and seafood wholesale (Carnarvon SLA, 2006). Carnarvon has strong links to the prawn, mollusc, lobster, crab and wetline fisheries, and particularly the Shark Bay Prawn Fishery (Fletcher & Santoro 2011).
Although the consolidated fishing industry only represents 4.2 per cent of employment, interview participants highlighted the important role the fishing industry plays in supporting employment and development in other sectors. This includes flow-on effects to retail, accommodation and food services, construction, manufacturing, transport, postal and warehousing services, and administrative and support services, among others. This support is provided through the need to supply boats, crew, and housing and support services, and by providing seasonal employment that complements the other industries. For example, people working in the seasonal fishing industry can find employment in the horticultural industry during the off-season, and vice versa. The seasonal nature of the industry also supports employment of itinerant travellers and therefore may indirectly support the wider tourism industry for the Western Australian (WA) coast.
Dependency on fishingIn 2009–10, the Shark Bay Prawn Fishery was valued at $16.8 million and the Shark Bay Scallop Fishery was valued at $5.5 million gross value of production (GVP; WA DoF 2011). There are currently 18 licences in the Shark Bay Prawn Fishery, following an industry buyback of 9 inactive licences. There were approximately 150 skippers and crew employed in the Shark Bay Prawn Fishery during 2010, with approximately 100 additional processing and support staff employed in Carnarvon (Fletcher & Santoro 2011). This is supported by Australian Bureau of Statistics data that indicates that 81 people were employed in seafood processing and fish and seafood wholesaling in 2006.
Nor-West Seafoods holds 10 of the 18 licences (55 per cent of the total in the fishery). Nor-West Seafoods is based in Carnarvon, with administration, wharf and engineering staff based at the boat harbour and a processing factory at Babbage Island, where all of the Nor-West Seafoods' catch from the Shark Bay Prawn Fishery is processed (equating to approximately 1600–2000 tonnes per year) (R Johnson, pers. comm., Nor-west Seafoods, 16 November 2011). The
74

North-west Marine Region social and economic assessment ABARES
company employs between 75 and 100 people; approximately 70 per cent of staff are permanent (Fletcher & Santoro 2011). Nor-West Seafoods also has Kimberly Prawn Fishery endorsements and processes other products, including scallops, crabs and squid for the domestic and export markets. Fishers commented that the Shark Bay Prawn Fishery is one of the most stable prawn fisheries in Australia.
Reduction in catch for the Shark Bay Prawn Fishery could have indirect economic impacts for the town because Nor-West Seafoods is one of the largest employers in Carnarvon. Nor-West Seafoods sends 20 trucks per month to Fremantle. Where possible, operators in the Shark Bay Prawn Fishery also use Western Australian service companies that provide engineering supplies, packaging, transport logistics, ship stores and fuel (Fletcher & Santoro 2011). Activities in Carnarvon that are potentially impacted by a reduction in catch include other fishing boats, trucking companies, logistics and fuel businesses, and refrigeration and electrical businesses. For example, it was estimated that vessels use approximately 1500 litres of fuel per night (R Johnson, pers. comm., Nor-west Seafoods, 16 November 2011). Supply of foods and other items to fishing boats is also economically important for the town: 18 boats (including 10 boats directly contracted by Nor-West Seafoods) resupply in Carnarvon approximately once a month during the fishing season, each with a crew of 4–8 people. This is done mostly through Woolworths or IGA, the butcher shop, the baker and other stores. The fleet works from moon to moon, and fishers work 21–22 days of the month. The vessels then come into Carnarvon for 7–10 days. Refits for the 10 vessels that supply Nor-West Seafoods are also done in Carnarvon.
ImpactDisplacement estimates for the total Shark Bay Prawn Fishery indicate that an annual average of 18 tonnes and $195 000 GVP may be displaced as a result of the draft Shark Bay marine reserve (representing 0.8 per cent of the annual average GVP for the period 2008–10, Table 4). Approximately $98 000 of GVP is estimated to be displaced from Carnarvon as a result of the combined impact of the draft North-west Commonwealth Marine Reserves Network (Map 2). Supply chain analysis (from survey data) indicates that the Shark Bay, Gascoyne and Carnarvon Canyon marine reserves would have the greatest impacts (Map 6 and Map 8). However, Carnarvon industry representatives maintained that, in 2010, 20 per cent of the catch was taken from an area overlapping with the draft Shark Bay marine reserve, and this was estimated to represent a net value of $3–4 million. They commented that this fishery has highly variable returns because of the inherently variable nature of prawn production (see Case study: Shark Bay, Kimberley and Nickol Bay prawn fisheries—variability in prawn production), and that annual averages may not accurately represent potential displacement in any given year. In contrast, logbook data trends suggest that Shark Bay Prawn Fishery is one of the most stable fisheries, and ABARES estimates (see Appendix A: Fisheries data processing methods) based on data from 2008–10 suggest that the maximum displacement by the draft Shark Bay marine reserve in 2010 would have totalled approximately $400 000. These estimates are believed to have medium accuracy, as they are based on 10-minute data, although industry has suggested that the period 2008–2010 may not reflect the long-term average because of annual variability in catch from this part of the fishery.
The variable nature of prawn production means that the area of the Shark Bay Prawn Fishery that overlaps with the draft Shark Bay marine reserve is fished in some years but not others. It has been suggested that, if fishers are unable to access this area, fishing practices may change, possibly resulting in smaller prawns being caught earlier on, and/or a shortening of the season. Both of these effects would reduce overall turnover within the Shark Bay Prawn Fishery. Furthermore, industry commented that, even though the overlap was a small area, in some years it might affect the viability of the fishery. Because most prawn fishers work with a business diversification model (see Case study: Shark Bay, Kimberley and Nickol Bay prawn fisheries—variability in prawn production for more detailed discussion), this may affect total business
75
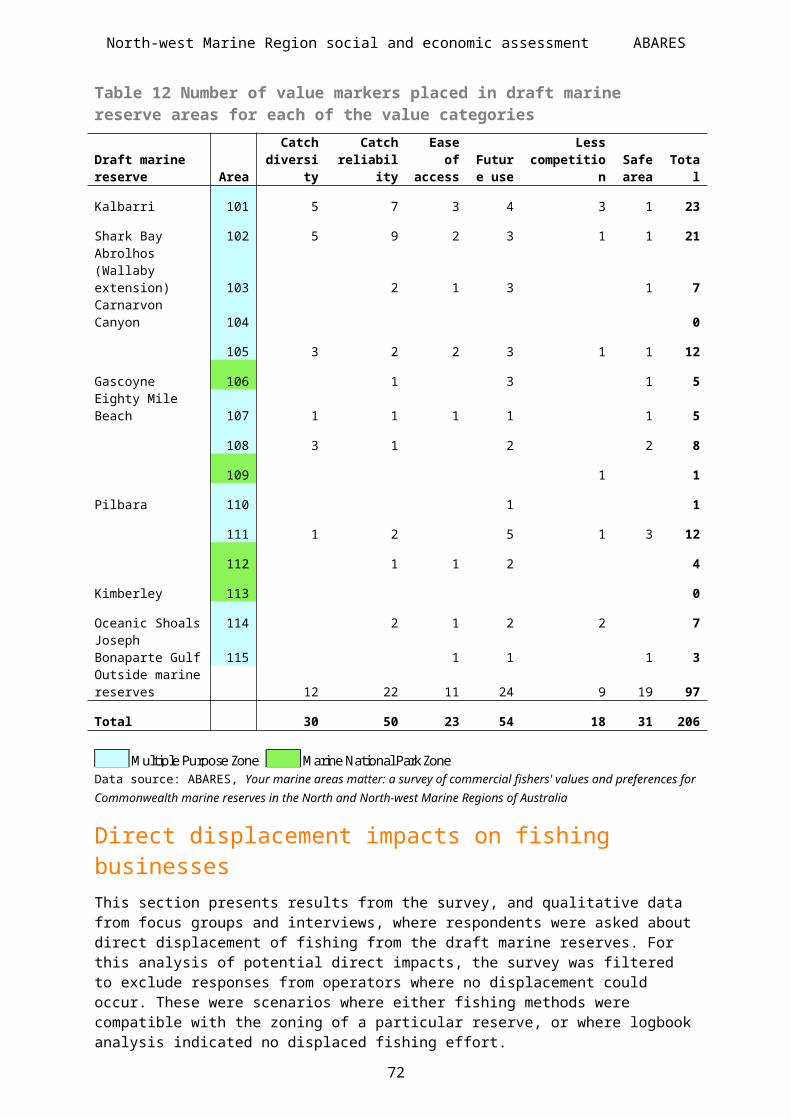
North-west Marine Region social and economic assessment ABARES
viability for the other prawn fisheries, given operators often hold licences for multiple fisheries. One fisher said that, in 2010, in addition to more than 97 tonnes of prawns, 297 tonnes of crab were harvested, worth approximately $2 million. In other years, scallops (in the Shark Bay Scallop Fishery) are important to ensure the viability of businesses involved in the Shark Bay Prawn Fishery.
Participants suggested that the following impacts on Carnarvon could result from reduced catch because of the draft Shark Bay marine reserve. A number of these impacts relate to the viability of Nor-West Seafoods, if displacement resulted in a decline in business outputs:
increase in prawn prices (given competition with imports)
reduction in employment in processing and distribution
reduction in employment in vessel servicing
reduction in income to supermarkets that supply boats
increase in fuel costs because of a reduction in fuel use by fishers, and therefore reduced cost advantages from less bulk fuel needed for Carnarvon
impacts on electricity supply (i.e. more blackouts, longer wait times) because having a large processing company in town helps to justify investment in electrical infrastructure.
It was commented that, if these impacts were significant, Nor-West Seafoods may need to look at options to offset losses, including possibly taking the factory and processing overseas. This has the potential to affect other operators within the region because they would need to change where they take their catch for processing.
The Carnarvon community will potentially face particular challenges as a result of the draft North-west Commonwealth Marine Reserves Network. Although dependence on the fishing industry in terms of direct employment is relatively high compared with other communities in the North-west Marine Region, in absolute terms it only represents 4.2 per cent of the labour force (data from 2006). However, this needs to be considered in terms of the flow-on impacts to the community through the fishing industry supply chain. The impact on indirect and induced employment (i.e. the employment generated from income earned by direct and indirect employees), money from which is spent in the local economy, could be significant. Further, measures of adaptive capacity in Carnarvon indicate that the community may face difficulties in lessening the impacts generated by the draft North-west Commonwealth Marine Reserves Network (see Table 10).
76
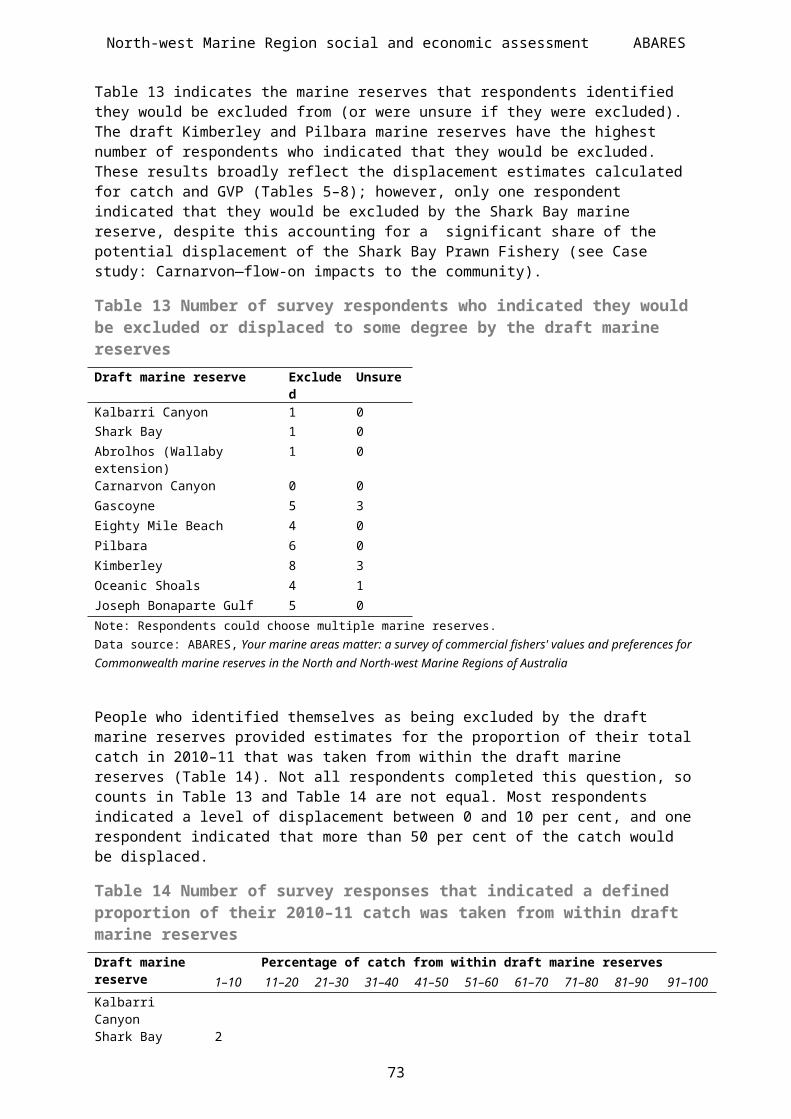
North-west Marine Region social and economic assessment ABARES
Case study: Western Tuna and Billfish Fishery—displacement and prospective fishingThis case study explores two potential impacts on the Commonwealth Western Tuna and Billfish Fishery of the draft North-west Commonwealth Marine Reserves Network. Reference is also made to the draft South-west Commonwealth Marine Reserves Network (ABARES 2012d), including the potential displacement of an individual fisher and potential impacts on prospective fishing.
Information used in this case study was obtained during the assessment, including the survey and interviews conducted in November 2011, as well as from data held by ABARES. Estimated annual displacement of the Western Tuna and Billfish Fishery in the North-west Marine Region for the period 2001–10 was relatively low (2.0 tonnes and $11 700GVP from the draft Gascoyne and Pilbara marine reserves) due to the reduced fishing effort in the last decade. However, the impact is likely to fall on one individual and there are potential implications for prospective fishing within the draft marine reserves.
The Western Tuna and Billfish Fishery operates within Commonwealth waters from the South Australian–Victorian border to the tip of West Cape York, Queensland. Operators use pelagic longlines to harvest fish in two key areas (Woodhams et al. 2011): the South-west Marine Region yields bigeye tuna and broadbill swordfish for lucrative international sashimi markets, and the North-west Marine Region produces yellowfin tuna and albacore for the domestic market. At present, more than 90 per cent of the fishing effort of the Western Tuna and Billfish Fishery is concentrated in the South-west Marine Region because of the higher value species; however, historically, effort has extended along the whole western seaboard.
Interviewees and industry have stressed that the potential effects of the draft North-west Commonwealth Marine Reserves Network need to be considered in conjunction with those of the draft South-west Commonwealth Marine Reserves Network (i.e. cumulative impacts) (ABARES 2012d). In the case of the Western Tuna and Billfish Fishery, both marine regions are fished at different times, provide different target species and contribute separately to the operation of the Western Tuna and Billfish Fishery. Industry has suggested that exclusion of fishing from either the South-west Marine Region or the North-west Marine Region would potentially result in an unviable fishery.
Potential displacement of an individual fisherThe fisher whose business is described here employs seven full-time, seven part-time and one casual staff. The business operates out of Fremantle because competition for wharf space prevents the use of other ports. All inputs for the business are purchased from Fremantle suppliers, and catch is processed at a local packing house before delivery (fresh or frozen) to Japanese or domestic markets. The company is experiencing several pressures including high costs for inputs such as satellite data, fuel and insurance; exclusion from fishing in areas used for oil and gas exploration; high boat traffic (which damages fishing gear); and difficulty attracting skilled employees.
The business is working towards generating increased demand for the products in Asia, and a joint venture to establish and operate a packing house in Fremantle is currently under negotiation. Due to his age, the fisher no longer wants to skipper his vessel, and plans to run the packing house while employing a skipper to run his vessel. A fisheries consultant suggests that the viability of the business and the required onshore infrastructure (such as packing houses) is critical to the economic value of the products.
77

North-west Marine Region social and economic assessment ABARES
If the draft Gascoyne and Pilbara marine reserves are declared, the fisher has identified the following impacts on his business:
Uncertainty of catch. The Marine National Park zones of the Gascoyne and Pilbara marine reserves, together with the self-imposed buffer zone (30–60 nautical miles, depending on ocean current speed and direction, to ensure that longlines do not drift into the zones), will exclude the fisher from productive fishing areas. He is concerned that this loss, in conjunction with that potentially caused by draft marine reserves in the South-west Marine Region (ABARES 2012d), will prevent him from catching sufficient fish to maintain his business.
Stalled plans to build a packing house. Plans to build a packing house have halted following the announcement of the marine reserve planning process. It has created uncertainty about whether the establishment of a packing house will be supported by future catch levels. The fisher feels that the draft marine reserves have deterred potential business partners from joining the company.
Loss of trusted staff and uncertain succession plans. The fisher has indicated that, because both the fisher and his skipper are liable for prosecution if longlines drift into the Marine National Park zones, the skipper intends to leave the fishing industry if the draft marine reserves are declared. The fisher is concerned that he will be unable to find a competent replacement skipper whom he can trust to manage his fishing operations. The fisher’s plan to cease his role as skipper would be postponed until he could find a replacement skipper.
The fisher believes that the draft Gascoyne and Pilbara marine reserves, together with draft marine reserves in the South-west Marine Region, will force him to move out of the Australian Fishing Zone. He believes the only way forward for his business will be to travel greater distances and fish in international waters. However, this would require substantial investment to obtain more crew and a larger vessel that can withstand adverse weather and compete with large foreign fishing vessels.
Potential impacts on prospective fishing Prospective fishing in the Western Tuna and Billfish Fishery could include redevelopment of fisheries that have ceased operating or are operating at a reduced level (i.e. catches well below long-term sustainable levels or defined management levels), or redevelopment of historically productive areas.
The Western Tuna and Billfish Fishery was a large fishery, comprising two commercial operations: Japanese longlining and domestic longlining. A joint arrangement initiated in 1987 for Japanese large-capacity longline vessels to fish within the region terminated in 1997. After this, the domestic Western Tuna and Billfish Fishery developed, with 28 vessels in 1998 and 51 in 2000 when catches for the domestic fishery peaked at 3700 tonnes. However, due to low return prices and high operating costs, effort declined sharply and, by 2008, there was only one active vessel in the fishery (Wilson et al. 2010). Participation has remained low since then, with only four active vessels in 2009, and currently only two vessels that are actively fishing in the region. Given the history of fishing and historical catch data, there is prospective value in redeveloping the fishery in the South-west and North-west Marine Regions.
Industry and fisheries consultants suggest that the North-west Marine Region could support expansion of the fishery and an increase in effort helped by the introduction of new technology and fishing methods. Industry states that effort in the Western Tuna and Billfish Fishery is currently limited by unfavourable exchange rates, but that changing market conditions (e.g.
78
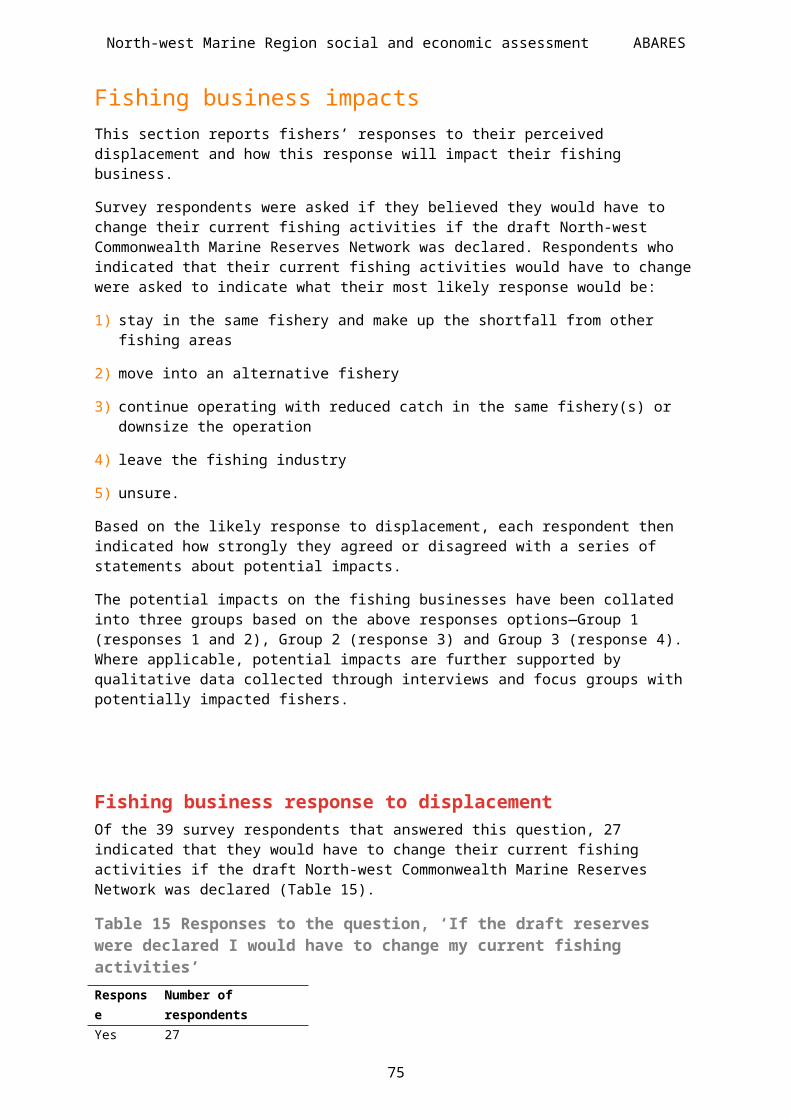
North-west Marine Region social and economic assessment ABARES
rising prices, a weakening Australian dollar, new markets) may make the North-west Marine Region important for future expansion of this fishery (CFA & WAFIC 2011).
Licence holders in the Western Tuna and Billfish Fishery have indicated that they are exploring the option of expanding fishing activity to target bigeye tuna in the temperate waters near the draft South-west Corner marine reserve (refer to ABARES 2012d) and yellowfin tuna in the North-west Marine Region. One such company currently owns approximately 23 per cent of the total quota across mixed species and holds 25 boat statutory fishing rights. This company has indicated that, since late 2009, they have invested significant time and resources in negotiations to lease substantially more quota, and contract Taiwanese and Japanese longline super freezer vessels to fish the cumulative allocation. However, this venture has stalled due to the uncertainty generated by the draft South-west Commonwealth Marine Reserves Network and draft North-west Commonwealth Marine Reserves Network (see also Prospective Fishing in ABARES 2012d).
There is significant concern within the industry that, if the draft marine reserves are declared, it will damage the prospective fishing and economic potential of the Western Tuna and Billfish Fishery. Potential impacts on prospectivity may be reflected in the reduced sale prices of Western Tuna and Billfish Fishery quota. One survey respondent advised that holders borrow against their Western Tuna and Billfish Fishery quota, and that the marine reserve proposal has reduced the value of quotas; the fisheries consultant shared this view. Furthermore, fishers have indicated that the trade value of licences is a combination of the prior catch and potential future catch. Consequently, the trade value of licences has decreased due to uncertainty of future catch as a result of the draft North-west Commonwealth Marine Reserves Network.
The calculations of potential displacement estimates for the Western Tuna and Billfish Fishery using the standard methodology are low relative to estimates that use an earlier reference period (see Appendix A: Fisheries data processing methods). Although the estimates in this assessment are believed to have high accuracy because they are based on shot-by-shot position data (latitude and longitude), the reference period of 2001–10 will not accurately reflect prospectivity for the Western Tuna and Billfish Fishery. In contrast to currently active or existing fisheries, the impacts of changes to fisheries policy on prospectivity are not easily quantified. However, industry (CFA & WAFIC 2011) suggests that prospectivity may be inferred from:
previous exploratory catch history
previous fishery-independent surveys (e.g. trawl surveys, aerial surveys)
previous catches by foreign fleets.
Therefore, aggregate catch data for the Western Tuna and Billfish Fishery from the 1980s and 1990s was examined. These data indicate that the most productive regions historically (which could offer potentially important zones for the future development of the fishery) are predominantly located outside the Marine National Park Zones (the only zoning that excludes pelagic longlines) in both the North-west and South-west Marine Regions (Map 10). However, industry representatives have highlighted that the prospective plans for the fishery would not necessarily focus on these historical fishing grounds because of changes in technologies and fishing methods. Additionally, they stated that newer fishing areas would include areas closer to the major ports (e.g. Exmouth) to ensure higher quality produce is returned to consumers.
This fishery has not yet been redeveloped, so prospective fishing value is not well reflected in the recent fishery data used to calculate potential displacement. Although this is out of the scope of the current assessment, if the business could provide clear evidence of investments to date to
79
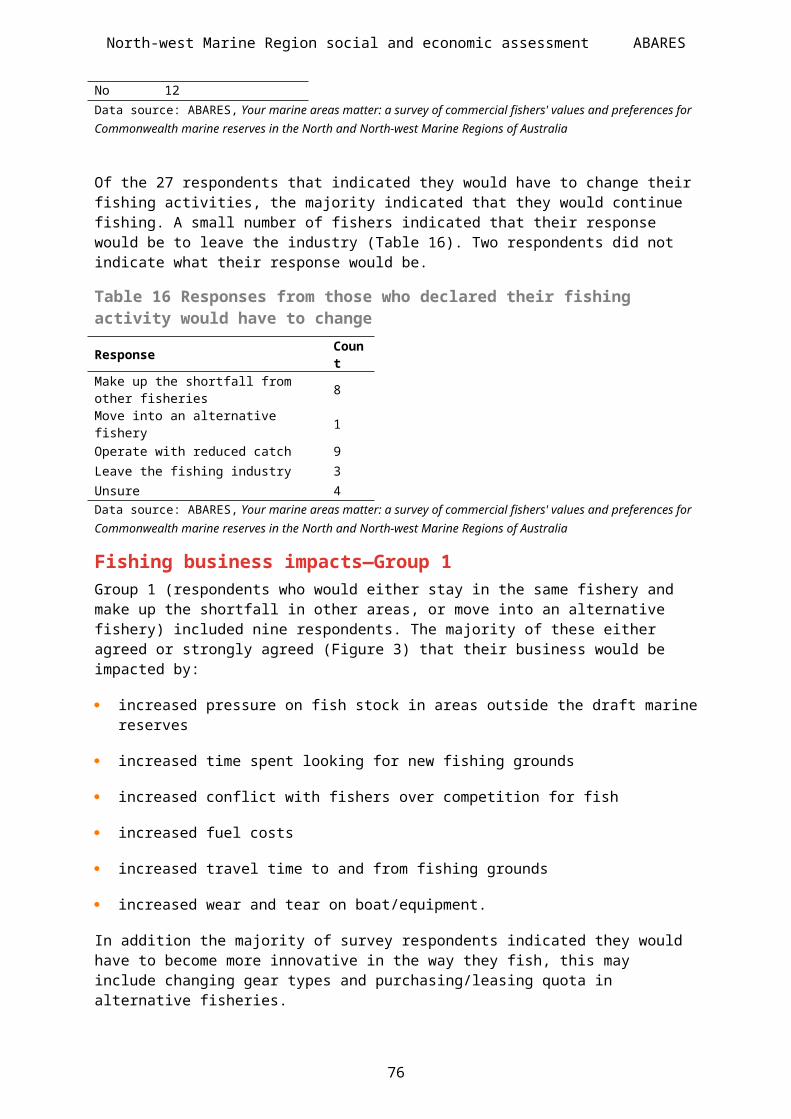
North-west Marine Region social and economic assessment ABARES
redevelop the prospective fishery, it may be possible to estimate potential loss associated with the draft marine reserves.
Map 10 Japanese and Australian pelagic longline fishing catches during the decades 1980–89 and 1990–99
80
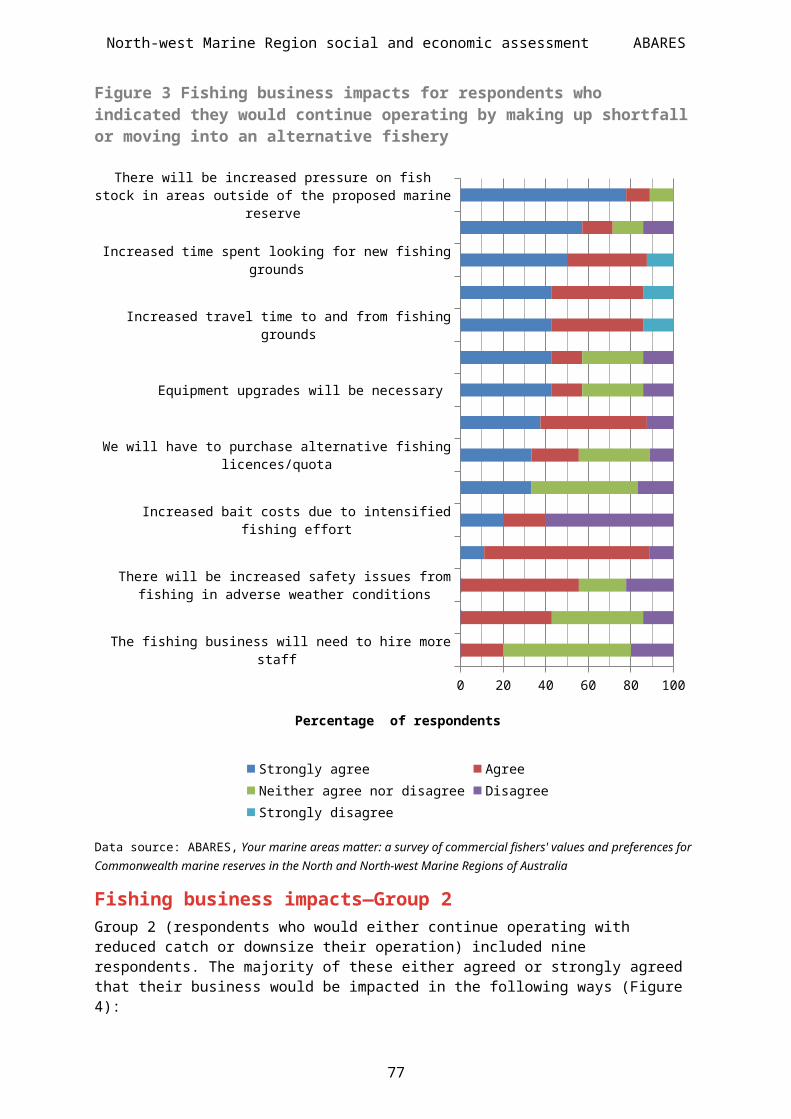
North-west Marine Region social and economic assessment ABARES
Note: Draft marine reserve boundaries for the both the South-west and North-west Marine Regions are overlaid on the catch data—pelagic longline fishing would be excluded from the Marine National Park Zone only (green zones).Data source: Australian Fisheries Management Authority logbook data; marine reserve boundaries from Australian Government Department of Sustainability, Environment, Water, Population and Communities;
81

North-west Marine Region social and economic assessment ABARES
Case study: Shark Bay, Kimberley and Nickol Bay prawn fisheries—variability in prawn productionThis case study explores the inherently variable nature of the prawn fisheries and the business diversification used by many fishers in these fisheries. This approach intends to examine the environmental factors that drive variability and highlight the potential issues that need to be considered when estimating displacement as a result of the draft North-west Commonwealth Marine Reserves Network. A mixed-methods social science research methodology was used to develop this case study, with material sourced from qualitative data from interviews and focus groups, with additional quantitative and qualitative data provided by the survey and literature.
There are currently three Western Australian (WA) prawn fisheries that fully operate in the North-west Marine Region: the Shark Bay Prawn Fishery (GVP of $16.8 million in 2010), the Kimberley Prawn Fishery ($2.2 million) and the Nickol Bay Prawn Fishery ($0.6 million [note combined production with the Onslow Prawn Fishery and Broome Prawn Fishery, as reported in Fletcher & Santoro 2011]). The Commonwealth Northern Prawn Fishery has limited operation in the North-west Marine Region (see Chapter 2: Potential displacement of fishing), and therefore will not be explicitly discussed in this section; however, it is anticipated that the impacts on this fishery will have cumulative effects to the North Marine Region, where the majority of the fishery operates. The WA prawn fisheries are managed through a combination of limited entry, effort controls, seasonal and spatial closures, gear controls and restrictions, and restrictions on vessel replacements. Target species across all fisheries include banana, western king, brown tiger, endeavour and coral prawns (Fletcher & Santoro 2011).
Potential displacement estimates for catch and GVP for the prawn fisheries rank the Shark Bay Prawn Fishery (estimated displacement: 18 tonnes and $195 500 GVP) and the Kimberley Prawn Fishery (13.2–16.3 tonnes and $145 100–179 400 GVP) as two of the most affected WA fisheries. The Nickol Bay Prawn Fishery (1.6–5.0 tonnes and $17 800–55 000 GVP) would be impacted to a lesser extent. The potential displacement of these fisheries has further flow-on impacts for the region because the majority of GVP from these fisheries flows through to Fremantle, Carnarvon, Point Samson and Darwin.
Prawn production in northern Australia is highly dependent on natural environmental influences at critical times in the prawn lifecycle, including rainfall and run-off events that provide high nutrient flows, and the flow of ocean currents (namely the Leeuwin Current in the North-west Marine Region) that bring warmer waters. These environmental influences are driven by climatic events. La Niña has been associated with the 2010 flooding and more frequent and larger run-off events, and also resulted in a stronger Leeuwin Current and warmer water temperatures (Fletcher & Santoro 2011). Rainfall in northern Australia is highly irregular; consequently, annual prawn production (particularly banana prawns) is inherently variable and prawn fishing grounds may vary in productivity between years (Fletcher & Santoro 2011).
Prawn prices are influenced by a range of factors, including international and domestic demand, competing supply, and changes in the value of the Australian dollar. An appreciation of the Australian dollar against trading partners' currencies results in a lower return for exported prawns. Industry has indicated that this results in larger volume of prawns directed to the domestic market, which also places downward pressure on domestic prices. This generally results in an overall reduction in the economic return per kilogram.
The Shark Bay Prawn Fishery is managed to maximise the economic return by catching prawns at the best size and condition for market, shifting fishing effort away from times of reduced catch, and maintaining breeding stock (Fletcher & Santoro 2011). Industry has stated that annual variability in both catch volumes and prices reduces confidence in the calculated
82
North-west Marine Region social and economic assessment ABARES
displacement estimates because the three most recent years may not be representative of an average period. For example, there has been considerable variability in the catch for the Shark Bay Prawn Fishery throughout the reference period (2008 to 2010, inclusive): total annual catch has varied from approximately 4.5 tonnes in 2008 to 10.4 tonnes in 2009 and 38.9 tonnes in 2010.
Each prawn fishery is a management area defined in statute because of its separate biological or regional characteristics, and does not necessarily represent a discrete group of fishers. From a business point of view, each prawn fishery forms part of a whole suite of interlocking fisheries across the north of Australia. Individual prawn fishers therefore often have authorisations to fish in multiple fisheries, from Shark Bay in Western Australia to the Queensland east coast near the New South Wales border (CFA & WAFIC 2011). For example, in 2010 there were 126 licensees in the Kimberley Prawn Fishery, and 31 of these also held Northern Prawn Fishery licences (Fletcher & Santoro 2011).
Prawn fishers typically use a business diversification model, where they move among and within fisheries to fish the areas with the best prawn production throughout the season and between years. From an operator’s point of view, it is one business, but because of the legislative responsibilities (state waters or Commonwealth waters) and boundaries within each jurisdiction, the trawler operators must have access to multiple fisheries to move to areas with the highest abundance. Given the inherent variability in prawn production, a fishery (or part of a fishery) may have long periods where no fishing occurs, and then be fished again. This results in intermittent fishing in small but widely separated areas. For example, the eastern extremity of the Nickol Bay Prawn Fishery has not been heavily fished for many years, but is regarded by industry as an important area in the network of prawn grounds that support northern Australian prawn fisheries (CFA & WAFIC 2011).
Due to the inherent variability in prawn production and the diversification of fishers, there is the potential for cumulative impacts on individual fishers through the impacts of multiple marine reserves on a number of fisheries. Industry states that the closure of a prawn fishing area as the result of a marine reserve being declared effectively reduces every fisher’s options for the region. If access to any fishery is lost, the operators’ risk minimisation strategy is weakened: if fewer grounds are available for fishing, this increases the risk that there will be few productive grounds in any particular season. Furthermore, if the areas that a fisher has access to (based on their suite of authorisations) are all at unviable levels of production at the same time, or in the same year, the fisher will have a year of no income.
The variability in prawn production and the flow-on of this through the relevant fisheries has significant implications for the industry’s confidence in displacement estimates. Although ABARES suggests that the estimates provide a reasonable (medium) level of accuracy because they are based on 10-minute reporting grids (with the exception of the Kimberley Prawn Fishery), the reference period applied is limited to a three-year period (2008 to 2010), which industry has suggested may not reflect the long-term average because of annual variability in prawn production.
83
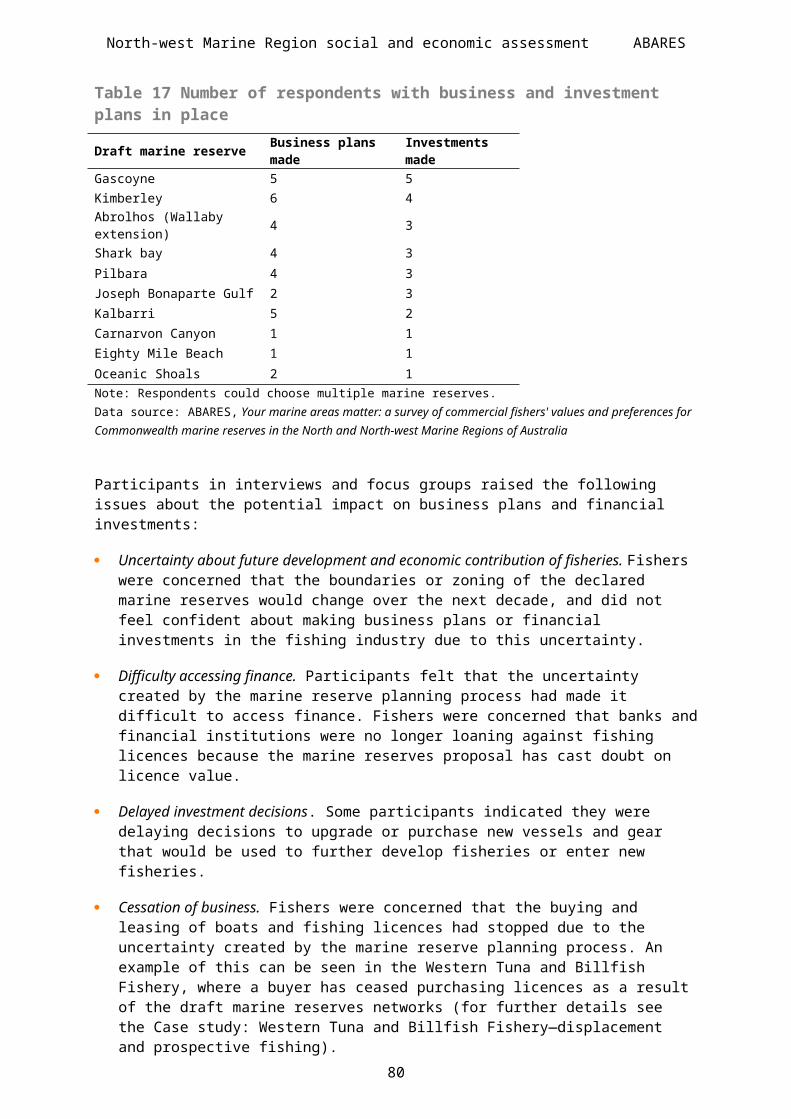
North-west Marine Region social and economic assessment ABARES
Case study: West Coast Demersal Gillnet and Longline Fishery—individual fisherThis case study explores the potential impacts of the draft Kalbarri marine reserve on an operator fishing in the West Coast Demersal Gillnet and Longline (WCDGDL) Fishery. A mixed-methods social science research methodology was used to develop this case study. Information was obtained from the survey and an interview with the potentially displaced fisher in December 2011 as part of the social impact assessment process. Additional qualitative obtained through relevant literature.
The WCDGDL fishery extends northwards from latitudes 33°S to 26°S (Fletcher & Santoro, 2011), crossing the boundaries of both the North-west Marine Region and the South-west Marine Region. The majority of operators use demersal gillnets to target shark, and scalefish is also a legitimate component of the catch. The estimated catch value for 2010–11 was $0.7 million for shark and $0.2 million for scalefish (Fletcher & Santoro 2011). The value of the fishery has been higher in previous years, and reached $1.3 million in 2006–07 (Fletcher & Santoro 2010).
There are 20 WCDGDL permits. However, only four vessels were active in the fishery during 2009–10, a level of activity consistent with the previous four years (Fletcher & Santoro 2011). The fishery is managed using transferable time-gear effort units. In conjunction with this, operators distribute fishing effort by allocating specific fishing areas to each operator. Given this arrangement, industry suggests that the impact of the draft Kalbarri marine reserve will be borne by a single operator (‘the fisher’) whose fishing area encompasses the northern most region of the WCDGDL fishery.
The fisher reported that he will be displaced from a significant proportion of his WCDGDL fishing area by the draft Kalbarri marine reserve. He believes the Kalbarri marine reserve will have the largest impact on his business, excluding him from 60 per cent of his WCDGDL fishing grounds. This region is his most productive and, using 15 years of logbook data, he estimates that 70 per cent of his annual income from all fisheries is derived from this area.
The fisher’s business is based in Geraldton, where all catch is landed and business inputs are purchased. He owns and operates one boat, employing three full-time staff and an additional two casual staff, if needed. The majority of the fisher’s income is generated through the WCDGDL fishery, with an additional small amount derived from the West Coast Demersal Scalefish Fishery. The fisher strongly believes the WCDGDL fishery is sustainably harvested, and is proud that his fishing efforts supply affordable fish to low and medium-income families.
The fisher feels he has already lost a sizeable fishing area due to changes in state regulations in recent years, and that the Commonwealth marine reserves would add to this impact. He estimates that, four years ago, approximately 600 square miles were closed to his fishing activities to develop state marine parks and conserve snapper stocks in the Gascoyne region. In addition, he no longer fishes the area north-west of the draft Kalbarri marine reserve because of the recent management decision to limit the take of scalefish from this region.
The cumulative impact of the state regulations and the draft marine reserves has led the fisher to explore alternative options because he believes his business may not be viable if the draft Kalbarri marine reserve is declared. He has spent the past four months fishing the Gascoyne Demersal Scalefish fishery using leased quota, to assess whether this is a viable business option.
84

North-west Marine Region social and economic assessment ABARES
If it is a viable option, the fisher will relocate to Denham to reduce the amount of fuel required to access the fishery. He is experiencing hostility from local recreational fishers who are averse to having another commercial fisherman in the area, and he is concerned that his boat will be vandalised.
If the Gascoyne Demersal Scalefish Fishery is not a feasible venture, the fisher will attempt to make up the shortfall by:
fishing further south in the WCDGDL fishery. This is not the fisher’s preferred option because it would encroach on another operator’s fishing area and therefore yield smaller catches. The fisher is also concerned about the environmental impacts this may have. This view is supported by another WCDGDL fisher, whose survey response voiced concern that his fishing activities would be affected by the fishing effort displaced by the marine reserves.
fishing further north in the West Coast Demersal Scalefish Fishery. The fisher is concerned that this option will not meet the shortfall caused by the marine reserves because the region north of the draft Kalbarri marine reserve is less productive and the increased travel distance requires greater fuel consumption.
85

North-west Marine Region social and economic assessment ABARES
7 Appendixes A: Fisheries data processing methodsThe analysis of commercial fishing gross value of production (GVP) within the draft North-west Commonwealth Marine Reserves Network was based on Commonwealth and Western Australian (WA) state fishers operating in Commonwealth waters. Commonwealth waters extend from 3 nautical miles offshore from the territorial sea baseline to the 200 nautical mile limit of Australia’s exclusive economic zone. Under Offshore Constitutional Settlement arrangements, state fisheries may operate in Commonwealth waters to target agreed species, under the management jurisdiction of state fisheries agencies.
Draft marine reserve boundaries and zoning provided by the Australian Government Department of Sustainability, Environment, Water, Population and Communities (SEWPaC 2011b) form the basis of these analyses. Fisheries logbook data and market data were used to calculate the annual average GVP that may be displaced by the draft North-west Commonwealth Marine Reserves Network.
Notes and caveatsThe estimates of catch and GVP in this report are derived from logbook and market data supplied by the Australian Fisheries Management Authority (AFMA), the Western Australian Department of Fisheries (WA DoF) and ABARES.
Fishing methods were included or excluded from the different zones based on the zoning framework provided by SEWPaC (Table 18 and Table 20):
The estimates use data at two spatial reporting scales:
- Commonwealth data, where the latitude and longitude of each fishing operation is reported—this gives accurate results when assessing the displacement of fishing
- WA data, where the fishing activity is reported by statistical reporting cells (grids of size 10 minutes [18 kilometres] or 60 minutes [111 kilometres])—these data give less accurate results when assessing displacement because marine reserve boundaries do not align with fisheries reporting boundaries. Potential displacement for individual zones and fisheries may therefore be higher or lower than that reported here.
A statistical reporting cell often occupies only a portion of a draft marine reserve. In such cases the catch and GVP are apportioned based on the percentage of the reporting cell that is taken up by the marine reserve. It is assumed that catch is taken uniformly across the area of the reporting cell; however, this may not be the case.
Input from fishing industry representatives and WA state fisheries agencies was used to refine the analyses, where possible.
GVP is not equivalent to the likely cost of structural adjustment that may occur.
All prices used for GVP calculations are average beach prices that have been adjusted to 2010–11 dollars to account for consumer price index (i.e. inflation). Individual operators may obtain higher or lower prices over the course of a year.
GVP is the assessed value of commercial fishery products at the point of landing for the quantity produced, and excludes the cost of transporting, processing and marketing of fish products for wholesale and retail markets. It does not take into account flow-on effects, such as value-adding and other potential benefits to individuals and communities.
86
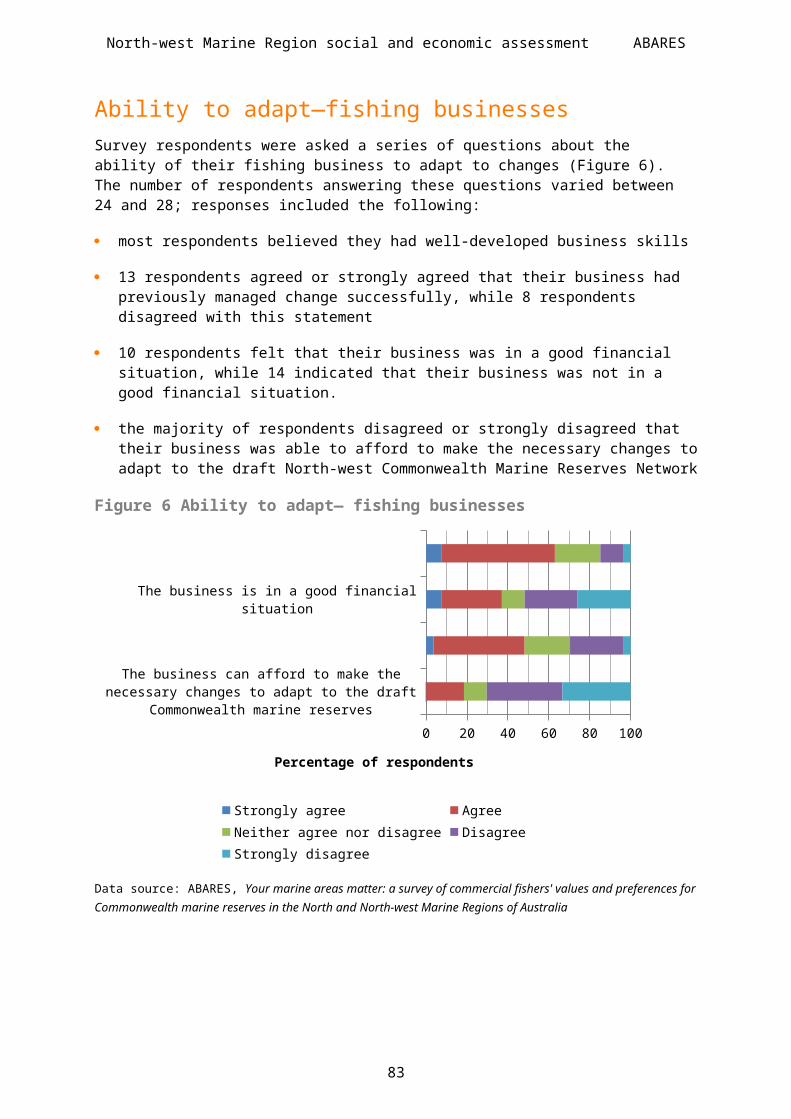
North-west Marine Region social and economic assessment ABARES
Potential displacement calculations are based on different reference periods depending on the jurisdiction. Catch data for Commonwealth fisheries are over a 10-year reference period (2001–10), while most data for WA fisheries was from 2008–10, where data at a higher spatial resolution (10 minutes) were available. Kimberley Prawn Fishery calculations are based on an 11-year reference period (2000–10). GVP for all fisheries was calculated from mean 'recent' prices in the reference period 2007–08 to 2009–10.
Potential displacement estimates are given as the mean annual catch estimated to have been displaced over the reference period. Catches in the most recent years may have been significantly higher or lower than the mean. For example, the Western Tuna and Billfish Fishery was a large fishery in the late 1990s; however, effort declined sharply in the 2000s and participation has remained low in recent years.
This report uses commercial fishery logbook data. These are generally a good reflection of actual catches but are largely unverified. Commercial fisheries logbook data are provided by fishers, then processed and stored by fisheries agencies—misreporting and data entry errors may arise. In addition, reporting of an operation’s spatial coordinates is not necessarily a completely accurate representation of where fishing occurred. For example, trawl operations are assumed to occur in a straight line because only start and end coordinates are recorded in logbooks; in reality, operations are unlikely to occur in a perfectly straight line. However, logbook data are accepted as a reasonable representation of where fishing occurred.
Using historical GVP information to estimate the impact on future fishing activities (i.e. the opportunity cost) should be with caution. This is because GVP will vary with market demand, inflation, exchange rates and the reference period of analysis. Potential displacement estimates may not incorporate the impact of any historical or long-term cyclical fluctuations in fish stocks and may ignore potential future harvests.
Confidentiality constraints prevented reporting of estimates for some fisheries and zones, and these are identified in the summary tables.
ConsultationABARES consulted industry and WA DoF representatives to refine the fishing area and unit price estimates for GVP calculations. A number of refinements were made to the analyses as a result of this consultation and outcomes from workshops, including:
applying revised figures to the WA fisheries estimates after discussions with WA DoF and Western Australian Fishing Industry Council (WAFIC) found that the original data supplied by WA DoF were unreliable
refining the Kimberley Prawn Fishery 60-minute data, including cropping data to depths of operation and specifying fishing areas
developing a displacement range for the Nickol Bay Prawn Fishery and Kimberley Prawn Fishery. The first figure is a best ‘point estimate’ following the methodology and the second figure is an upper bound based on commentary from the fishing industry and additional analysis.
Rationale for gross value of production calculationsThe objective of this analysis is to provide an indication of the potential fishery catch that would be displaced by the draft North-west Commonwealth Marine Reserves Network, and to place a value on the displaced catch. As such, the analysis uses a historical reference period to provide an indication of the magnitude of catches from the areas where fishing would be excluded.
87
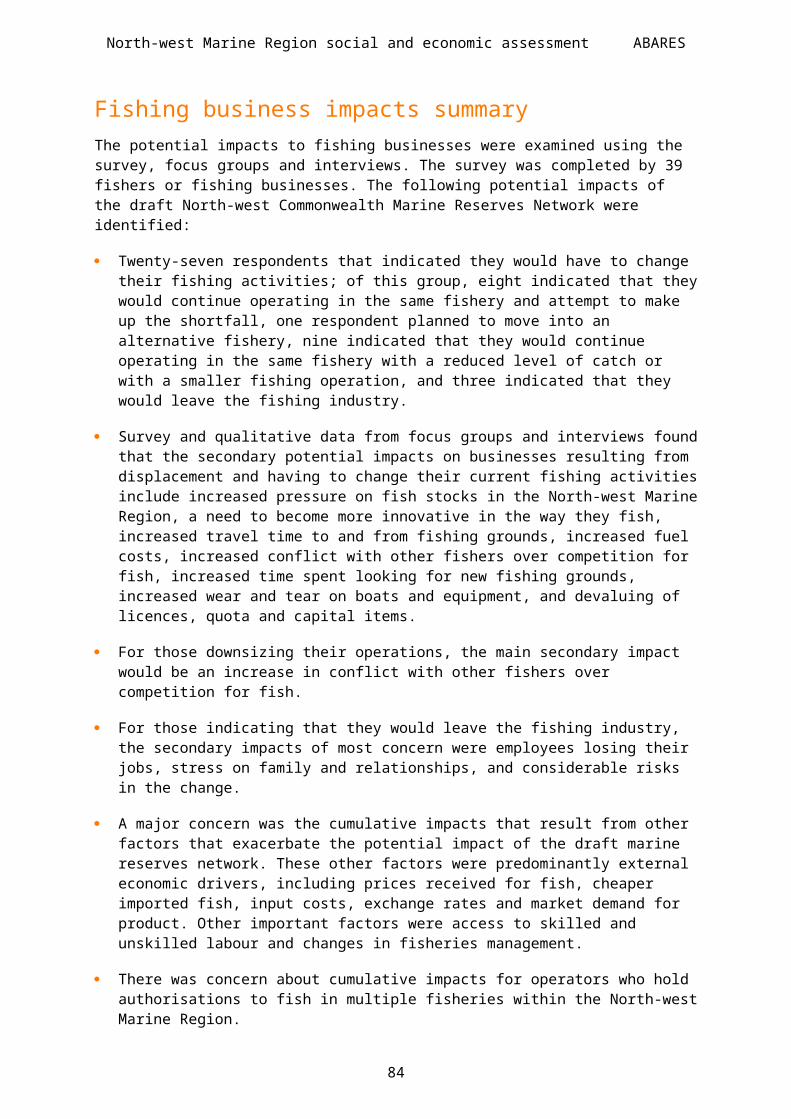
North-west Marine Region social and economic assessment ABARES
A 10-year reference period (2001–10) was used for Commonwealth fisheries to determine annual average catches in the areas of the draft marine reserves. Fishery yields may fluctuate over time, and a longer reference period allows for a better understanding of what catches have been achieved in an area, and is not limited to current activity. However, this approach cannot fully account for a number of factors, such as maximum sustainable resource limits; whether the fishery is in development, fully fished at long-term sustainable levels or recovering from depletion; or large changes in catch over time due to external drivers.
To determine annual average catches in the areas of the draft marine reserves, a range of reference periods were used for WA fisheries. The Kimberley Prawn Fishery used an 11-year (2000–10) reference period; Nickol Bay Prawn Fishery used a 2-year reference period (2008–09); and all other WA fisheries used a 3-year reference period (2008–10). The 3-year reference period was used for catches in most WA fisheries because high spatial resolution data have recently become available. In these fisheries, the increase in spatial resolution (from 60-minute grids to 10-minute grids) was considered most important to resolve catches inside or outside the draft marine reserves.
To place a value on the displaced catch, the ‘preferred approach’ was to use recent prices instead of prices obtained in the year of capture. This is because contemporary prices are thought to better reflect likely near-term future prices when impacts would be experienced. In addition, this removes some interannual variability. In all analyses, prices and GVP were adjusted to 2011 dollars using the consumer price index. Under this preferred approach, prices were taken from a three-year reference period (2007–08 to 2009–10). GVP was calculated by multiplying the volume of catch recorded in logbooks by the average ‘beach price’. Beach prices exclude the cost of transporting, processing, value-adding and marketing of fish products for wholesale and retail markets. Where there were no records in the price reference period, the most recent year of data was used.
88

North-west Marine Region social and economic assessment ABARES
Commonwealth fisheries
1) Commonwealth fishers record data in their mandatory AFMA logbooks, which can be used to determine where, when and how each species is caught. AFMA logbook data were used to develop the catch estimates, while the GVP calculations were derived using market data supplied by ABARES. Commonwealth operators also record the latitude and longitude position of each fishing operation in logbooks—this can be either a single position, or a start and finish position for certain gear (such as trawl). The position information of each operation was converted to a line, generated from start and finish coordinates, if available. For operations with only one reported position, a very short line of approximately 100 metres was generated from the single position.
2) Estimates of potential displacement for Commonwealth fisheries were derived from operations that intersected with, or were wholly within, a draft marine reserve. Where an operation’s line intersected a marine reserve but did not fall entirely within the reserve, the catch and GVP for that operation were allocated in proportion to the length of line within the marine reserve (Figure 13).
3) The GVP was calculated by multiplying the volume of catch recorded in logbooks by the average recent ‘beach price’ of each species. Where there were no records in the price reference period, the most recent year of data was used.
4) Fishing methods were included or excluded from the different zones based on the zoning framework provided by SEWPaC (Table 18).
5) This report was filtered so that confidential data (representing fewer than five vessels) are not shown.
Figure 13 Illustration of treatment of fishing operations in relation to marine reserve boundaries
Note: The green area represents a draft marine reserve, and the red lines indicate lines of fishing operations.
Table 18 Commonwealth fishing methods and zoning implicationsMethod Multiple Use Zone Marine National Park Zone
Demersal longline
Demersal longline and gillnet
Demersal trawl
Other line
Pelagic longline and gillnet
Pelagic longline
= method would be excluded
89

North-west Marine Region social and economic assessment ABARES
Western Australian fisheriesComplete WA commercial fisheries data, not filtered for confidentiality, were provided to ABARES by WA DoF. The data contained a vessel count flag that was used to identify which data were confidential (fewer than three vessels) and could not be revealed. Spatial refining of WA data was undertaken in consultation with WA DoF and the Western Australian Fishing Industry Council (WAFIC). This included exclusion of some fisheries because they operate only in WA state waters, and applying a correction based on the depths over which the fishery or gear was used. A number of other adjustments were made to remove fisheries from zones where they could not operate due to fisheries management boundaries.
GVP data were supplied by WA DoF but, following discussions with WA DoF and WAFIC, these were regarded as unreliable. The GVP presented in Table 19 are based on independent prices, which were all developed through consultation with WAFIC and other industry representatives. ABARES is reasonably confident that these prices do not underestimate the GVP from the affected fisheries. Catches therefore were converted to GVP according to the independently estimated recent aggregate prices given in Table 19.
Table 19 Mean aggregate prices used to calculate gross value of production for Western Australia–managed fisheries
Fishery Price Derivation
Kimberley Prawn Fishery 11.00Same as Commonwealth-managed Northern Prawn Fishery (volume-adjusted price for banana, tiger, endeavour mix)
Mackerel Fishery 11.00 Consumer price index– adjusted mean of WA data
Nickol Bay Prawn Fishery 11.00Same as Commonwealth-managed Northern Prawn Fishery banana prawn price
Northern Shark 2.80 From Fishery Status Reports 2009–10, including fin
Northern Demersal Scalefish Fishery 10.00 From Fishery Status Reports 2009–10, Kimberly area
Shark Bay Prawn Fishery 10.87From Fishery Status Reports 2009–10 (volume-adjusted price for king prawn $10.50 and tiger prawn $12 mix)
West Coast Demersal Gillnet and Demersal Longline Fishery
8.00 Same as South-west Marine Region. Input from industry.
The Kimberley Gillnet and Barramundi fisheries were excluded from the analyses because they occur only in WA state waters. The Pilbara Fish Trawl Fishery does not operate in any of the draft marine reserves and was excluded from the potentially impacted fisheries on this basis. The West Coast Rock Lobster Fishery was excluded as recent state management regulations have restricted access in these sites and no fishing is occurring. Based on discussions with WA DoF and WAFIC, the following fisheries were also excluded: Exmouth Gulf Prawn, Shark Bay Scallop, Broome Prawn, Onslow Prawn, Bêche-de-mer, Abrolhos Island and Mid West Trawl, Pearl Oyster, Open Access, Specimen Shell Fishery, and West Coast Deep Sea Crustaceans including the West Coast Deep Sea Crab Fishery and Shark Bay Crab Interim Fishery.
Data for all WA marine fisheries in the North-west Marine Region were analysed using one of two methods, depending on the spatial scale of data available (10-minute or 60-minute reporting grids; Map 11). However, in both methods:
WA DoF provided confidential catch and GVP data summarised by 10-minute or 60-minute reporting grids, fishery, fishing gear and year for the period 2000–10. Cells with fewer than 3 vessels or licensees were specified as confidential.
Fishing was excluded or allowed in the different marine reserve zones based on the fishing methods employed (Table 20).
90
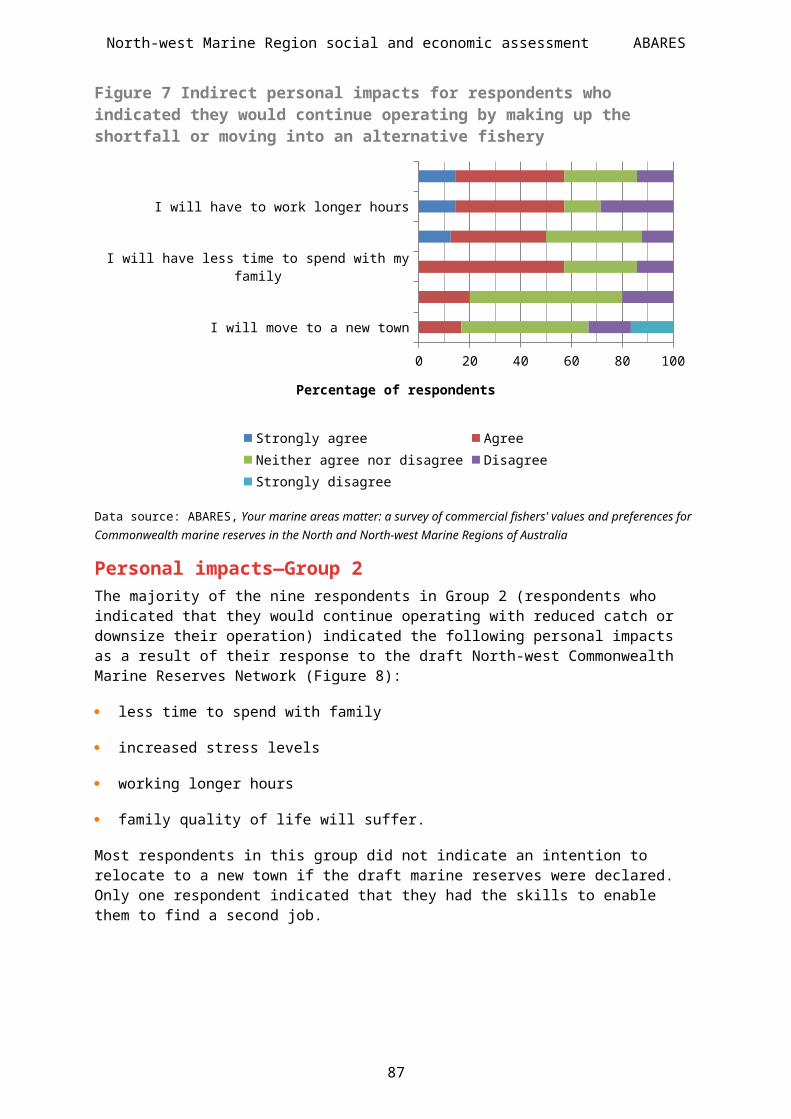
North-west Marine Region social and economic assessment ABARES
Map 11 Western Australian fisheries reporting grid systems overlaid on the outline of the draft North-west Commonwealth Marine Reserves Network
Data sources: Marine reserve boundary from the Australian Government Department of Sustainability, Environment, Water, Population and Communities; coastline and bathymetry from Geoscience Australia
10-minute grid scale data (Western Australian fisheries)With the exception of the Kimberley Prawn Fishery, all WA fisheries in the North-west Marine Region were analysed using a 10-minute reporting grid. In addition to the general methodology, the following were applied:
The 10-minute blocks were intersected with the draft Commonwealth marine reserves and displacement was estimated according to the proportion of the reporting block that was occupied by the marine reserve. This approach assumed that fishing was distributed uniformly within the 10-minute block.
Estimates of potential displacement were based on mean annual catch for the period 2008 to 2010.
In addition, an upper bound was developed for the Nickol Bay Prawn Fishery. Industry raised particular concerns about the interim displacement estimate for the draft Eighty Mile Beach marine reserve (zone 107) and this was amended to a range of 1.6–5.0 tonnes, which encompasses the ‘point estimate’ (following the proportional area methodology) and an upper bound estimate based on the maximum possible prawn catch that could have occurred in zone 107.
91
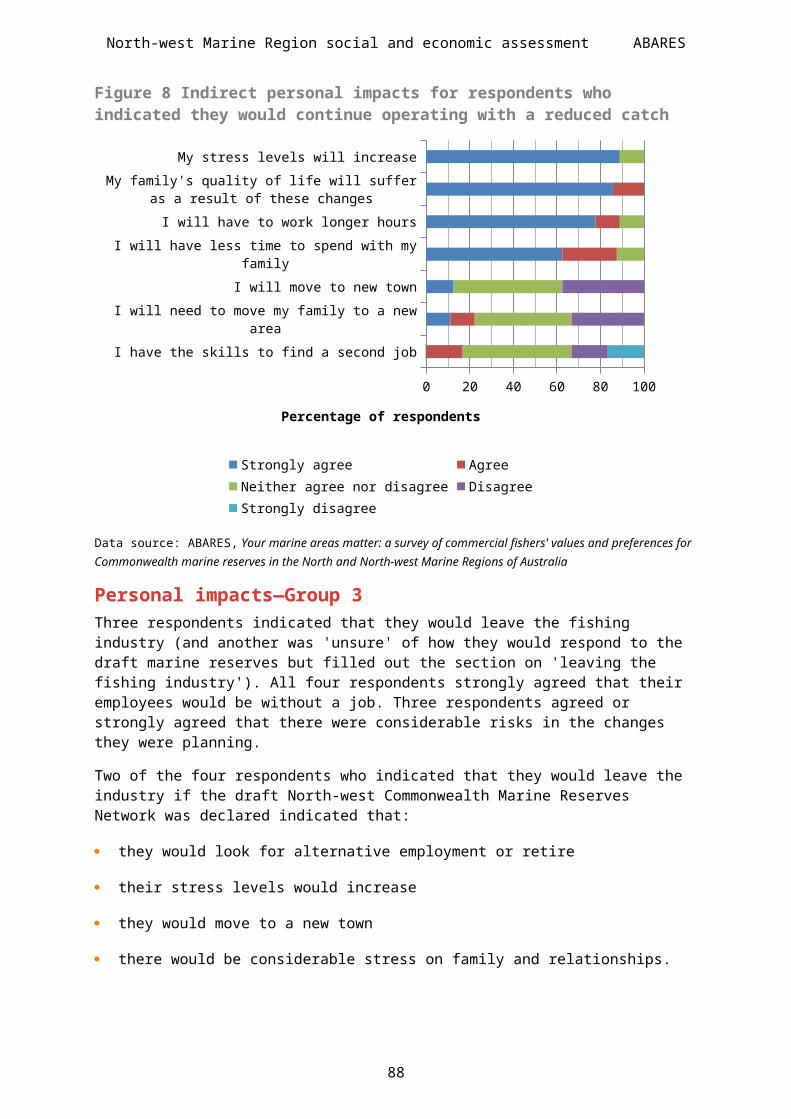
North-west Marine Region social and economic assessment ABARES
60-minute grid scale data (Kimberley Prawn Fishery)The Kimberley Prawn Fishery was analysed using two methods to provide a point and upper estimate of potential displacement, both of which applied a refinement to the available 60-minute scale catch data (Map 12a). This has the effect of concentrating fishing effort in a smaller, more realistic area and may result in a higher or lower estimate that would otherwise be obtained if no depth refinements were made. In addition to the general methodology (reference period of 2000–10), the following were applied:
1) Trawl ground mapping (point estimate):
- WA DoF provided Kimberley Prawn Fishery trawl ground mapping. This was derived from identified Kimberley Prawn Fishery fishing locations (latitude and longitude points) over the years 1997, 1999, 2000 and 2002–10, with a 2-nautical mile buffer applied to the points.
- The trawl ground mapping was used to refine the large (60-minute) reporting grids on which the data are collected (Map 12b), so that fishing was assumed to be evenly distributed within the trawl grounds and no fishing was deemed to have occurred outside of this.
- The 60-minute grids, modified to include only the trawl grounds, were intersected with the draft Commonwealth marine reserves. Displacement was estimated according to the proportion of the modified reporting block that was occupied by the marine reserve.
2) Bathymetry depth class 0–50 metres (upper estimate):
- Following consultation with WA DoF, it was determined that Kimberley Prawn Fishery trawl fishing occurred in depths of less than 50 metres. Analysis for this estimate was therefore confined to waters between the coastline and 50 metres, and no fishing was deemed to have occurred in deeper waters (Map 12c).
- The 60-minute grids, modified for the 50-metre depth class, were intersected with the draft Commonwealth marine reserves. Displacement was estimated according to the proportion of the depth-modified reporting block that was occupied by the marine reserve. This approach assumed that fishing was distributed uniformly within the depth-modified reporting block.
However, the results for the Kimberley Prawn Fishery are still believed to be an overestimate. In both the point and upper estimate methods, an even distribution of fishing activity is assumed for the refined grids, which is not likely to occur in practice. While this is thought to better represent the fishing area, it includes a greater area than is regularly fished, and without boat-level spatial data, the issue of overestimation cannot be completely resolved.
92
North-west Marine Region social and economic assessment ABARES
Map 12 Illustration of spatial refinements to the 60-minute reporting grids used by the Kimberly Prawn Fishery in the North-west Marine Region
Note: a) shows the area of typical 60-minute grids adjacent to the Western Australian coast, b) shows the same grid after the area identified as trawl grounds has been applied and c) shows the area of the same grids broken down into the 0–50 metre depth class.
Table 20 Western Australian fishing methods and zoning implicationsMethod Multiple Use Zone Marine National Park Zone
Charter
Dropline and handline
Pelagic gillnet and longline
Handline and trolling
Line and fish trap
Demersal longline and gillnet
Pots
Demersal trawl
= method would be excluded
Western Australia Charter FisheryThe Western Australia Charter Fishery was analysed using a 5-minute reporting grid. Estimates of mean annual activity, in terms of retained fish and numbers of clients, were calculated as follows:
The 5-minute blocks were intersected with the draft Commonwealth marine reserves, and displacement was estimated according to the proportion of the reporting block that was occupied by the marine reserve. This approach assumed fishing was distributed uniformly within the 5-minute block.
Estimates of potential displacement were based on mean annual catch for the period 2002 to 2010.
93
b)a)
c)
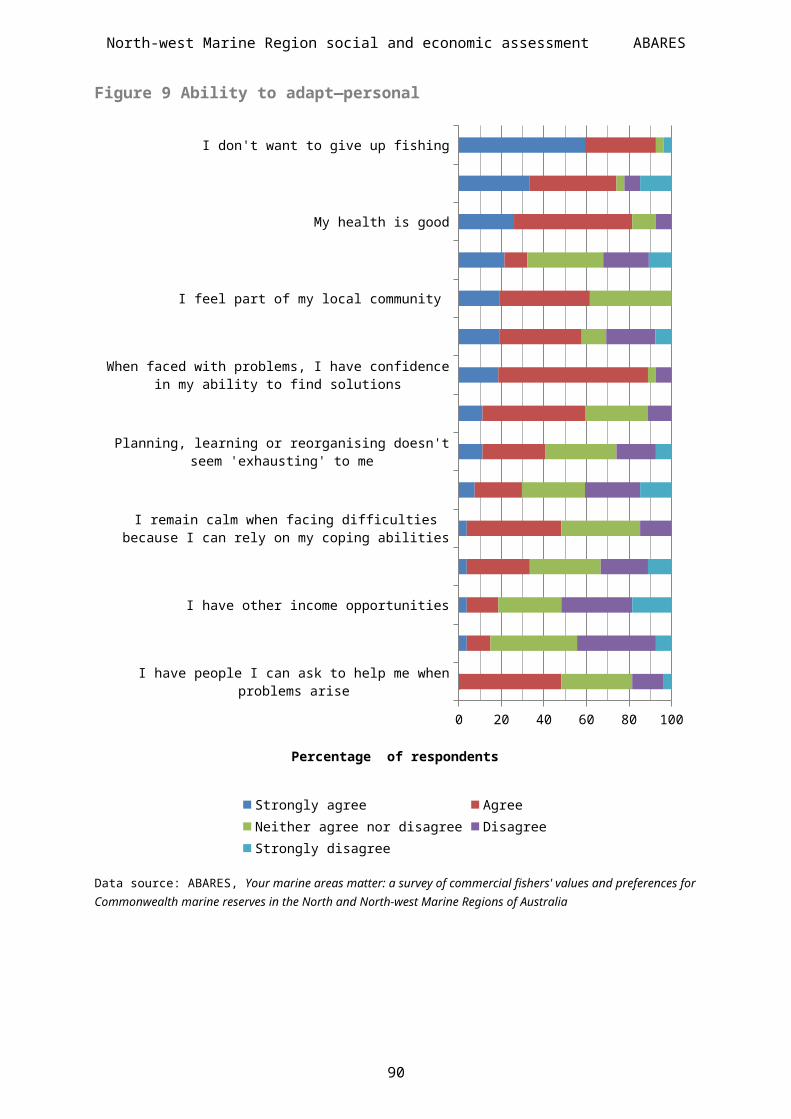
North-west Marine Region social and economic assessment ABARES
B: Social impact assessment methodsSocial impact assessment (SIA) is a process to assess or estimate the social consequences that are likely to follow from specific policy actions, including programs, or the adoption of new policies.
Scope of the social impact assessmentThe scope of the SIA is outlined in the Record of Understanding (ROU) provided to ABARES by the Australian Government Department of Sustainability, Environment, Water, Population and Communities (SEWPaC), as well as in the draft objectives and scope of work activities (see Scopeof work). The type of assessment undertaken and the methods applied therefore reflect the requirements of the ROU, within the constraints of time and resources available.
The SIA covers the South-west, North, North-west and East marine regions. This document reports on the North-west Marine Region SIA. It includes all commercial fisheries occurring within each region. The SIA focuses on the commercial and charter boat operators that will be potentially displaced by the draft North-west Commonwealth Marine Reserves Network, and other stakeholders (i.e. operators that fish outside of the draft marine reserves, supply chain and communities) who will be impacted by displaced fishing activity. Recreational and Indigenous fishers, and any other resource users, are out of scope of the assessment. An attempt will be made to provide an opportunity for all in-scope persons to provide input to the assessment; however, participation of all relevant people cannot be guaranteed. This may affect the ability to disaggregate the assessment results to an individual impact level; therefore, impacts will be assessed at the fishery, regional and community scales.
Social impact assessment approachSIA has been increasingly used by decision makers, including both government and private sector organisations, to predict potential consequences of proposed changes in access to natural resources. SIA is a useful tool to help understand the potential range of impacts of a proposed change, and the likely responses of those impacted if the change occurs. This understanding can be used to help design impact mitigation strategies that can minimise negative, and maximise positive, impacts of any change.
The following steps are considered as core components of SIA:
scoping an impact assessment
profiling the current context and identifying who is likely to be impacted
assessing direct social impacts
assessing indirect social impacts.
The process used in this SIA broadly followed these steps. Efforts were made to incorporate cumulative impacts into the assessment.
To assess the potential impacts of the draft North-west Commonwealth Marine Reserves Network, three primary data collection methods were used.
94
North-west Marine Region social and economic assessment ABARES
Method 1: Survey of commercial fishersA mail-based survey of potentially displaced and impacted commercial fishers in the North-west Marine Region was undertaken in October and November 2011.
Survey scope and sampling frame
The scope of the survey was developed in consultation with industry, state and Commonwealth fisheries institutions, and SEWPaC. It was agreed that the study target population would be individual fishers and fishing businesses currently holding licences in state and Commonwealth fisheries with a likelihood of being displaced and impacted by the draft North-west Commonwealth Marine Reserves Network. The intent was not to survey all fishery licence holders in the region, but to create a target population and provide all accessible people and businesses in the target population with a survey. Although the target population was identified in theory, it is difficult to identify all individuals and businesses that would fall within this target population, largely because many of the impacts will take place in the future.
Figure 14 The relationship among all fishers, target population, survey frame and survey respondents
Figure 14 illustrates the different population groups referred to when developing the survey scope and sampling frame. The target population is a subset of all fishers in the North-west Marine Region that are potentially displaced and impacted by the draft North-west Commonwealth Marine Reserves Network. The precise number of fishery licence holders in this target population was unknown. Those included in the target population are potentially impacted via:
reduced access to resource due to displacement
loss of business income
increased competition with displaced fishers
changes to fisheries management as a result of displacement
decreased value of licences and capital
95
ALL COMMERCIAL FISHING LICENCE HOLDERS (state, territory and Commonwealth) operating within the marine region
TARGET POPULATION—all fishing businesses currently holding licences in state and Commonwealth fisheries with a likelihood of being displaced and impacted
SURVEY FRAME—accessible population (n = 104)
SURVEY RESPONDENTS (n = 39)

North-west Marine Region social and economic assessment ABARES
loss of essential infrastructure (e.g. supply chain businesses and facilities).
The primary goal in designing and developing the survey frame was to ensure that the highest number of displaced and impacted licence holders would be identified for the survey. To the extent possible, potentially displaced and impacted fishers were identified using logbook records of catch within the draft marine reserves (refer to Chapter 2: Potential displacement of fishing). Industry, state and Commonwealth fisheries institutions, and SEWPaC also contributed to this process.
The sample frame was developed through the following processes:
ABARES obtained fishery logbook data from state and Commonwealth agency data holders. Logbook data contains information on the spatial position and times of fishing operations and is compulsorily acquired from all licensed fishing businesses.
ABARES analysed fishers’ logbook data from state and Commonwealth fishery agencies to determine which fisheries would be displaced by the draft North-west marine reserves; that is, fisheries with operators who had recently fished within the draft marine reserve boundaries.
Commonwealth and state fishery agencies were informed of the potentially displaced fisheries and provided a preliminary list of displaced licence holders from the identified fisheries.
AFMA provided a preliminary list of potentially displaced licence holders operating in Commonwealth fisheries. The Commonwealth Fisheries Association (CFA) reviewed the list and provided additional licence holders they believed would be displaced based on recent fishing activity.
The WA Department of Fisheries provided a preliminary list of displaced licence holders. The West Australian Fisheries Industry Council (WAFIC) reviewed the list and provided additional licence holders they believed would be displaced.
The final lists of displaced licence holders were analysed and duplicates were removed.
The resulting survey frame consisted of 104 licence holders across Commonwealth (73 licence holders) and WA state fisheries (31 licence holders). The use of Commonwealth and state log data and the expert knowledge of industry in constructing the survey frame provide a high level of confidence that the 104 licence holders in the survey frame would cover more than 90 per cent of licence holders in the target population.
Survey errorIt is important to understand the types of survey error and bias that are most likely to occur. Error and bias can be introduced at two points in the survey process: in how survey participants are selected and in how survey participants respond to survey questions. Most surveys report the sampling error. However, in many instances this is quite small relative to other sources of error. The main sources of error and bias that need to be considered when interpreting the survey findings are discussed below (following de Leeuw et al. 2008).
Coverage error
Coverage error is the difference between the survey frame and the target population. In this case, the process undertaken to develop the survey frame (described above) gives reasonable confidence that undercoverage was minimised. There was a degree of undercoverage in the survey frame due to the leasing of entitlements to fishing businesses not included in the lists provided by fisheries management agencies.
96

North-west Marine Region social and economic assessment ABARES
Usually, the target population would be identified through a filtering process such as a mail-out card to all fishers in the region with a question (e.g. ‘Are you likely to be displaced by the North-west Commonwealth Marine Reserves Network? (Yes/No)’), then administering the full survey to the group that answered ‘Yes’. This would establish the target population. However, the difficulty with this filtering approach is that it would have required the respondent to have a complete knowledge of the marine reserve system zoning, and their spatial use pattern of the resource. It would have been impractical to include this information in a simple card.
Sampling error
Sampling error can occur if a sample is taken instead of measuring the entire population. It is usually not feasible to send a survey to every individual in the target population, and a random or purposive sample is selected from which inferences can be made about the target population. However, we believe that the sampling error is less relevant in this study because a survey was sent to all licence holders in the survey frame (i.e. we did not take a sample from our survey frame). This means that we did not need to make any inferences to the target population because there is a reasonable probability that our survey frame covered the whole target population.
Non-response error
Non-response error can occur if particular groups of people do not complete and return survey forms, thus under-representing those groups and skewing the survey results. For example, bias could arise if people who think they may be impacted by the draft marine reserves are more motivated to respond to the survey than those who do not; or if larger fishing operations that are well connected to industry groups or have attended industry briefing sessions are more likely to respond than smaller operators who may be less well informed. In general, the reasons for non-response could include:
failure of the data collector to identify the individual (e.g. incorrect address)
refusal to participate (e.g. deciding not to answer or forgetting to answer the survey)
inability to participate due to health, absence, etc.
inability to communicate (e.g. requiring an interpreter, illiterate)
accidental loss of the data or questionnaire.
The overall response rate was 38 per cent (39 out of 104 surveys). Individual non-respondents were not followed up so we cannot determine the non-response error or the characteristics of the non-respondents.
Response error
Cognitive biases can affect survey responses and lead to response error. Some cognitive biases (such as impact bias and bandwagon bias) are more difficult to address because the respondent may wilfully or unintentionally provide inaccurate information. Cognitive biases of this type may be an issue in this study due to the sensitive nature of the study topic and general objection within the fishing industry to the draft Commonwealth marine reserves. It could also be argued that impact bias encouraged valid responses from impacted fishers because those who thought they would be impacted by the draft marine reserves were more likely to provide a survey response.
97
North-west Marine Region social and economic assessment ABARES
Measurement error
Measurement error may result from inaccurate responses to questions, an inability of the respondent to recall information, differences in how respondents interpreted a question or socially desirable responding.
Measurement error did occur in our survey as follows:
Misinterpretation of methods of fishing permitted in the different zones of marine reserve areas. This was evident in survey responses where individuals believed they were displaced, but in fact were not, based on the fishery they operate in and the marine reserve zonings. We used a post-survey filtering process to ensure these out-of-scope respondents were not included in further analysis of displacement.
Respondents having difficulty interpreting the questions. For example, the ‘safe area’ question in the value mapping section of the survey could be interpreted as a safe area to fish or a safe area to go in bad weather. Such errors were minimised through testing before administering the survey, and remaining errors were factored out through careful analysis and interpretation of the data.
Method 2: Focus groupsA focus groups was held with fishing industry and community representatives to gain an understanding of the relationships between the fisheries and communities. The key questions were:
Which fisheries, related fishing businesses, supply chain businesses and communities will potentially be impacted?
What are the direct, indirect and cumulative impacts on individuals, businesses and communities?
How will impacted people manage the change?
A focus group was held in Fremantle with five representatives of the fishing industry and a community representative.
The location of the focus group was determined through consultation with the North-west Marine Region working group (Commonwealth and state fishing industry representatives and the SEWPaC Industry Liaison Officer) and reflected where impacts were likely to be greatest.
Method 3: InterviewsSeven in-depth face-to-face interviews were conducted with commercial fishers and supply chain businesses. Many of the interviewees were also involved in the focus group. We took the opportunity after the focus groups to interview individual fishers to gain a deeper understanding of now the change would impact on their business, personal life and community
Data management and analysisSurvey data were entered into the computer program — Statistical Package for the Social Sciences (SPSS). Routine data checking and cleaning processes were applied to produce a final data set. Focus groups and interviews were recorded either by hand notes or digital audio recordings. These recordings were transcribed and used as a basis for analysis. A qualitative analysis package, NVivo8, was use to help summarise, sort and thematically interpret the information provided by the fishers and community representatives. All survey results are reported as valid percentages in this report (valid percentages will change depending on the question because not all respondents answered all questions).
98
North-west Marine Region social and economic assessment ABARES
Ethical processSeveral processes were undertaken to maintain ethical standards in this SIA.
Survey participants were provided with an introductory letter outlining the purpose of the SIA, who should fill out the survey and details on confidentiality. It was emphasised that their name will never be placed on the survey and only aggregate data will be used in reports. Similar information about confidentiality was provided inside the front cover of the survey.
Focus group invitees were sent a fact sheet outlining the purpose and approach of the SIA. Verbal approval for audio recording of the focus group discussion was obtained at the start of the focus group meeting.
Interviewees received information about the SIA via the survey process or the focus group process, and were asked for verbal approval to record at the start of the interview.
Care was taken to remove any personal information from case study reports that would allow individuals to be identified (unless the participants explicitly indicated to ABARES that this information could be included).
Participants were informed that all information would be stored in a secured system and no individual would be identified except where permission was granted.
99

North-west Marine Region social and economic assessment ABARES
C: Estimating job reduction using the surveyThe survey was used to estimate the potential jobs lost from the surveyed businesses as a result of the draft North-west Commonwealth Marine Reserves Network. The comments at the beginning of Chapter 4: Impacts on fishing businesses about interpreting the survey data are very relevant here, notably that the survey specifically targeted impacted businesses and is not representative of the wider commercial fisher population in the North-west Marine Region (see Appendix B: Social impact assessment methods). The estimates are also based on each surveyed business's prediction about how they would respond to the draft North-west marine reserves.
The survey was filtered to exclude responses from operators where no displacement could occur. These were scenarios where either fishing methods were compatible with the zoning of a particular reserve, or where logbook analysis indicated no displaced fishing effort.
For each respondent, potential job loss was calculated as a percentage reduction in their reported numbers of employees. The percentage reduction was dependent on their overall response to the draft marine reserves (stay and make up shortfall, stay with reduced catch, leave fishing industry) and their subsequent response to a question about reducing employees. For example, if a respondent stated that they had 10 full-time employees, would continue operating with reduced catch or downsize their operation, and strongly agreed that they would reduce employees, following Table 21, there would be a 30 per cent reduction in employees for that business, resulting in 3 job losses.
The percentage reductions in Table 21 were partly based on counts of survey responses indicating what proportion of their total catch during 2010–11 they estimate would be displaced by the draft marine reserves (Table 14).
Table 21 Percentages used to calculate reduction in employees based on the overall response to the draft marine reserves and response to a question of whether the business will reduce employees
Respondents who indicated the fishing business would need to change its fishing activities if the draft marine reserve was declared
The fishing business will have to reduce employees
Agree (%) Strongly agree (%)
Stay in the same fishery and make up the shortfall fishing in other areas or move into an alternative fishery
10 20
Continue operating with reduced catch or downsize operation 15 30
Leave the fishing industry 50 100
Data source: ABARES, Your marine areas matter: a survey of commercial fishers' values and preferences for Commonwealth marine reserves in the North and North-west Marine Regions of Australia
100

Exposure Sensitivity
Potential impact Adaptive capacity
Vulnerability
North-west Marine Region social and economic assessment ABARES
D: Developing an index of community vulnerabilityIn this study, the concept of community vulnerability to the impacts of the draft Commonwealth marine reserves in the North-west Marine Region is explored to provide an indication of which communities are vulnerable to the impacts of the draft marine reserves. This appendix outlines the approach taken to measure community vulnerability.
Communities of place and interestIn this study, the emphasis is on communities of place and interest. Communities of place refer to people living within a defined geographical boundary, which in this study is the Australian Standard Geographical Classification (ASGC) spatial unit, statistical local area (SLA). Communities of interest refer to people who share a common interest, which in this case is those employed in the consolidated commercial fishing industry.
Community vulnerabilityThe concept of vulnerability has gained increasing popularity in understanding the socioeconomic dimensions of change within communities (Stenekes et al. 2010). The following vulnerability assessment is based on a conceptual model used by the Allen Consulting Group (2005), which was based on Schröter & the ATEAM Consortium (2004). This model has been widely adopted and is generally accepted by researchers (Johnston & Williamson 2007; Parkins & MacKendrick 2007). In the model, vulnerability (V) is a function of a system’s exposure (E), sensitivity (S) and adaptive capacity (A) (see Figure 15).
To put the conceptual model in operation, an indicator approach was applied. Indicators of social change are widely accepted as reliable and practical tools to summarise complex socioeconomic phenomena (Herreria et al. 2008). The authors acknowledge that vulnerability is a dynamic construct that changes over time and space. However, in this assessment, vulnerability is measured as a static phenomenon using indicators selected a priori. In reducing complex phenomena to a single metric, local contextual differences are masked. However, the approach does allow for a consistent assessment over large spatial units (Stenekes et al. 2010). The resulting summary metric of vulnerability indicates that adaptation efforts should be directed at those communities with the greatest sensitivity and least adaptive capacity to changes in access to marine resources (Smit & Wandel 2006).
Figure 15 Conceptual model of community vulnerability
Source: Allen Consulting Group 2005, based on Schröter & The ATEAM Consortium 2004
101
North-west Marine Region social and economic assessment ABARES
Developing the community vulnerability indexThe approach applied to develop the index of vulnerability in this study synthesises previous applied research on indicators used to understand the relationship between community resource dependence and the concepts of resilience, adaptive capacity, wellbeing and disadvantage (Machlis et al. 1990; Beckley 1998; Turton 1999; Ellis 2000; Yohe and Tol 2002; Brooks & Adger 2004; Armitage 2005; Adger & Vincent 2005; Fenton 2005; Nelson et al. 2005; Smit & Wandel 2006; Burnside 2007; Marshall et al. 2007; Patriquin et al. 2007; Herreria et al. 2008; Stenekes et al. 2010). The approach is therefore theoretical and does not differentiate variables that maybe more relevant at a local level in identifying factors that influence vulnerability. Table 22 provides the indicators used in this assessment to measure the component concepts of the vulnerability model.
Measures of community vulnerabilityThe conceptual framework (Figure 15) and literature were used as a guide to select indicators to measure the vulnerability of communities that depend on fishery resources. Table 22 presents the indicators, data items and the geographical scale used to measure the sub-index of sensitivity and the sub-index of adaptive capacity. All data used in this study are derived from the Australian Bureau of Statistics (ABS)—namely, the Census of Population and Housing 2006; Socio-Economic Indexes For Areas (SEIFA) and Accessibility/Remoteness Index of Australia (ARIA) 2001.
Table 22 Indicators and data Concept sub-index
Indicator and ABS data used Scale
Exposure Potential GVP displaced per person within a nominated geography Town and SLA
Sensitivity
Proportion of total labour force employed in the consolidated commercial fishing industry (excluding onshore aquaculture), based on ABS data from the 2006 Census of Population and Housing
SLA
Adaptive capacity
ABS Socio-economic Indexes For Areas. Index of Relative Socio-economic Disadvantage – Australia decile ranking, ABS 2006
SLA
Economic Diversity Index. Diversity of local economy relative to the Australian economy, calculated using employment by sector data from the ABS 2006 Census of Population and Housing
SLA
ABS Accessibility/Remoteness Index for Area, ABS 2001 n.a.
Median household income, ABS 2006. SLA
ABS = Australian Bureau of Statistics; GVP = gross value of production; n.a. = not available; SLA = statistical local area
Calculation of community vulnerability indexA key consideration in developing a composite index is the relative weight of each component or indicator that contributes to the index (Herreria et al. 2008). For this study, neutral weightings of 1.0 were used and each of the indicator values were standardised to a value between 0 and 1 based on the distribution of scores for all SLAs of interest in the marine bioregion.
The exposure sub-index is a calculated score based on the GVP displacement divided by the number of persons residing within a nominated geography, which was then standardised.
The sensitivity sub-index has only one indicator (see Table 22), which was standardised based on the distribution of values for the SLAs of interest within a marine bioregion.
The potential impact (PI = E × S) is a sub-index made up of standardised exposure multiplied by standardised sensitivity scores for each SLA of interest in the marine bioregion. This sub-index score was then standardised.
102
North-west Marine Region social and economic assessment ABARES
The adaptive capacity sub-index was calculated as the sum of the standardised values for the indicators listed in Table 22.
The vulnerability index (V = PI – A) was calculated by subtracting the standardised value of the adaptive capacity sub-index from the standardised potential impact sub-index.
The resulting index of community vulnerability provides a distribution of ranked scores between 0 and 1, where an index score of 1 indicates the highest rank of vulnerability and an index score of 0 indicates the lowest rank of vulnerability.
Caveats and limitationsA number of general caveats and limitations are relevant to the interpretation of the community vulnerability assessment. These are summarised below:
The vulnerability index is a relative unweighted ranked order measure. It indicates a community’s ranked position within the set of communities examined in the given marine region. The indices generated should not be interpreted as absolute values. Hence, a score of 1.0 in the community vulnerability index does not mean that area is twice as vulnerable as an area with a score of 0.5, only that it is relatively more vulnerable.
Relative community vulnerability is a summary indicator and, to understand the factors contributing to the composite index, it is necessary to look at the potential impact and adaptive capacity sub-indices and their contributing indicators.
A community’s degree of vulnerability and adaptive capacity has many dimensions; this complexity makes it difficult to reduce these concepts to a single numeric value that covers all factors influencing the concept. Inclusion of other indicators, such as the mobility of people between regions, can significantly change these relative rankings. Therefore, this type of assessment should include supplementary quantitative and qualitative data and research (such as the case studies in this report).
The index is constructed using data from a range of sources at different units of measurement and scales, including GVP displacement estimates, employment data, SEIFA relative disadvantage, remoteness at a regional level, and census housing and population data at SLA level. Therefore, there are smoothing effects that will affect the rankings.
Consideration must be given to how accurately a sub-index measures the concept. For example, the sensitivity measure is based on the proportion of people employed in the commercial fishing industry in a given community. This measure includes all people in the fishing industry and does not differentiate between those in fisheries that are impacted and those that are not. Therefore, it may result in an overestimation of the sensitivity of a community to the impact.
Aggregated data at the SLA unit of geography is applied across all towns in that SLA. This will influence some dimensions of the index and in some cases decrease the overall index ranking. Therefore, the impact on small towns that sit within SLAs needs to be considered within this context.
Data used in this study is derived from the ABS namely, the Census of Population and Housing 1996 and 2006; SEIFA and ARIA 2001. In addition to these datasets, an index of economic diversity was constructed from ABS data.
103
North-west Marine Region social and economic assessment ABARES
Other index definitionsSEIFA Index of Relative Socio-economic Disadvantage The study applies the ABS SEIFA Index of Relative Socio-economic Disadvantage—Australia decile rank. The SEIFA index is considered useful in profiling communities and can be applied to indicate a community's resilience and ability to adapt to change. The SEIFA Index of Relative Disadvantage score used in the analysis is a comparative decile ranking that indicates a SLAs rank in comparison with all other SLAs within Australia. High scores on the index indicate a lack of disadvantage while low scores indicate higher levels of disadvantage. Scores that occur at the tails of the distribution are of most interest because those around the middle (i.e. around 5) are neither particularly disadvantaged nor lacking disadvantage relative to other areas.
ARIA: Accessibility/Remoteness Index of AustraliaThe ABS defines the underlying the concept of remoteness in the ARIA as ’the measure of the physical road distance between where people reside and where those people travel to in order to obtain goods and services, and to enjoy opportunities for social interaction’. The ABS Remoteness Structure defines the level of remoteness with values from 0 to 5:
0—Major cities of Australia
1—Inner regional Australia
2 —Outer regional Australia
3—Remote Australia
4—Very remote Australia
5—Migratory.
The Economic Diversity Index (EDI) compares the proportion of the workforce employed at the SLA geography in the 19 industry sectors identified by the ABS Australian and New Zealand Standard Industrial Classification (ANZSIC) (2006) with those in the entire Australian workforce. The closer an EDI score for a SLA is to 1.0, the more it represents the distribution of employment across industries for Australia, and thus its economy is considered to be more diverse. Conversely, a lower EDI suggests less diversity compared with that of Australia.
104
North-west Marine Region social and economic assessment ABARES
E: Profile of survey respondentsThis appendix provides background and profile information on the survey respondents.
FisheriesTable 23 lists the licences held by survey respondents. Note that respondents may hold licences in multiple fisheries.
Table 23 Licences held by survey respondents in 2010–11Fishery Percentage of respondents with a licence
Commonwealth
North West Slope Trawl 10.0
Southern Bluefin Tuna 2.5
Western Deepwater Trawl 10.0
Western Skipjack 5.0
Western Tuna and Billfish 15.0
Western Australia
Bêche-de-mer 2.5
Broome Prawn 7.5
Gascoyne Demersal Scalefish 20.0
Kimberley Prawn 32.5
Mackerel 15.0
Nickol Bay Prawn 10.0
North Coast Blue Swimmer Crab 0.0
Gascoyne Blue Swimmer Crab 0.0
Northern Demersal Scalefish 2.5
Northern Shark 5.0
Onslow Prawn 10.0
Open Access 2.5
Pearl Oyster 2.5
Pilbara Demersal Finfish 7.5
Shark Bay Prawn 2.5
West Coast Deep Sea Crab 0.0
West Coast Demersal Gillnet and Demersal Longline 5.0
West Coast Demersal Scalefish 20.0
West Coast Rock Lobster 7.5
Data source: ABARES, Your marine areas matter: a survey of commercial fishers' values and preferences for Commonwealth marine reserves in the North and North-west Marine Regions of Australia
105

North-west Marine Region social and economic assessment ABARES
Fishing methodsThe most common methods of fishing used by survey respondents were handlining, trolling and bottom (demersal) trawl (Table 24).
Table 24 Fishing methodsMethod Percentage of respondentsBottom trawl (demersal) 25.0
Trawl (other) 10.0
Finfish trawl 2.5
Gillnet (bottom set) 5.0
Pelagic gillnet 2.5
Longline (bottom set) 5.0
Finfish longline 5.0
Pelagic longline 7.5
Troll 27.5
Handline 30.0
Squid jig 5.0
Purse seine 5.0
Fish trap 7.5
Lobster pot 10.0
Crab traps 0.0
Hand collection 5.0
Drop line 10.0
Data source: ABARES, Your marine areas matter: a survey of commercial fishers' values and preferences for Commonwealth marine reserves in the North and North-west Marine Regions of Australia
Fishing history40 per cent of survey respondents indicated that they or the fishing business had been involved in commercial fishing for more than 34 years.
Table 25 Fishing historyYears involved in commercial fishing (individual or company)
Years fishing business has been operating
Generations having worked in commercial fishing
Mean 34.1 31.7 1.7
Median 33.0 30.0 1.0
Minimum 0.0 5.0 1.0
Maximum 76.0 76.0 5.0
Data source: ABARES, Your marine areas matter: a survey of commercial fishers' values and preferences for Commonwealth marine reserves in the North and North-west Marine Regions of Australia
106

North-west Marine Region social and economic assessment ABARES
Respondents role in fishing businessThe majority of survey respondents were owner–operators (Table 26).
Table 26 Respondents role in fishing businessRole Percentage of
respondentsOwner–operator 80.0Non-fishing owner 15.0
Employee skipper 7.5
Nominated fisher 2.5
Business manager 30.0
Data source: ABARES, Your marine areas matter: a survey of commercial fishers' values and preferences for Commonwealth marine reserves in the North and North-west Marine Regions of Australia
Fishing business structureThe majority of survey respondents were incorporated companies (Table 27).
Table 27 Fishing business structureStructure Percentage of
respondentsSole trader 18.9Family partnership 24.3Other partnership 2.7
Incorporated company 54.1Data source: ABARES, Your marine areas matter: a survey of commercial fishers' values and preferences for Commonwealth marine reserves in the North and North-west Marine Regions of Australia
Fishing business activitiesOnly one respondent that currently holds licences did not fish in 2010–11.
Table 28 Fishing business activitiesActivities Percentage of
respondents Fishing 97.5Processing 22.5
Wholesale/distribution 27.5
Retail 12.5
Export 30.0
Input supply 5.0
Leasing licences 30.0
Data source: ABARES, Your marine areas matter: a survey of commercial fishers' values and preferences for Commonwealth marine reserves in the North and North-west Marine Regions of Australia
107

North-west Marine Region social and economic assessment ABARES
Fishing business employeesThe majority of survey respondents employed people on a full-time paid, casual paid, seasonal full-time paid and seasonal casual basis (Table 29).
Table 29 Fishing business employeesEmployees Mean Minimum Maximum
Full-time (paid) 14.20 0 278
Full-time unpaid 0.20 0 4
Part-time paid 1.58 0 11
Part-time unpaid 0.00 0 0
Casual paid 9.18 0 153
Casual unpaid 0.03 0 1
Seasonal full-time paid 7.20 0 90
Seasonal full-time unpaid 0.00 0 0
Seasonal part-time paid 0.60 0 16
Seasonal part-time unpaid 0.00 0 0
Seasonal casual paid 6.83 0 150
Seasonal casual unpaid 0.30 0 10
Data source: ABARES, Your marine areas matter: a survey of commercial fishers' values and preferences for Commonwealth marine reserves in the North and North-west Marine Regions of Australia
Value of landed catchTable 30 Value of total landed catch 2010–11Value Percentage of respondents
Less than $50 000 8.3$50 001–100 000 2.8$100 001–250 000 13.9$250 001–400 000 11.1$500 001–1 million 13.9$1–2.5 million 19.4$2.5 million–5 million 13.9$5–10 million 5.6
$10–15 million 2.8
Greater than $15 million
8.3
Data source: ABARES, Your marine areas matter: a survey of commercial fishers' values and preferences for Commonwealth marine reserves in the North and North-west Marine Regions of Australia
Fishing income and dependence 74.3 per cent of survey respondents indicated that 100 per cent of their personal income
comes from fishing-related activities.
58.8 per cent of survey respondents indicated that 100 per cent of their household income comes from fishing-related activities.
The majority (78.0 per cent) of respondents have less than 3 dependents that they are financially responsible for.
The majority (84.8 per cent) of respondents planned to hand their fishing business onto their children.
108

North-west Marine Region social and economic assessment ABARES
AgeThe median age of survey respondents was 55.0 years
Table 31 Age of respondentsYears
Mean 54.0
Median 55.0
Minimum 33.0
Maximum 72.0
Data source: ABARES, Your marine areas matter: a survey of commercial fishers' values and preferences for Commonwealth marine reserves in the North and North-west Marine Regions of Australia
109

North-west Marine Region social and economic assessment ABARES
F: Summary information on flow of impacts, supply chains and demographics of communitiesTable 32 summarises a range of information that is useful in assessing the potential impacts of the draft North-west Commonwealth Marine Reserves Network to towns and areas. The following information is in the table:
Accessibility/Remoteness Index of Australia
An index that measures the physical road distance between where people reside and where those people travel to in order to obtain goods and services and enjoy opportunities for social interaction. Values range from 0 to 5, high scores indicate more remote. Source: ABS census 2006.
Community vulnerability index An index that combines potential impact and social data to provide a guide to compare community vulnerability (see Appendix B: Social impact assessment methods). Scores range between 0 and 1, where a score of 1 indicates the highest level of vulnerability. Community vulnerability was analysed only for towns with GVP displacement. Source: this study.
Economic diversity index An index that compares the proportion of the workforce employed in 19 industry sectors with those in the entire Australian workforce. The closer a score is to 1.0, the more it represents the distribution of employment across industries for Australia (more diverse). Source: ABS census 2006.
Fishing industry employment (percentage of total employment)
Employment in the consolidated fishing industry (catching, processing and wholesale) as a percentage of total employment for the statistical local area. Employment in onshore aquaculture activities was excluded. Source: ABS census 2006.
GVP displaced ($’000 max) Estimate of the potentially displaced catch that flows to this location (if this was a range then the upper bound is reported here). Source: logbook data.
Home port Number of survey respondents that identified this location as home port. Source: survey.
Median household income ($ per week) Source: ABS census 2006.
Number of potentially impacted input businesses
Count of potentially impacted input businesses at this location. Source: survey.
Number of potentially impacted output businesses
Count of potentially impacted output businesses at this location. Source: survey.
Population Number of persons. Source: ABS census 2006.
Seafood processors Number of registered seafood processors at this location. Source: State government registers.
SEIFA index of relative disadvantage An index that is useful in profiling a community’s resilience and ability to adapt to change. High scores indicate a lack of disadvantage. Source: ABS census 2006.
110
North-west Marine Region social and economic assessment ABARES
Table 32 Summary of flow of impacts, supply chain, demographics and vulnerability under the draft North-west Commonwealth Marine Reserves Network
Data source Logbook State ABARES
Town Population geography GV
P d
isp
lace
d (
$'00
0 m
ax)
Hom
e p
ort
Nu
mbe
r of
pot
enti
ally
im
pac
ted
inp
ut
busi
nes
ses
Nu
mbe
r of
pot
enti
ally
im
pac
ted
ou
tpu
t bu
sin
esse
s
Seaf
ood
pro
cess
ors*
Vu
lner
abil
ity
ind
ex
Fish
ing
ind
ust
ry
emp
loym
ent
(% o
f to
tal e
mp
loym
ent)
SEIF
A in
dex
of
rela
tive
dis
adva
nta
ge
Econ
omic
div
ersi
ty
ind
ex
AR
IA r
emot
enes
s in
dex
Med
ian
hou
seh
old
in
com
e ($
/wee
k)
Pop
ula
tion
Albany Albany (C) - Central 1.0 9 0.30 0.26 3 0.97 2 728 15 977Brookes Inlet Manjimup (S) 0.0 0.39 0.14 3 0.51 2 792 9 255Broome Broome (S) 91.4 2 0.45 2.00 2 0.88 3 1129 11 548Carnarvon Carnarvon (S) 98.1 5 1 2 6 1.00 4.23 2 0.53 3 858 5 284Dampier Roebourne (S) 2 3 3 0.11 7 0.19 3 2010 16 421Derby Derby-West Kimberley (S) 0.3 1 0.54 0.21 1 0.56 4 881 6 506Dongara Irwin (S) 1 3 2 1 4.98 5 0.42 2 869 3 054Exmouth Exmouth (S) 0.3 1 0.29 6.24 6 0.82 4 1059 2 064Fremantle Fremantle (C) - Inner 122.5 7 0.11 0.64 6 0.88 0 911 23 838Geraldton Geraldton (C) 156.7 4 19 4 10 0.46 2.17 2 0.91 2 783 18 915Kallbarri Northhampton (S) 3 1 2.50 3 0.31 3 659 3 209Karumba Karumba UC/L 1 3 3 1.33 1 0.30 4 949 519Kunda Park Maroochy (S) - Maroochydore 1 0.25 4 0.89 0 722 16 354Lakes Entrance E. Gippsland (S) - Bairnsdale 0.6 0.31 0.62 3 0.95 2 645 25 367Nannup Nannup (S) 1 0.00 4 0.41 2 736 1 189Nhulunbuy Nhulunbuy 8.0 0.00 9 0.62 4 2220 4 110Nickol Bay Roebourne (S) 8.6 0.21 0.11 7 0.19 3 2010 16 421Point Samson Point Samson UC/L 60.7 2 2 1 0.38 0.11 7 0.19 3 2010 271Port Hedland Port Hedland (T) 7.8 0.28 0.06 5 0.26 3 1865 11 961Two Rocks Gingin (S) 0.5 0.37 2.38 5 0.30 2 827 4 318Wyndham Wyndham-East Kimberley (S) 0.4 0.45 0.20 1 0.56 3 1160 6 595Gold Coast Gold Coast (statistical division) 1 0.11 7 0.87 0 1019 482 326Brisbane Brisbane (statistical division) 0.6 6 1 0.00 0.13 7 0.91 0 1192 1 763 124Cairns Cairns City Part A (statistical division) 2.3 2 8 5 0.17 0.39 6 0.88 2 1050 122 736Darwin Darwin City (statistical division) 187.2 12 32 12 0.19 0.47 6 0.72 2 1277 66 289Perth Central Metropolitan (statistical division) 1 23 7 0.11 9 0.75 0 1408 124 949Hobart Greater Hobart (statistical division) 0.1 1 0.20 0.59 5 0.88 1 884 200 516
Survey Census
*= only available for WA towns; ARIA = Accessibility/Remoteness Index of Australia; C = city; GVP = gross value of production; SEIFA = Socio-Economic Indexes For Area; S = shire; T = Town; UC/L = urban centre/localityNote: The 'traffic light' indicators for each measure follow the logic of green being a positive measure through to red being a negative measure. Indicators are based on a measures distribution within the group of localities. Australian Bureau of Statistics population statistics are available for a variety of geographies within the Australian Standard Geographical Classification (ASGC). To
111
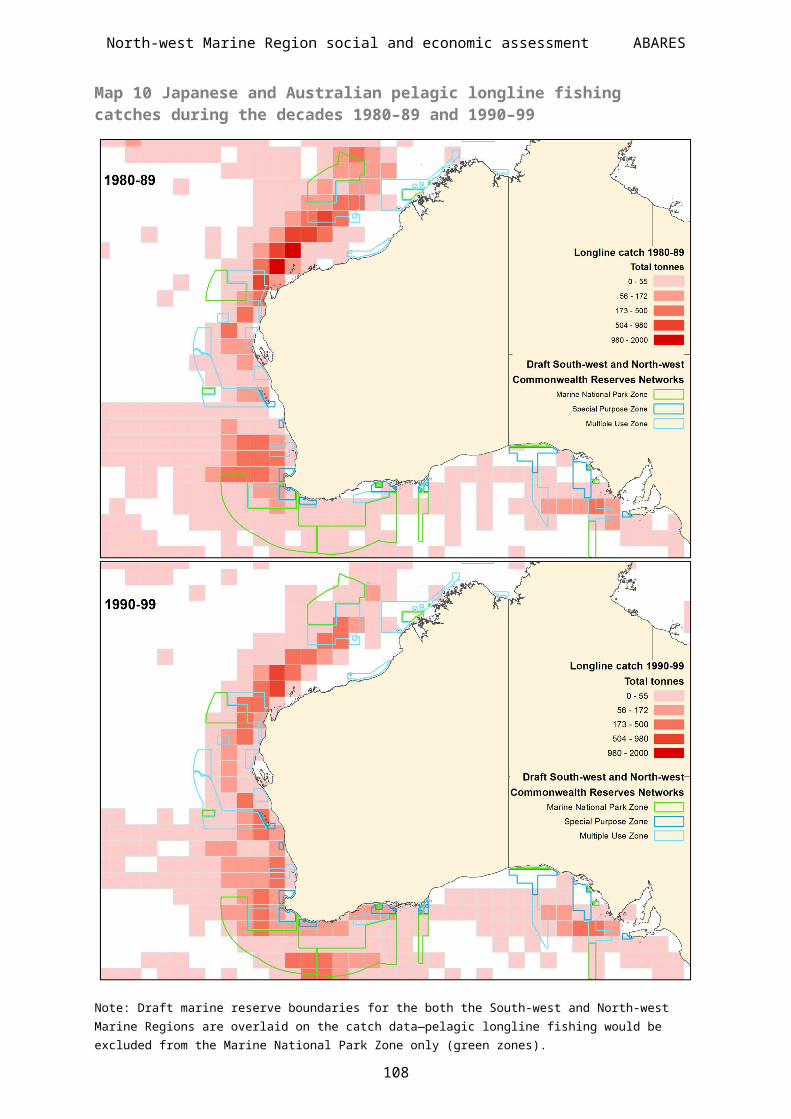
North-west Marine Region social and economic assessment ABARES
reflect the most appropriate representation of a community's population, different geographies have been used to calculate the GVP displaced per capita as follows: urban centre / locality is used for Kalbarri, Cervantes, Lancelin, Carnarvon, Broome, Point Samson; local government area is used for population and employment in the consolidated fishing industry for Fremantle. Table 32 includes towns that do not have a GVP displacement; however, these towns were identified as locations of input and output business through the survey and therefore may potentially be impacted.Data source: Commonwealth and WA logbook data; Australian Bureau of Statistics 2006. The vulnerability index is calculated on the draft and final GVP scenarios for all impacted towns in the region. This global scaling approach enables comparison of ranked scores across the two GVP scenarios.
112
North-west Marine Region social and economic assessment ABARES
8 References ABARES 2010, Australian fisheries surveys report 2010: results for selected fisheries, 2007–08 and 2008–09—preliminary estimates for 2009–10, Australian Bureau of Agricultural and Resource Economics and Sciences, Canberra.
ABARES 2011a, Agricultural commodity statistics 2011, Australian Bureau of Agricultural and Resource Economics and Sciences, Canberra.
ABARES 2011b, Australian fisheries statistics 2010, Australian Bureau of Agricultural and Resource Economics and Sciences, Canberra.
ABARES 2012a, Australian fisheries surveys report 2011: results for selected fisheries, 2008–09 to 2010–11, Australian Bureau of Agricultural and Resource Economics and Sciences, Canberra.
ABARES 2012b, Coral Sea Commonwealth Reserve: social and economic assessment of the impacts on commercial and charter fishing, ABARES report to client prepared for the Department of Sustainability, Environment, Water, Population and Communities, Australian Bureau of Agricultural and Resource Economics and Sciences, Canberra.
ABARES 2012c, North Marine Region Commonwealth Reserves Network: social and economic assessment of the impacts on commercial and charter fishing, ABARES report to client prepared for the Department of Sustainability, Environment, Water, Population and Communities, Australian Bureau of Agricultural and Resource Economics and Sciences, Canberra.
ABARES 2012d, South-west Marine Region Commonwealth Reserves Network: social and economic assessment of the impacts on commercial and charter fishing, ABARES report to client prepared for the Department of Sustainability, Environment, Water, Population and Communities, Australian Bureau of Agricultural and Resource Economics and Sciences, Canberra.
ABARES 2012e, Temperate East Marine Region Commonwealth Reserves Network: social and economic assessment of the impacts on commercial fishing, ABARES report to client prepared for the Department of Sustainability, Environment, Water, Population and Communities, Australian Bureau of Agricultural and Resource Economics and Sciences, Canberra.
Adger, WN & Vincent, K 2005, ‘Uncertainty in adaptive capacity’, Comptes Rendus Geoscience, vol. 337, pp. 399–410.
Allen Consulting (2005) Climate Change Risk and Vulnerability. Canberra: Report to the Australian Greenhouse Office, Department of the Environment and Heritage. Armitage, D 2005, ‘Adaptive capacity and community-based natural resource management’, Environmental Management, vol. 35, no. 6, pp. 703–715.
Beckley, T 1998, ‘The nestedness of forestry dependence: a conceptual framework and empirical exploration’, Society and Natural Resources vol. 11, no. 2, pp. 101–120.
BREE 2011, Resources and energy statistics 2011, Bureau of Resources and Energy Economics, Canberra.
113
North-west Marine Region social and economic assessment ABARES
Brooks, N & Adger, W 2004, ‘Technical Paper 7: Assessing and enhancing adaptive capacity’, in B Lim & E Spanger-Siegfried (eds), Adaptation policy frameworks for climate change: developing strategies, policies and measures, United Nations Development Programme, Cambridge.
Burnside, D 2007, The relationship between community vitality, viability and health and natural resources and their management: a brief review of the literature, final report prepared for the National Land & Water Resources Audit, Canberra.
CFA (Commonwealth Fishers Association) & WAFIC (Western Australian Fishing Industry Council) 2011, Commercial fishing industry submission: North-west Commonwealth marine reserve network proposal, CFA and WAFIC, Perth.
de Leeuw, ED, Hox, JJ & Dillman, DA 2008, International handbook of survey methodology, Taylor & Francis Group, New York.
DEWHA 2008. The North-West Marine Bioregional Plan: Bioregional Profile—a description of the ecosystems, conservation values and uses of the North-West Marine Region, Australian Government Department of the Environment, Water, Heritage and the Arts, Canberra.
Ellis, F (ed.) 2000, Rural livelihoods and diversity in developing countries, Oxford University Press, Oxford.
Fenton, M 2005, Guidebook on social impact assessment, prepared for the Comprehensive Coastal Assessment (Department of Planning) by Environment and Behaviour Consultants, Townsville.
Fletcher, WJ & Santoro, K (eds) 2010, State of the fisheries and aquatic resources report 2009/10, Western Australian Department of Fisheries, Perth.
Fletcher, WJ & Santoro, K (eds) 2011, State of the fisheries and aquatic resources report 2010/11, Western Australian Department of Fisheries, Perth.
FRDC 2004, Annual report 2003–04, Fisheries Research and Development Corporation, Canberra.
Herreria, E, Byron, I, Kancans, R & Stenekes, N 2008, Water 2010: assessing dependence on water for agriculture and social resilience, Bureau of Rural Sciences, Canberra.
Johnston, M & Williamson, T 2007, ‘A framework for assessing climate change vulnerability of the Canadian forest sector’, The Forestry Chronicle, vol. 83, no. 3 pp. 358–361.
Larcombe, J, Charalambou, C, Herrería, E, Casey, AM & Hobsbawn, P 2006, Marine matters national atlas of Australian marine fishing and coastal communities, Bureau of Rural Sciences, Canberra.
Machlis, G, Force, J & Balice, R 1990, ‘Timber, minerals and social change: an exploratory test of two resource-dependent communities’, Rural Sociology, vol. 55, no. 3, pp. 411–424.
Marshall, NA, Fenton, DM, Marshall, PA & Sutton, SG 2007. ‘How resource dependency can influence social resilience within a primary resource industry’, Rural Sociology, vol. 72, no. 3, pp. 359–390.
114

North-west Marine Region social and economic assessment ABARES
Nelson, R, Kokic, P, Elliston, L & King, J 2005, ‘Structural adjustment: a vulnerability index for Australian broadacre agriculture’, Australian Commodities, vol. 12, no. 1, pp. 171–179.
Parkins, JR & MacKendrick, NA 2007, ‘Assessing community vulnerability: a study of the mountain pine beetle outbreak in British Columbia, Canada’, Global Environmental Change, vol. 17, pp. 460–471.
Patriquin, M, Parkins, JR & Stedman, RC 2007, ’Socioeconomic status of boreal communities in Canada’, Forestry: An International Journal of Forest Research, vol. 80, no. 3, pp. 279–291.
Schröter, D & The ATEAM Consortium 2004, Global change vulnerability: assessing the European human–environment system, Potsdam Institute for Climate Impact Research, viewed 10 May 2012, <http://unfccc.int/files/meetings/workshops/other_meetings/application/pdf/schroeter.pdf>.
SEWPaC 2011a, Marine bioregional plan for the North-west Marine Region: draft for consultation, Australian Government Department of Sustainability, Environment, Water, Population and Communities, Canberra.
SEWPaC 2011b, Proposal for the North-west Commonwealth Marine Reserves Network: consultation paper, Australian Government Department of Sustainability, Environment, Water, Population and Communities, Canberra.
Stenekes, N, Kancans, R, Randall, L, Lesslie, R, Stayner, R, Reeve, I & Coleman, M 2010, Indicators of community vulnerability and adaptive capacity across the Murray–Darling Basin: a focus on irrigation in agriculture, report prepared for the Murray-Darling Basin Authority, Australian Bureau of Agricultural and Resource Economics – Bureau of Rural Sciences, Canberra.
Turton, A 1999, Water scarcity and social adaptive capacity: towards an understanding of the social dynamics of water demand management in developing countries, MEWREW Occasional Paper No. 9, School of Oriental and African Studies, University of London.
WA DoF 2011, Department of Fisheries annual report to the parliament 2010/11, Western Australian Department of Fisheries, Perth.
Wilson, DT, Curtotti, R, & Begg, GA (eds) 2010, Fishery status reports 2009: status of fish stocks and fisheries managed by the Australian Government, Australian Bureau of Agricultural and Resource Economics – Bureau of Rural Sciences, Canberra.
Woodhams, J, Stobutzki, I, Vieira, S, Curtotti, R & Begg, GA (eds) 2011, Fishery status reports 2010: status of fish stocks and fisheries managed by the Australian Government, Australian Bureau of Agricultural and Resource Economics and Sciences, Canberra.
Yohe, G & Tol, RSJ 2002, ‘Indicators for social and economic coping capacity: moving toward a working definition of adaptive capacity’, Global Environmental Change, vol. 12, no. 1, pp. 25–40.
115
Supplementary report: North-west Marine Region social and economic assessment—ABARES
Supplementary report: Final North-west Commonwealth Marine Reserves Network proposal As part of the Marine Bioregional Planning process, the Australian Government, through the Department of Sustainability, Environment, Water, Population and Communities (SEWPaC; the lead government agency) revised the proposal for the North-west Commonwealth Marine Reserves Network. These revisions arose from consideration of submissions received during the public consultation period, and the ABARES social and economic assessment of the draft marine reserves.
This supplementary report provides, where possible, a comparative analysis of the changes to the potential social and economic impacts between the draft North-west Commonwealth Marine Reserves Network proposal released for public comment in August 2011 (SEWPaC 2011b) and the final North-west Commonwealth Marine Reserves Network proposal released on 14 June 2012. ABARES was not in a position to undertake additional consultation (surveys or interviews) with commercial and charter fishing businesses for the supplementary assessment due to timing constraints.
116
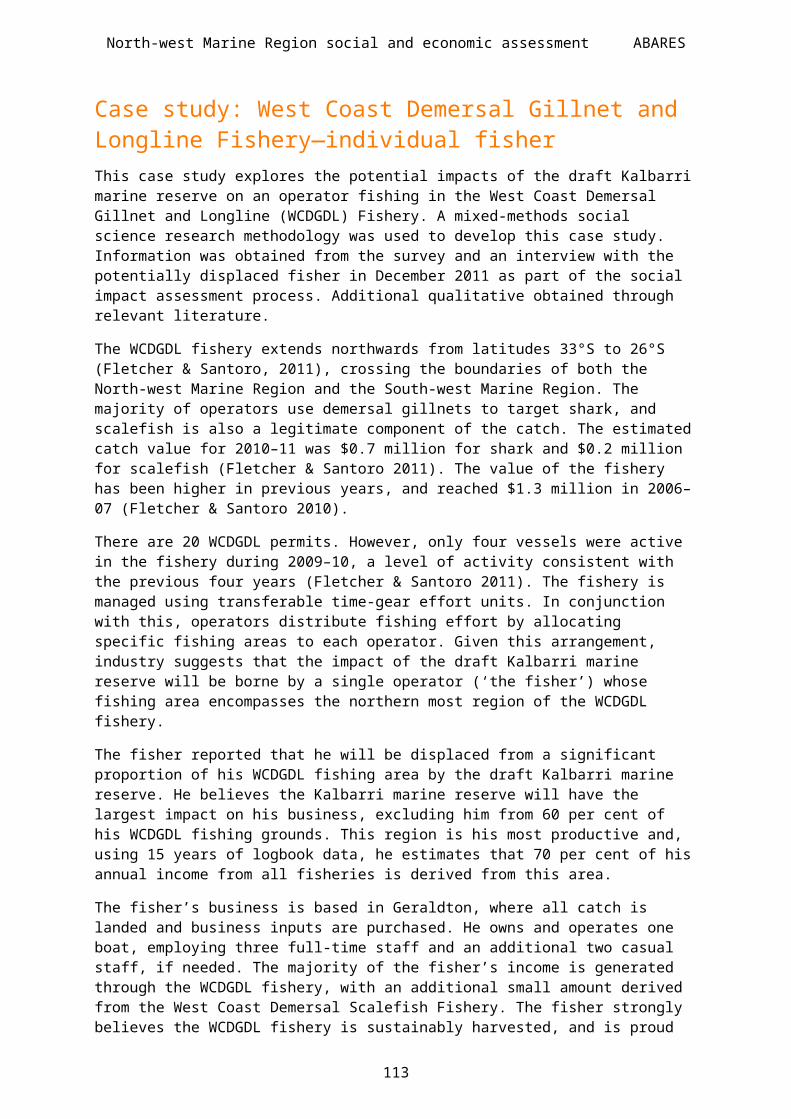
Supplementary report: North-west Marine Region social and economic assessment—ABARES
OverviewThe final North-west Commonwealth Marine Reserves Network proposal would displace an annual average of 87.6–109.8 tonnes of catch with a GVP of $546 200– $615 400 across both state and Commonwealth fisheries. The total comprises $110 910 would be displaced from Commonwealth fisheries, and $435 300–$504 500 from Western Australian (WA) fisheries (Table S1). Overall total estimates represent a small proportion (0.37–0.42 per cent) of the collective fisheries GVP from potentially impacted fisheries ($146.3 million). These values are the totals for the potentially impacted fisheries in each jurisdiction and are not adjusted to account only for fishing in the North-west Marine Region.
The final proposed network represents a reduction from $667 900–739 300 (annual average displaced GVP) under the draft network, to $546 200–615 400 under the final proposed network. This is a reduction of 16.8–18.2 per cent in the potential annual average GVP displacement overall, comprised of a 16 per cent increase for Commonwealth fisheries, and a 21.6–23.9 per cent decrease for WA fisheries.
The final North-west Commonwealth Marine Reserves Network proposal removed potential impacts on the WA Trochus fisheries, and impacts on the Shark Bay Prawn and Nickol Bay Prawn fisheries were substantially reduced. The WA Pilbara Fish Trap and West Coast Demersal Scalefish fisheries were added to the list of impacted fisheries, and marginally higher potential impacts were identified for the Commonwealth North West Slope Trawl and the Northern Prawn fisheries and the WA Kimberley Prawn Fishery under the final proposed network.
The displacement of the charter fishery is estimated to remain low (fewer than five clients per year, and less than 0.07 per cent of total charter fishery clients in Western Australia) under the final proposed network. The final proposed network represents a 19.2 per cent reduction in displaced clients, but a 63.7 per cent increase in potentially displaced retained catch compared with the draft network. The potential displacement of charter activity from the Gascoyne marine reserve has been removed, but increases in potentially displaced catch occur because of the introduction of the Dampier Marine National Park Zone.
There are cumulative impacts to some fisheries as a result of the draft reserve networks in the South-west and North marine regions. The final South-west Commonwealth Marine Reserves Network proposal potentially impacts the Commonwealth Western Deepwater Trawl and Western Tuna and Billfish fisheries, and the WA West Coast Demersal Gillnet and Longline, West Coast Demersal Scalefish and Charter fisheries (ABARES 2012d). The final North Commonwealth Marine Reserves Network proposal potentially impacts the Northern Prawn Fishery (ABARES 2012c).
The final North-west Commonwealth Marine Reserves Network proposal will potentially impact 25 ports/towns through flow of displaced GVP. Towns with the highest GVP displacement would be Darwin ($204 950; $3.09 per capita), Broome ($103 200; $8.94 per capita), Fremantle ($93 200; $3.91 per capita), Geraldton ($77 430; $4.09 per capita) and Point Samson ($30 560; $112.78 per capita).
Key changes in the flow of GVP to ports under the final North-west Commonwealth Marine Reserves Network proposal include a significant reduction in the flow of displaced GVP for Carnarvon (decrease of $97 050, to approximately $850), Geraldton (decrease of $78 410)
117

Supplementary report: North-west Marine Region social and economic assessment—ABARES
and Fremantle (decrease of $28 920). Substantial increases in absolute displacement of GVP to ports under the final proposed network occur for Darwin (increase of $44 730) and Broome (increase of $18 900). Newly identified impacted towns under the final North-west Commonwealth Marine Reserves Network proposal include Dampier, Denham, Desperate Bay, Dongara, Kalbarri and Onslow. Of these, Kalbarri ($7 600 displaced GVP) and Onslow ($4 130 displaced GVP) had the largest potential displacement under the final proposed network.
Point Samson was identified as having the highest level of exposure, based on the GVP displaced per capita, which decreased by 54 per cent under the final proposed network ($30 560 GVP potentially displaced; $112.78 GVP displaced per capita). Darwin, Broome, Fremantle and Geraldton all have exposure levels of less than $10.00 GVP displaced per capita.
Cumulative impacts identified for Darwin (from the draft North Commonwealth Marine Reserves Network; ABARES 2012c) and Fremantle (from the draft South-west Commonwealth Marine Reserves Network; ABARES 2012d) remain under the final proposed network.
The impact of the final proposed marine reserves network is expected to scale linearly with the change in GVP impact. Under this assumption, the final North-west Commonwealth Marine Reserves Network proposal would have an estimated total regional net economic impact of $1.0–$1.1 million, and a loss of approximately three jobs in directly affected regions in the short term. ABARES has not undertaken additional consultation (surveys or interviews) with potentially impacted commercial fishing, charter or supply chain businesses, or individuals, based on the final North-west Commonwealth Marine Reserves Network proposal. The nature of potential direct and secondary impacts, and broader issues exacerbating impacts arising from the final proposed network, are likely to be broadly similar to those identified for the draft North-west Commonwealth Marine Reserves Network.
Changes to the case studies for the draft North-west Commonwealth Marine Reserves Network have been examined under the final North-west Commonwealth Marine Reserves Network proposal. No further consultation (surveys or interviews) with impacted fishers or interviewees was possible for this purpose. However, discussion of likely changes to case study impacts was informed by the changes to displacement estimates, flow to ports and examination of the final proposed network. The impacts previously described in two of the case studies (Case study: Carnarvon—flow-on impacts to the community and Case study: Shark Bay, Kimberley and Nickol Bay prawn fisheries—variability in prawn production) are likely to have been mitigated to an extent under the final proposed network (with the exception of the Kimberley Prawn Fishery). The impacts presented in the remaining case studies (Case study: Western Tuna and Billfish Fishery—displacement and prospective fishing and Case study: West Coast Demersal Gillnet and Longline Fishery—individual fisher) may have been reduced, but overall the impacts are likely to be broadly similar.
118

Supplementary report: North-west Marine Region social and economic assessment—ABARES
Changes to the North-west Commonwealth Marine Reserves Network The changes to the draft marine reserves network are summarised in Table S0 and mapped in Map S1.
Change to zoning with respect to allowable activities have occurred in the final proposed network. A detailed list is included in Table S0. Notable changes include the introduction of new zones, including:
Habitat Protection Zone (IUCN IV), excludes all demersal and benthic methods, including demersal trawl, demersal gillnet, demersal longline, fish traps, lobster pots and crab pots.
Special Purpose Zone (IUCN VI), excludes demersal trawl only.
Table S0 Differences between the draft and final proposed North-west Commonwealth Marine Reserves NetworksMarine reserves (previous ABARES area number)
Final proposed network
Abrolhos Extension (Kalbarri) (new)
Area Number: 101Introduction of a new Special Purpose Zone (IUCN VI) (allowing demersal gillnet and demersal longline) between Kalbarri and Abrolhos reserves (in South-west Marine Reserves Network), to provide connectivity with minimal impact on fishing
Kalbarri (101) Area Number: 102 and 103Boundaries: Southern boundary shifted northwardArea: Total area in NW region 6862 km2 (including revised area 101)Zoning: Addition of Marine National Park Zone
Shark Bay (102) Area Number: 106Boundaries: Revision of the northern boundariesArea: 9.9 per cent reduction (from 8263 km2 to 7441 km2)Zoning: No change
Abrolhos (Wallaby Extension) (103)
Area Number: 104Boundaries: No changeArea: No changeZoning: Entire reserve from Multiple Use (IUCN VI) to Habitat Protection (IUCN IV)
Carnarvon Canyon (104) Area Number: 105Boundaries: Revision of reserve boundariesArea: 28.2 per cent increase (from4832 km2 to 6,194 km2)Zoning: Entire reserve from Multiple Use (IUCN VI) to Habitat Protection (IUCN IV)
119

Supplementary report: North-west Marine Region social and economic assessment—ABARES
Marine reserves (previous ABARES area number)
Final proposed network
Gascoyne (105 and 106) Area Number: 107,108, 109 and 110Boundaries: No changeArea: No changeZoning: Southern area, introduction of Habitat Protection Zone (IUCN IV) (around 170 km2).North-western area, change from Marine National Park (IUCN II) to Multiple Use (IUCN VI).Central area, change from Marine National Park (IUCN II) to Habitat Protection (IUCN IV) (9100 km2)
Montebello (new) Area Number: 1113413 km2
Introduction of new Multiple Use (IUCN VI) marine reserve. Total area is 3413 km2
Dampier (new) Area Number: 112Introduction of a new reserve zoned for Marine National Park (IUCN II), adjacent to the Dampier Archipelago reserve proposal in state waters, and Habitat Protection (IUCN IV) north of Burrup Peninsula and Nickol Bay. Total area of reserve is 1252 km2
Eighty Mile Beach (107) Area Number: 113Boundaries: Revision of the southern boundary at the western endArea: 10.9 per cent reduction (from 12 105 km2 to 10 791 km2)Zoning: No change
Roebuck (New) Area Number: 114Introduction of a new reserve (approximately 300 km2) adjacent to state waters, zoned for Multiple Use (IUCN VI)
Argo-Rowley Terrace note: name change, previously Pilbara (108, 109 and 110)
Area Number: 115 and 116Boundaries: Revision of reserve boundaries in south to encompass all of Imperieuse Reef (one of the Rowley Shoals)Area: 0.2 per cent increase (from 145 833 km2 to 146 099 km2)Zoning: centre and north-east, change from Marine National Park (IUCN II) to Multiple Use (IUCN VI)
Kimberley (111, 112 and 113)
Area Number: 118, 119, 120 and 121Boundaries: Revision of the north-western boundary (running north-east to south-west parallel with the coast) and of the north-eastern boundary Area: 18.6 per cent increase (from 62 791 km2 to 74 469 km2)Zoning: change in zoning of a section of Marine National Park Zone (IUCN II), (previously area 112, currently area 115), to include a Habitat Protection (IUCN IV)
Oceanic Shoals (114) Area Number: 122Boundaries: Minor revisions to reserve boundariesArea: No changeZoning: No change
Joseph Bonaparte Gulf (115)
Area Number: 123Boundaries: No changeArea: No changeZoning: No change
Note: ABARES area numbers refer to the draft and final sequencing for the North-west Commonwealth Marine Reserves Network proposals (Map S1)Data source: Australian Government Department of Sustainability, Environment, Water, Population and Communities
120

Supplementary report: North-west Marine Region social and economic assessment—ABARES
Map S0 North-west Marine Region draft (released August 2011) and final proposed (released 14 June 2012) marine reserves networks with zones and area numbering
EEZ = Exclusive economic zone. Note: The draft Pilbara marine reserve (areas 108, 109 and 110) was renamed Argo-Rowley Terrace (areas 112 and 113) in the final proposed network. Data sources: Marine reserve boundary from the Australian Government Department of Sustainability, Environment, Water, Population and Communities; coastline and bathymetry from Geoscience Australia
121
Supplementary report: North-west Marine Region social and economic assessment—ABARES
Potential displacement of fishing
Commercial fishing It is estimated that the final North-west Commonwealth Marine Reserves Network proposal would displace an annual average of 87.6–109.8 tonnes of catch with a GVP of $546 200– $615 400 (Table S1). Of this, $110 910 would be displaced from Commonwealth fisheries and $435 300– $504 500 from WA fisheries. The largest potential displacement from the final North-west Commonwealth Marine Reserves Network proposal occurs in the Kimberley, Kalbarri and Argo-Rowley Terrace marine reserves (Table S7–Table S10).
This potential displacement represents a small proportion (0.37–0.42 per cent) of the total fisheries production of the 11 potentially impacted fisheries ($146.4 million; $95.1 million for Commonwealth fisheries and $51.3 million for WA fisheries). The collective fisheries production (GVP) are the totals for the impacted fisheries in each jurisdiction and are not adjusted to account only for fishing that occurred in the North-west Marine Region.
The final proposed network represents a reduction from $667 900–739 300 (annual average GVP) under the draft network, to $546 200–$615 400 (annual average GVP) under the final proposed network. Total potential GVP displacement for the final North-west Commonwealth Marine Reserves Network proposal is therefore estimated to have decreased by 16.8–18.2 per cent when compared with the draft network (Table S1). There was a 16 per cent increase in the potential displacement of Commonwealth fisheries under the final proposed network, and a 21.6–22.5 per cent decrease in the potential displacement of WA fisheries.
Under the final proposed network, the largest absolute impact in terms of catch (tonnes) remains the WA Northern Shark Fishery (estimates are confidential). However, the largest estimate for GVP displacement shifts to the WA Kimberley Prawn Fishery ($190 500–259 040, 5.5–7.5 per cent of the fishery), which is an increase from the draft network (Table S7–Table S10).
In percentage terms, the greatest impact for both catch and GVP would be to the WA Northern Shark Fishery (displacement estimates are confidential). Although this fishery ceased operation in 2009, fishing occurred during the reference period and therefore is included in the displacement estimates. Next highest are the Commonwealth North West Slope Trawl Fishery (7 per cent of annual average fishery value), WA Kimberley Prawn Trawl Fishery (5.5 to 7 per cent of total average annual GVP) and the West Coast Demersal Gillnet and Longline Fishery (confidential) (Table S7–Table S10).
The North West Slope Trawl Fishery remains the Commonwealth fishery most affected by the North-west Commonwealth Marine Reserves Network, with the final proposed network increasing estimated GVP displacement to 7 per cent (Table S7). Potential displacement estimates for the Commonwealth Northern Prawn Fishery almost doubled; however, in the context of the overall fishery value ($89 million GVP in 2009–10), the impact on this fishery is still relatively low (0.04 per cent of annual average fishery GVP). Note that some of the estimates for the Northern Prawn Fishery arise from catch reported within the Kimberley Prawn Fishery management area, suggesting some misallocation of catch between fisheries; these estimates have been retained in the Northern Prawn Fishery.
The final North-west Commonwealth Marine Reserves Network proposal removed potential impacts on the WA Trochus Fishery, while the WA Pilbara Fish Trap and West Coast Demersal Scalefish fisheries were added to the potentially impacted fisheries. Potential
122

Supplementary report: North-west Marine Region social and economic assessment—ABARES
displacement estimates for the WA Shark Bay Prawn Fishery were substantially reduced, and marginally higher impacts were identified for the Commonwealth North West Slope Trawl Fishery and the Northern Prawn Fisheries under the final proposed network.
Potential displacement of the Nickol Bay Prawn Fishery is reduced under the final proposed network (estimates are confidential); however, the impact has shifted. Under the draft network the Eighty Mile Beach marine reserve potentially displaced the Nickol Bay Prawn Fishery. This has been removed under the final proposed network; however, this fishery is potentially displaced by the new Dampier Marine Reserve. Due to the inherent variability of the prawn fisheries and the shorter reference period used for the Nickol Bay Prawn Fishery (2 years; 2008 and 2009) an upper bound estimate was developed through consultation with industry for the draft network. The development of an upper bound was not possible under the final proposed network.
The WA Kimberley Prawn Fishery had an increase in potential displacement under the final North-west Commonwealth Marine Reserves Network proposal. The potential displacement of the Kimberley Prawn Fishery may be overestimated for both the draft and final proposed networks. This is because the analysis method does not fully account for the staggered nature of effort within fishing grounds, which is likely to mean that less fishing is occurring within the marine reserves (which tend to be at the margins of the fishing grounds). Better estimates of potential displacement would require better trawl ground mapping or detailed data on positions of shots.
Fishers in the prawn fisheries were particularly concerned about cumulative impacts due to displacement across a number of areas within the North-west Marine Region and because many prawn fishers hold licences in multiple fisheries.
Links to other marine regions—fisheriesThere may be cumulative impacts to some of the fisheries identified in the North-west Marine Region from draft marine reserves networks in other marine regions. This includes additional displacement by the draft South-west Commonwealth Marine Reserves Network in the Commonwealth Western Deepwater Trawl (final estimates are confidential) and Western Tuna and Billfish (19.3 tonnes; $114 200) fisheries, and the WA West Coast Demersal Gillnet and Longline (estimates confidential), and West Coast Demersal Scalefish (12.18 tonnes; $97 460 GVP) fisheries (ABARES 2012c). There are also potential impacts in the Northern Prawn Fishery from the draft North Commonwealth Marine Reserves Network (120–145 tonnes; $1.18–2.08 million GVP; ABARES 2012b).
123
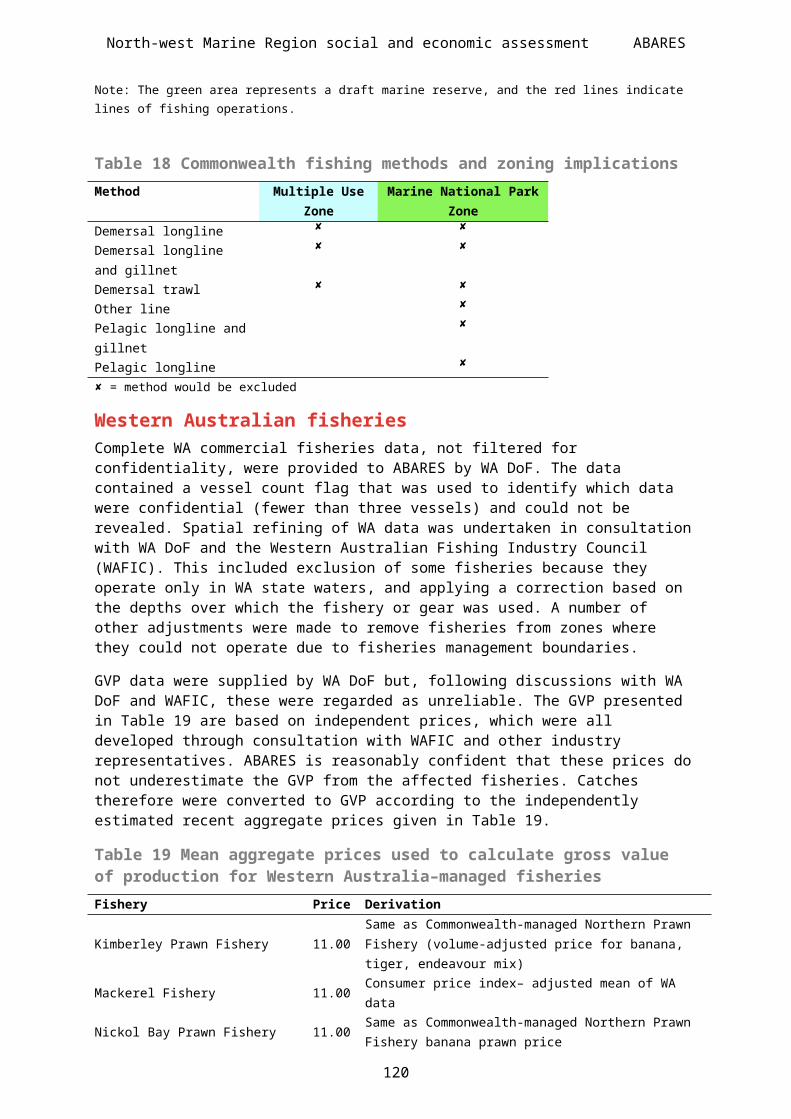
Supplementary report: North-west Marine Region social and economic assessment—ABARES
Table S1 Comparison of estimates of catch and gross value of production (GVP) potentially displaced by the draft (released August 2011) and final proposed (released 14 June 2012) marine reserves networks in the North-west Marine Region
Total catch (tonnes) Total GVP ($’000)
Fishery Draft Final proposed
Draft Final proposed Absolute change Percentage change
North West Slope Trawl Fishery (trawling) 3.4 4.0 63.6 71.6 8.1 12.7
Northern Prawn Fishery (trawling) 1.7 3.2 16.6 32.5 15.9 96.4
Western Deepwater Trawl Fishery (trawling) 0.5 0.5 3.5 3.3 –0.2 –4.6
Western Tuna and Billfish Fishery (longline, handline, troll and poling)
2.0* 0.6 11.7* 3.4 * Decreased
Commonwealth fisheries total 7.6 8.3 95.6 110.9 15.3 16.0
Kimberley Prawn Fishery (trawling) 13.2–16.3 17.3–23.6* 145.1–179.4 190.5–259.0* * Increased
Pilbara Fish Trap Fishery (trawling) 2.3 18.2 18.2 New
Mackerel Fishery (handline and troll line) 0.2* 1.1 2.3* 12.4 * Increased
Nickol Bay Prawn Fishery (trawling) 1.6–5.0 * 17.8–55.0 * * Decreased
Northern Shark Fishery (longline and gill net) * * * * * 22.6
Northern Demersal Scalefish Fishery (line and fish trap)
* * * * * No change
Shark Bay Prawn Fishery (trawling) 18.0 * 195.5 * * Decreased
West Coast Demersal Scalefish (dropline and handline)
1.4 11.2 11.2 New
West Coast Demersal Gillnet and Longline Fishery (demersal gillnet and demersal longline)
* * * * * –29.7
Trochus Fishery n.a. n.a. n.a. Removed
Western Australian fisheries total 85.0–91.5 79.2–101.4 572.3–643.8 435.3–504.5 –137.0 to –139.3 –23.9 to –21.6
Grand total 92.7–99.2 87.6–109.8 667.9–739.3 546.2–615.4 –121.7 to –123.9 –18.2 to –16.8
Note: Commonwealth estimates have are based on shot-by-shot position data (latitude and longitude high accuracy). Western Australian estimates are based on 10-minute grids (medium accuracy) with a reference period of 2008–10 (Nickol Bay Prawn Fishery uses 2008–09), except for the Kimberly Prawn Fishery, which is based on stratified 60-minute grids (low–medium accuracy) with a reference period of 2000–10. Confidential data are marked with an asterisk (*). In some fisheries, the displacement is confidential for one scenario. In these cases, the percentage change is not presented because it would be possible to back-calculate the displacement from that area. However, where appropriate, a description of the change has been included: no change, increase or decrease. n.a. = no calculation of displacement estimates because data were not available, however, consultation with WA Department of Fisheries has indicated there would be displacement under the draft network. The grand totals calculations include all data (except Trochus Fishery) and are not affected by confidentiality.
124
Supplementary report: North-west Marine Region social and economic assessment—ABARES
Charter fishing The charter activity displaced by the final North-west Commonwealth Marine Reserves Network proposal is low compared with the total WA charter fishery (0.07 per cent of total WA charter client numbers). The final proposed network represents a 19.2 per cent reduction in displaced clients, but a 63.7 per cent increase in potentially displaced retained catch compared with the draft network (Table S2). The potential displacement of charter activity from the Gascoyne marine reserve has been removed, but increases in potentially displaced catch occur because of the introduction of the Dampier Marine National Park Zone (area 112).
Table S2 Comparison of estimated potential charter fishing displacement between the draft and final North-west Commonwealth Marine Reserves Network proposalsCharter fishery Draf
t Final proposed Percentage change
Mean retained catch (number of fish) 16.6 27.1 63.7
Mean number of clients 21.4 17.3 -19.2
Note: Estimates are based on 5-minute grid scale data with a reference period of 2002–10.
Prospective fisheriesThe assessment of the draft marine reserves noted potential impacts on prospective fishing through expansion of fishery catch and area, development of new fisheries and redevelopment of fisheries. The specific examples given for the draft marine reserves (see sections on Prospective fishing; Case study: Western Tuna and Billfish Fishery—displacement and prospective fishing) and the issues raised with respect to prospective fishing are not anticipated to change significantly under the final proposed network. Impacts on prospective fishing as described in the Case study: Western Tuna and Billfish Fishery—displacement and prospective fishing will probably not have changed significantly, due to the nature of the prospective business plans. However, the rezoning of the Gascoyne Marine National Park Zone to a Habitat Protection Zone may lessen the impact on prospective fishing in this area.
Flow of potential impacts to portsThe final North-west Commonwealth Marine Reserves Network proposal will potentially impact 25 ports/towns through flow of displaced GVP. Towns with the highest GVP displacement would be Darwin ($204 950; $3.10 per capita), Broome ($103 200; $8.90 per capita), Fremantle ($93 200; $3.90 per capita), Geraldton ($77 430; $4.10 per capita) and Point Samson ($30 560; $112.80 per capita).
Key changes in the flow of GVP to ports under the final North-west Commonwealth Marine Reserves Network proposal include a significant reduction in the flow of potential displaced GVP estimated to Carnarvon (decrease of $97 050, to approximately $850), Geraldton (decrease of $78 410) and Fremantle (decrease of $28 920). Substantial increases in absolute displacement of GVP to ports under the final proposed network occur for Darwin (increase of $44 730) and Broome (increase of $18 900).
125
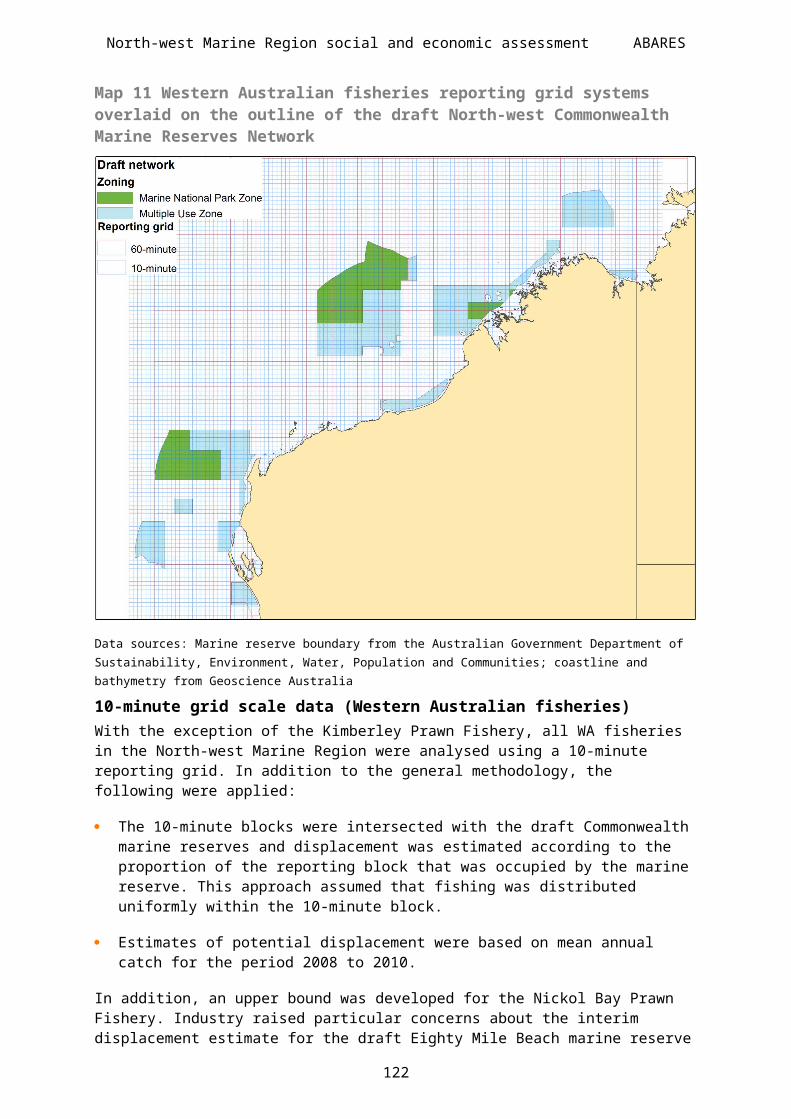
Supplementary report: North-west Marine Region social and economic assessment—ABARES
Newly identified impacted towns under the final North-west Commonwealth Marine Reserves Network proposal include Dampier, Denham, Desperate Bay, Dongara, Kalbarri and Onslow (Table S3). Of these, Kalbarri ($7 600 GVP) and Onslow ($4 130 GVP) had the largest potential displacement under the final proposed network. The other newly identified towns each have less than $1000 in annual GVP displacement.
Table S3 Comparison of estimates of flow of potentially displaced gross value of production (GVP) by the draft and final proposed North-west Commonwealth Marine Reserves Networks
Potentially displaced GVP ($’000)
Port Draft Final proposed Absolute change
Albany 1.0 0.8 –0.1
Brisbane 0.6 2.7 2.1
Brookes Inlet 0.1 0.1 0.0
Broome 84.3 103.2 18.9
Cairns 2.3 3.3 1.0
Carnarvon 97.9 0.8 –97.0
Dampier 0.1 0.0
Darwin160.2 204.9 44.7
Denham 0.2 0.2
Derby 0.3 0.2 0.1
Desperate Bay 0.1 0.1
Dongara 0.1 0.1
Exmouth 0.3 0.3 0.1
Fremantle122.1 93.2 –28.9
Geraldton155.8 77.4 –78.4
Hobart 0.1 0.1 0.0
Johns Creek 1.2 1.2 0.0
Kalbarri 7.6 7.6
Lakes Entrance 0.6 0.6 0.0
Nickol Bay 2.9 0.4 –2.5
Onslow 4.1 4.1
Point Samson 29.6 30.6 1.0
Port Hedland 7.8 12.7 4.9
Two Rocks 0.5 0.3 –0.2
Wyndham 0.4 0.8 0.3Note: Only point estimates are presented here.
Town and local area summaryTable S4 presents GVP displaced to location of landing (port/town), location population and GVP displaced per capita. There were four locations with a potential flow of GVP impact greater than $50 000 per year (in descending order, Darwin, Broome, Fremantle and Geraldton) and one location with GVP impact per capita greater than $20 (Point Samson).
126

Supplementary report: North-west Marine Region social and economic assessment—ABARES
Table S4 Community exposure, sensitivity and adaptive capacity—final North-west Commonwealth Marine Reserves Network proposal
SENSITIVITY
Town Population geography
GVP displaced
revised ($'000 point)
Population (2006)
GVP displaced per capita
($)
Fishing industry
employment (% of total
employment)Economic
diversity index
ARIA remoteness
index
Median household
income ($/week)
SEIFA index of relative
disadvantage
DarwinDarwin City (statistical subdivision) 204.9 66 289 3.09 0.47 0.72 2 1277 6
Broome Broome (S) 103.2 11 548 8.94 2.00 0.88 3 1129 2
Fremantle Fremantle (C) - Inner 93.2 23 838 3.91 0.64 0.88 0 911 6
Geraldton Geraldton (C) 77.4 18 915 4.09 2.17 0.91 2 783 2
Point Samson Point Samson (UC/L) 30.6 271 112.78 0.11 0.19 3 2010 7
Port Hedland Port Hedland (T) 12.7 11 961 1.06 0.06 0.26 3 1865 5
Kalbarri Northampton (S) 7.6 3 209 2.37 2.50 0.31 3 659 3
Onslow Onslow 4.1 6 079 0.68 0.19 0.05 4 2143 7
CairnsCairns City Part A (statistical subdivision) 3.3 122 736 0.03 0.39 0.88 2 1050 6
Brisbane Brisbane (statistical division) 2.7 1 763 124 0.00 0.13 0.91 0 1192 7
Johns Creek Point Samson (UC/L) 1.2 271 4.29 0.11 0.19 3 2010 7
Carnarvon Carnarvon (S) 0.8 5 284 0.16 4.23 0.53 3 858 2
Albany Albany (C) - Central 0.8 15 977 0.05 0.26 0.97 2 728 3
Wyndham Wyndham-East Kimberley (S) 0.8 6 595 0.12 0.20 0.56 3 1160 1
Lakes Entrance E. Gippsland (S) - Bairnsdale 0.6 25 367 0.02 0.62 0.95 2 645 3
Nickol Bay Roebourne (S) 0.4 16 421 0.02 0.11 0.19 3 2010 7
Two Rocks Gingin (S) 0.3 4 318 0.08 2.38 0.30 2 827 5
Exmouth Exmouth (S) 0.3 2 064 0.15 6.24 0.82 4 1059 6
Derby Derby-West Kimberley (S) 0.2 6 506 0.04 0.21 0.56 4 881 1
Denham Denham UC/L 0.2 609 0.29 2.42 0.44 4 780 3
HobartGreater Hobart (Statistical subdivision) 0.1 200 516 0.00 0.59 0.88 1 884 5
Dampier Dampier UC/L 0.0 1 367 0.03 0.11 0.19 3 2010 7
Dongara Irwin (S) 0.0 3 054 0.01 4.98 0.42 2 869 5
Desperate Bay Carnamah (S) 0.0 747 0.02 0.00 0.24 3 874 5
Brookes Inlet Manjimup (S) 0.0 9 255 0.00 0.14 0.51 2 792 3
EXPOSURE ADAPTIVE CAPACITY
ARIA = Accessibility/Remoteness Index of Australia; C = City; GVP = gross value of production; S = Shire; SEIFA =Socio-Economic Indexes For Areas; UC/L = Urban Centre/LocalityNote: The 'traffic light' indicators for each variable follow the logic of green being a positive measure through to red being a negative measure for a given variable. Indicators are based on a variables measure within the distribution of scores for all localities that have a GVP displacement. Australian Bureau of Statistics population statistics are available for a variety of geographies within the Australian Standard Geographical Classification (ASGC). To reflect the most appropriate representation of a community's population, different geographies have been used to calculate the GVP displaced per capita. Data source: Commonwealth and WA logbook data; Australian Bureau of Statistics 2006
Point SamsonThe GVP displacement linked to Point Samson is $30 600 (point estimate), based on the final proposed network. This is a $990 increase compared with the draft network (point estimate). The exposure indicator for the Point Samson urban centre / locality (UC/L) is $112.78 per capita. Community sensitivity and adaptive capacity measures show that the statistical local area (SLA) of Roebourne (shire; S), in which Point Samson is located, has very low employment in the consolidated fishing industry (ABS data indicates 0.11 per cent), has a low level of economic diversity (0.19) and is not disadvantaged (Socio-Economic Indexes For Areas [SEIFA] decile ranking of 7). The median household income in Roebourne (S) is relatively high ($2010) compared with the rest of Australia, it is located in a remote area and has a relatively low population (population for Point Samson UC/L was 271 in 2006). This assessment indicated that Point Samson UC/L will potentially experience some impact due to displaced GVP from the declaration of the final North-west Commonwealth Marine Reserves Network proposal, but has a relatively moderate capacity to adapt (compared with other areas in this analysis).
127
Supplementary report: North-west Marine Region social and economic assessment—ABARES
Darwin, Broome, Fremantle and GeraldtonWhile there have been increases to the total estimate of GVP displacement for Darwin, Broome, Fremantle and Geraldton under the final North-west Commonwealth Marine Reserves Network proposal, these locations still have relatively low exposure levels, below $10.00 per capita. Impacts are likely to be mitigated because these locations have higher levels of economic diversity (all have an economic diversity index ranking of greater than 0.70), relatively large populations and are located in less remote areas (Darwin, Fremantle and Geraldton).
Links to other marine regions—towns and local areaCumulative impacts may occur to towns identified in the North-west Marine Region from GVP displaced from other final proposed marine reserves networks. The most substantial include cumulative impacts to Darwin ($551 000 to $565 000 annual average GVP) from the final North Commonwealth Marine Reserves Network proposal (ABARES 2012c) and Fremantle ($167 600 annual average GVP) from the final South-west Commonwealth Marine Reserves Network proposal (ABARES 2012d).
Economic impact and employmentNo specific modelling was undertaken to examine the potential impacts of the draft North-west Commonwealth Marine Reserves Network on employment. However, the results of subregional modelling undertaken in the South-west Marine Region (ABARES 2012d), North Marine Region (ABARES 2012c), Coral Sea (ABARES 2012b) and Temperate East Marine Region (ABARES 2012e) can be used to infer the likely scale of net economic impact arising from displaced GVP (See section ‘Potential Impacts on the economy’, in the main report). These studies model how the draft marine reserves are likely to affect gross product and employment across the selected subregional economies. The modelling includes short term impacts where adaptation in the economy was limited, and in the longer term were adaptation (labour and capital mobility) was free to occur.
Considering the draft North-west Commonwealth Marine Reserves Network is estimated to displace an annual fisheries GVP of $615 400 (upper estimate), this would equate to a loss of around three full-time-equivalent jobs displaced in directly affected regions in the short term and a regional net economic impact of approximately $1.0–1.1 million. There are likely to be flow-on impacts in other regions; however, changes in economic activity and employment at the state and national level are negligible in terms of the size of those economies and labour markets.
Table S5 Comparison of the short-term net economic impact and job losses between the draft and final North-west Commonwealth Marine Reserves Network proposals Draft Final proposed
Net regional economic impact ($ million) 1.2–1.3 1.0–1.1
Regional job loss (full-time equivalent) 3 3
128

Supplementary report: North-west Marine Region social and economic assessment—ABARES
Fishing business impactsABARES has not undertaken further consultation (surveys or interviews) with potentially displaced or impacted businesses based on the final North-west Commonwealth Marine Reserves Network. Survey and interview data collected previously were specific to the draft network, and are not necessarily applicable to the final proposed network.
The nature of the potential impacts and broader issues exacerbating impacts identified in the assessment of the draft network are likely to be analogous to those for the final proposed network. Impacts that could be applicable to fishing businesses under the final proposed network include:
direct displacement impacts—loss of access, reduction in scale of operation, loss of income, devaluation of licences and capital
secondary impacts resulting from having to change current fishing activities—spending more time, effort and resources on locating new fishing grounds; increased pressure and competition within fishing grounds outside of the final North-west Commonwealth Marine Reserves Network proposal
industry-wide impacts—heightened uncertainty and decreased confidence, increased risk in investing, difficulty in accessing finance, negative public perception
broader issues that exacerbate potential impacts—exchange rates, fish prices and input costs.
Personal impactsABARES has not undertaken further consultation (surveys or interviews) with potentially displaced or impacted businesses based on the final North-west Commonwealth Marine Reserves Network proposal. Survey and interview data collected previously were specific to the draft network, and are not necessarily applicable to the final proposed network.
The potential personal impacts identified in the assessment of the draft network are likely to be analogous to the potential personal impacts of the final North-west Commonwealth Marine Reserves Network proposal. Personal impacts that could be applicable to individuals under the final North-west Commonwealth Marine Reserves Network proposal include:
loss of current income source
loss of future income source (superannuation)
increased stress, individual and family
increased work hours
decreased personal time, time spent with family and quality of life.
129

Supplementary report: North-west Marine Region social and economic assessment—ABARES
Case studiesThe likely changes to circumstances identified in the case studies are discussed here, noting that no further consultation (surveys or interviews) has been undertaken following the final proposed network. Where possible, quantitative information was used (e.g. changes to potentially displaced GVP) but assessing changes to the case studies was largely qualitative.
Carnarvon—flow-on impacts to the communityUnder the final proposed network, it is anticipated that the impacts described in this case study will have been mostly removed because the displaced flow of GVP to Carnarvon was reduced by 99 per cent (Table S3) due to the changes to the boundary of the Shark Bay marine reserve (area 106) (Table S1). Displacement of the Shark Bay Prawn Fishery is confidential under the final proposed network estimates; however, changes to the Shark Bay marine reserve resulted in a decreased impact.
Western Tuna and Billfish Fishery—displacement and prospective fishingImpacts on prospective fishing as described in this case study will probably not have changed significantly, due to the nature of the prospective business plans in the North-west Marine Region. However, the rezoning of the Gascoyne Marine National Park Zone to a Habitat Protection Zone may lessen the impact on prospective fishing in this region because this will allow pelagic longlining in the area identified as being historically important for the Western Tuna and Billfish Fishery. In contrast, the impacts on the potential displacement of the individual fisher in the Western Tuna and Billfish Fishery are perceived to have been significantly reduced due to the overall decrease in displacement estimates for this fishery, compared with the draft network (Table S1).
Shark Bay, Kimberley and Nickol Bay prawn fisheries—variability in prawn productionPotential displacement estimates for catch and GVP for the prawn fisheries are significantly altered under the final proposed network. Under the final proposed network the impacts estimated for the Nickol Bay Prawn Fishery have been removed by the change to the Eighty Mile Beach Marine Reserve, however, a new impact is identified in the new Dampier marine reserve (Table S1). It is important to note that an upper bound estimate has not been calculated for the Nickol Bay Prawn Fishery under the final proposed network, and the impact of the variability of prawn production within the Dampier region has not been investigated for the final proposed network. A reduction is observed in the displacement of the Shark Bay Prawn Fishery (Table S1). Estimates for the Kimberley Prawn Fishery have increased on the whole, although these may be overestimated for both the draft and final proposed networks due to the staggered nature of effort within fishing grounds, which is likely to mean that less fishing is occurring within the marine reserves. The explanation of the variability of prawn fishing grounds through time and its consequence for potential impacts remain relevant to the final proposed marine reserves.
West Coast Demersal Gillnet and Longline Fishery—individual fisherThe impact on the West Coast Demersal Gillnet and Longline Fishery is reduced by 30 per cent under the final North-west Commonwealth Marine Reserves Network proposal. The relevant fisher highlighted that some of his income is also derived from the West Coast Demersal Scalefish Fishery, which is one of the additional impacted fisheries under the final North-west Commonwealth Marine Reserves Network proposal. The impact of the displacement of this fishery has not been discussed with the fisher. The fisher believed that
130
Supplementary report: North-west Marine Region social and economic assessment—ABARES
without investigating alternative ways to make up the shortfall, his business may not be viable if the draft Kalbarri marine reserve was declared.
Summary tables for the final North-west Commonwealth Marine Reserves Network proposalTable S6 provides updated information for newly impacted fisheries under the final proposed marine reserves network. Table S7 to Table S10 provide estimates of catch and potential GVP displacement for each draft marine reserve area, fishery and jurisdiction for the final North-west Marine Reserves Network proposal. Table S11 provides updated summary information on flow of impact to communities and community demographic information.
131
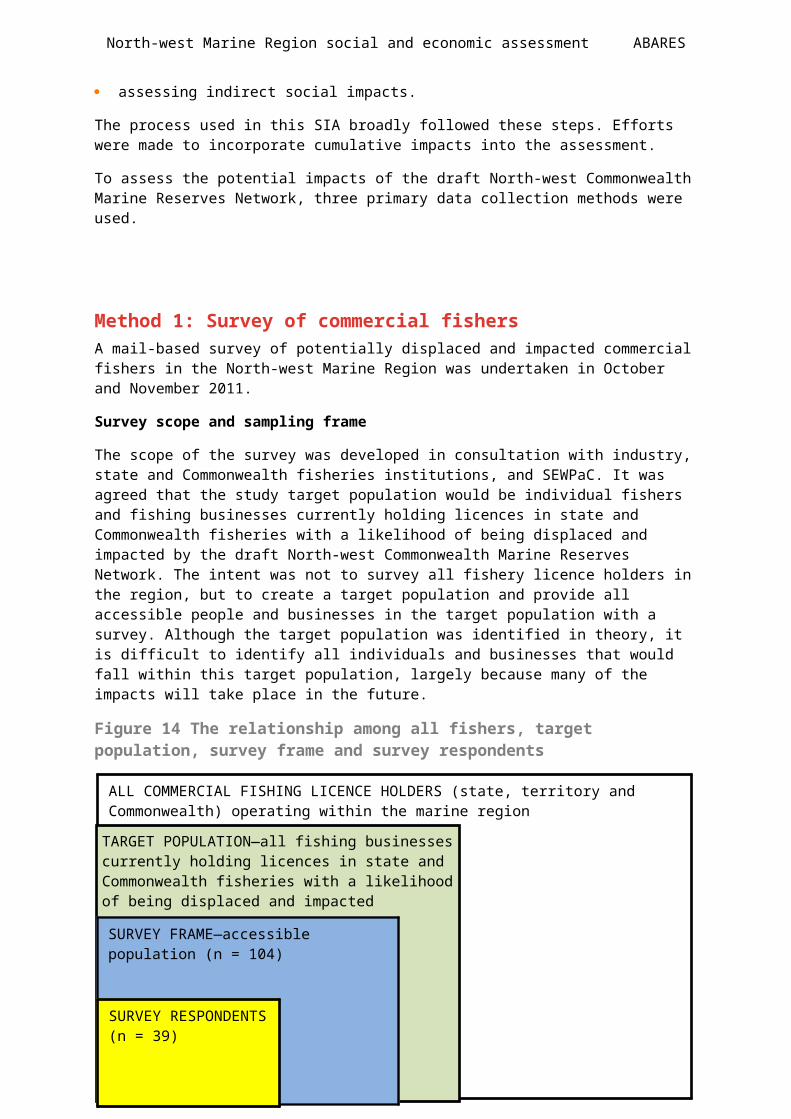
Supplementary report: North-west Marine Region social and economic assessment—ABARES
Table S6 Overview of additional potentially impacted fisheries and aggregate prices used to calculate gross value of production under the final North-west Commonwealth Marine Reserves Network proposalFishery Management
arrangementsTarget species
Number of licences
Number of vessels (year)
Employment Catch (tonnes)
Price ($)/kg (derivation)
Sources
Western Australia
Pilbara Fish Trap Fishery
Limited entry, individual transferrable effort, restricted number of trap days, spatial closures
Red emperor, crimson snapper, blue-spotted emperor, Rankin cod, goldband snapper, spangled emperor
6 licences, allocation consolidated into 3 vessels
3 (2010) 8 fishers 489 8.00Same as West Coast Demersal Gillnet and Longline Fishery as derived from the South-west Marine Region
Fletcher & Santoro (2010, 2011)
West Coast Demersal Scalefish Fishery
Limited entry (before 1 January 2008 it was open access), gear restrictions, individual transferable effort system came into place at start of 2009
West Australian dhufish, pink snapper, emperors, baldchin groper, breaksea cod
60 Interim Managed Fishery permits
50 (2010) The 50 permitted vessels that fished in the fishery in 2010 employed up to 3 crew members, with most employing 1 crew member per trip
365 8.00Same as West Coast Demersal Gillnet and Longline Fishery as derived from the South-west Marine Region
Fletcher & Santoro (2010, 2011)
132
Supplementary report: North-west Marine Region social and economic assessment—ABARES
Table S7 Estimates of mean annual potential catch displaced by the final North-west Commonwealth Marine Reserves Network proposal from Commonwealth fisheries over the reference period
Catch (tonnes)
Kal
bar
ri
Ab
rolh
os (
Wal
lab
y ex
ten
sion
)
Shar
k B
ay
Gas
coyn
e
Arg
o-R
owle
y T
erra
ce
Kim
ber
ley
Oce
anic
Sh
oals
Jose
ph
Bon
apar
te
Gu
lf
Tot
al
Per
cen
tage
of t
otal
fi
sher
y ca
tch
Fishery 102 103 104 106 107 108 109 110 116 117 118 122 123
North West Slope Trawl Fishery (trawling)
4.0 * * 4.0 6.0
Northern Prawn Fishery (trawling)
1.5 * * 3.2 <0.1
Western Deepwater Trawl Fishery (trawling)
* * * * * 0.4 * 0.5 0.5
Western Tuna and Billfish Fishery (longline, hand line, troll and poling)
* 0.5 * 0.6 <0.1
Total * * * * * 0.4 * 0.5 4.0 * 1.5* * * 8.3 0.10
Multiple Use Zone Habitat Protection Zone Marine National Park ZoneNote: Estimates are mean annual for the reference period (2001–10). Confidential data are marked with an asterisk (*). In some fisheries, only one area is confidential. In these cases, the total does not include the confidential data because it would be possible to back-calculate the displacement from that area. These are denoted by showing the sum of the non-confidential areas followed by an asterisk (e.g. 2.0*). The grand total at the bottom right includes all data and is not affected by confidentiality. Fisheries that did not report activity in the final proposed marine reserves network or did not use methods excluded by the zoning are not included in the table, only reserves with displacement are presented. Estimates have high accuracy as they are based on shot-by-shot position data (latitude and longitude).
133

Supplementary report: North-west Marine Region social and economic assessment—ABARES
Table S8 Estimates of mean annual potential gross value of production (GVP) displaced by the final North-west Commonwealth Marine Reserves Network proposal from Commonwealth fisheries over the reference period
GVP ($’000)
Kal
bar
ri
Ab
rolh
os (
Wal
lab
y ex
ten
sion
)
Shar
k B
ay
Gas
coyn
e
Eigh
ty M
ile
Bea
ch
Arg
o-R
owle
y T
erra
ce
Kim
ber
ley
Oce
anic
Sh
oals
Jose
ph
Bon
apar
te G
ulf
Tot
al
Per
cen
tage
of t
otal
fish
ery
GV
P
Fishery 102 103 104 106 107 108 109 110 114 116 117 118 122 123
North West Slope Trawl Fishery (trawling)
* 71.5 * * 71.6 7.0
Northern Prawn Fishery (trawling)
15.9 * * 32.5 <0.1
Western Deepwater Trawl Fishery (trawling)
* * * * * 1.9 * 3.3 0.3
Western Tuna and Billfish Fishery (longline, hand line, troll and poling)
* 3.1 * 3.4 <0.1
Total * * * * * 1.9 * 3.1 * 71.5 * 15.9* * * 110.9 0.12
Multiple Use Zone Habitat Protection Zone Marine National Park ZoneNote: Estimates are mean annual for the reference period (2001–10). Confidential data are marked with an asterisk (*). In some fisheries, only one area is confidential. In these cases, the total does not include the confidential data because it would be possible to back-calculate the displacement from that area. These are denoted by showing the sum of the non-confidential areas followed by an asterisk (e.g. 2.0*). The grand total at the bottom right includes all data and is not affected by confidentiality. Fisheries that did not report activity in the final proposed marine reserves network or did not use methods excluded by the zoning are not included in the table, only reserves with displacement are presented. Estimates have high accuracy as they are based on shot-by-shot position data (latitude and longitude). Prices used to calculate GVP have been final to reflect recent prices as per the preferred methodology.
134

Supplementary report: North-west Marine Region social and economic assessment—ABARES
Table S9 Estimates of mean annual potential catch displaced by the final North-west Commonwealth Marine Reserves Network proposal from Western Australian fisheries over the reference period
Catch (tonnes)
Kal
bar
ri
Shar
k B
ay
Dam
pie
r
Roe
bu
ck
Kim
ber
ley
Oce
anic
Sh
oals
Jose
ph
B
onap
arte
Tot
al
Per
cen
tage
of
tota
l fis
her
y ca
tch
Fishery 102 103 106 112 113 115 118 119 120 121 122 123
Kimberley Prawn Fishery (trawling)
17.3–21.4 * 0.0–0.03 0.0–2.1 17.3–23.6* 5.5–7.5*
Pilbara Fish Trap Fishery (trawling)
0.3 2.0 2.3 0.5
Mackerel Fishery (handline and troll line)
* * 0.2 1.1 0.4
Nickol Bay Prawn Fishery (trawling)
* * * *
Northern Shark Fishery (longline and gill net)
* * * * * * * * *
Northern Demersal Scalefish Fishery (line and fish trap)
* * *
Shark Bay Prawn Fishery (trawling)
* * *
West Coast Demersal Scalefish (dropline and handline)
1.4 1.4 0.2
West Coast Demersal Gillnet and Longline Fishery (demersal gillnet and demersal longline)
* * * *
Total * 1.4* * 0.4 2.0* * 17.3–21.4* * 0.0–0.03* 0.2–2.3* * * 79.2–101.4 1.5–1.9
Multiple Use Zone Habitat Protection Zone Marine National Park ZoneNote: Estimates are based on 10-minute grids (medium accuracy) with a reference period of 2008–10 (Nickol Bay Prawn Fishery uses 2008–09), except for the Kimberly Prawn Fishery, which is based on stratified 60-minute grids (low–medium accuracy) with a reference period of 2000–10. Confidential data are marked with an asterisk (*). In some fisheries, only one area is confidential. In these cases, the total does not include the confidential data because it would be possible to back-calculate the displacement from that area. These are denoted by showing the sum of the non-confidential areas followed by an asterisk (e.g. 2.0*). The grand total at the bottom right includes all data and is not affected by confidentiality. Point and upper estimates have been provided for Kimberley Prawn Fishery. Fisheries that did not report activity in the final proposed marine reserves network or did not use methods excluded by the zoning are not included in the table, only reserves with displacement are presented.
135
Supplementary report: North-west Marine Region social and economic assessment—ABARES
Table S10 Estimates of mean annual potential gross value of production (GVP) displaced by the final North-west Commonwealth Marine Reserves Network proposal from Western Australian fisheries over the reference period
GVP ($'000)
Kal
bar
ri
Shar
k B
ay
Dam
pie
r
Roe
bu
ck
Kim
ber
ley
Oce
anic
Sh
oals
Jose
ph
B
onap
arte
Tot
al
Per
cen
tage
of
tota
l fis
her
y G
VP
Fishery 102 103 106 112 113 115 118 119 120 121 122 123
Kimberley Prawn Fishery (trawling)
190.5–235.4 * 0.0–0.4 0.0–23.6 190.5–259.0* 5.5–7.5*
Pilbara Fish Trap Fishery (trawling)
2.5 15.7 18.2 0.5
Mackerel Fishery (handline and troll line)
* * 2.3 12.4 0.4
Nickol Bay Prawn Fishery (trawling)
* * * *
Northern Shark Fishery (longline and gill net)
* * * * * * * * *
Northern Demersal Scalefish Fishery (line and fish trap)
* * *
Shark Bay Prawn Fishery (trawling)
* * *
West Coast Demersal Scalefish (dropline and handline)
11.2 11.2 0.2
West Coast Demersal Gillnet and Longline Fishery (demersal gillnet and demersal longline)
* * * *
Total * 11.2* * 3.0 15.7* * 190.5–235.4* * 0.0–0.4* 2.3–25.9* * * 435.3–504.5 0.8–1.0
Multiple Use Zone Habitat Protection Zone Marine National Park ZoneNote: Estimates are based on 10-minute grids (medium accuracy) with a reference period of 2008–10 (Nickol Bay Prawn Fishery uses 2008–09), except for the Kimberly Prawn Fishery, which is based on stratified 60-minute grids (low–medium accuracy) with a reference period of 2000–10. Confidential data are marked with an asterisk (*). In some fisheries, only one area is confidential. In these cases, the total does not include the confidential data because it would be possible to back-calculate the displacement from that area. These are denoted by showing the sum of the non-confidential areas followed by an asterisk (e.g. 2.0*). The grand total at the bottom right includes all data and is not affected by confidentiality. Point and upper estimates have been provided for Kimberley Prawn Fishery. Fisheries that did not report activity in the final proposed marine reserves network or did not use methods excluded by the zoning are not included in the table, only reserves with displacement are presented.
136

Supplementary report: North-west Marine Region social and economic assessment—ABARES
Table S11 Updated summary information on flow of impacts, supply chains and demographics of communities for all towns identified under the final North-west Commonwealth Marine Reserves Network proposal
Data source Logbook State ABARES
Town Population geography GV
P d
isp
lace
d fi
nal
($
'000
max
)
Hom
e p
ort
Nu
mbe
r of
pot
enti
ally
im
pac
ted
inp
ut
busi
nes
ses
Nu
mbe
r of
pot
enti
ally
im
pac
ted
ou
tpu
t bu
sin
esse
s
Seaf
ood
pro
cess
ors*
Vu
lner
abil
ity
ind
ex
Fish
ing
ind
ust
ry
emp
loym
ent
(% o
f to
tal e
mp
loym
ent)
SEIF
A in
dex
of
rela
tive
dis
adva
nta
ge
Econ
omic
div
ersi
ty
ind
ex
AR
IA r
emot
enes
s in
dex
Med
ian
hou
seh
old
in
com
e ($
/wee
k)
Pop
ula
tion
Albany Albany (C) - Central 0.8 9 0.30 0.26 3 0.97 2 728 15 977
Brisbane Brisbane (statistical division) 2.7 6 1 0.00 0.13 7 0.91 0 1192 1 763 124
Brookes Inlet Manjimup (S) 0.0 0.39 0.14 3 0.51 2 792 9 255
Broome Broome (S) 114.0 2 0.48 2.00 2 0.88 3 1129 11 548
Cairns Cairns City Part A (statistical subdivision) 3.3 2 8 5 0.17 0.39 6 0.88 2 1050 122 736
Carnarvon Carnarvon (S) 0.9 5 1 2 6 0.47 4.23 2 0.53 3 858 5 284
Dampier Roebourne (S) 0.0 2 3 0.21 0.11 7 0.19 3 2010 1 367
Darwin Darwin City (statistical subdivision) 254.4 12 32 12 0.19 0.47 6 0.72 2 1277 66 289
Denham Shark Bay (S) 0.2 2 0.52 2.42 3 0.44 4 780 609
Derby Derby-West Kimberley (S) 0.3 1 0.54 0.21 1 0.56 4 881 6 506
Desperate Bay Carnamah (S) 0.0 0.43 0.00 5 0.24 3 874 747
Dongara Irwin (S) 0.0 1 3 2 1 0.33 4.98 5 0.42 2 869 3 054
Exmouth Exmouth (S) 0.3 1 0.29 6.24 6 0.82 4 1059 2 064
Fremantle Fremantle (C) - Inner 94.0 7 0.10 0.64 6 0.88 0 911 23 838
Geraldton Geraldton (C) 78.8 4 19 4 10 0.40 2.17 2 0.91 2 783 18 915
Hobart Greater Hobart (statistical subdivision) 0.1 1 0.20 0.59 5 0.88 1 884 200 516
Johns Creek Point Samson (UC/L) 1.2 1 0.22 0.11 7 0.19 3 2010 271
Kalbarri Northhampton (S) 7.6 3 1 1 0.55 2.50 3 0.31 3 659 3 209
Lakes Entrance E. Gippsland (S) - Bairnsdale 0.6 0.31 0.62 3 0.95 2 645 25 367
Nickol Bay Roebourne (S) 0.4 0.21 0.11 7 0.19 3 2010 16 421
Onslow Ashburton (S) 4.1 1 0.28 0.19 7 0.05 4 2143 6 079
Point Samson Point Samson (UC/L) 37.3 2 2 1 0.32 0.11 7 0.19 3 2010 271
Port Hedland Port Hedland (T) 12.7 0.28 0.06 5 0.26 3 1865 11 961
Two Rocks Gingin (S) 0.3 0.37 2.38 5 0.30 2 827 4 318
Wyndham Wyndham-East Kimberley (S) 0.8 0.45 0.20 1 0.56 3 1160 6 595
Survey Census
137

Supplementary report: North-west Marine Region social and economic assessment—ABARES
* = only available for WA towns; C = city; GVP = gross value of production; SEIFA =Socio-Economic Indexes For Area; S = shire; SSD = statistical subdivision; T = town Note: The 'traffic light' indicators for each measure follow the logic of green being a positive measure through to red being a negative measure. Indicators are based on a measures distribution within the group of localities. Australian Bureau of Statistics population statistics are available for a variety of geographies within the Australian Standard Geographical Classification (ASGC). To reflect the most appropriate representation of a community's population, different geographies have been used to calculate the GVP displaced per capita.Data source: Commonwealth and WA logbook data; Australian Bureau of Statistics 2006. GVP displacement applied in the vulnerability calculation is the maximum potentially displaced. The vulnerability index is calculated on the draft and final GVP scenarios for all impacted towns in the region. This global scaling approach enables comparison of ranked scores across the two GVP scenarios.
138